
Abstract
We evaluate the use of text-to-speech (TTS) technology for audio computer-assisted self-interviewing (ACASI). We use a quasi-experimental design, comparing the use of recorded human voice in the 2006–2010 National Survey of Family Growth with the use of TTS in the first year of the 2011–2013 survey, where the essential survey conditions are largely unchanged. We examine substantive distributions of ACASI items, item missing data rates, interviewer observations, and time stamps. We find no negative effect of the transition to TTS. We discuss the advantages of using TTS for ACASI.
Introduction and Background
Audio computer-assisted self-interviewing (audio-CASI or ACASI) has been an established method for asking sensitive questions in surveys for many years, since the first large-scale implementation in the National Survey of Family Growth (NSFG) in 1995 (see Mosher and Duffer 1995; Turner et al. 1998). This first field implementation of ACASI was run on disk-operating system (DOS)-based laptops and required a separate device to render the sound files (see O’Reilly et al. 1994). Since that time, while there have been big changes in the underlying technology, the process for generating the voice files has remained largely unchanged. Most surveys pre-record human voices reading the survey questions; these are then played using the survey software.
The process of creating and generating the sound files can be expensive and time consuming. This is especially true if a large number of fills are used (e.g., requiring the human talent to read each day, month, and year to permit generating customized dates such as “In the last year, that is since [month] [day] year, how often have you…”), or if changes are made to the instrument over the course of data collection. In the latter case, the original voice talent may no longer be available, and finding a matching voice for the new questions may be difficult or impossible. In general, repeated surveys, such as the National Survey of Drug Use and Health (NSDUH) or NSFG, may rerecord all or some of the questions with each new wave of data collection.
Since the early days of audio-CASI, great strides have been made in the automated generation of speech files (i.e., speech synthesis), using text-to-speech (TTS) technology. The quality of the synthesized speech has improved greatly over the early systems. The cost of such systems has come down dramatically (from tens of thousands of dollars in the early days to hundreds of dollars now). In addition, the modern TTS systems give the users much more control to ensure that complex words are pronounced correctly (using text-to-phoneme conversion), and provide flexibility in the type of voice (gender, race, etc.) that can be used along with other vocal characteristics such as pitch, speed, and the like (prosody). In other words, both the phonetic and prosodic characteristics of speech can be controlled in TTS systems.
Early research on TTS in an interactive voice response (IVR) survey administered by telephone suggested that respondents reacted equally well to TTS as to a recorded human voice. Couper et al. (2004) compared two different TTS systems of varying quality to recorded human speech and live interviewers. They found no differences between the three IVR versions in terms of the reporting of sensitive information or other data quality indicators. They concluded that this “suggests potential savings of time and money in the development of audio-CASI and IVR applications” (Couper et al. 2004:567). Since that time, little if any research has focused on the use of TTS in ACASI. A review of papers reporting the use of ACASI in surveys in the United States reveals that most still use recorded human voices (for an exception, see Lamb et al. 2011).
Given the rapid improvements in the quality of TTS technology and the reduction in costs, the time seemed ripe to explore the possibility of adopting TTS for ACASI in a large-scale field survey. We do so using a quasi-experimental design. The 2006–2010 continuous design of the NSFG (or cycle 7 1 ; see Lepkowski et al. 2013) used a recorded human voice for the ACASI section. After initial exploration of the feasibility and cost-effectiveness of TTS, we decided in conjunction with the sponsor to switch to TTS in the new round of the continuous NSFG, which began in fall 2011 (and still ongoing; we refer to this as cycle 8).
In this article, we report on the transition to TTS and explore possible effects both on data quality and on the interview process. In the sections that follow, we describe the process of evaluating and choosing TTS software and developing the sound files. We then evaluate several sources of data to explore possible differences, including the substantive distributions in selected variables between the two cycles, missing data rates, interviewer observations of the respondents’ use of ACASI, and time-stamp paradata.
Design and Analysis
We first describe the process of acquiring the TTS software and developing the voice files and then describe the data sources for our analyses.
Development of the Sound Files
We evaluated a variety of software products, including NaturalReader (http://www.naturalreaders.com), TextAloud (http://www.nextup.com), NeoSpeech (http://www.neospeech.com), and TextSpeechPro (www.digitalfuturesoft.com), and settled on TextSpeechPro. The basic software cost about $150 at the time and included two basic voices. Although all products offer high-quality solutions, the following factors were important in our decision to purchase TextSpeechPro: the availability of high-quality voices; the software is user-friendly and easy to learn and use; it has a variety of audio export options giving us control over the file size and format; and it permits the editing of files to correct pronunciation, which is helpful for technical terms and languages other than English.
In addition to the basic software, we purchased two enhanced voices from Neospeech (Julie for English and Violeta for Spanish) for an additional $700. Again, this was done to give us the best-quality voices.
While it is hard to compare the costs of recording and developing the sound files for human voice versus TTS, we estimate the cost to be about $1,200 of staff time to “record” the TTS files, compared to about $2,700 for recording a human voice in both English and Spanish. A total of 650 English audio files and 780 Spanish audio files were generated using TTS, and a similar number for the recorded human voice in C7. The cost of developing the audio files is not a large component of the overall costs for a large national survey, but there are efficiency advantages that come with the use of TTS. For example, it is easy to update and change questions using the same voice. Editing, deleting, or adding a question is very quick (less than 1 minute). The use of electronic voices creates consistency across questions with regard to volume, tone, pitch, and speed.
Data Sources
Turning to the data sources and analysis, the female and male instruments are not identical in the NSFG, so we examine them separately. There were a number of changes to the instrument between C7 and C8, but most of these were in the interviewer-administered (computer-assisted personal interviewing [CAPI]) part of the questionnaire. Sufficient ACASI items were identical across the two cycles, permitting direct comparison of these items.
We analyze data from the full four-year cycle 7 of NSFG (2006–2010). We have a total of 12,279 completed cases for females and 10,403 for males. For cycle 8, we examine the first year of data collection, with about 2,755 completed cases for females and 2,476 for males. In both cases, we restrict the analyses to those who completed the ACASI section, which is the last module of the survey. Full details of the 2006–2010 NSFG, including sample design and response rates, are found in Lepkowski et al. (2013). The data from cycle 8 (2011–2013) are still in preparation for public release.
Analyses
Given the potential benefits of switching from a recorded voice to TTS and the low risks associated with the switch, it was decided not to evaluate the two approaches experimentally. Rather, the decision was to monitor key quality indicators in the first few months of the new cycle and to make a decision about switching back if necessary. Given this, we adopted a quasi-experimental approach in the analyses that follow, examining key indicators of possible effects of the switch from a recorded voice to TTS in a pre–post design, with the essential survey conditions remaining largely unchanged.
In the following section, we examine various indicators of possible effects of the transition on the data collected in NSFG. We begin with an examination of substantive distributions of selected items in common across the two cycles and female and male instruments. We then examine indicators of data quality and process quality, including item-missing data rates, interviewer observations, and time stamps.
In all cases, we use unweighted analyses, as weights for C8 are not yet complete. The sample design for the two cycles is the same, and an analysis of demographic distributions suggests the samples are equivalent. Thus, any differences we find can be attributable to the effect of recorded voice versus ACASI rather than differences in demographic composition.
Results
Substantive Distributions
The first indicator we examine is a set of substantive differences between C7 and C8. Given that the data for C8 are not yet publicly released, we cannot compare means or proportions directly. Further, given that weights have not yet been developed for C8, we compare the unweighted estimates from the two cycles using odds ratios (C8/C7). We focus on 25 key variables in common between the female and male instruments that are asked of all or most of the ACASI respondents. In each case, we dichotomized each variable into an indicator, where 1 = the socially sensitive response, and 0 is the balance (e.g., 1 = used crack cocaine in the past 12 months, 0 = otherwise). Table 1 presents the odds ratios, 95% confidence intervals, and significance tests for these comparisons. An odds ratio greater than one indicates the reported estimate is higher for C8, while that below one indicates it is higher for C7. We group the variables into those involving risky behavior (sexual activity, drugs, and alcohol) and those asking about financial conditions (e.g., receipt of disability payments or food stamps). Our focus is less on the interpretation of individual effects than on the patterns of differences (if any) between recorded voice and TTS. Full question wording for the items is presented in the Appendix. Our concern is whether the TTS version may reduce reporting of sensitive information relative to the recorded voice.
Odds Ratios and 95% Confidence Intervals for Selected Variables from Cycle 8 versus Cycle 7.
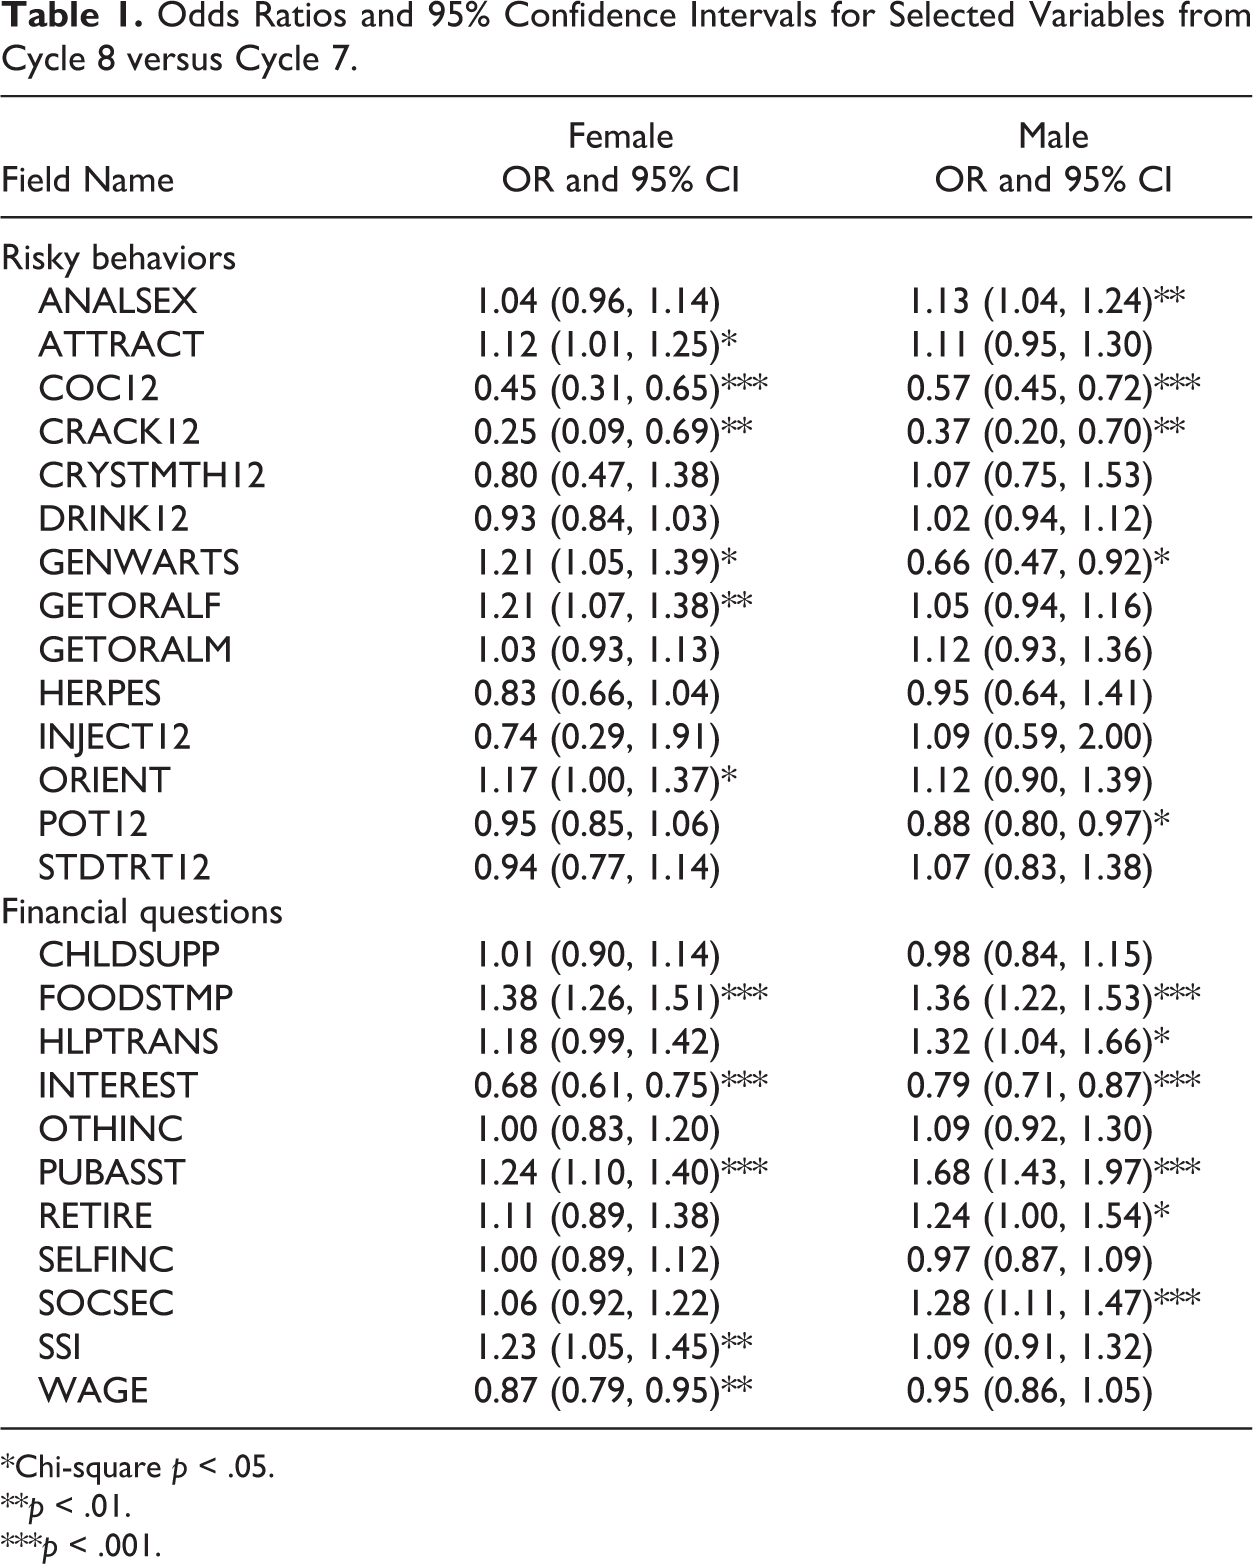
*Chi-square p < .05. **p < .01. ***p < .001.
Looking first at the risky behaviors, we find that 6 of the 14 odds ratios for females and 5 for males are significant at p < .05 or less. In some of these cases (cocaine and crack use for both females and males; marijuana and genital warts for males), the TTS version in C8 produced relatively lower reports of the sensitive behaviors; while in others (attraction to same sex, sexual orientation, receive oral sex, and genital warts for females; anal sex for males), the C8 estimates are relatively higher. We note that the odds ratios for very rare events (e.g., cocaine use) are likely to be volatile. Data from NSDUH (see Substance Abuse and Mental Health Services Administration 2003) reveal the levels of reported cocaine use among persons aged 12 and older of 1.0% in 2006, 0.8% in 2007, 0.7% in 2008 and 2009, 0.6% in 2010, 0.5% in 2011, and 0.6% in 2012), suggesting a possible decline in use between the C7 and C8 time periods. Thus, we see no evidence that TTS is systematically reducing the reporting of sensitive information in ACASI.
Turning to the financial questions, several of these are less sensitive (e.g., sources of income), although receipt of public assistance of various kinds may be viewed as sensitive. Here, we find that 5 of the 11 odds ratios for females and 6 for males are statistically significant (p < .05 or less), and the size of the ratios is somewhat larger than that for sensitive behaviors. In general, respondents are reporting higher rates of public assistance and lower rates of interest income and (for females) incomes from wages in C8 than C7. These can be explained by changes in the economy over this time period, with higher unemployment rates and greater reliance on public assistance in the latter period. In other words, we have no evidence that the use of TTS itself is changing the distributions of these variables.
Restricting these analyses to those who were reported to use both audio and text for the ACASI portion (see below) has little effect on these odds ratios. Similarly, restricting the sample to those with less than high school education (as a proxy for use of audio) does not change the conclusions drawn from the odds ratios in Table 1.
Item Missing Data
An indirect indicator of differences in data quality between the two CASI methods is the level of item missing data (refusals or “don’t know” responses) between the two data collection cycles. To examine this, we focused on the same set of 25 items used for the substantive comparisons. We created a ratio, with the numerator being the count of missing items and the denominator the count of eligible items (maximum of 25) of missing items on 25 of the variables. We examined the 26th variable (income) separately because of the high missing data rates for this variable. Given how rare item missing data is (aside from the income variable), we also dichotomized this distribution into a binary indicator, where 1 = any missing data and 0 = no missing data. These results are presented in Table 2.
Item Missing Data Rates, Percent with Any Missing, and Percent Missing Total Income.
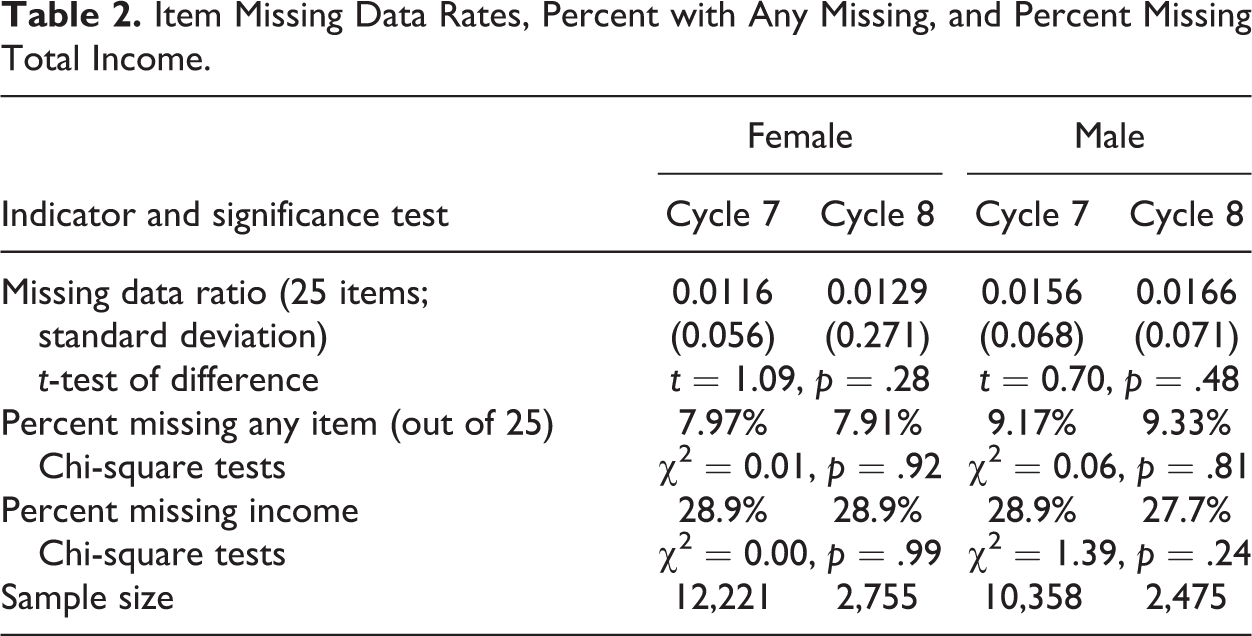
It is clear from Table 2 that the introduction of TTS did not increase the item missing data rate in ACASI. We find no significant differences in these rates between the two cycles.
Interview Observations
The observations completed by interviewers while the respondent is completing the ACASI section of the survey can provide information on the context of the interview and whether TTS has changed elements of ACASI administration.
Table 3 shows a selection of interview observations pertinent to ACASI and TTS. There are significant differences for several of the observation measures, all suggesting that the respondents made greater use of the audio component in C8 (using TTS) than in C7 (using recorded voices). For example, observed headphone use was significantly higher for both female and male respondents. Similarly, significantly more respondents were observed to be using both audio and text to complete the ACASI section, as intended by the design. Finally, respondents were reported to be more likely to complete the ACASI section with no assistance from the interviewer. Thus, any concerns that the use of computer-generated voices would discourage respondents from using ACASI appear to be unfounded. We added an observation in C8 on whether respondents made any comments about ACASI to pick up remarks on the TTS system. Very few respondents (1.9% of females and 1.5% of males) made any remarks, yielding insufficient data for detailed analysis. In summary, the interviewer observations reveal no negative effects of the switch to TTS.
Interviewer Observations for ACASI by Gender for Cycle 7 and Cycle 8.
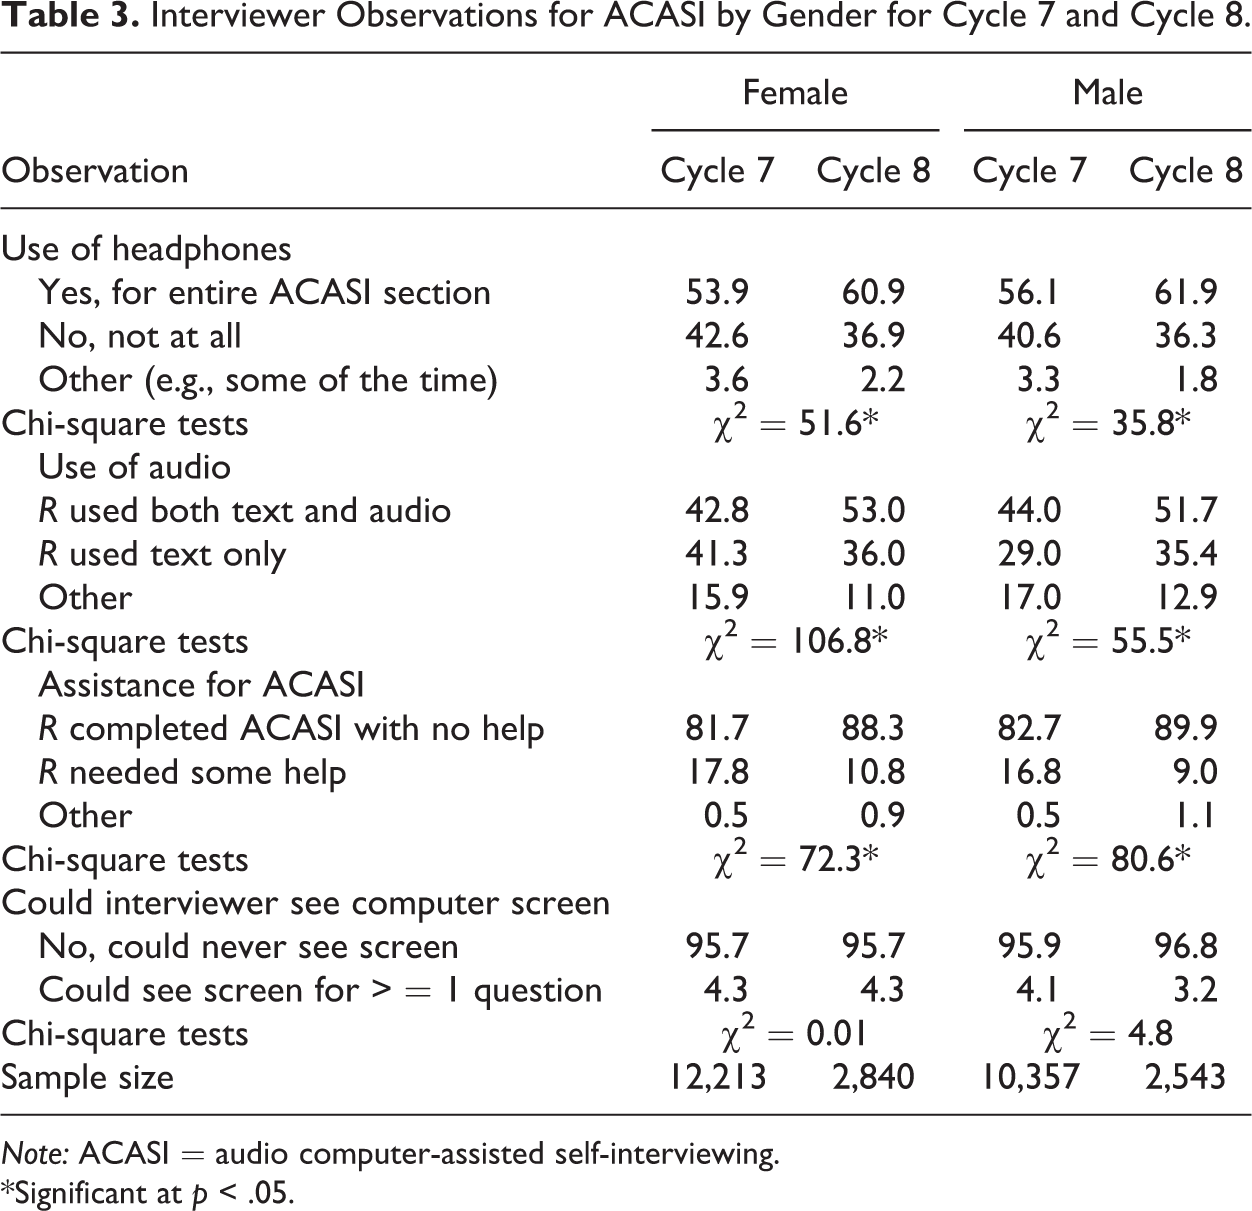
Note: ACASI = audio computer-assisted self-interviewing.
*Significant at p < .05.
Item Completion Times
Another source of indirect data on the effect of TTS on the response process comes from the item response times. These are captured automatically by the system. A distinction needs to be made between the time taken by the respondent to listen to (or read) and answer the question (“time on fields”) versus the system time to load the audio files into memory and generate the screen display (“time between fields”; see Couper et al. 2009). The former serves as an indirect indicator of the extent to which respondents are listening to the voice (vs. reading the text), while the latter is an indicator of overall processing efficiency or system response time. If respondents were making greater use of the audio, we should expect longer response times.
Before we examine the times for key items, we look into the relative sizes of the recorded and generated (TTS) audio files. Looking at the same set of items that are worded the same in C7 and C8, and in the female and male instruments, we find the average file size for the C7 audio files to be 841 KB, whereas that for C8 was 429 KB, about half the size on average.
Using Audacity software for editing sound files (http://audacity.sourceforge.net/), we measured the duration of each equivalent sound file in the two cycles. Across the same set of items, the average duration (playing time) is 14.14 seconds in C7 and 13.79 seconds in C8. Thus, while the TTS file sizes are only about half that of the recorded audio files, the duration of the files is very similar. So, we expect differences in the time between fields (the time to load the files and launch the next page), favoring TTS in C8. However, we do not expect differences in field times or response latencies (time to first key press, reflecting how long respondents are listening to the audio) due to technical reasons. In other words, any differences in field times should reflect respondent differences in the use of the audio part of ACASI. Given that the interviewer observations suggest more respondents are making more use of the audio in C8 than C7, we expect the average field times to be longer in C8.
As others have noted (e.g., Couper and Kreuter 2013; Yan and Tourangeau 2008), timing paradata are often messy. We had to remove a small number of outliers. We conducted sensitivity analyses of different cut-points for exclusion of cases, and these did not substantially affect the conclusions. We therefore excluded those cases with a score of three or more standard deviations above the mean on each timing measure. We also restricted the analysis to cases that were non-zero on the timing measures considered.
To compare the field times between C7 and C8, we again restricted the set of fields to those that were worded the same in the two cycles, asked of both males and females, and contained no fills that could vary the length of the question. We combined the two data sets and ran separate linear mixed models for females and males. We nested items within respondents to account for the inter-item variation in times. Our focus is on respondent-level variation between cycles. Key results from these models are presented in Table 4. 2
Selected Parameters from Linear Mixed Models of Field Times.

Note: Standard errors are given in parentheses.
***Significant at p < .0001.
All coefficients in Table 4 are significantly different from zero at p < .001. With regard to the total time to read and/or listen to and answer an item, respondents in C8 were almost 1 second (0.81) faster than those in C7. Interviews conducted in English are significantly faster (by about 5 seconds per item) than those conducted in Spanish. Interviews in which the interviewer observed the respondent using the headphones for all of ACASI (as a proxy for the use of audio) take significantly longer (by 0.31 seconds) than those in which headphones were not used throughout ACASI. Response latency times, which are a subset of the total field times, being the time to the first key press for each field, show similar patterns.
For between-field times, we see that C8 fields take marginally longer (0.12 seconds on average) to load. This is unexpected, given that the C8 file sizes are smaller by about half than those in C7. The effect of language (while still statistically significant) is small, with fields in English taking a little less time on average to load. The use of headphones has a negligible effect on the between-field times, as expected.
The timing results are a puzzle. From the interview observations in Table 3, we saw that more respondents in C8 are reported to be using headphones (i.e., listening to the audio). From the timing analyses in Table 4, we saw that those who use headphones take longer on average to answer each field. But, overall, the average time on a field is lower in C8 than C7. The slightly shorter duration (faster pace) of the C8 TTS files does not account for this difference. One possible explanation may be the slight differences in how the software (Blaise) is measuring time in the two cycles. Slightly different versions of the Blaise software were used in each cycle. The procedures Blaise uses to create the audit trail files may have changed. Different hardware used across the two cycles may have played a role as well. Nonetheless, we find no evidence of an increase in the length of the ACASI module with the introduction of TTS.
Discussion and Conclusions
We find no evidence of any negative impact of TTS on the ACASI module. The substantive distributions show no clear trends (other than where secular changes have occurred). Missing data rates are unaffected by the switch from recorded human voice to TTS. We have no reports of negative experiences of TTS by respondents, who seemed largely indifferent to the use of computer-generated voices. We find slightly higher reports of audio use (based on interviewer observations), but no evidence that this increases interview length. While we remind ourselves that “absence of evidence is not evidence of absence” (Sagan 1995:213), all indications are that the transition to TTS was a smooth one and had no notable effects on the data collection process or the resulting data. We continue to monitor the effects in ongoing data collection for C8 of NSFG.
Given the success of TTS, we recommend its use for ACASI. The software is relatively inexpensive. Less time and effort is required for the “recording” and editing of the sound files. It is significantly easier to replace or update questions and make other modifications to the audio files without producing odd disjunctions (changes of pitch, tone, or even voice) in the questions. Although the development of the audio files is not a big expense relative to field costs in large national surveys using ACASI, the use of TTS is more efficient.
The switch to TTS also opens up opportunities for methodological or substantive research. For example, NSFG (like many other surveys using ACASI) chose to use a female voice for both female and male respondents, which provided consistency with the gender of the CAPI interviewer and is consistent with the literature finding few effects of gender on reporting of sensitive information (e.g., Couper et al. 2004; Fahrney et al. 2010; Mayo et al. 2010; Oloo et al. 2012; Price et al. 2010; Tourangeau et al. 2003). Nonetheless, with TTS, it is possible to record both female and male voices at a small additional cost. Other attributes of the voice (e.g., race/accent, age, speed, etc.) could also be altered, if desired.
Given the widespread use of ACASI, finding an effective alternative to recorded human voices brings operational efficiencies and opens up methodological opportunities and design options for researchers. Our experience in the NSFG suggests that TTS systems are sufficiently developed to serve as that alternative.
Footnotes
Appendix
Acknowledgment
We thank Haley Gu for the help with analysis and William D. Mosher for the helpful comments on an earlier draft.
Authors’ Note
The NSFG is carried out under a contract with the CDC’s National Center for Health Statistics, Contract # 200-2000-070012006 (for 2006–2010) and Contract # 200-2010-33976 (for 2010–2020).
Declaration of Conflicting Interests
The author(s) declared no potential conflicts of interest with respect to the research, authorship, and/or publication of this article.
Funding
The author(s) received no financial support for the research, authorship, and/or publication of this article.