
Abstract
A new free-list measure of cognitive salience, B′, is presented, which includes both list position and list frequency. It surpasses other extant measures by being normed to vary between a maximum of 1 and a minimum of 0, thereby making it useful for comparisons irrespective of list length or number of respondents. An illustration of its properties, uses, and computation is provided with the aid of examples drawn from free lists of foods elicited from a sample of migrants from the Republic of the Marshall Islands.
Introduction
The use of free listing tasks to elicit cognitive and ethnosemantic data from various cultural and lexical domains has long been reported (e.g., Bernard 2006:301–05; Brewer 1995; Weller and Romney 1988). One significant measure derived from free lists is cognitive salience or the level of typicality, familiarity, or representativeness accorded to the terms comprising cultural domains. The measure of cognitive salience in free listing tasks is usually based on list position (Brewer 1994; Hammel 1984; Hammel and Yarbrough 1974). The closer to the first position (or rank) the item(s) are, the greater the salience of the item(s) is deemed to be. If Z, the number of respondent lists, is >1, then list frequency or the number of lists the item(s) appears in is often included in the measure (Sutrop 2001).
In previous publications (Nolan 2001; Nolan and Robbins 2001; Nolan et al. 2006; Robbins and Nolan 1997, 2000), we introduced and applied B, a measure of cognitive salience, where

And, where k is the number of listed items, n is the number of items of a designated, similar kind or category (e.g., “females, “liked” items), (k − n) is the number of other items, and ∑r(n) is the sum of the free-list-ordered ranks of the designated category of items. B determines the mean proportion of other items (k − n), the designated category of item(s) (n) precedes in a list. It should be noted that in these previous publications, the symbol
If n = 1, then the cognitive salience of any single item in a respondent’s list can be simplified and reformulated more concisely as

And, r(i) is the ith rank of each item’s listed position and i = 1, 2,…, k.
If Z, the number of respondents, is >1, then B can be transformed from a single respondent’s list to B′, which includes list frequency by summing B across those respondent lists that contain a particular item and then adding F, the number of lists in which the term is mentioned to measure the overall sample or group cognitive salience as

And, F ≥ 1, since a term must be mentioned on at least one list to be included. In effect, equation (3) weights the ∑B values for an item by F, the number of respondent lists in which it appears. Furthermore, it is easy to see that in cases where Z = 1, then B = B′. B′ is thus the more general measure and will constitute “the improved measure of B.” B′ has the desirable property that 0 ≤ B′ ≤ 1, which makes it appealing as a measure of cognitive salience and which sets it apart from other similar, extant measures. B′ is normed to vary between a maximum upper limit of 1, when
Examples
We now turn to some examples to help illustrate the computation of B′, its properties, and uses. These data were collected from a sample of 34 Marshall Islanders (15 males and 19 females) residing in Northwest Arkansas. Ranging in age from 18 to 80 years (mean age 37 years), they form part of a larger investigation of the food acculturation and personal adjustment of migrants now living in and around Springdale, Arkansas. Free lists from each respondent were elicited by the prompt: “Name all of the traditional Marshallese foods you can think of.” A total of 124 food items were mentioned. The mean list length is 11.47 terms per respondent (see Table 1).
Marshallese Food List Example.a
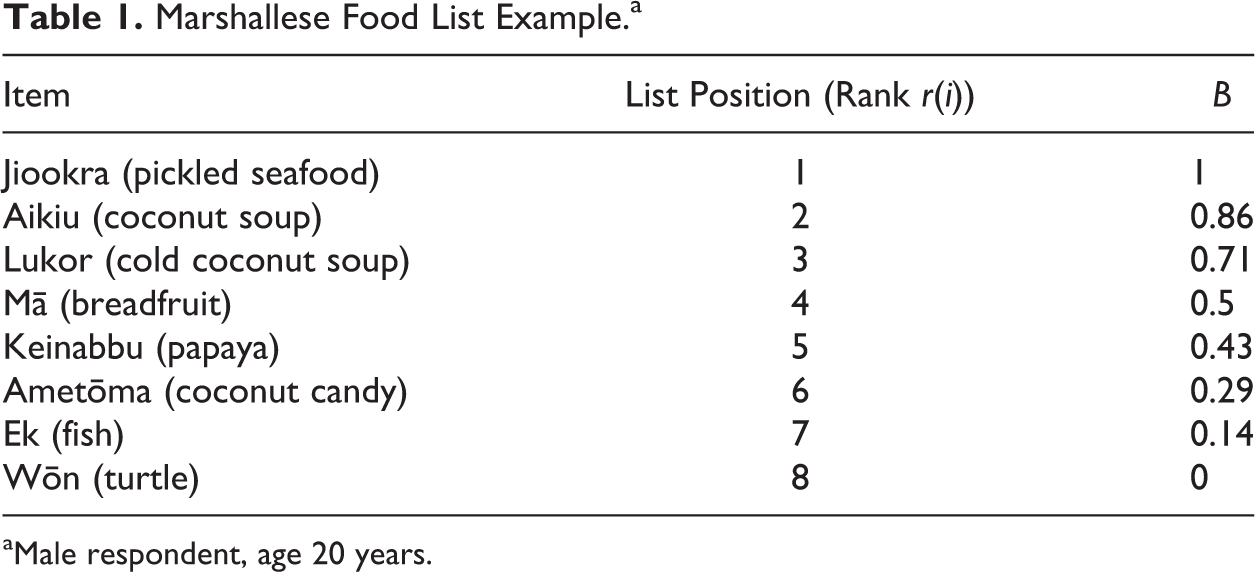
aMale respondent, age 20 years.
To illustrate the computation of B and its properties, we will use the data in Table 1. The table contains the free listing of traditional Marshallese food menu items by one respondent. The list positions or ranks, and salience measures B, using equation (2) for each item is also provided. An example computation of B for a single food item is given below:

This B value (× 100) means “papaya” precedes 43% of the other items in this respondent’s list.
To calculate B′, or the salience of each food item for the total sample (Z = 34), we simply sum all the B and F values and plug them into equation (3). Table 2 displays the B′ values for the 10 most salient Marshallese food items.
B′ Values for the 10 Most Salient Marshallese Food Items.
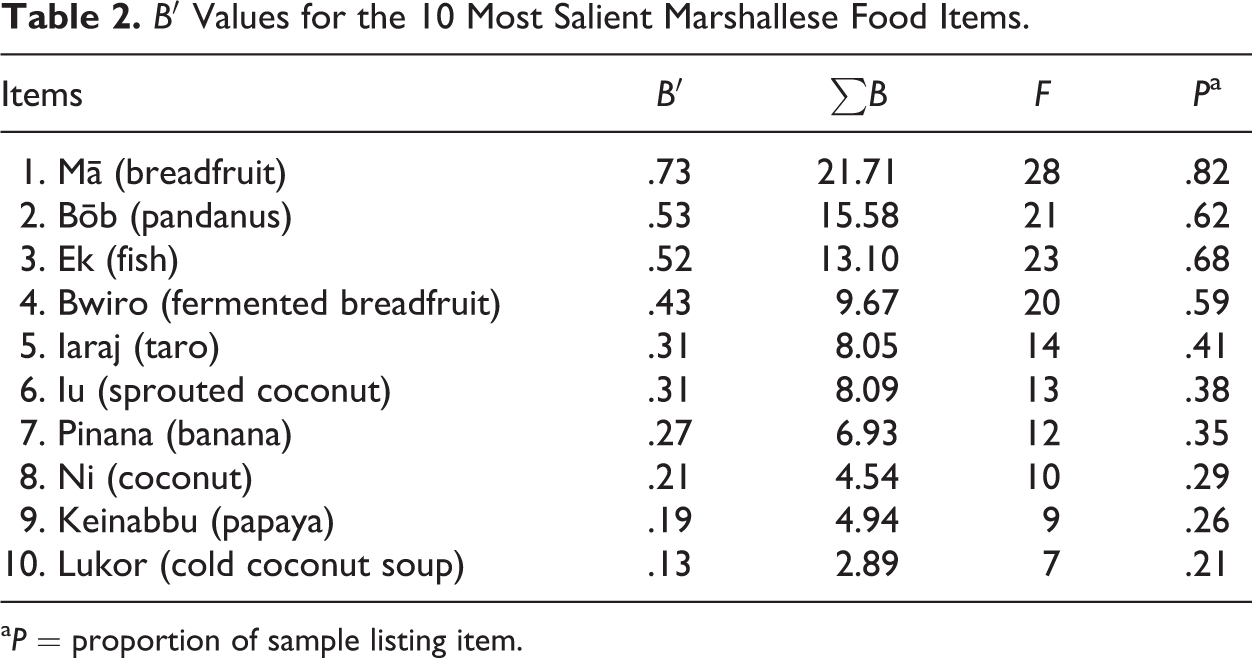
a P = proportion of sample listing item.
An example computation of B′ for one term using values from Table 2 is provided below:

These examples illustrate how B′, a measure that combines list position and list frequency, can be used to assess the cognitive salience of free listed single items for samples when N > 1.
The 10 foods listed here as being most salient are all found in Micronesia today, just as they have been for centuries. Nine of the 10 are native land plants or plant-based foods, which Carucci (1997) associates with the female and the core. As in many Pacific societies, Marshallese people consider their staple starches the “real food” (Pollock 1992). Fish, the odd animal to appear in the top 10 most frequently listed foods, is important as a traditional accompaniment, adding flavor and protein. Coconut is another traditional accompaniment to the starches, providing flavor and fat to traditional meals. The results strongly reflect the pre-European contact of Marshallese food culture, suggesting both national pride and a high level of resiliency in the domain of foodways. This is surprising, given the complicated history of the Republic of the Marshall Islands, contemporary challenges facing Marshallese people residing in Springdale, and the fact that other Marshallese knowledge domains have eroded considerably over the years.
It follows that to preserve traditional knowledge and Marshallese culture, in addition to improving the quality of the typical Marshallese–American diet, traditional plants such as breadfruit and pandanus must be protected. Unfortunately, radiation (Ellis 1986), pollution, urbanization, weeds that have been introduced (Thaman 2006), and sea level rise (Davis 2014) are all threatening native vegetation in the Republic of the Marshall Islands, and the climate of Springdale does not allow tropical plants to be grown naturally here.
While many populations, and/or segments thereof, have acculturated and modernized outwardly in terms of adopting new material and behavioral lifestyles, not all have changed their ideational culture. Instead, their values, preferences, and cognitive styles, among other things, may persist and remain quite traditional. Traditional Marshallese food concepts, as reported here, certainly provide some evidence of this and are being explored currently in more detail.
Discussion and Conclusion
Perhaps because in our original paper (Robbins and Nolan 1997), we initially labeled B a measure of “category bias” or salience and exemplified it with a category of items n > 1, it may have escaped notice as a measure of the cognitive salience of any single free listed item. It may also have been overlooked as a measure of cognitive salience because it only assesses list position not list frequency. For example, Thompson and Juan (2006:400) in their comparative study of cognitive salience deploy only two measures of salience: Smith and Borgatti’s (1997) measure S and Sutrop’s (2001) S.
An important goal of this article, therefore, has been to enhance the visibility of the value of our measure—the improved B′, which does include a measure of list item frequency—and to show how and why it is the superior measure of salience in free-list analysis. The aforementioned desirable, normed property provides a standard for comparing the other two measures with B′. Smith’s S can be shown to fail because, as Sutrop demonstrates, Smith and Borgatti’s S does not remain invariant when respondent list lengths (L) vary. This is because its minimum is not 0, but instead, the reciprocal of list length (1/L). This limits its value for comparative purposes, especially if the list lengths being assessed are unequal in length and relatively short. On the other hand, notably, Sutrop’s (2001:270) single list-salience measure, like B, satisfactorily measures the proportion of items in a list that are preceded by a designated item. Both measures produce equivalent results. Sutrop’s measure (SM) is basically the same as our measure B, when n = 1. If L = list length, then L = k. And if mP = r(i), then SM can be transformed into equation (2)

Accordingly, both possess the desirable property of ranging from 1 to 0, therefore remaining invariant despite differences in list length.
Unfortunately, Sutrop’s S measure of cognitive salience (S = F/(NmP), where F is the term’s frequency, mP is the list salience measure or mean position, and N is the number of respondents or lists), which is supposed to account for both mean position and term list frequency, is itself flawed. It does not vary between a maximum of 1 and a minimum of 0. Instead, it varies between a maximum of 1 and an undefined quantity. This is because it involves the inadmissible algebraic operation of dividing an integer by 0. This is acutely consequential when the mean position of a term (mP) is 0. Sutrop’s S cannot, accordingly, differentiate between a case where NmP = 0 and F = 1 and a case where NmP = 0 and F > 1. In other words, Sutrop’s S cannot distinguish between cases where a term may be listed last but by only one respondent and a case where the term is listed last by all respondents. S, therefore, fails to meet its purported goal of providing a combined normed measure of both term list position and term list frequency. Table 3 helps illustrate this. Consider three cases where the same single term is always listed last. In the first case, only one of the three respondents (R1) lists the term last. In the second case, two of the three respondents (R1 and R2) list the term last. And in the last case, all three respondents list the term last, yet Sutrop’s S does not distinguish among them. Instead, it assigns a 0 to each one’s cognitive salience score despite the difference in F, the frequency of mention. Note also that B′ does not suffer this same fate. For the above reasons, we argue that B′ is to be preferred as the most general measure of cognitive salience in future free-list assessments in cultural domain analyses.
Comparison of Sutrop’s S and B′.
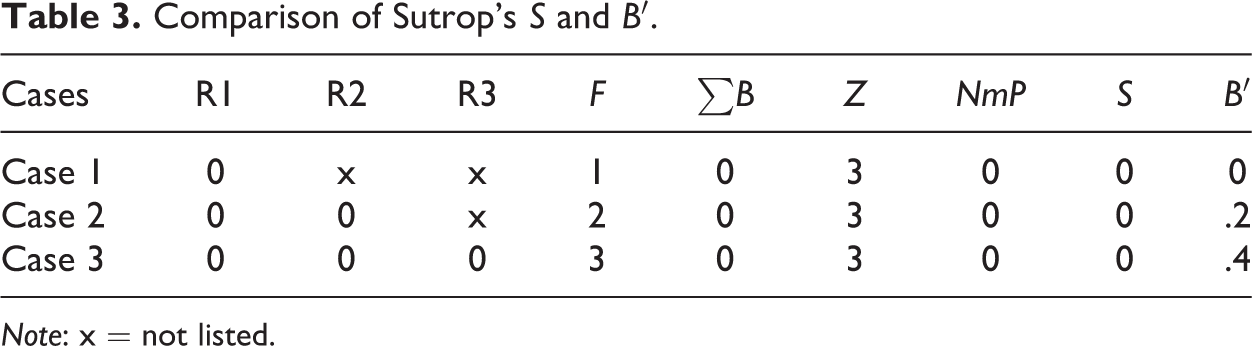
Note: x = not listed.
In closing, it seems worth reflecting on the relationship between list position (indicated by ∑B) and frequency of mention (indicated by F), since they jointly determine cognitive salience (indicated by B′). Indeed, these are the two possible routes to a particular B′ salience score (being mentioned early/late in lists or being mentioned frequently/rarely). It might be argued that, if highly correlated, either one could serve as a proxy for the other and could be used separately to assess cognitive salience, with no need to combine them. In fact, the correlation between ∑B and F, using the measures in Table 2 for the 10 most salient Marshallese food items, is r = .95, and their correlation overall, for the total sample of 124 items, is r = .97. However, if the sample is disaggregated and inspected further, it turns out that, in general, these correlations are misleading.
The correlation between F and ∑B, for example, in the next 10 most salient items is r = −.41. Moreover, the correlation between them, for items above the median in B′ scores, is r = .97, but this drops to only r = .04 for items below the median in B′ scores. Further, 67 of the 124 items occur with a frequency of mention of exactly one. Yet, within this group, the ∑B scores (actually B scores since F = 1) range from 1 to 0, with a mean ∑B = .37 (SD = .27 and coefficient of relative variation = .73). This also shows considerable variability in list position just within this set of single mentions. Viewed in concert, these results imply that, with the possible exception of the most salient items, the relationship between frequency of mention and list position is at best inconsistent. This, in turn, motivates the proposition that (pending further tests with other data sets and domains) if one is only interested in identifying the most salient listed items, then either measure alone suffices. However, if the relative cognitive salience of all items is of concern, then both frequency of mention and list position should be assessed, as it is using B′.
Footnotes
Acknowledgments
The authors would like to thank Annette K. Robbins for assistance in the preparation of this article. Diana Chen would also like to extend heartfelt thanks to the Marshallese community of Northwest Arkansas for their friendship and support. In addition, she thanks all those who helped with the Marshallese–English translations that made this article possible, including Ms. Carmen Chong Gum, Mr. Benetick Maddison, and Mr. Albious Latior. We are especially grateful to the reviewers for their many helpful comments and constructive criticisms. They contributed substantially to a much improved article.
Declaration of Conflicting Interests
The author(s) declared no potential conflicts of interest with respect to the research, authorship, and/or publication of this article.
Funding
The author(s) received no financial support for the research, authorship, and/or publication of this article.