
Abstract
The article examines two important aspects of data quality in self-completion surveys of young people, taking advantage of a unique data source: Understanding Society: the United Kingdom Household Longitudinal Study. Young persons aged 10–15 are asked to complete a self-administered paper questionnaire at annual intervals. The number of completed interviews varies over waves from 4,049 to 5,020. Data are also collected from parents, providing important explanatory covariates for our analysis. Stronger parent–child relationship and higher mother’s involvement in education were associated with lower item nonresponse rate and lower inconsistency throughout waves. We also found some evidence for a negative panel conditioning effect with an increase of social desirability bias and measurement errors in the subsequent waves. There was a higher level of inconsistent responses and a higher probability of social desirability bias throughout waves in more sensitive items.
Based on the children’s intellectual development scheme proposed by Piaget (1929), researchers suggest that starting from age 10 or 11, children can answer self-administered standardized questionnaires; however, even children aged eight–nine years old can complete self-administered questionnaires with a sufficient level of validity and reliability (Amato and Ochiltree 1997; Borgers et al. 2000, 2003, 2004; Mavletova 2015a, 2015b; Scott 2008; Varni et al. 2007). Studies of different indicators of data quality such as construct validity (Varni et al. 2007), internal consistency (Borgers et al. 2000; Varni et al. 2007), and test–retest reliability (Vaillancourt 1977) have found that data quality increases with age. Similarly, item nonresponse rates (INR; Borgers et al. 2000; Haunberger 2014), number of don’t know responses (Amato and Ochiltree 1997; Vogl 2012), and response order effect (Fuchs 2005) have been found to decrease with age.
Since there is a growing interest in children’s well-being, victimization, bullying, and risky behaviors, children are included as respondents in a number of repeated cross-sectional studies (e.g., the British Crime Survey or the National Crime Victimization Survey) and cohort panels (e.g., the Longitudinal Study of Young People in England, the National Child Development Study, or the National Longitudinal Survey of Youth). In Europe, there are also plans to start an ambitious new longitudinal survey of children and young people (Goswami et al. 2016; Pollock et al, 2018). In 1994, the British Household Panel Survey (BHPS) was the first European household panel to ask household members aged 11–15 to complete the survey. In 2010–2011, the BHPS participants joined a larger panel, Understanding Society: the United Kingdom Household Longitudinal Study (UKHLS; see https://www.understandingsociety.ac.uk). The panel also continued to collect data from youth in the sample while extending the age range to 10–15. Every household member within this age range is asked to complete a self-administered paper questionnaire.
Although there are several articles about data quality among children and adolescents in both cross-sectional surveys (see Amato and Ochiltree 1997; Beebe et al. 1998; Fuchs 2005; König 2011; Mavletova 2015b; Varni et al. 2007; Vogl 2012, 2013) and longitudinal surveys (Borgers et al. 2003, 2004; Fendrich and Kim 2001; Fendrich and Rosenbaum 2003; Halpern-Manners et al. 2014; Haunberger 2014; Mavletova 2015a; K. Smith and Platt 2013; Vaillancourt 1977), to our knowledge, none of the studies measured data quality in household panel studies among youth. Using data from a household panel survey that includes a youth self-completion component allows us to take advantage of the rich structure of the data to better explain variations in the quality of the youth data, using parental- and household-level information as covariates (variables such as household income, maternal education, parental involvement in their children’s education, and parent–child relationships). Furthermore, the large sample size of UKHLS allows us to identify age effects in terms of differences between single-year cohorts, while relatively high wave-on-wave response rates provide good sample sizes for studying panel conditioning effects. We develop hypotheses regarding the correlates and nature of data quality in the youth survey data and test them using two indicators of data quality: INR and panel conditioning.
Literature Review and Hypotheses
Tourangeau et al. (2004) proposed a model of the survey response process with four components: comprehension of the question, retrieval of relevant information, making judgments based on retrieved information, and mapping judgments into a response category. Each of the components can be a source of measurement error. For instance, respondents can have difficulty understanding the question or some terms or difficulty in recalling some events, they may not have an opinion on some attitude questions, or they may not be willing to respond truthfully on some sensitive questions. This model can be applied to both adults and adolescents.
Some researchers found that giving “don’t know” responses may be socially undesirable for children. They tend to either skip the question or give an answer rather than explicitly state they don’t know (Haunberger 2014; König 2011; Scott 2008). Although in some waves up to 20% of the questions in the UKHLS youth questionnaire offered an explicit don’t know response category, only one question (in the second wave) actually produced any don’t know responses. As a result, we will focus on the analysis of INR.
INR in surveys of children has been found to be explained more by characteristics of the children than by characteristics of the question (Borgers and Hox 2001) and due to difficulties that children have in retrieval of relevant information or due to lack of knowledge or opinion (Vogl 2012). Age and academic achievements explain differences in INR between children (Borgers et al. 2000; Haunberger 2014; Mavletova 2015b; Yi and Lee 2016). In addition, children from families with a higher social status produce lower INR (Yi and Lee 2016). A higher number of response options induce higher INR, while knowledge questions and the length of the introductory text in the question reduce INR (Borgers and Hox 2001). A higher INR was found to be at the end rather than at the beginning of the questionnaire (Borgers and Hox 2001) and in open-ended rather than closed questions (K. Smith and Platt 2013).
However, little is known about how children’s INR is related to household or parental characteristics. This may be partly because surveys of children often do not collect rich data about the household context. But for surveys of children that are carried out in the home environment, and therefore typically require the cooperation and permission of a parent, knowledge of the role of household characteristics could help researchers to identify ways to improve data quality in surveys of children. Taking into consideration survey data we have from the parental questionnaires, we examine how INR is associated with relevant covariates such as household income, maternal education, maternal attitudes toward child’s education, parental involvement in their children’s education, and parent–child relationships. These covariates are particularly relevant as previous studies have shown them to be associated with the academic achievements of children, which, in turn, may be associated with the quality of survey data provided.
The influence on children’s academic achievements has been shown for parental education (Haveman and Wolfe 1995), household income (Dahl and Lochner 2012; White 1982), parental attitudes toward education (Davis-Kean 2005; Seginer 1983), parental involvement in education, and the quality of parent–child relationship (Davis-Kean 2005). The literature is not consistent on whether maternal or paternal education is more important for a different number of cognitive abilities and behavioral outcomes of a child; however, maternal education and maternal expectations usually have a consistently strong effect on a wide range of a child’s outcomes as mothers typically provide the main care for a child since his or her birth (Chevalier et al. 2013).
Another aspect of data quality that is crucial for panel surveys is panel conditioning. Panel conditioning occurs when the act of participating in the survey influences the responses given by respondents at later waves. This can occur either because survey participation changes respondents’ attitudes and behaviors or because it changes the way they answer questions (Lynn 2009; Sturgis et al. 2009; Warren and Halpern-Manners 2012). A number of researchers emphasize a lack of theoretical foundation in the literature of the conditions under which panel conditioning can or cannot occur (Cantor 2008; Warren and Halpern-Manners 2012).
Some researchers found changes in attitudes or behavior as a result of survey participation (e.g., Bartels 1999; Clausen 1968; Crossley et al. 2017; Kraut and McConahay 1973; Spangenberg and Obermiller 1996). The changes are likely to happen when survey participation stimulate individuals to think more about the topic and provide some knowledge about the issue (Sturgis et al. 2009) or motivate them to engage in the behavior (Warren and Halpern-Manners 2012). However, many researchers found no such effect (e.g., Corder and Horvitz 1989; Mann 2005; J. K. Smith et al. 2003; Toepoel et al. 2009). The possible explanation for no panel conditioning effect is that either the issue is seen as unimportant for respondents or, on the contrary, the issue is seen as highly important, which means that respondents have formed crystallized attitudes (Bridge et al. 1977).
The second type of panel conditioning—changes in survey response behavior—can be either positive or negative in the sense that it may either increase or decrease measurement error in later waves. Several studies showed positive panel conditioning among adults, when respondents provide data of higher quality at later waves as indicated, for example, by lower INR, less severe rounding, and higher reliability in subsequent waves (Rendtel et al. 2004; Schräpler 2003; Sturgis et al. 2009; Waterton and Lievesley 1989). These changes appear to be due to increased understanding of the survey process and response tasks. An alternative reason for respondents to provide more accurate responses across waves is that their trust in the survey organization (and possibly the interviewer) may increase (Fisher 2016; Halpern-Manners et al. 2017).
Panel conditioning can also produce an increase over waves in measurement error. This is associated with the third and fourth components of the response process, making judgments based on retrieved information and mapping the judgment to a response category. Such negative conditioning can arise either because respondents become less willing to respond truthfully (for social desirability or other reasons) or because they become less willing to put adequate effort into responding (or learn how to reduce their effort; e.g., Bailar 1989; Cantor 1989; Cohen and Burt 1985; Duan et al. 2007; Warren and Halpern-Manners 2012).
There is some evidence of a higher social desirability bias in responses in subsequent waves among adolescents while answering sensitive questions on illicit behaviors. Fendrich and Kim (2001) found lower level of reporting of lifetime marijuana and cocaine use in 1988, 1992, and 1994 compared to 1984 in the National Longitudinal Survey of Youth. About 40% of participants denied lifetime cocaine use in one of the following waves. Black and married respondents had higher probability of denying. Similar results were found by Fendrich and Rosenbaum (2003) as well as by Torche et al. (2012).
In line with these studies, we expect a negative panel conditioning effect in terms of increasing social desirability bias—a lower level of reporting of sensitive behaviors and inconsistency in reporting lifetime smoking and alcohol consumption throughout waves. We also suggest that this effect would be stronger among children who live in households with lower socioeconomic status, lower parental involvement in the education, lower expectations, and a less close parent–child relationship.
We also test whether there is a panel conditioning effect in terms of increasing or decreasing measurement error defined as correlations between residual variances of latent constructs throughout waves. According to the literature, there can be a positive conditioning effect when respondents better understand the questions and survey process and are motivated to invest some physical and cognitive efforts to provide more accurate responses. Alternatively, there might be a negative panel conditioning effect if respondents learn to minimize their effort while answering survey questions. Since previous results showed that both increasing and decreasing measurement error can occur as a result of panel conditioning, we test two alternative hypotheses.
Data
The UKHLS is a multipurpose longitudinal study based on a sample of around 100,000 individuals representing the UK population. It provides a major data resource for research in the social sciences (Buck and McFall 2012). The sample includes a representative sample of the UK population in 2009, an ethnic minority boost, and the BHPS sample. Our analysis uses data from four waves of the study: the first wave was conducted in 2009–2010, the second in 2010–2011, the third in 2011–2012, and the fourth in 2012–2013. At each wave, every child within the age range 10–15 is asked to complete a paper self-completion questionnaire. The youth questionnaire self-completion rate was 74–75% in participating households in all four waves. There were 4,899 completed interviews in the first wave, 5,020 in the second wave, 4,427 in the third wave, and 4,049 in the fourth wave. In each wave, about 50% of youth respondents were boys and the average age of the respondents was about 12.5 years in all waves (see Table 1 in Online Appendix, unweighted statistics).
Predicting Item Nonresponse Rates: Ordinary Least Squares Regression Coefficients.
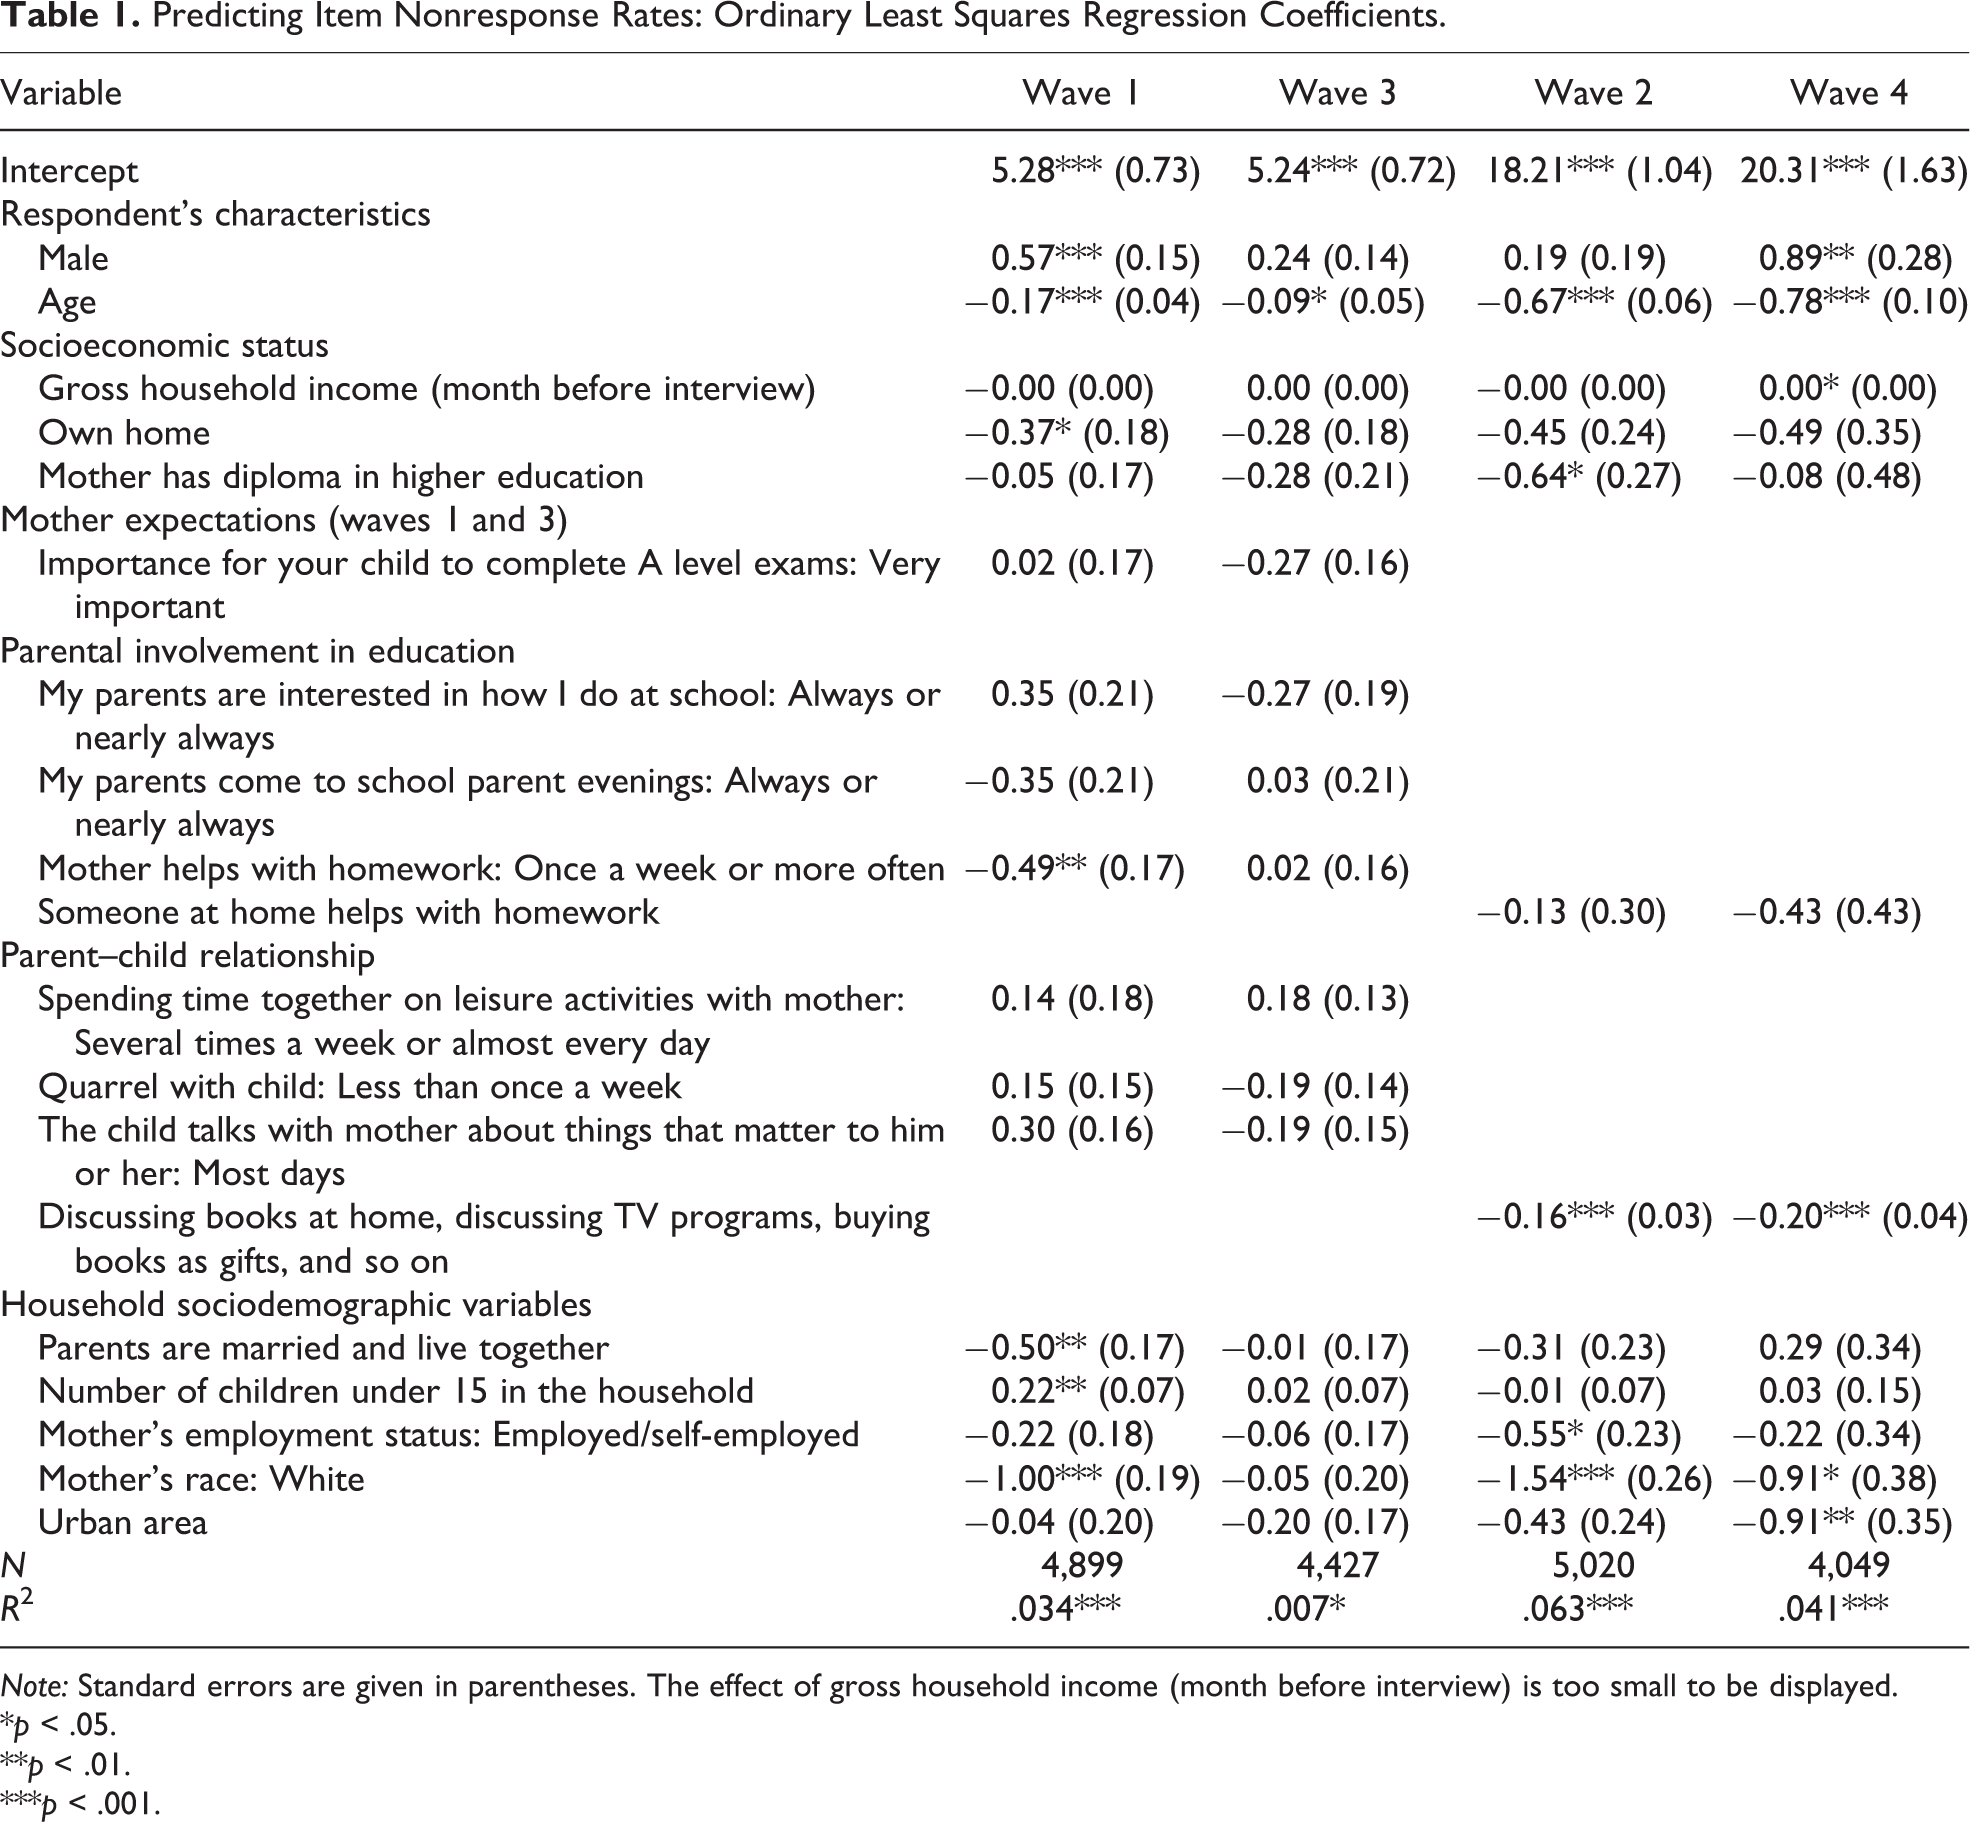
Note: Standard errors are given in parentheses. The effect of gross household income (month before interview) is too small to be displayed.
*p < .05.
**p < .01.
***p < .001.
Questionnaires
The total number of items varied from 88 to 104 in different waves (see “Questionnaires” section and Table 2 in Online Appendix for more details). Some questions were included in each wave, while some were asked biennially. The questionnaires in the second and fourth waves were more cognitively demanding than the questionnaires in the first and third waves as they had more open-ended and sensitive items.
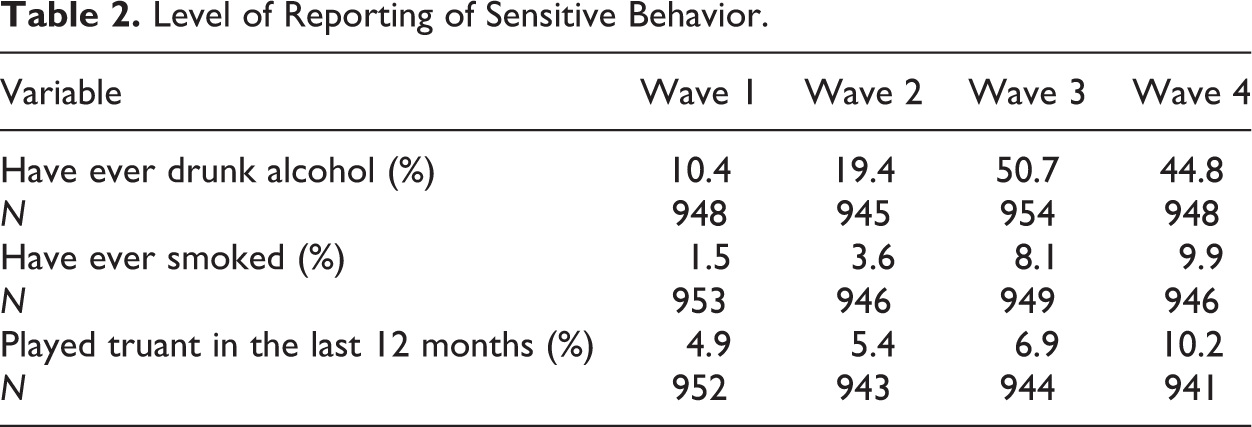
Level of Reporting of Sensitive Behavior.
Procedures and Measures
We measured data quality based on the following indicators (see Procedures and Measures section in Online Appendix for more details):
The overall INR.
We conducted a multiple linear regression with pairwise deletion to predict the overall INR in each wave. We included such predictors as mother’s expectations, parent–child relationship reported by mother, sociodemographic variables, and some household variables.
Panel conditioning effect.
There are two indicators: Social desirability bias: – Inconsistency: The analysis of such items as ever having drunk alcohol and ever having ever smoked. We ran multiple logistic regressions to predict inconsistent responses for each of the two questions separately. We included only those respondents who completed at least two waves of the study. – Level of reporting of sensitive behavior: The analysis of such items as ever having drunk alcohol, ever having smoked, or playing truant in the last 12 months. – To measure an increase in social desirability bias in the subsequent waves, we ran mixed-effects logit regressions. To disentangle panel conditioning effect from the attrition, we included only those who completed all four waves (balanced panel analysis, N = 960). Correlations between residual variances.
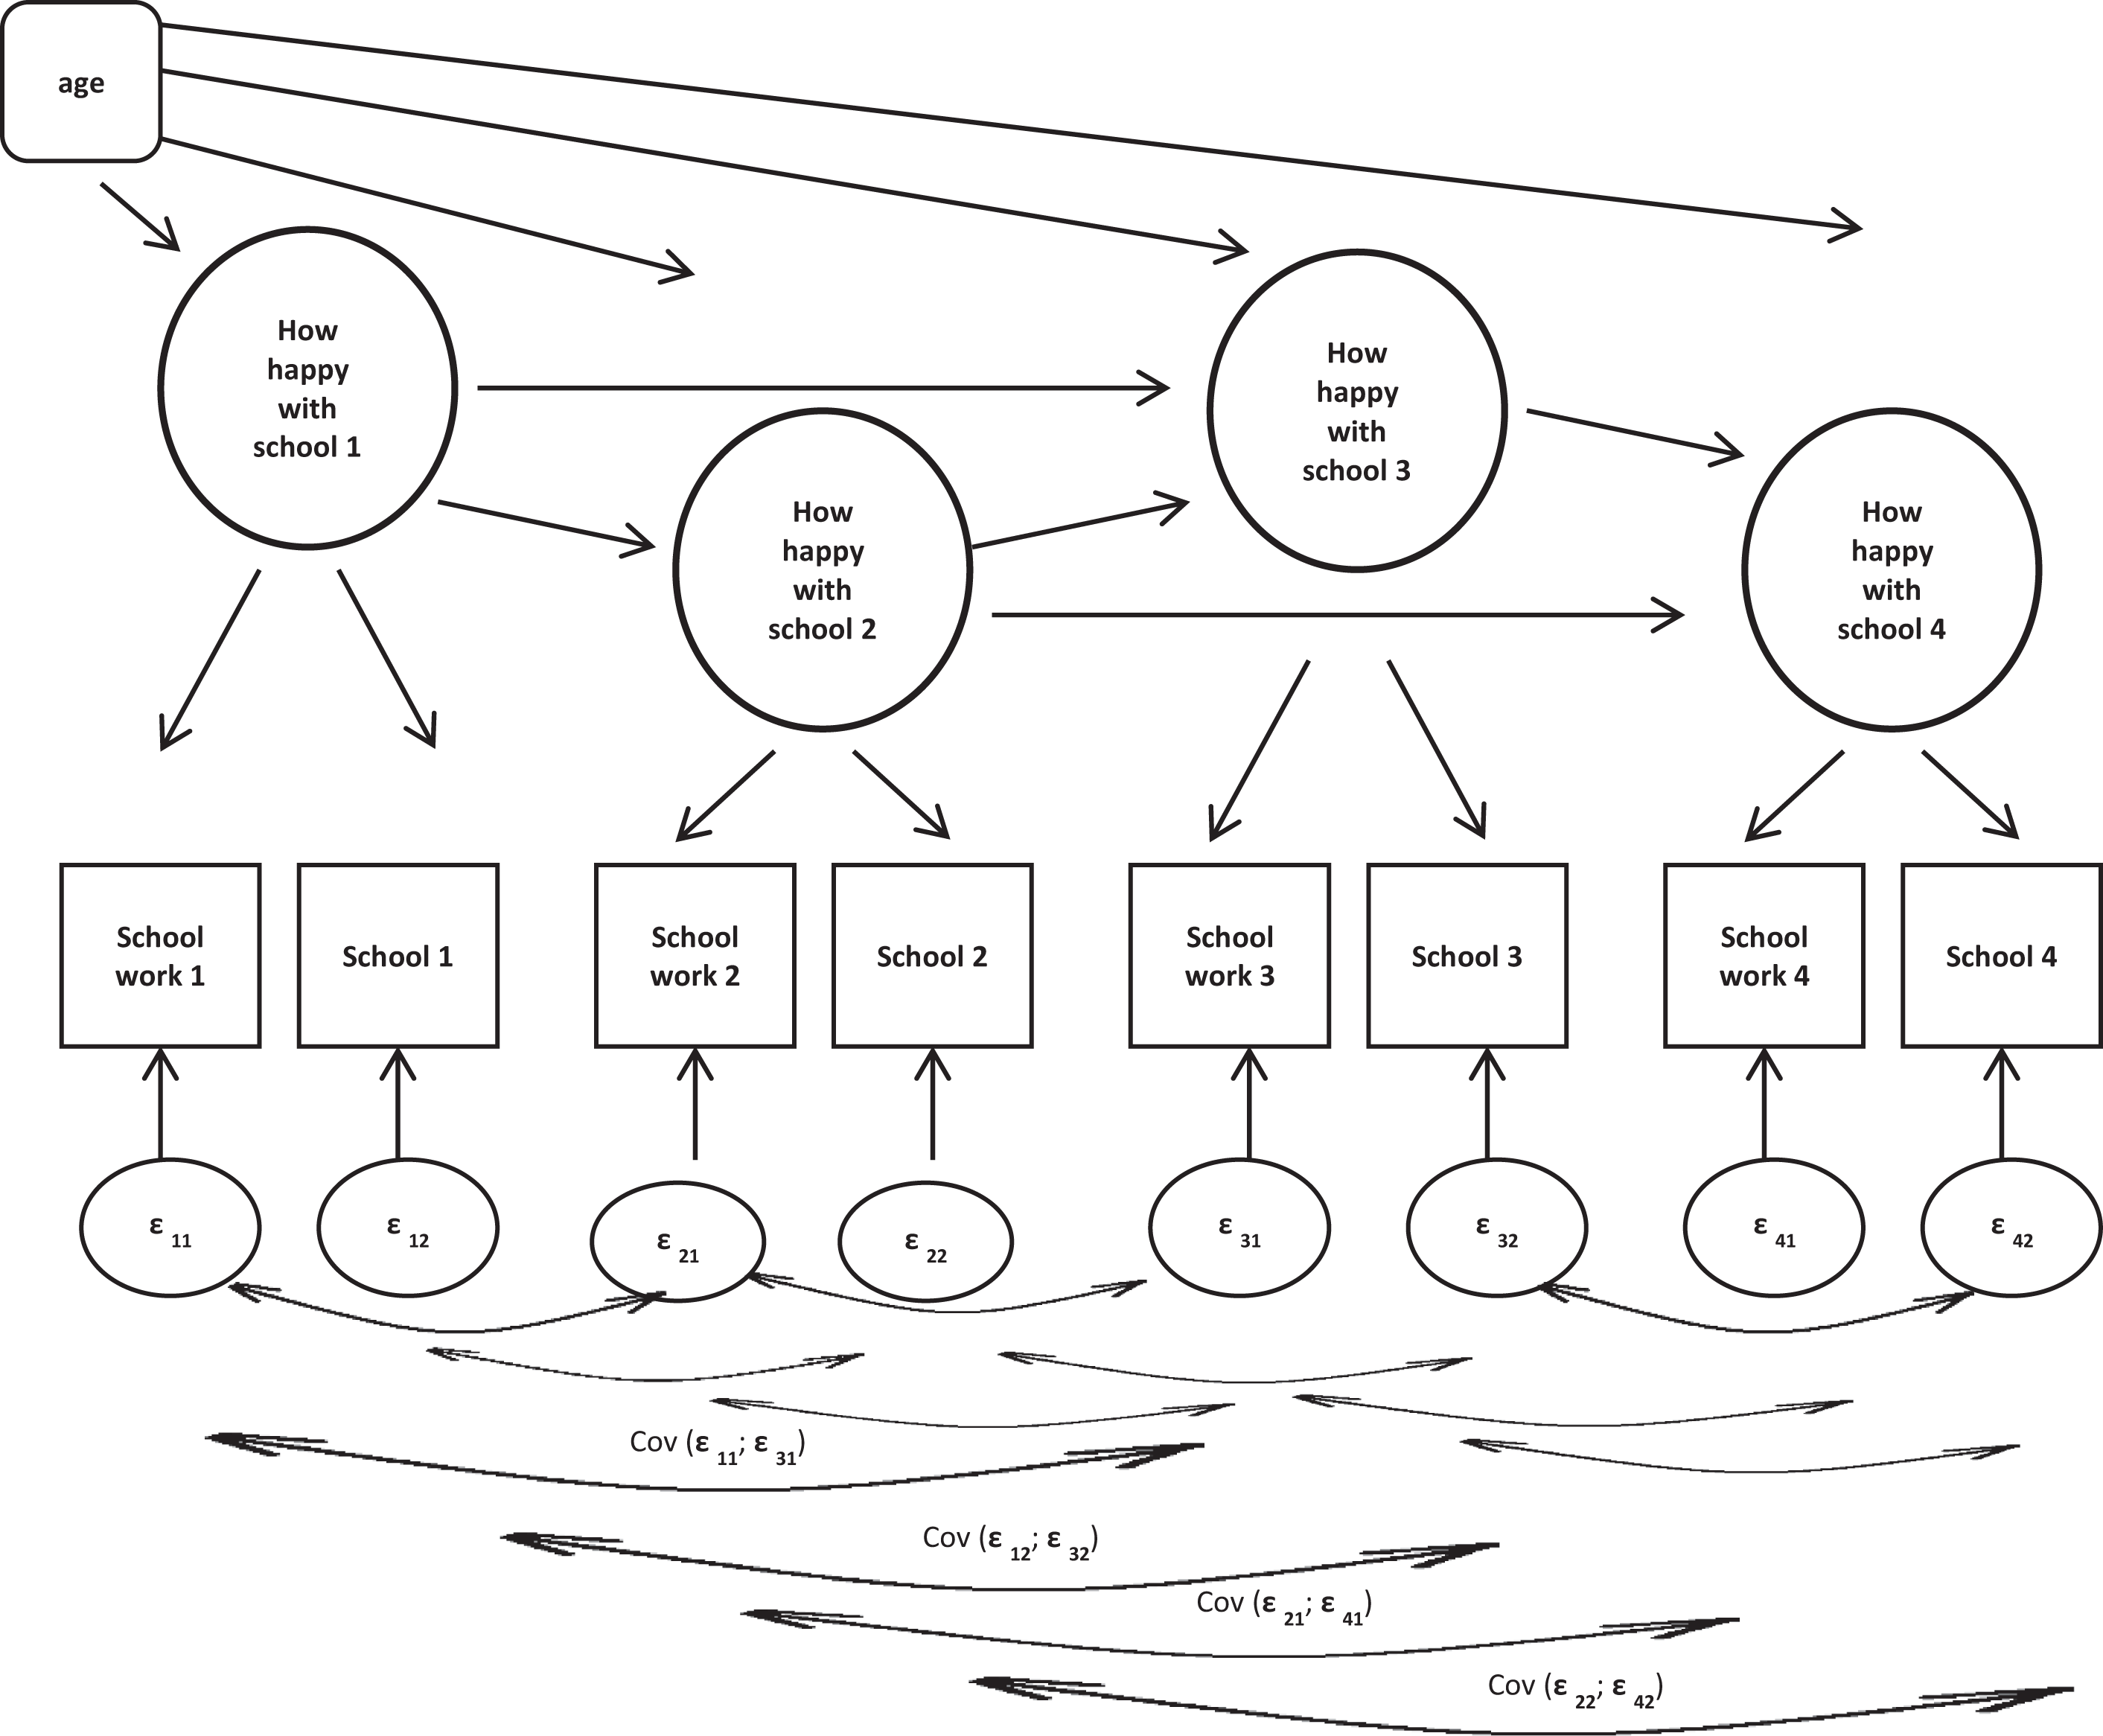
We use attitude questions with a Likert-type 5- or 7-point scale throughout all waves. Several items measured how happy adolescents are with their appearance, family, friends, school, school work, and life overall on a 7-point scale. We measured panel conditioning based on the analysis of latent construct of happiness with school measured by two indicators: how happy children are with school work and how happy they are with school overall. We ran a structural equation model and focus on the correlations between residual variances. The model assumed autoregressive change (see Alwin 2007; Cernat 2015), namely that the true score for happiness with school at time (1) is influenced by the true score at time (i − 1) and at time (i − 2; see Figure 1; for more details, see Procedures and Measures section in Online Appendix).
Model: Autoregressive change, correlations between residual variances at time (i), time (i − 1), and time (i − 2). Goodness of fit of the model: CFI (Comparative-Fit-Index) = .992, TLI (Tucker-Lewis-Index) = .967, RMSEA (Root Mean Square Error of Approximation) = .044, and SRMR (Standardized Root Mean Square Residual) = .019.
The correlations between residual variances at time (i) and at time (i-1) as well as at time (i) and at time (i − 2) were estimated. An increase from wave to wave in the correlations between residual variances would indicate an increasing measurement error, which means a negative panel conditioning effect. Alternatively, a decreasing measurement error from wave to wave would indicate a positive conditioning effect. Since age has an effect on responses, we controlled for age in each wave. We used the lavaan package in R software (version 3.4.3) environment for estimating the model (see http://lavaan.ugent.be). We included only those who completed all four waves in the analysis (N = 960).
Results
INR
Mean INR was 2.1% in the first wave (SD = 4.9), 4.7% in the second wave (SD = 6.5), 3.4% in the third wave (SD = 4.4), and 5.4% in the fourth wave (SD = 8.6). The second and fourth waves had higher INRs. The highest INRs were in the cognitively demanding open-ended questions in the third wave: total amount of received money to spend on oneself the previous week (82.4%) and earned money if respondent had a paid job (52.7%). However, most questions with high INR were in the second and fourth waves. For questions about the respondent’s height and weight, the INR varied from 37% to 42%. Other questions with high INR were sensitive items in which respondents were expected to evaluate the ease of obtaining cannabis (33–35%), the perceived risk of trying amphetamine (21–26%), and the perceived risk of trying ecstasy (19–22%). Respondents might not have enough knowledge to evaluate the risk of taking some of these drugs, so this INR may be associated with the comprehension stage of the response process.
We ran a multiple linear regression with pairwise deletion to predict the overall INR in each wave. The R squared was quite small and varied from .007 to .063 depending on the wave. Overall, it was higher in the more demanding second and fourth waves (.041–.063) than in the first and third waves (.007–.034). As expected, older adolescents had lower INRs. Each additional year of age reduced the INR on average by 0.09–0.17 percentage points in the first and third waves and by 0.67–0.78 percentage points in the second and fourth waves (see Table 1). Boys tend to produce higher INR than girls (β = .57–.89). Mother’s race had also a significant effect on INR. Children who have a Caucasian mother had lower INR by 0.91–1.54 percentage points. The indicator of the parent–child relationships that showed a consistent effect was discussing books at home with children, giving them books as presents, or taking children to museums and theatres: The more often parents do that, the lower INR children produced (β = −.16 to .20). No other variables produced a consistent effect throughout waves, though helping with homework, maternal education, mother’s employment status, and living in a house owned by the household decreased INRs among children in some of the waves (Table 1).
Panel Conditioning
Social desirability
Inconsistency in sensitive questions
About 9% of respondents denied ever smoking cigarettes and 30% denied ever drinking alcohol subsequent to a previous response indicating that they had smoked cigarettes or drunk alcohol, respectively. Older respondents (odds ratio [OR] = 1.33–1.57) and those who had a Caucasian mother (OR = 1.69–1.81) had higher odds of providing inconsistent responses across waves (see Table 4 in Online Appendix). Greater parental involvement in education when parents come to parent evenings (OR = 0.63–0.78), are interested in the child’s academic achievements (OR = 0.73), or help with homework (OR = 0.67–0.82) and closer parent–child relationship (OR = 0.95) decrease the odds of producing inconsistent responses (Table 4 in Online Appendix). Those who live in a home owned by the household and with both parents also have lower odds of providing inconsistent responses.
Level of reporting of sensitive behaviors
Among the balanced panel, each sensitive item had a higher level of reporting in each subsequent wave except for the level of lifetime drinking: While 50.7% of the participants reported lifetime drinking in the third wave, 44.8% reported it in the fourth wave (see Table 2). These differences could, of course, be caused by aging (each respondent was three years older at wave 4 than they were at wave 1), so to identify any panel conditioning effect, we ran mixed effects logit models to predict the level of reporting of sensitive behavior, controlling for a number of sociodemographic variables including age (data not shown).
We found that panelists were less willing to report lifetime drinking in the fourth wave compared to the third wave (OR = 2.21, p < .001). It is consistent with our previous finding that 30% denied drinking alcohol in the subsequent waves. No social desirability bias was found in other variables. Overall, we found some evidence of increasing social desirability bias in the panel.
Correlations between Residual Variances
We measured panel conditioning with respect to two items: How happy children are with school work and how happy they are with school over all? The standardized factor loadings for the variable of school work varied from 0.74 to 0.84, while for being happy with school, the loadings were lower and varied from 0.51 to 0.57 (see Figure 2, correlations between residual variances at time [i], time [i − 1], and time [i – 2] are excluded from the diagram). We expected changes in the correlations between residual variances from wave to wave as an indicator of a panel conditioning effect. We found no pattern in the correlations between residual variances in the item on school work but increasing correlation over waves for the item on being happy with school: The correlation between the first and second waves was .28, between the second and third waves was .46, and between the third and fourth waves was .64 (see Table 3). This suggests a negative panel conditioning effect when respondents provide less accurate responses throughout waves.
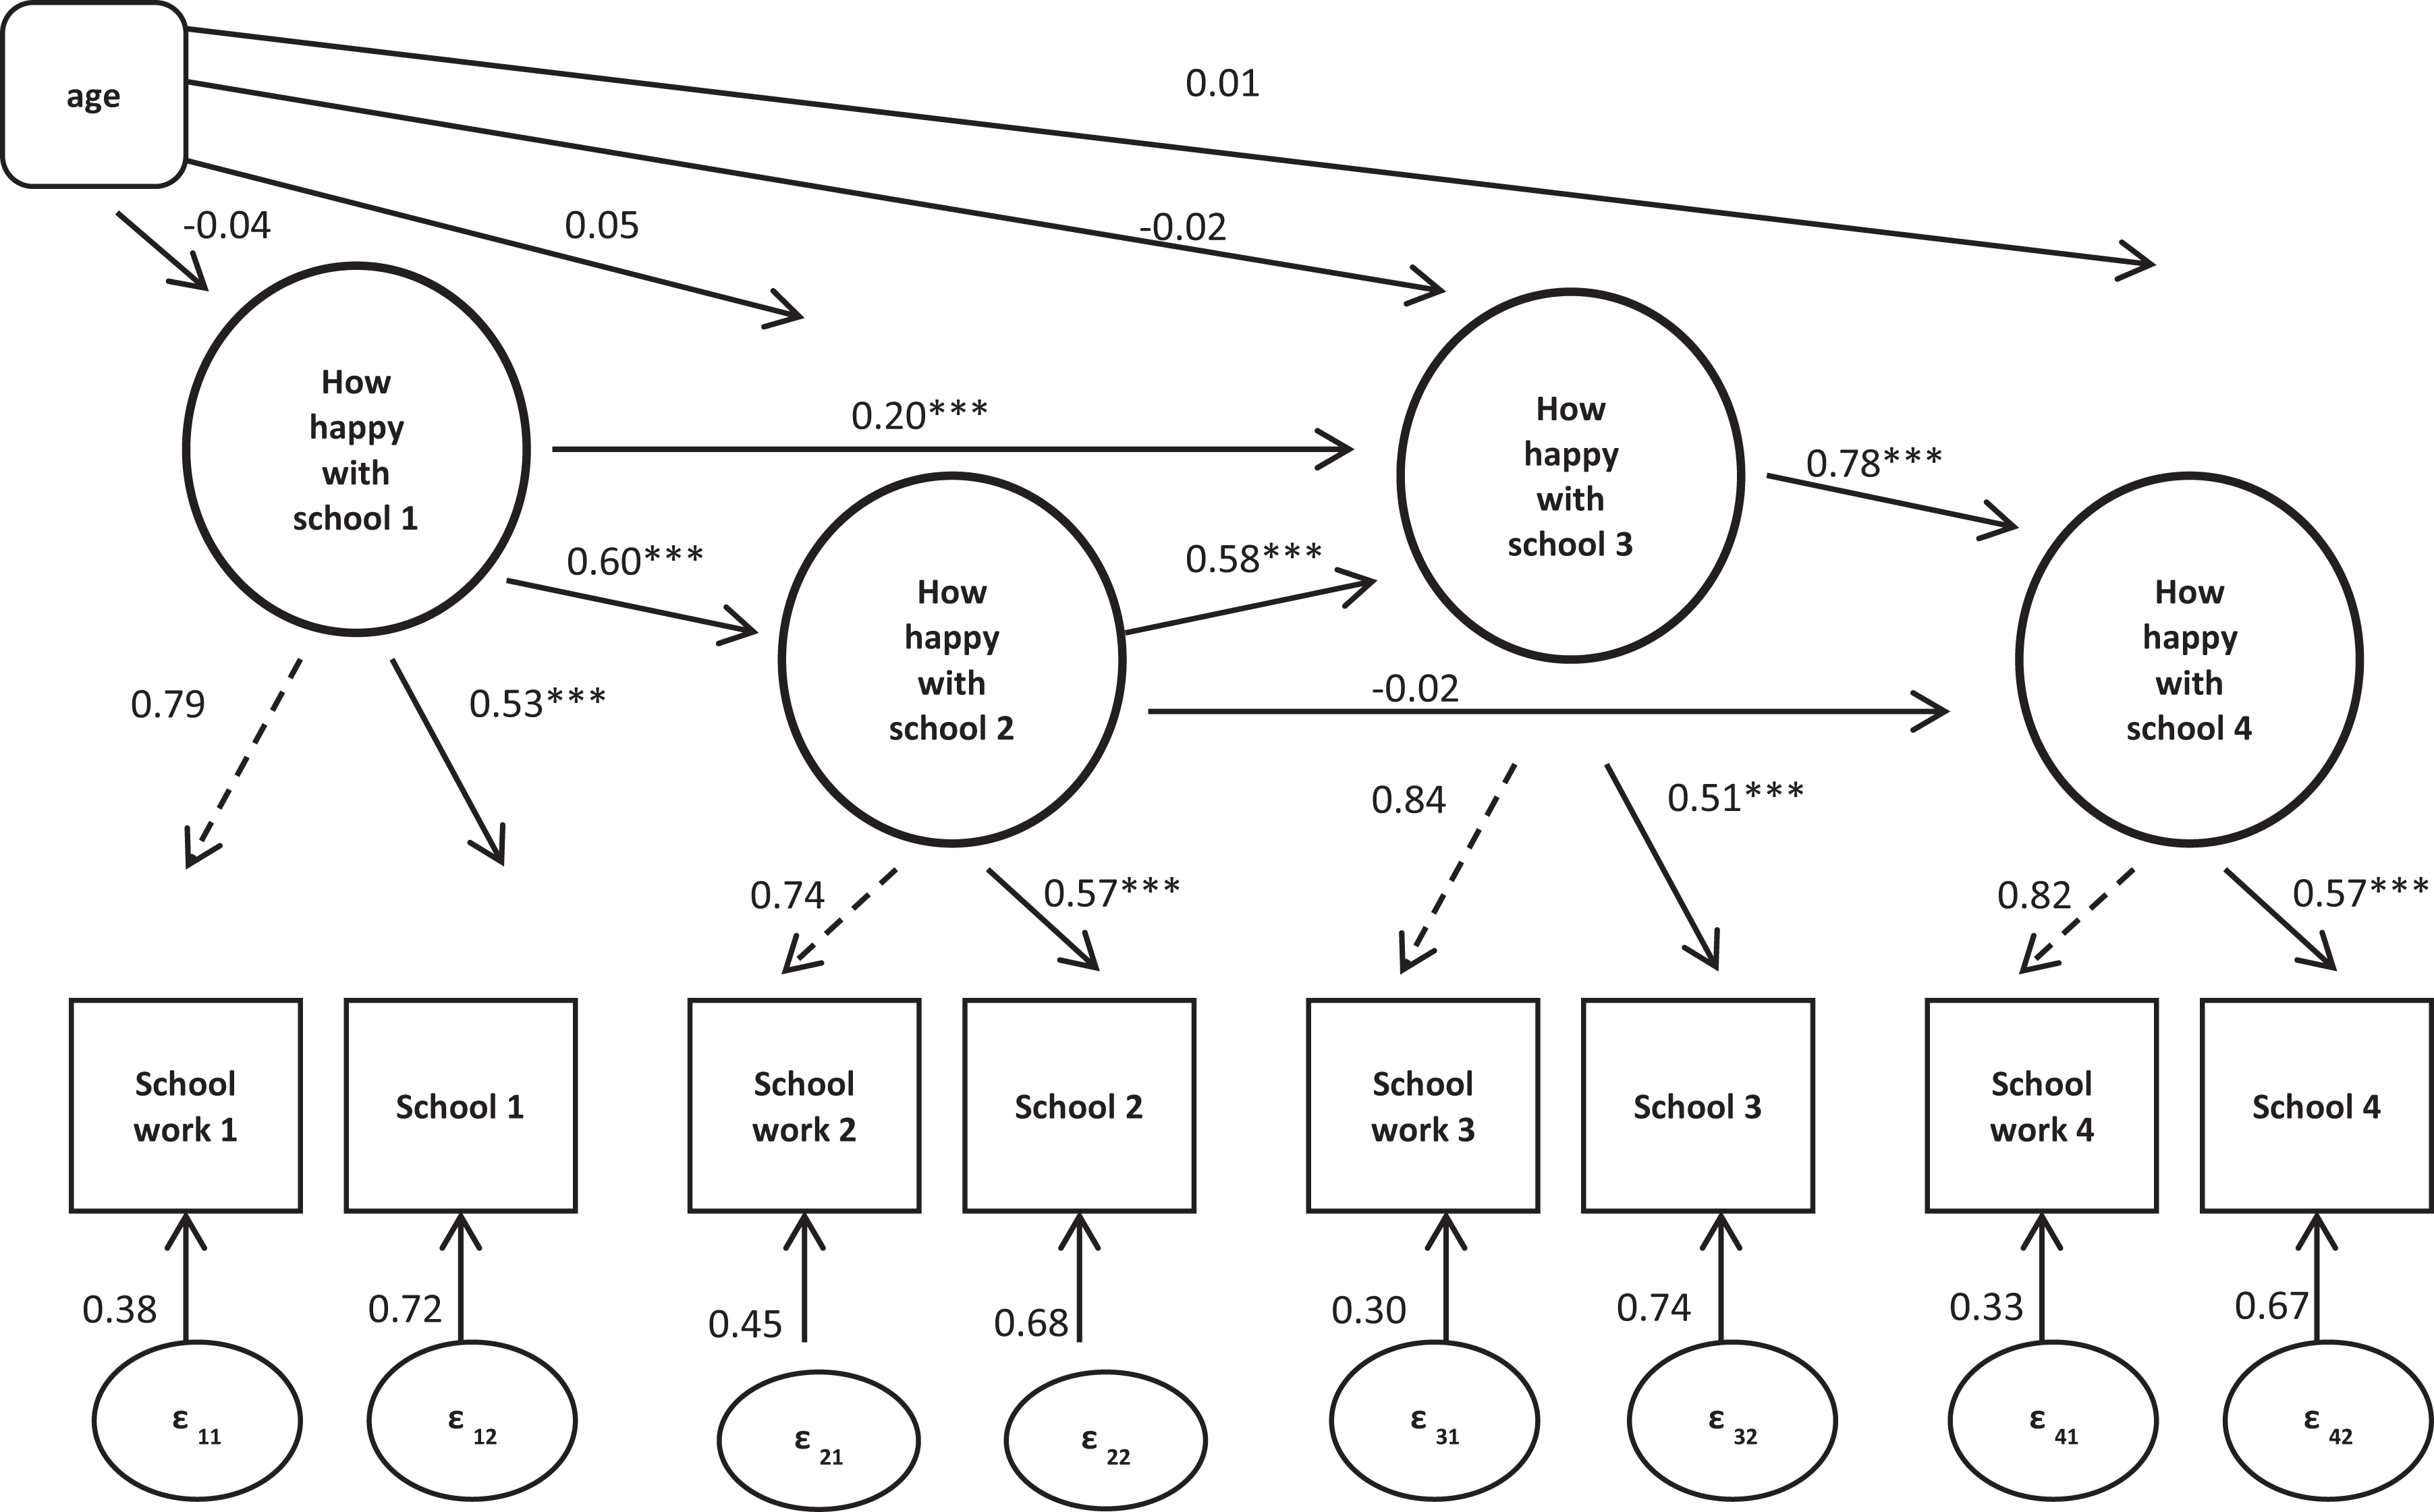
Path diagram for how happy children are with school (correlations between residual variances at time [i], time [i − 1], and time [i − 2] are excluded from the diagram): Standardized coefficients. ***p < .001.
Correlations between Residual Variances.

Note: Standard errors are given in parentheses.
**p < .01.
***p < .001.
Discussion
Our findings revealed that the drivers and nature of INR are to some extent different for children than for adult survey respondents. Overall levels of INR are fairly low, but for questions on topics of which many children may have little knowledge (e.g., their own height and weight, amounts of money earned or received, the ease of obtaining drugs, and risks of trying drugs), INR rates can be very high indeed. In combination with the observation that children hardly ever select a don’t know option, this appears to suggest that children tend to simply skip a question rather than admit explicitly that they do not know the answer. This raises the question of whether there is any value in offering explicit don’t know options in questionnaires for children. Moreover, researchers might consider filtering, or at least preceding, questions on topics that require some prior knowledge on questions that ask explicitly about knowledge levels.
Cognitive ability is also implicated as a driver of INR by some of our findings: INR was higher in the waves with more cognitively demanding questions and declined with increasing age of the children. This should serve as a reminder to researchers to be aware of the cognitive limits of children and to design age-appropriate survey questions.
While previous research (Borgers and Hox 2001) found that both children’s characteristics and the characteristics of the questionnaire have an effect on data quality, we were able to identify an interaction effect between them. Younger respondents were heavily affected in more cognitively demanding waves and for questions about cannabis, ecstasy, and amphetamine. Such questions are quite difficult for this age group and may need to include some age or knowledge filters. We can conclude that INR among children is likely more associated with difficulties in retrieving relevant information or making judgments than with difficulties in understanding the item or a tendency to avoid providing the answer.
A particular contribution of this study was to identify a strong effect on INR of the strength of the parent–child relationship, even after controlling for maternal education, maternal employment, parental involvement in education, household income, and age and gender of the child. This interesting finding certainly seems to warrant further investigation to establish the mechanisms through which the effect operates. It could be a rather direct effect, indicating that parents with a stronger parent–child relationship are more likely to be present while the child fills the questionnaire and may even assist with the completion of the questionnaire. Or the mechanisms could be more subtle, indicating that stronger parent–child relationships are more likely to provide the child with skills and abilities that are relevant to the task of completing a social survey questionnaire.
We found that inconsistency between responses to sensitive questions given at different waves depends on the question topic. A higher level of inconsistency (denial at a later wave of a behavior admitted at an earlier wave) was found for drinking alcohol than for smoking. This is in line with the results of Fendrich and Kim (2001). Inconsistency was lower for children with a stronger parent–child relationship and higher parental involvement in education. Researchers should therefore be cautious in interpreting findings from questions about sensitive behaviors, particularly regarding the association of such behaviors with any factors likely to be associated with parent–child relationships or parental involvement: There could be correlated measurement error at play.
We found partial evidence for a negative panel conditioning effect. The effect was found for one of the three sensitive measures and one of the two subjective happiness measures. These findings suggest that both social desirability bias and satisficing can increase over waves of survey participation by children. While researchers should clearly be aware of this possibility, it remains unclear in which circumstances such panel conditioning effects should be expected.
Some limitations of our study should be noted. First, as with many panel conditioning studies, we note that the panel conditioning analysis is based on a nonexperimental design and has a number of limitations. Results would be more reliable if an experimental design were embedded in the panel with an experimental group not receiving some survey items in the previous waves and a control group receiving survey items in all waves. Second, the panel conditioning effect in terms of correlations between residual variances was measured only for two items. It would be useful to replicate the kind of analysis we have proposed and implemented here for a number of other variables.
Overall, we point to the need for further research in two areas. First, we lack understanding of the mechanisms that have led to some of our findings: for example, the finding of a positive effect of the strength of parent–child relationship on the quality of the data provided by the child. Studies designed specifically to identify the mechanisms would be helpful. Second, although our findings provide pointers to aspects of survey practice that could be improved, as discussed above, knowledge of how best to make these improvements is only partial. Methodological studies should be designed with a specific focus on identifying how panel conditioning can be reduced and how data quality can be increased, especially in more socially vulnerable households with lower parental involvement in education and less close parent–child relationships.
Supplemental Material
Supplemental Material, mavletova.lynn.supplement.rev - Item Nonresponse Rates and Panel Conditioning in a Longitudinal Survey among Youth
Supplemental Material, mavletova.lynn.supplement.rev for Item Nonresponse Rates and Panel Conditioning in a Longitudinal Survey among Youth by Aigul Mavletova and Peter Lynn in Field Methods
Footnotes
Authors’ Note
Aigul Mavletova’s visit to Essex University was supported within the framework of a subsidy by the Russian Academic Excellence Project “5-100” within the framework of the Basic Research Program at the National Research University Higher School of Economics (HSE).
Declaration of Conflicting Interests
The author(s) declared no potential conflicts of interest with respect to the research, authorship, and/or publication of this article.
Funding
The author(s) disclosed receipt of the following financial support for the research, authorship, and/or publication of this article: The contribution of the first author is funded by the Russian Science Foundation, grant № 17-78-20172. The contribution of the second author is funded by the UK Economic and Social Research Council Award for Understanding Society—the UK Household Longitudinal Study.
Supplemental Material
Supplemental material for this article is available online.
References
Supplementary Material
Please find the following supplemental material available below.
For Open Access articles published under a Creative Commons License, all supplemental material carries the same license as the article it is associated with.
For non-Open Access articles published, all supplemental material carries a non-exclusive license, and permission requests for re-use of supplemental material or any part of supplemental material shall be sent directly to the copyright owner as specified in the copyright notice associated with the article.