
Abstract
Because of the high cost, venue-based probability sampling of young men who have sex with men (YMSM) is largely inaccessible to social researchers. The aim of this study is to compare the feasibility of implementing geosocial networking application-based (GSNA) and venue-based prob`ability sampling of young men who have sex with men. A cross-sectional survey conducted in Los Angeles in 2017 and 2018 recruited 124 YMSM using both methods. We compared costs and hours of work for each method. Per participant, GSNA-based methods cost approximately 157 USD compared to 383 USD for the venue-based methods. For sample sizes up to 1,000, venue-based methods cost over two times more than GSNA-based methods. Findings indicate that research teams with limited resources may be able to implement probability-based recruitment by using GSNA. By lowering the cost of research and maintaining probability-based methodological rigor, GSNAs can increase the amount of social research with YMSM.
Introduction
Probability-based recruitment of young men who have sex with men (YMSM) can be considerably difficult because the sampling frame is largely unknown (Heckathorn 1997). Therefore, researchers have historically relied on locations (e.g., bars) of known attendance to aid in recruitment of this hidden population (Kalichman et al. 1997; Kelly et al. 2015; Mutchler et al. 2011; Operario et al. 2006; Ridge et al. 1994; Thiede et al. 2003). Venue-based stratified probability sampling was developed primarily to recruit more generalizable samples of YMSM, by identifying all locations where, and times when, YMSM congregate (Ford et al. 2009). However, venue-based probability sampling has been criticized for being largely inaccessible to researchers due to the high cost and labor-intensive nature of implementation (Meyer and Wilson 2009). Therefore, the majority of research on this population has relied on convenience samples recruited in-person at venues (Boone et al. 2013; Halkitis and Figueroa 2013; Kelly et al. 2015; Mansergh et al. 2008; Mutchler et al. 2011) or through websites (Fernández et al. 2007; Horvath et al. 2008).
In 2009, geosocial networking apps (GSNAs) were introduced to smartphones with the creation of Grindr (Leslie 2009). During the past 12 years, these apps have grown in popularity among YMSM, with some apps boasting 25 million users worldwide (Hornet 2019). Users can message others, using the integrated message system, and determine the distance of other users from their current location. Since 2009, YMSM increasingly report using technology to meet other YMSM and relying less on venues for interaction (Grov 2012; Grov and Crow 2012; Zablotska et al. 2012).
Given this cultural and technological shift, researchers have begun to look to GSNAs as a method for study recruitment. Studies have recruited both probability samples (Gibbs and Rice 2016; Rice et al. 2012), in Los Angeles, and convenience samples (Buckingham et al. 2017; Goedel and Duncan 2016; Goedel et al. 2019; Grov et al. 2016; Phillips et al. 2015; Siegler et al. 2015) of men who have sex with men, in U.S. cities like Philadelphia and New York and U.S. nationally, using GSNAs. Because users are required to reveal their smartphone geolocation, researchers can target geographic locations for the display of recruitment advertisements (Buckingham et al. 2017; Goedel et al. 2019; Grov et al. 2016).
App-based recruitment procedures may also be more cost efficient than venue-based procedures (Rice et al. 2012). Further, app-based studies report reaching the targeted study sample size in a short amount of time (Buckingham et al. 2017). These indications are important because previous research has found that certain YMSM recruitment methods (e.g., respondent-driven sampling) can require an extended data collection period of up to three years (Kuhns et al. 2015; Lachowsky et al. 2016), increasing the odds of a significant historic event, a threat to internal validity (Campbell 1957; Schaie 1983). Although app-based recruitment shows promise in reducing cost and length of time required for recruitment, the recruitment efficiency of these methods is varied (Zou and Fan 2017). A recent systematic review and meta-analysis of studies using GSNAs to recruit men who have sex with men revealed that the ratio of approached potential participants to those who completed the study varied widely, from 100:2 to 100:74 (Zou and Fan 2017). This wide variation in reported recruitment efficiency may be due to a lack of consensus regarding how to accurately measure this metric (e.g., users who click the ad versus users in the area where the ad is broadcast). Because this technology and its use in research are new, very little is known about the utility of GSNA-based recruitment compared to other methods.
To date, no known study has compared the feasibility of implementing venue-based probability sampling to GSNA-based probability sampling. Therefore, the aim of this study is to examine the recruitment efficiency and cost efficiency of venue-based and GSNA-based probability recruitment of YMSM.
Methods
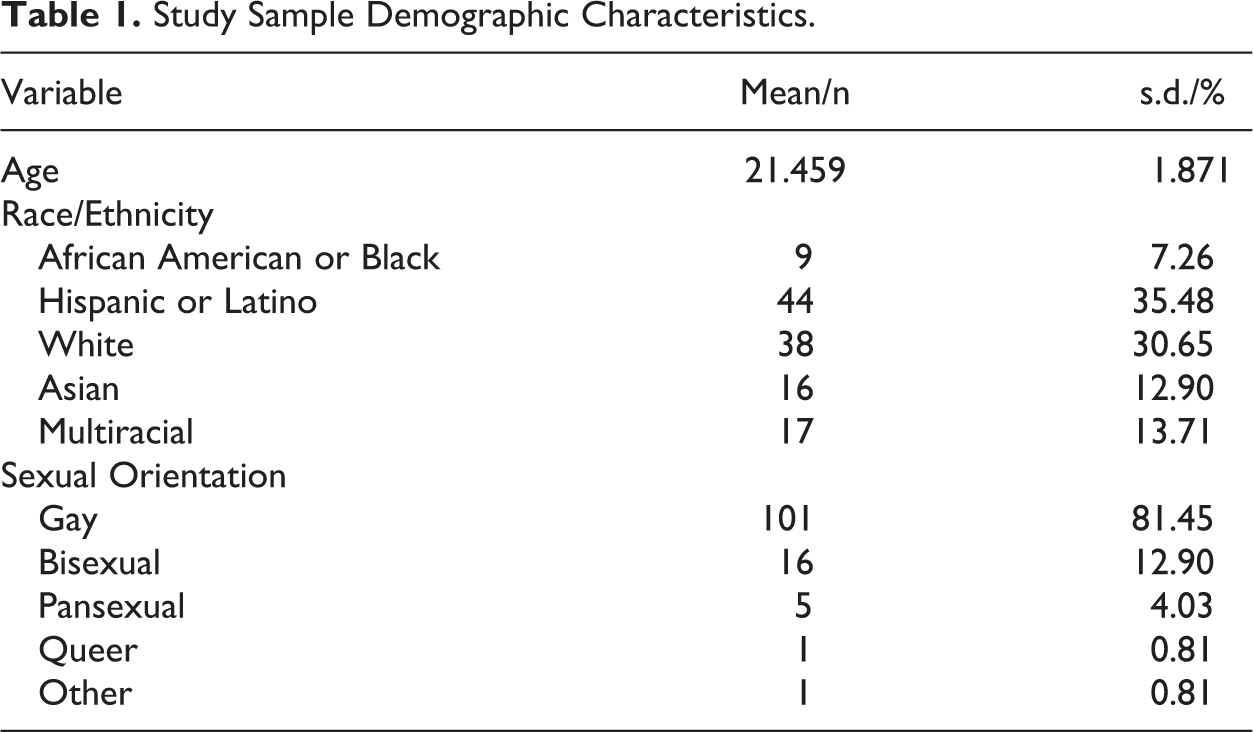
We conducted a cross-sectional survey in Los Angeles from April 2017 through June 2018. Of 124 YMSM (aged 18–24 years old) recruited, 68 were recruited using venue-based and 56 using GSNA-based probability sampling procedures. Sample demographics are provided in Table 1. Recruitment methods followed two stages: recruitment preparation and recruitment implementation. Stages were completed with a specific geographic sampling frame (GSF; the southern portion of Los Angeles County). Further, we completed GSNA-based probability sampling procedures remotely using technology to mock GPS locations (see Recruitment Implementation for further details). We tracked effort hours and costs by the principal investigator and research assistants. The institutional review board of the University of Southern California approved all study procedures.
Study Sample Demographic Characteristics.
Recruitment Preparation
Venue-based probability sample
To identify the study sampling frame for venue-based recruitment, the study team conducted brief interviews in public areas within the GSF and asked interviewees to report known locations for finding YMSM. The study team presented the compiled list of venues to a community advisory board. We recruited members of the community advisory board using the social networks of study personnel and each member had to fit into the study eligibly criteria. Members nominated missing venues and eliminated inappropriate venues (e.g., restaurants and clothing stores believed to be not frequented by YMSM), which resulted in an exhaustive list of 43 venues frequented by YMSM. Investigation of each venue using Google’s “Popular Times” function (i.e., a publically available platform, which tracks visit data to businesses from Google users who have opted in to Google Location History; Google 2020), information from each venue’s website, and the information gathered from the community advisory board, identified 199 periods (four-hour sampling periods: 8 a.m.–12 p.m., 12 p.m.–4 p.m., 4 p.m.–8 p.m., and 8 p.m.–12 a.m.) at the venues that were theoretically high in YMSM attendance (i.e., venue day time periods, VDTs).
The procedures of venue enumeration followed those outlined by the Healthy Young Men’s Study (Ford et al. 2009). We conducted pilot enumerations wherein one study team member counted individuals who appeared to meet the study criteria and a second study team member asked those individuals if they met the eligibility criteria (i.e., date of birth, gender, and self-identification as gay, bisexual, or uncertain about sexual orientation or report of having sex with men). Based on the pilot enumerations, team members correctly identified eligible individuals 65% of the time. Type I enumeration required one study team member to visit each venue during the identified four-hour periods and count the number of individuals who appeared to fit the study criteria. We multiplied the number counted by four, to approximate a four-hour period, and by 65% (the pilot enumeration) to estimate the number of eligible individuals.
An estimated eight individuals in a four-hour period was identified as the threshold for an appropriate VDT based on recommendations from previous studies (Ford et al. 2009; MacKellar et al. 2007). If a Type I enumeration for a specific VDT resulted in an estimate below the threshold, then the VDT required a type II enumeration. Of the 199 type 1 enumerations completed, 144 were determined to be appropriate and 55 required a type II enumeration.
We conducted type II enumerations using two study team members for two one-hour periods separated by one hour and followed the same procedures as the pilot enumerations. If we found that a VDT had an estimate less than eight, we excluded it from the sampling frame. After completion of enumerations, 156 VDTs were identified as appropriate for recruitment.
GSNA probability sample
The community advisory board also reported on the most popular GSNAs used by YMSM in the GSF. Each proposed GSNA needed to meet three criteria to be included: (1) ability to filter users by age; (2) ordering of user profiles by relative proximity to the study smart device; and (3) reporting of the relative distance of users from the study smart device. The principal investigator contacted the top three GSNAs to inquire about interest in collaborating. From these conversations, the study GSNA was selected (i.e., Hornet).
Similar to the venue-based procedures, the GSNA-based methods required that users could be recruited from each sampling-day-time period (SDTP; four periods × seven days = 28). The periods used were the midpoints of each VDT: 10 a.m., 2 p.m., 6 p.m., and 10 p.m.
We chose five points in the GSF as the locations for recruitment to maximize coverage and allow for all the users of the study GSNA to have the same probability of being approached for recruitment. The number of sampling points needed for each SDTP in the GSF was determined by three criteria: point-based circular buffers of 8 miles (approximately 13 kilometers) that (1) maximized coverage of the GSF; (2) minimized buffer overlap; and (3) minimized coverage of areas outside the GSF boundary. Once completed, these procedures identified 140 day-time-sampling locations, or DTSLs (five points × 28 SDTPs).
Recruitment Implementation
All VDTs and DTSLs were loaded into a spreadsheet, were randomly selected (10 VDTs and four DTSLs; the study GSNA preferred to limit monthly recruitment periods to avoid overburdening users) and placed on the monthly study calendar.
For venue-based recruitment, two or three study team members recruited a sample of participants from the specified VDT. While one study team member counted the number of men who appeared to be eligible, the remaining study team members approached potential participants and asked if they were willing to complete the study screener. If the potential participant agreed to participate, they completed the screener on an iPad, input contact information, and created a unique study ID code. The potential participant received a $5 physical gift card incentive for screening because pilot tests revealed that this procedure encouraged screening completion.
For GSNA-based recruitment, instead of visiting the specified geographic point, the study GSNA was technologically misled (using a third-party application, “Fake GPS Location”) and provided with GPS coordinates for the DTSL. This allowed the study team to stay in a fixed location. Each DTSL had an associated GPS point and radial distance (i.e., 8 miles). The recruitment process began by one study team member opening the GSNA on the study smart device using an anonymous profile. Using a paid feature of the GSNA, the anonymous profile had no information and no picture and was not visible to other users. Therefore, the GSNA users did not interact with the research team within the GSNA platform. After filtering the visible user profiles by age eligibility (i.e., 18–24 years old), the study team member recorded all public GSNA user IDs within 8 miles of the study smart device. Study personnel logged all users within the geographic boundaries of each DTSL, including if a user was present for more than one DTSL. Concurrently, Hornet, the study GSNA, sent out a preset direct message broadcast, with “Hornet” listed as the sender, in the GSNA to all users within 8 miles. Once potential participants clicked on the message link, they could complete the screener. We provided no eligibility incentive to GSNA-recruited potential participants because pilot tests revealed this procedure did not aid screening completion. Pilot tests with a $5 screener incentive when compared to tests with no incentive had no meaningful difference on the number of screener completions, and the community advisory board confirmed the appropriateness of this procedure as a $5 online incentive was considered too low to aid screener completion.
The contact information manager received the screener data and determined if individuals were eligible to take the study survey. The contact information manager then provided a list of new eligible study IDs to the data manager. The data manager used the unique study IDs to create one-use web links to the main study survey and provided these to the contact information manager. The contact information manager then sent the potential participant instructions to take the main study survey.
On entering the main study survey and giving informed consent, the survey instructed participants to enter their unique study ID code. The main study survey asked participants to report demographic information, substance use behaviors, and sexual risk behaviors. Once a participant completed the main study survey, the data manager provided a list of completed survey study ID codes and a unique link to an associated supplemental survey to the contact information manager. The contact information manager then sent each participant a downloadable gift card ($25 for a venue-recruited participant and $35 for a GSNA-recruited participant). The pilot procedures initially had study incentives as $25 for both methods, but pilot tests findings and confirmation by the community advisory board suggested the need for a modification to the GSNA procedures. Pilot tests for GSNA recruitment revealed that while a $5 screener incentive did not aid screener completion an advertised study incentive of $35 (rather than $25) did aid screener completion. The contact information manager messaged instructions for the supplemental survey to each participant who completed the main study survey. The supplemental survey followed the same procedures as the main study survey, except with a $15 downloadable gift card incentive.
Measurement
Study personnel tracked recruitment periods for venue-based recruitment in the field, and the data manager used a deidentified spreadsheet to track the progression of all potential participants through the study process (i.e., eligible to participate, participated in the main survey, participated in the supplemental survey). We tracked GSNA recruitment periods by recording all unique GSNA users in the geographic area during the recruitment broadcast. This served as the number of unique users “approached” via the GSNA during each recruitment period. Like the venue-based tracking procedures, all GSNA-based potential participants identified as eligible were included in a tracking spreadsheet, which recorded their progression through the research process.
We recorded all effort hours and costs in one of four categories: recruitment preparation, recruitment implementation, software, and hardware (Wang et al. 2003). See Table 2 for a detailed explanation of all cost categories and item examples.
Summary of Recruitment Method Hours and Costs.
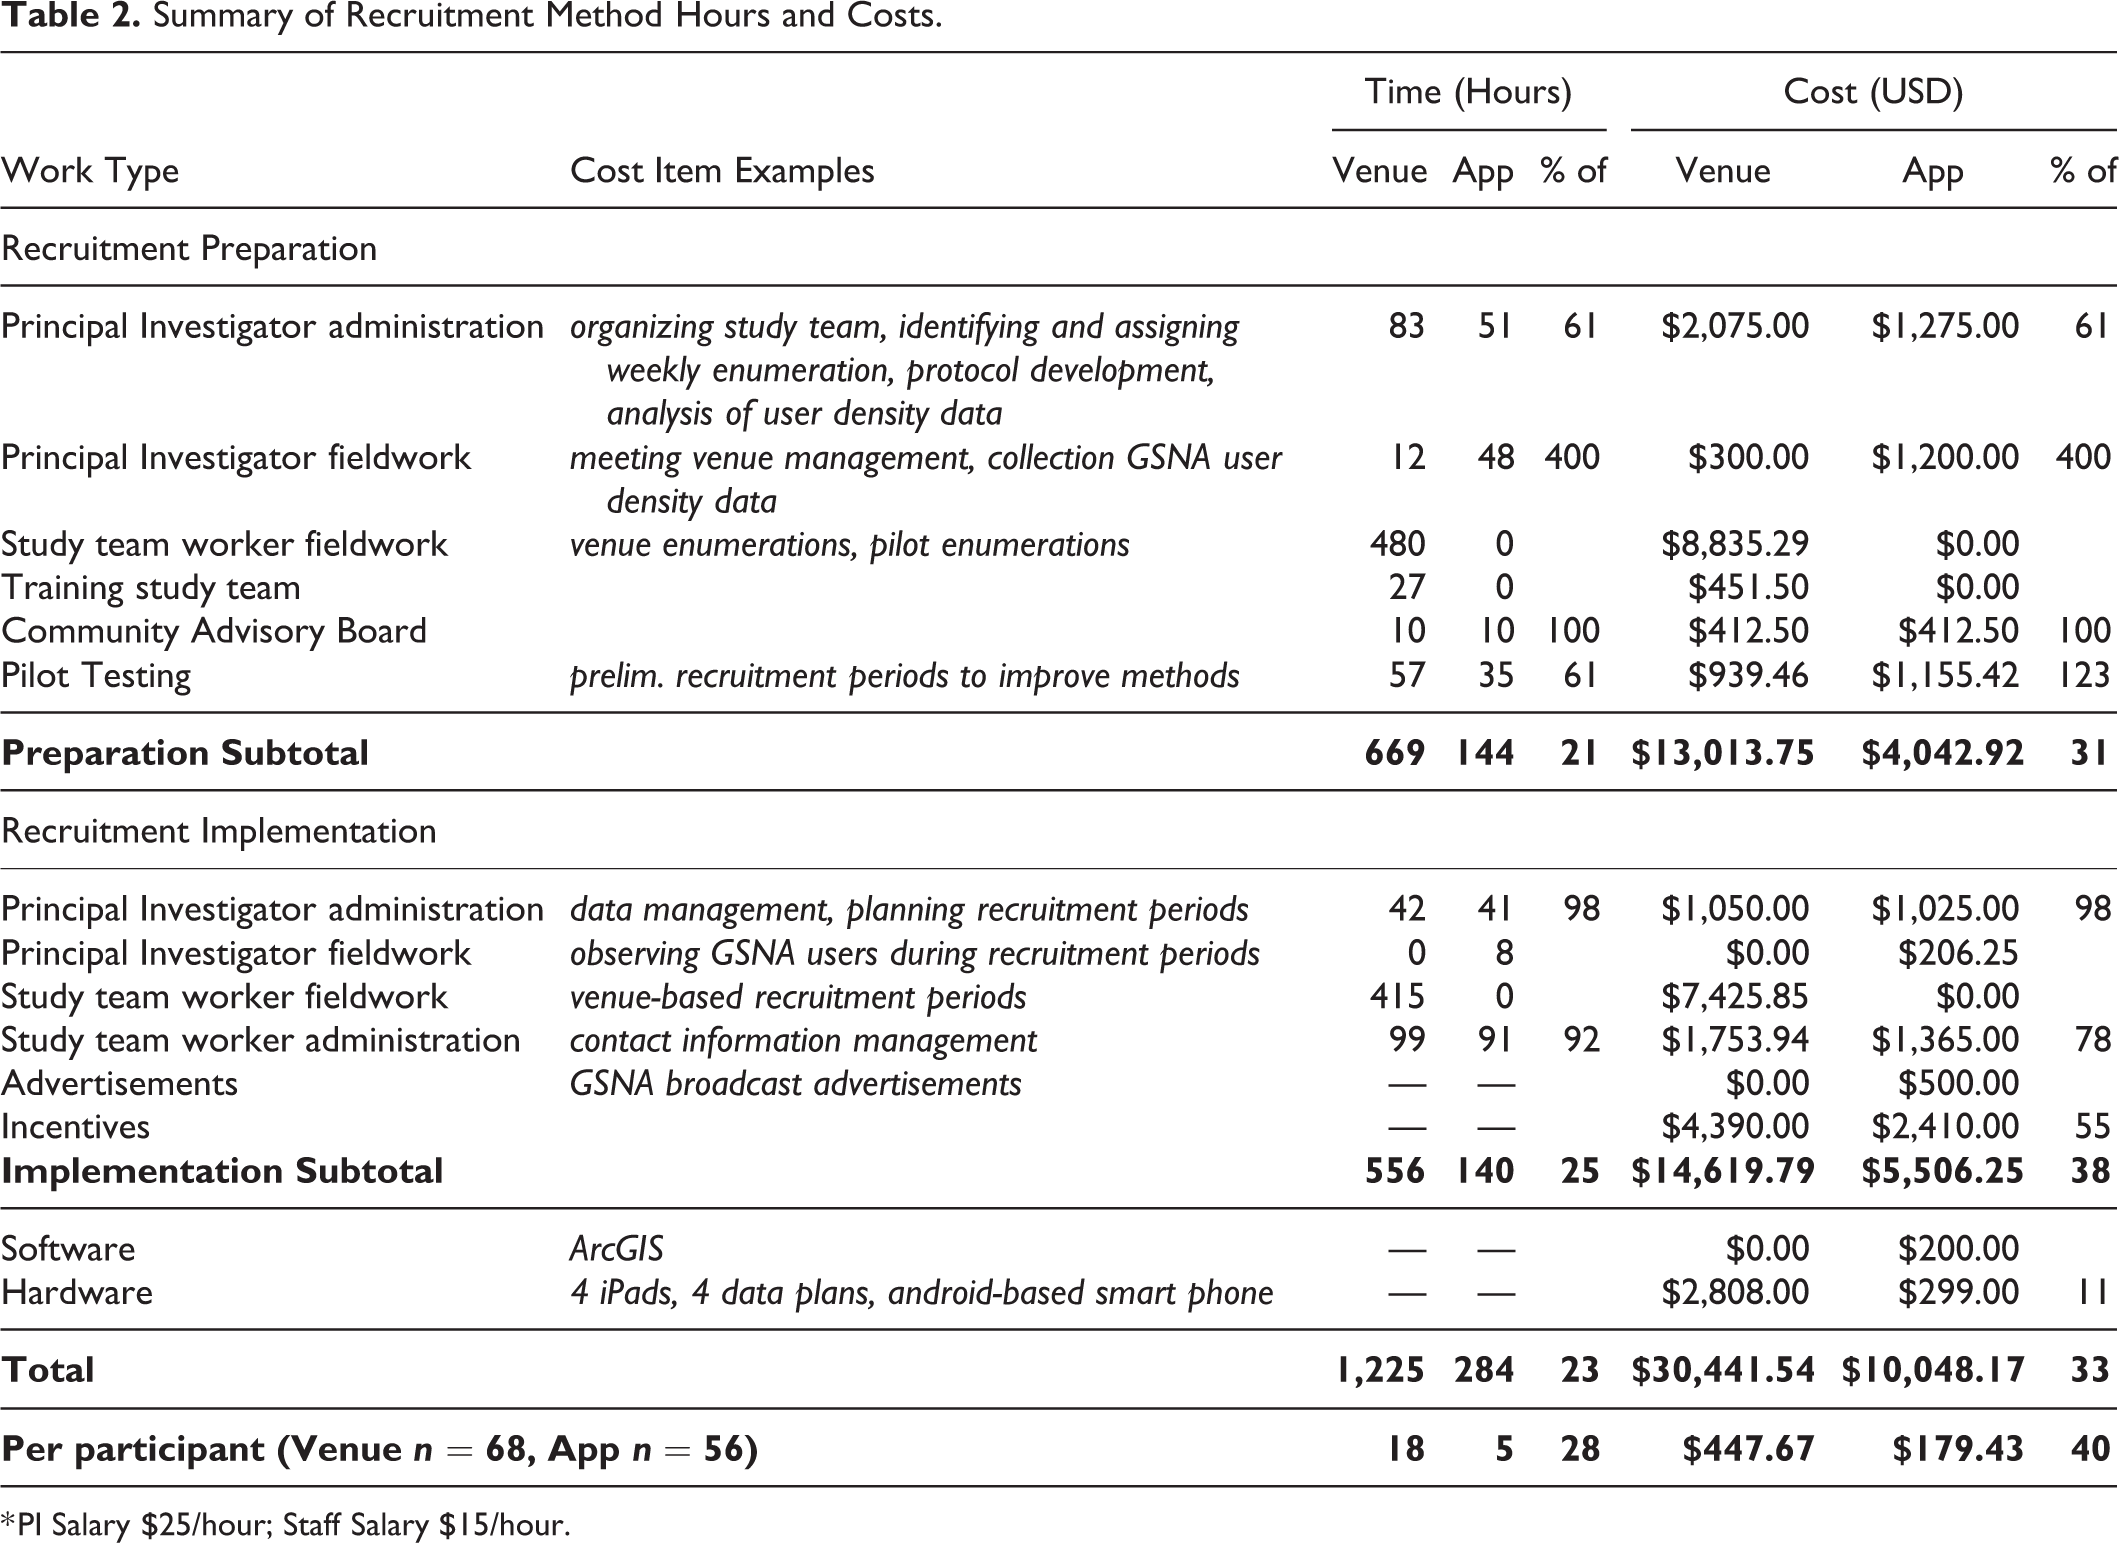
* PI Salary $25/hour; Staff Salary $15/hour.
We also collected sample demographics (i.e., age, race/ethnicity, and sexual orientation) through the survey. In addition to the demographics reported in Table 1, participants reported their residential zip code. The zip code variable was recoded to the dichotomous variable: resident Los Angeles County.
Analytic Procedure
To address recruitment efficiency, we grouped recruitment periods by method and compared using two-sample t-tests for the number of individuals observed (unique and total number, including repeats), who completed the eligibility survey, who were deemed eligible, who completed the main survey, and who completed the supplemental survey. Additionally, the venue-based methods informing this study used enumerations to identify locations where an estimated eight eligible individuals would be observed (Ford et al. 2009). To test whether these estimates were accurate, we compared recruitment periods based on whether eight or more potentially eligible participants were observed, using χ2 tests to identify differences. Further, to investigate the recruitment success, we tracked participants through the study process and a completion rate was established for each method. Because the overarching project goal was to recruit YMSM in Los Angeles, success of recruitment was also compared through a χ2 analysis using participants’ self-reported residency (i.e., Los Angeles County resident).
We then compared the recruitment methods based on their cost subgroups and their cost per participant. Last, we combined the findings from the cost analysis and recruitment efficiency analysis to estimate the cost per participant for each recruitment method, based on the final sample size. All final cost estimates are in 2018 USD.
Results
We completed GSNA-based and venue-based recruitment implementation in 25 and 59 recruitment periods, respectively. During this time, we observed potential study participants either at venues or while using the study GSNA. Figure 1 summarizes the flow of potential participants through the study process. Both recruitment methods achieved a 7% response rate based on the number of potential participants observed to those who completed both the main study survey and the supplemental survey. A χ2 analysis of participant residency (χ2[1, 124] = 12.273, p < .001) indicated that significantly more app-recruited participants (98.2%) reported living in Los Angeles County compared to venue-recruited participants (76.5%).
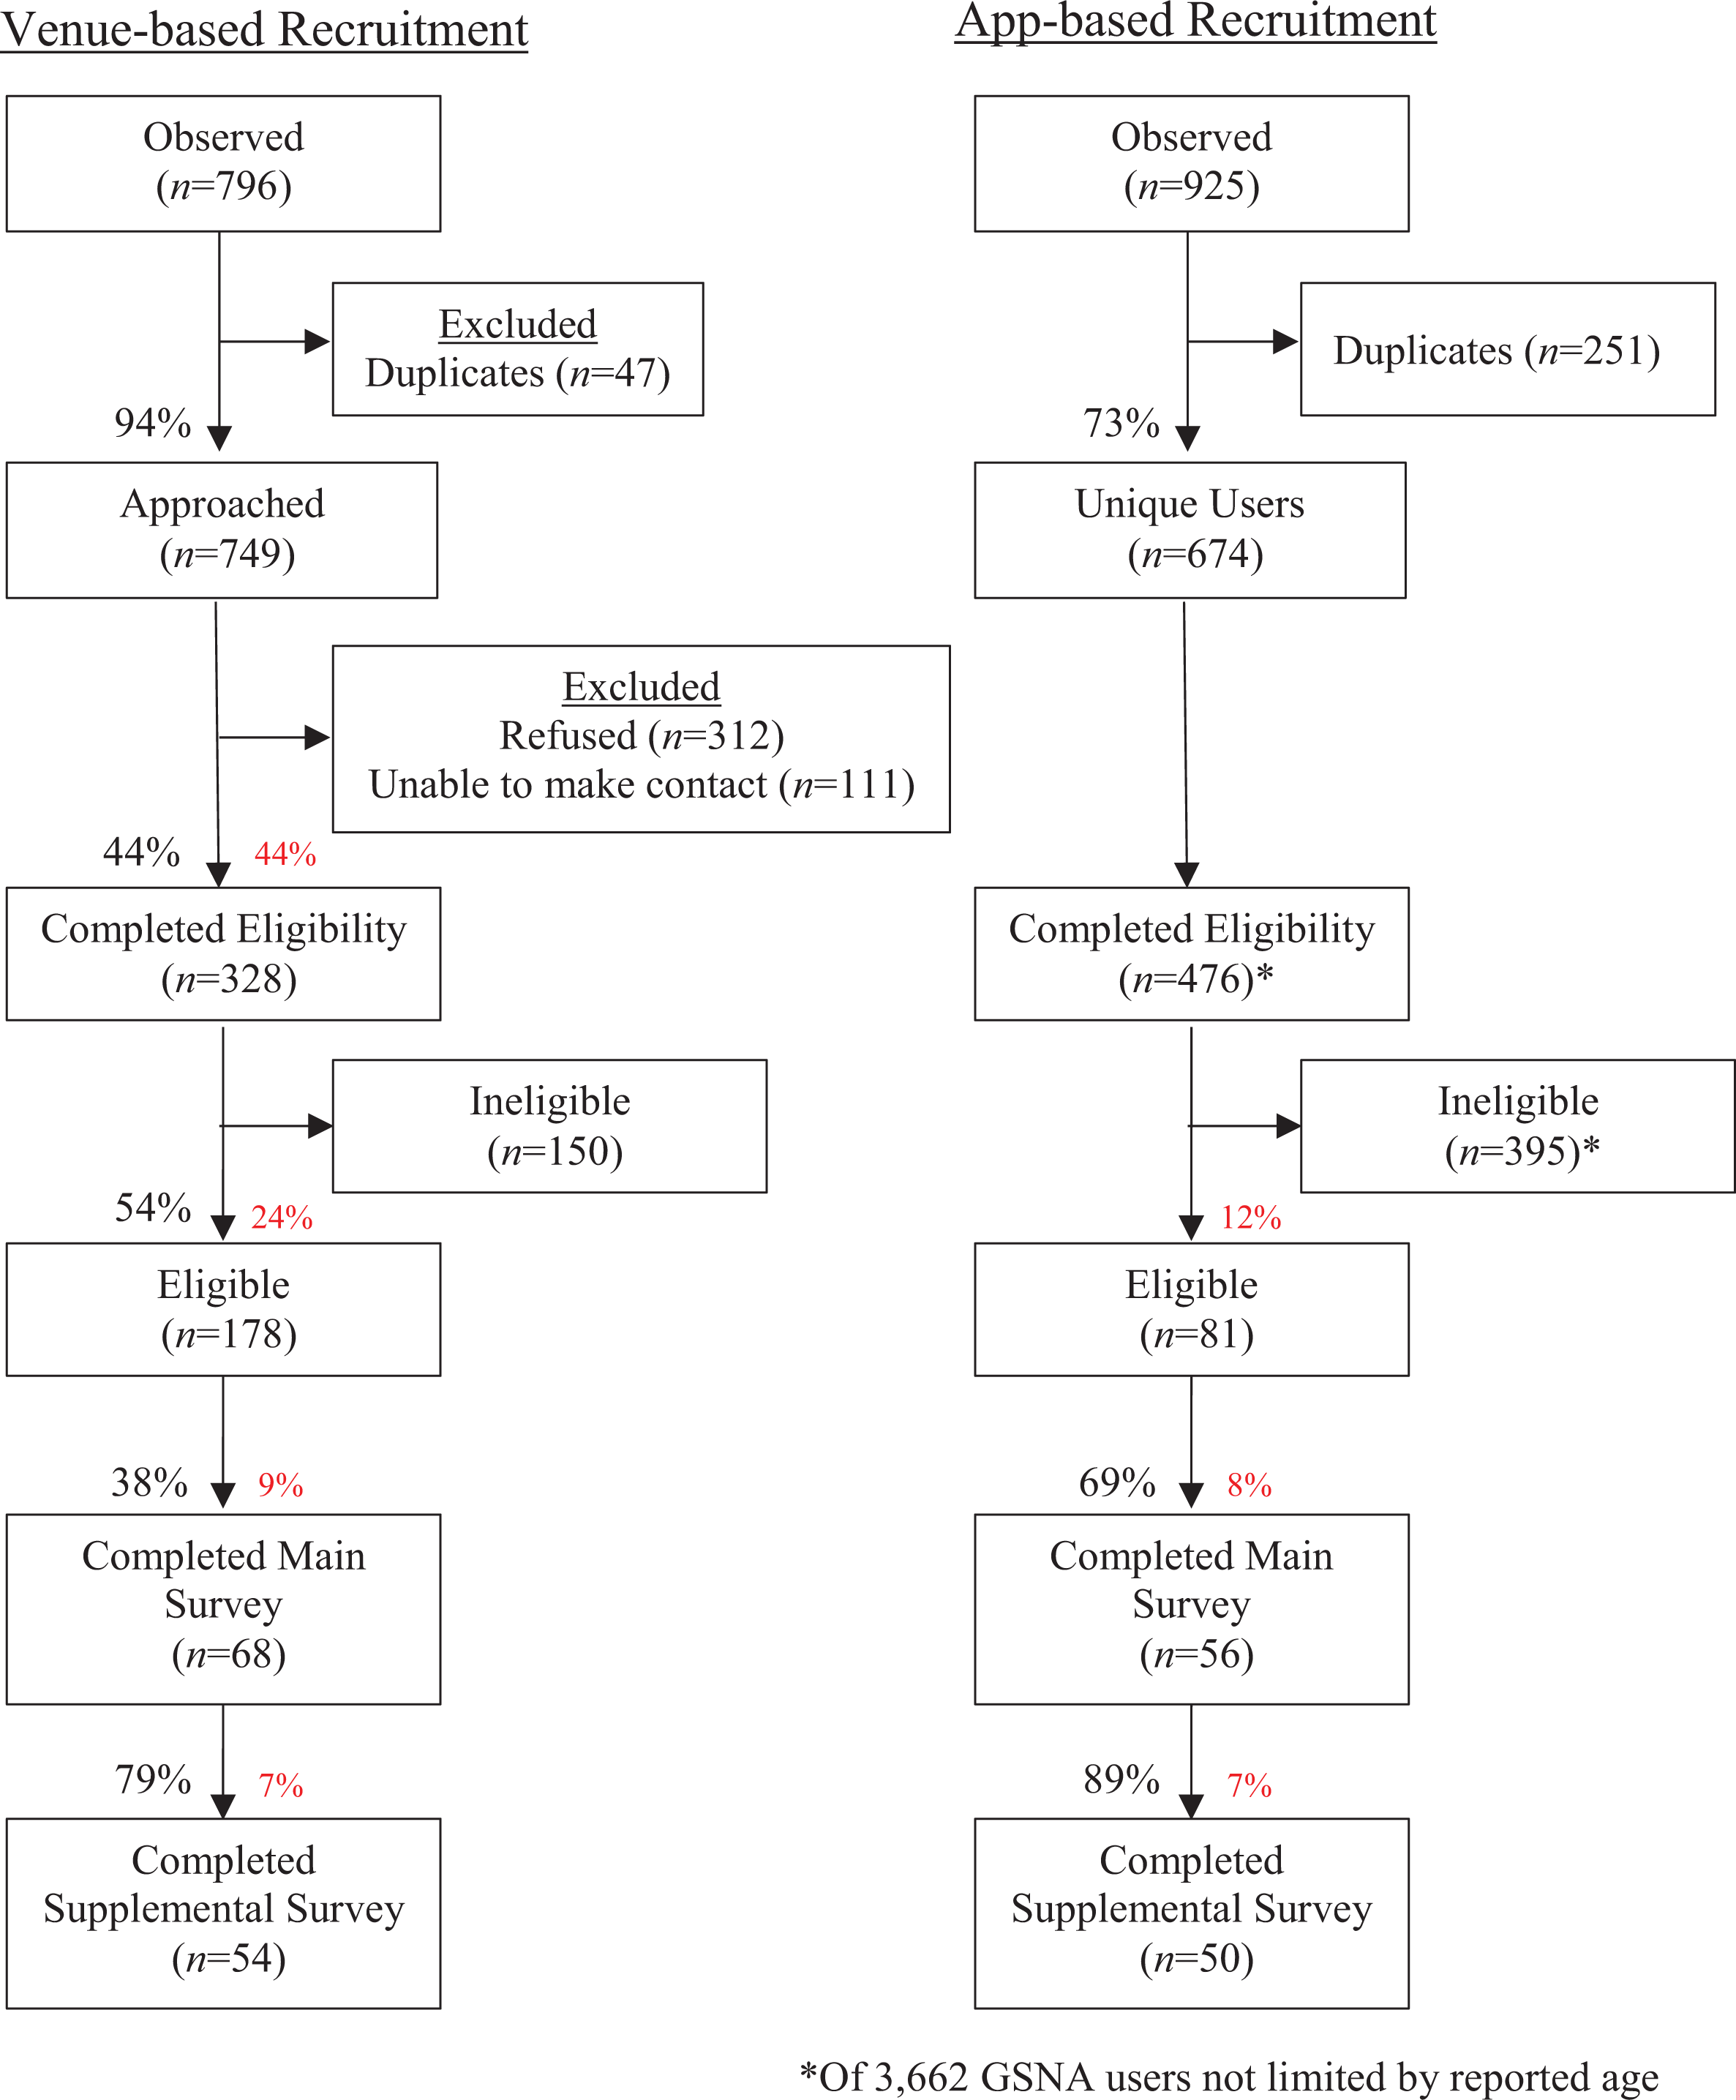
Recruitment flow chart for venue-based and app-based recruitment. Note: Percentages in black indicate the percentage of individuals at the previous stage who moved on to the subsequent stage. Red percentages indicate the percentage of the originally identified potential participants (i.e., approached for venue-based and unique users for GSNA-based) at each stage (e.g., approximately 8% of unique users recruited through the GSNA completed the main survey).
See Table 3 for the six two-sample t-tests and two χ2 analyses used to test for differences between the recruitment periods. Recruitment periods from the GSNA method had significantly (t[22.827] = 3.475, p < .001) more observed potential participants (M = 42) compared to venue-based recruitment periods (M = 13). GSNA-based recruitment periods also had significantly (t[23.441] = 2.582, p < .05) more unique potential participants (M = 31) compared to recruitment periods from the venue-based method (M = 13). This same result (t[26.812] = 4.252, p < .01) was found regarding the number of individuals who completed the screener. Further, GSNA-based recruitment periods had significantly (t[82] = 2.161, p < .05) more participants complete the supplemental survey (M = 1.37) compared to recruitment periods from the venue-based method (M = .92). A χ2 analysis indicated a significant difference between the proportion of recruitment periods in which eight or more unique individuals were observed (i.e., not repeats; χ2[1, 81] = 7.759, p < .01).
Recruitment Period Statistics.

***<.001, **<.01, *<.05.
a Includes all ages of app users (approximately 3,662).
Venue-based recruitment required 1,225 effort hours compared to 284 hours for GSNA-based recruitment (see Table 2). The preparation stage of venue-based recruitment relied heavily on student workers, accounting for 480 of the 669 hours. Overall, a team of six was necessary to complete venue-based recruitment methods, compared to two study team members committed to the GSNA-based procedures.
Recruitment preparation for the venue-based procedures ($13,013.75) cost approximately three times more than the app-based procedures ($4,042.92). Recruitment implementation was almost three times more expensive for the venue-based procedures ($14,619.79) compared the app-based procedures ($5,506.25). Overall, a GSNA-based participant cost $179.43, more than two times less than a venue-recruited participant ($447.67).
We approximated the costs per participant per recruitment method for study sample sizes ranging from 30 to 1,000 individuals. Figure 2 shows that the cost per participant begins to level off at a sample size of 600 participants (venue = $219.68, app = $94.24) and remains steady through 1,000 (venue = $211.63, app = $91.31). Estimates indicate that a venue-recruited participant would cost between 2.31 and 2.58 times more than a GSNA-recruited participant at study sample sizes up to 1,000.

Cost per participant per recruitment method based on the study sample size. Note: The cost per venue-recruited participant was calculated using a formula that accounted for sample size, implementation preparation without pilot testing ($12,074.29), eligibility incentives ($5), rate of those assessed for eligibility versus who completed the study (328/68 = 4.824), participant incentives ($25), and cost per participant for study implementation, excluding incentives ($150.44; Costvenue = [$12,074.29 + (n × 4.824 × $5) + (n × $25) + (n × $150.44)] ÷ n). Similarly, cost per GSNA-recruited participant was calculated using a formula that accounted for sample size, implementation preparation without pilot testing ($2,887.50), broadcast advertisements (estimated at $1,500), a $10 higher participant incentive ($35), and cost per participant for study implementation, excluding incentives ($47.30; CostGSNA = [$2,887.50 + $1,500 + (n × $35) + (n × $51.93)] ÷ n).
Discussion
By comparing recruitment efficiency and costs for two recruitment methodologies, several meaningful findings emerged: (1) app and venue recruitment periods vary in efficiency; (2) both recruitment methods have the same response rate; (3) venue-based recruitment was costlier and more labor intensive; and (4) at all sample sizes, we expect venue-based recruitment to be at least twice as expensive as GSNA-based recruitment.
The ability for each recruitment method to recruit potential participants is not clearly stronger for one method. Venue-based recruitment appears, more successfully, to recruit a larger proportion of eligible potential participants compared to the app-based recruitment. However, app-recruited individuals were more likely to participate in the study. Venue-based recruitment procedures may increase screening of potential participants, whereas app-based recruitment procedures might facilitate completion of the study. It is possible that individuals recruited in-person were more likely to complete the eligibility survey because of issues of social desirability, given that they were personally recruited face-to-face, but may have experienced less pressure to appear socially desirable when completing the study survey online. However, GSNA-recruited potential participants chose to complete the eligibility survey and main study survey given the same level of social pressure (i.e., online social message). These findings are consistent with online survey research showing little evidence for social desirability bias among general populations (Lindhjem and Navrud 2011).
Both recruitment methods achieved an observation to completion response rate of 7%, indicating no difference in the methods. Each method requires observing and approaching approximately 14.29 (i.e., 100%/7%) times the sample size to achieve the target sample. We also evaluated recruitment success using participant living location. Findings indicate that app-based recruitment may more successfully allow targeted recruitment of study area residents rather than individuals who happen to be in the geographic area.
Findings from the financial and hourly cost analysis provide evidence for GSNA-based recruitment as a cost-efficient method for recruiting probability samples of YMSM. Venue-based recruitment required three times the number of effort hours, a study team three times larger, and twice the amount of funds as the app-based procedures. Therefore, GSNA-based recruitment procedures appear largely less burdensome and use fewer resources.
The cost of each recruitment method has meaningful implications for research on YMSM. When the most rigorous method for probability-based recruitment of YMSM has a high cost, researchers have two options: (1) complete few expensive and lengthy probability-based studies; or (2) complete numerous low-cost studies using convenience samples of YMSM that may have limited generalizability. Based on the estimates presented in Figure 2, researchers have a third alternative: GSNA-based probability sampling.
There are several study limitations to note. Although the cost analysis presented in this study is a detailed account of all the costs associated with the research process of completing each recruitment methodology, we excluded other costs (e.g., administrative costs associated with managing the grant funds at the institutional level). Therefore, any future study using these cost estimates should expect additional costs outside of direct research costs. Additionally, costs may vary for GSNA recruitment based on the selected app(s), as GSNAs have different fee structures for advertisements. Beyond limitations, related to how we determined costs, this study was conducted in a large urban area. Therefore, application of these methods and expected costs may vary based on population density. Although venue-based probability sampling procedures could be considerably influenced by implementation in a rural context (due to limited YMSM venues), the procedures and costs associated with GSNA-based probability sampling procedures are expected to be consistent. Further, this study focused on men who are 18–24 years old, application of these methods to and the associated costs for recruiting older men who have sex with men may look different.
Despite these limitations, findings from this study inform several directions for future research. Because we implemented the study in a large urban area in the United States, GSNA-recruitment procedures should be investigated for their feasibility in rural areas of the United States and developing countries. Resources in service-impoverished areas (e.g., rural areas and developing countries) tend to be limited. Therefore, GSNA-based recruitment may reduce study cost in these areas.
Although the aim of this study was to investigate costs of two different recruitment methods, the overarching goal of this study was to have an impact on the health of YMSM. By reducing costs and increasing accessibility of probability-based methods, social researchers can conduct more rigorous research on the factors that contribute to the health outcomes of YMSM.
Footnotes
Acknowledgments
The content is solely the responsibility of the authors and does not necessarily represent the official views of the National Institutes of Health. The authors wish to thank the study team for their commitment to implementation of these rigorous methodologies: John “Jack” Senese, Justin Zhang, Garrett Weskamp, Bryan Hancock, and Spencer Vincente. The authors acknowledge the insightful commentary of the young men who were part of the Community Advisory Board for this research. The authors would also like to thank the venues in Los Angeles and the smartphone application, Hornet, for their agreement to support this study.
Declaration of Conflicting Interests
The author(s) declared no potential conflicts of interest with respect to the research, authorship, and/or publication of this article.
Funding
The author(s) disclosed receipt of the following financial support for the research, authorship, and/or publication of this article: Research reported in this publication was supported by the National Institute on Drug Abuse of the National Institutes of Health under Award Number R36DA041542.