
Abstract
When conducting a postal survey, a traditional recommendation is to use paper postage stamps instead of an automated postage system, to make sure that invitations have a more personal and attractive appearance. In this research note, we investigate whether this traditional recommendation is still valid. In the autumn of 2020, a postal survey was conducted among high-school teachers in Belgium strictly adhering to the Dillman protocol. The overall response rate was 43.4%. Invitations with a real paper postage stamp had a three-percentage points higher response rate (44.9% versus 41.8%), but this difference proved not to be significant. There are no significant gender or age differences between the groups. In addition, the presence or absence of a paper stamp did not influence the respondents’ choice for answering the questionnaire online or on paper, as those who received a stamped envelope were equally likely to choose the online answering tool.
Introduction
Response rates are a crucial concern in the field of survey research (Sun et al. 2020). Self-evidently, one should not equate a response rate with the quality or the representativeness of a survey. But in general, it remains important that researchers are committed to achieve a high response rate to certify the representativeness of their survey effort and to yield a sample size that is sufficiently powered to answer their research questions (Hendra and Hill 2019). For most survey researchers, the Dillman method remains an absolute reference, as this regularly updated volume is considered the standard handbook on how to achieve survey quality (Dillman et al. 2014).
Postal surveys, too, are regarded as a standard procedure to reach out to a representative sample of the general population (Ernst et al. 2018). A general recommendation in survey research is that invitations to participate in a survey should be as personal as possible to make a more convincing appeal to potential respondents (Brick and Tourangeau 2017). The general recommendation is to make the invitation to participate “easy, attractive, social, and timely” for potential respondents (Gooden et al. 2021), and researchers have various instruments at their disposal to induce potential respondents to reply. In the literature, examples have been cited about the use of attractive stationery, including pens, handwritten addresses, and handwritten signatures.
While previous research has discussed many ways of increasing response rates like personalization and offering incentives (Church 1993), in this research note, we focus on just one of these potential tools that did not receive all that much attention in the most recent research literature: the use of postage stamps. In accordance with the Dillman approach, postage stamps are considered an important element in this strategy as they provide a more personal touch to the invitation to participate in the survey (Dillman et al. 2014:371). Since postage stamps are clearly visible for the recipient, the standard assumption is that those who receive the invitation letter will consider the stamp as a more targeted invitation to participate (Limor and Tamir 2021). The rapid transformation of the postal sector, however, has made this traditional format obsolete for a large part of the population as the quantities of traditional mail are rapidly dwindling (Crew et al. 2017). Postal surveys tend to be used less often in the current digital era, although traditionally it was assumed that they still are quite effective (Dillman et al. 2014:351–97). Given the rapid transformation of communication modes, researchers are left with the question whether these more traditional methods to render messages more personal are still valid.
In this research note, we report on the response rate for a postal survey in Belgium that was conducted during the autumn of 2020. The survey was conducted among a random sample of teachers in secondary education (data provided by the Ministry of Education), and it followed the standard Dillman design with an original invitation, a reminder letter after four weeks, and a second reminder with the full questionnaire after another four weeks. The research design, however, included in a purely random manner, a test on the importance of postage stamps in the current era: Half of the potential respondents received an invitation (and up to two reminders) with a traditional postage stamp, while the other half received the invitations with an automatized and stamped postage system. Apart from this, the exact same procedure was followed for all invitations. Following a Dillman approach, it could be assumed that the invitations with a postage stamp would look more personal than the ones with an automatic system (Figure 1).
1
We used standard class 1 postage stamps in Belgium, in this case showing a drawing of summer fruit. More specifically, the stamps included depictions of peach, cherry, strawberry, plum, pear, blackberry, blueberry, raspberry, and gooseberry. It also should be noted that for budgetary reasons, all envelopes contained a standard automatic reply envelope, without any stamps (Harrison et al. 2002; Lavelle et al. 2008; Schmitt et al. 2016). Difference in appearance between postage stamps and no postage stamps.
Data
The data we use in this note stem from a survey conducted among high-school teachers. The survey was part of a larger research project on environmental education in Belgian schools. More specifically, we were interested to know how important sustainable development goals are in secondary education. Therefore, we requested and received from the Ministry of Education a random sample of all teachers who are active in Dutch-language secondary schools; this consisted of 2,000 addresses. The sample included all teachers, so it is important to note that we did not just reach out to teachers who are most likely to pay attention to sustainable development in their classes. We can be confident that we reached out to the full population as all teachers in Belgium (including those active in private schools) are paid directly by the Ministry of Education, and these records were used to draw the sample for the survey. All respondents were then assigned a number ranging from 1 to 2000; respondents with a number between 500 and 1,000 or 1,500 and 2,000 received a stamp on their envelope, while the other respondents did not.
To calculate the correct response rate, it is important to note that some respondents were excluded from the analyses. While the sample was drawn from a register of active teachers, there were some unavoidable mistakes in this register. Some respondents had moved, so the letter went to the wrong address; other respondents were no longer active as teachers. Out of the total number of 2,000 envelopes sent out, 1,942 proved to be a valid address, and this is the number we will use to calculate response rates. There was no variation in the return envelope that was included, as all these were the same free business reply format (Schmitt et al. 2016). The reason for doing so is budgetary: When using return stamps, one has to address stamps to all invitations and return envelopes being sent out, while in the business reply formula, the survey researcher is only being charged for the envelopes actually returning.
Methods
Given the experimental design, we will use bivariate tests to investigate whether there is an effect of including postage stamps on survey envelopes. More specifically, we will conduct chi2-tests to examine differences in distributions between the two treatment groups. Besides differences in overall response rates, we also look at differences in subgroups.
First, we test whether there are any gender- or age-related differences, as postage stamps could be considered as a more traditional format, appealing to an older audience. Unfortunately, we do not have data about the gender and age of all contacted respondents (including those who did not reply), so we cannot investigate the response rates for these groups separately. However, we can analyze the relative distribution between the groups receiving a letter with a stamp and those without a stamp. Given that the allocation of stamps was purely random, it can be expected that the gender- and age-distribution would be equal between the two groups. Hence, if we find any differences in the distribution of the respondents who answered, we can infer that the stamps had a group-specific effect. We use chi2-tests to test for differences in the distribution of gender (as there we have two categories) and t-tests for differences in the distribution of age (as this is a continuous variable).
Second, we will use t-tests to look at differences in self-placement on the general ideological left–right continuum, to test for differences in political stances. Finally, we look at the mode of response. Respondents were offered a choice between two different ways to take part in the survey: They could either send back the completed paper questionnaire using a prepaid return envelope that was included in the invitation, or they could complete the questionnaire online. Given the trend to online polling, it is relevant to examine whether the stamps made respondents more likely to prefer one option over another.
Results
Cross-table Response for Respondents With and Without Stamp.

Note: Entries are absolute numbers, column percentages in parentheses.
The results in Table 1 show that the group of respondents who were contacted by envelopes including postage stamps were slightly more likely to take part in the survey, although with a difference of about three-percentage points, this difference is small. Whereas the response rate for respondents with a stamp amounted to 44.85%, this was 41.83% for the respondents without a stamp. However, this difference is not statistically significant (chi2 = 1.804; p = 0.179) and can therefore not be taken to reflect any real-world differences. 2
Cross-table Mode of Response for Respondents With and Without Stamp.
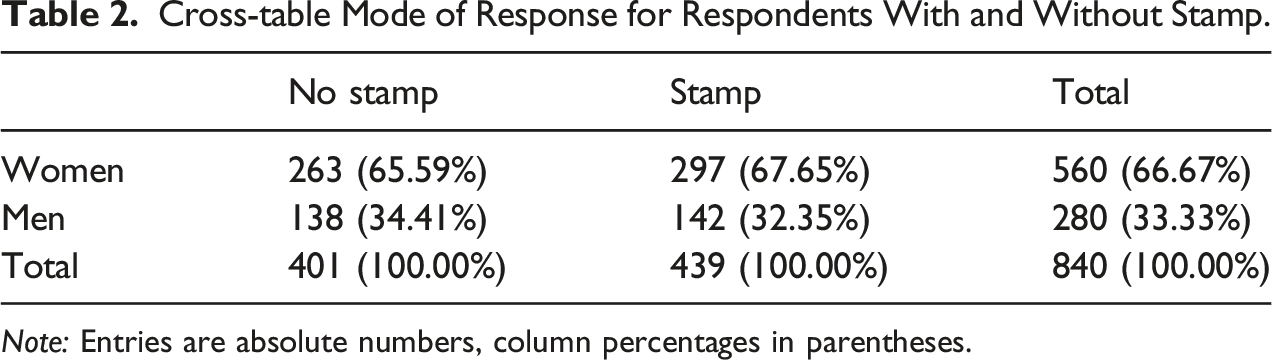
Note: Entries are absolute numbers, column percentages in parentheses.
The results in Table 2 show that, overall, more women took part in the survey than men, and this reflects the composition of the entire teacher population in the country. Looking at the proportions between the groups, there is not much evidence for any differences. While there is a slightly higher proportion of men in the group without a stamp than in that with a stamp, the difference between the groups is not significant (chi2 = 0.403; p = 0.525) and is very small, so we cannot draw any conclusion about this difference.
Second, we look at age differences between the two groups of respondents. The average age in the group without a stamp is 43.94 years old, and in the group with stamp is 43.63 years old; this difference is small and not significant (t = 0.426; p = 0.670). In any case, this means that a preference for stamps certainly is not concentrated among older age groups. As a political variable, we also tested whether there would be any difference between the groups in the respondents’ self-placement on the 0–10 ideological self-right continuum. The average position of the respondents without a stamp is 4.75; that of those with a stamp is 4.58. The difference is not significant (t = 1.362; p = 0.174) and very small in substantive terms as well.
Cross-table Mode of Response for Respondents With and Without a Stamp.
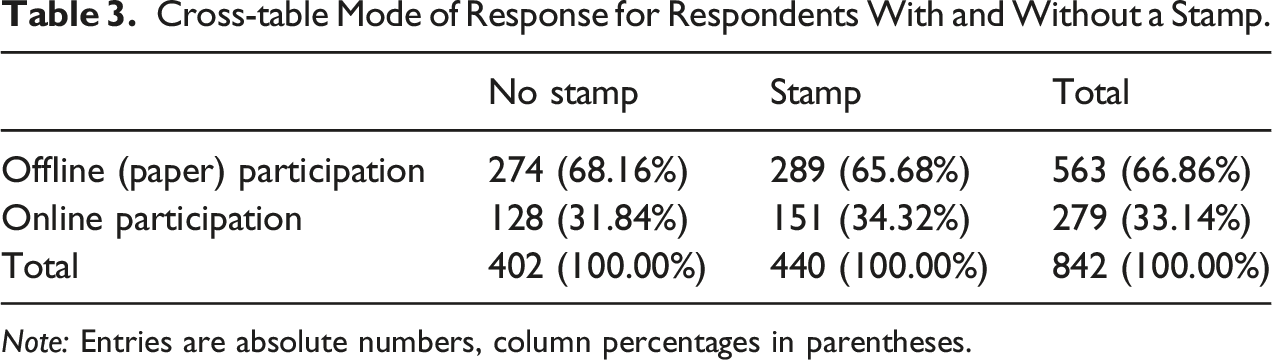
Note: Entries are absolute numbers, column percentages in parentheses.
The results in Table 3 show that respondents receiving a stamped envelope seem to be somewhat more likely to fill out the survey online rather than sending back the paper copy, as 34.32% of the respondents who received a stamped envelope preferred this method, compared to 31.84% of the respondents receiving an envelope without stamp. Nevertheless, these differences are again very small and not statistically significant (chi2 = 0.582; p = 0.446). It seems clear that the “stamp condition” group does not seem to be more traditional or more technology-averse than the “non stamp condition” group.
Conclusion
In this research note, our goal was to ascertain whether traditional recommendations to improve response rates in postal surveys still hold in the current era. Based on a survey conducted in Belgium in 2020, we find no significant rise in response rates when postage stamps are used on invitations. This is in line with the results from previous studies, indicating that the use of traditional methods to increase response rates in postal survey has, at best, a very limited effect (Park and Tsuchiya 2021). In this survey, we recorded a three-percentage point difference in the response rate with or without postage stamps, but this difference was not significant. Future research teams should carefully consider whether they want to personalize invitations in this manner. Using stamps has a personnel cost (our experience is that one person does affix ca. 500 postage stamps/hour). Furthermore, postal authorities might grant more preferential tariffs to anonymous mass mailings, so affixing stamps might induce an additional cost, depending on the specific regulations within a country. While it is tempting to also use stamps on the return envelopes, this does involve a substantial extra cost, as in the business reply formula, the research team is only being charged for the envelopes actually returning. When looking at the respondents in both conditions, we did not find any evidence of significant differences between both groups with regard to age, gender, left–right political position, or the likelihood to opt for an online response. Including a postage stamp or not, therefore, does not seem to be associated with the recruitment of a specific group of the population. What is important is that the effect of postage stamps was not limited to older age groups, so it can be speculated that this effect will remain present in the foreseeable future.
Discussion
The limitations of the current study should be addressed. First, the survey was conducted among high-school teachers, so we should investigate whether a similar effect could be observed for a general population sample, including potential respondents without any higher education credentials. Second, the current study was conducted during a rather massive COVID-19 health crisis in Belgium. This meant that potential respondents were forced to spend more time at home, thus having more time to pay attention to incoming mail and to complete a written survey. We therefore hope that we can repeat the same survey design, in a non-COVID-19 context. Finally, other measures could be taken to increase response rates such as handwritten addresses and personalized letters. In this study, the focus was on the use of stamps, and later research could update the results regarding additional procedures.
In general, however, our recommendation remains that researchers should make every effort possible to maintain high response rates. Structurally, there is a global trend toward declining response rates in population surveys, no matter what precise instrument is being used (Conn et al. 2019). This trend inevitably threatens the external validity, the main reason to conduct survey research in the first place. Even if postage stamps only have a very limited effect on response, this is a step research teams could consider.
Footnotes
Declaration of Conflicting Interests
The author(s) declared no potential conflicts of interest with respect to the research, authorship, and/or publication of this article.
Funding
The author(s) received no financial support for the research, authorship, and/or publication of this article.