
Abstract
Self-assessment measures are commonly used in questionnaire surveys. However, one of the problems with self-reports is that they may be prone to differences in scale usage among respondents. The anchoring vignette method addresses this issue. It relies on two assumptions: response consistency and vignette equivalence. Here we aim to develop a framework for the examination of these assumptions using cognitive interviews and demonstrate it in the Information and Communications Technology (ICT) skills domain. First, we develop new anchoring vignettes describing various ICT skill domains. Second, we examine both assumptions using cognitive interviews with students who are studying different fields. Our analysis shows that the assumptions are indeed not adhered to, especially the assumption of vignette equivalence. Third, we develop a general framework for the examination of the method’s assumptions.
Self-assessment measures of Information and Communications Technology (ICT) skills are commonly used in questionnaire surveys (e.g., Lau and Yuen 2014). Furthermore, the self-assessment of one’s own ICT skills is relevant in everyday situations such as a job application situation (e.g., completing a CV, see European Union 2015). The advantage of such self-report instruments is their low time requirement and the ease of their administration. However, further research is necessary to reduce the current limitations of self-assessment measures.
One of the problems with self-reports that has been identified in the literature is the problem of differences in scale usage among respondents. For example, if we ask two students with the same level of ICT skills to evaluate their skills, these students might assess their skills differently (e.g., one as very good, the other only as good, despite the level of their skills being identical). This might lead us to erroneous conclusions about the actual level of their skills.
The anchoring vignette method has been proposed to reduce the effect of scale use differences (King et al. 2004). The basic principle is that we let respondents not only assess themselves but also make them assess anchoring vignettes depicting certain levels of the measured concept. Since all the respondents assess the same anchoring vignettes, the differences in their rating of the vignettes can be interpreted as the differences in the way they use the scale. This information can be used to adjust their self-assessments for these differences. For the comparison of the anchoring vignette method with some of the previous approaches and shortcomings of the previous models in estimating the cross-population comparable differences in the latent variable, see King et al. (2004) and Tandon et al. (2003).
However, there is a debate currently in vignette research concerning the two underlying assumptions of the anchoring vignette method (e.g., Grol-Prokopczyk 2018; Vonkova et al. 2017), as numerous studies show that these assumptions might be violated (e.g., Grol-Prokopczyk et al. 2015; Peracchi and Rossetti 2013). The first key assumption is response consistency. This requires that each respondent uses the same scale categories when rating him- or herself in self-assessment questions and when rating a hypothetical person in an anchoring vignette. If we compare different respondents and one or more respondents use the scale categories differently in self-assessments and vignette evaluations, the comparison of vignette-adjusted respondents’ self-ratings is misleading.
The second key assumption is vignette equivalence. This requires that all respondents perceive the situation described in the vignette the same way. If respondents interpret vignettes differently, the comparison of vignette-adjusted self-ratings is misleading. Note that even if respondents interpret the situation of a hypothetical person in the vignette the same way, they may rate the hypothetical person differently (i.e., have different standards for rating the described situation in the vignette).
Different sources of the violation of this assumption are currently being discussed in the literature. Bonsang and van Soest (2012) state that in principle, the vignettes should completely describe the domain they refer to. If the domain is not completely described, it may lead to systematic differences in the way the vignettes are interpreted by different groups of respondents. However, there is a trade-off between a vignette’s completeness and its length, since respondents might read the vignettes less carefully if they are too long.
Even though both these assumptions are crucial for the correct functioning of the anchoring vignette method, there has not been enough attention paid to their verification, especially in a qualitative manner. Although there are statistical tests for these assumptions (e.g., Bago d’Uva et al. 2011; Kapteyn et al. 2011), they do not provide for the easy examination of the reasons behind an assumption’s violation nor give suggestions for the reformulation of vignettes based on respondents’ understanding of the vignettes. Further focus on the verification of these assumptions and improving the vignette wording thus appear to be crucial for future development of the method.
Objectives of This Study
Our study aims are: (1) formulation of anchoring vignettes for upper-secondary school students describing various domains of ICT skills based on the DigComp framework; (2) analysis of respondents’ answers to the questions examining the anchoring vignette method assumptions; (3) analysis of students’ characteristics (type of school, grade) in relation to their answers to the questions examining the anchoring vignette method assumptions; and (4) introduction of a framework for the examination of the anchoring vignette method assumptions using cognitive interviews.
Our work builds on the work by Au and Lorgelly (2014), which focused on testing one of the assumptions (response consistency) using in-depth interviews, and made the first step in focusing on these assumptions in a qualitative way. Su et al. (2017) conducted cognitive interviews with Chinese students evaluating anchoring vignettes for measuring vision. They focused primarily on the comparison of vignette questions using noncomparative versus comparative judgments and they formulated recommendations for improving the design of vignette descriptions.
In this study, we extend the current literature by providing a framework for vignette development that focuses on the adherence to both key anchoring vignette method assumptions—response consistency and vignette equivalence. This framework covers the major issues that have been hypothesized to violate the assumptions in the literature (e.g., Au and Lorgelly 2014; Bonsang and van Soest 2012; Vonkova et al. 2017). Using cognitive interviews with respondents, the framework allows both the examination of whether the assumptions are adhered to and reveals the reasons behind the assumptions’ violations. The framework can be used by other researchers to improve the quality of vignettes used in their research, which is a necessary prerequisite for the correct functioning of the method and its further advancement across the social sciences.
Methods
Vignette Formulation
This research in the field of ICT using anchoring vignettes builds on the study of Vonkova and Hrabak (2015). The authors formulated anchoring vignettes for general ICT skills based mainly on the national curriculum of the Czech Republic and did not formulate anchoring vignettes for separate domains like security on the Internet or online communication.
In our current research, we formulate a new set of vignettes focused on general ICT skills and we include vignettes related to the different ICT skill domains identified in the European DigComp document (Ferrari 2013). The DigComp document is a reference framework for digital competencies that defines the concept of digital literacy at an international level. The document identifies five areas of knowledge and skills: information, communication, content creation, security, and problem solving. In each area, there are three user levels: foundation, intermediate, and advanced (Ferrari 2013).
In this study, we develop 18 vignettes in total: (1) we used DigComp’s five areas of ICT competencies, dividing each into three competence levels, resulting in a total of 15 vignettes, each corresponding to a particular competence area and particular competence level in that domain; and (2) we formulated three composite vignettes representing general ICT skills.
Our vignettes, in comparison to the original DigComp descriptions, were shortened. There is a trade-off between the length of the vignettes and the completeness of the provided information. Our aim was to create vignettes that would not be too long for the respondents (upper-secondary school students) but also kept the fundamental information characterizing the respective domains and levels. We also use concrete examples in the vignettes to make them more understandable for the respondents. Finally, we lowered the requirements described in the highest skill level vignettes, the advanced user skill levels described in DigComp, so they were more relevant to upper-secondary students.
Self-assessment Questions and Anchoring Vignettes
Respondents were presented with the vignettes and the self-assessment questions in the following order: (1) the self-assessment questions for general ICT skills and for the domains of ICT skills based on DigComp; (2) the vignettes that described general ICT skills, and the ICT skills in the domains based on DigComp. Just before the evaluation of the anchoring vignettes, the respondents were given the following instruction: “While evaluating be as strict with these people as you are with yourself.” To ensure respondents understand the instructions properly, we can add “(i.e., neither more nor less strict).” Vignette 1 is the vignette describing the lowest level of ICT skills; vignette 3 is the vignette describing the highest level of ICT skills. Respondents were given the vignettes in a randomized order for each domain. All the questions were rated on a 7-point scale ranging from 1 = the lowest level to 7 = the highest level.
Below we give an example of the self-assessment question and a vignette for content creation (see Online Appendix A for a complete list of all the self-assessment questions and anchoring vignettes).
Self-assessment question and Vignette 1 for content creation: What is your level of skill in the following ICT-related domains?… (c) creating and editing documents, tables, pictures, and videos using a computer Vignette 1: Michael creates texts, spreadsheets and presentations using basic functions (e.g., headings, tabs, italics). He also manages to perform the basic editing of pictures and photographs, usually by using the simpler functions suggested by the applications (e.g., enlargement and reduction, rotation).
Interview Questions
Here we list the five key questions we gave our respondents to examine the anchoring vignette assumptions and potentially reveal respondents’ reasons for not supporting the assumptions. Question 1 (Evaluating consistently) Did you evaluate the people in the stories as strictly as you evaluated yourself? (yes, no) If the answer was no, respondents were further asked: What was the reason and in which cases were you stricter? Question 2 (No adding of info) Did you have to imagine anything additional to be able to evaluate the people in the stories? (yes, no) If the answer was yes, respondents were further asked: What additional information did you have to imagine? Question 3 (No skipping of info) Did you always read the whole story? (yes, no) If the answer was no, respondents were further asked: What was the reason? Question 4 (Understanding of words) Did you understand all the words and concepts in the stories? (yes, no) If the answer was no, respondents were further asked: Which word or concept was not clear to you? Question 5 (Picturing situations) Were you able to picture a student in the concrete situations in the stories? (yes, no) If the answer was no, respondents were further asked: What situation or part of it were you unable to picture?
Participants and Data Collection
Our ICT vignettes are targeted at secondary school students (ISCED 3) with different expected ICT backgrounds. Specifically, we included students from both ICT and non-ICT schools. At each type of school, we interviewed students in their initial year (age 16) and final year (age 19). In total, we completed 38 interviews.
For ICT schools, the mandatory minimum number of lessons on ICT-related subjects is set at 35 so-called week lessons. A week lesson means that the subject is taught once a week across the whole school year. The number indicates the number of week lessons across the four-years of study. For non-ICT schools, the number of lessons on ICT-related subjects is significantly lower. For the schools of pedagogy we focus on, the mandatory minimum number of lessons on ICT-related subjects is set to five-week lessons (see Ministry of Education, Youth and Sports, & National Institution of Technical and Vocational Education 2010). Note that the population of the students at the two types of schools that we target in our study is specific in terms of gender as at ICT schools there is a majority of boys (in our sample, we have 86.3% boys at the ICT school), and at pedagogy schools there is a majority of girls (in our sample, we have 93.8% girls).
Before the interviews, students evaluated themselves and the people described in the vignettes. Students were questioned immediately after they had finished this evaluation. One interview took on average seven minutes. The interviewer read the five questions related to the verification of the anchoring vignette assumptions and made notes of the students’ responses. The questions were also given to the students, written on a piece of paper, so they could read them themselves at the same time for a better understanding.
Results
An Overview of the Answers to the Questions Examining the Assumptions
Table 1 summarizes the percentages of respondents who give a supportive answer to the interview questions designed to examine the anchoring vignette method assumptions.
The Percentages of All Respondents Supporting Response Consistency and Vignette Equivalence Based on the Five Verifying Questions.
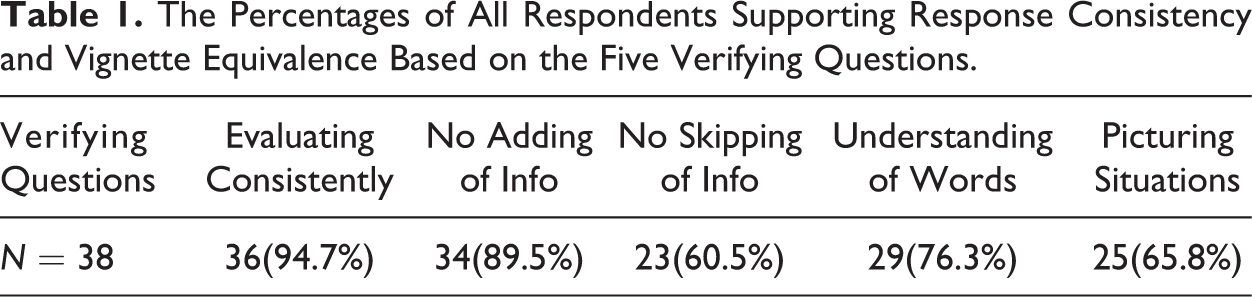
The most supportive answers were given to the question about being equally strict when evaluating themselves and the hypothetical individuals described in the vignettes. Almost all (94.7%) of the respondents said that they were always equally strict. Also, 89.5% of the respondents confirmed that they did not need to imagine anything additional. Further, the majority of the respondents did not have any difficulties with understanding the words used in the vignettes (76.3%). However, about one-fourth of the respondents expressed some difficulties with certain words.
The least supportive answers were in the questions about information skipping and situation picturing. Only 60.5% of the respondents claimed that they read the whole text and did not skip anything in the vignettes, and 65.8% of the respondents were able to picture a student in the concrete situations that were described in the vignettes.
The students were asked a follow-up question concerning the reasons for their answers (see Online Appendix B for more details).
Two students (5.3%) said that they were not equally strict when evaluating themselves and the people described in the vignettes. One student was stricter to him- or herself in the security domain, while the other was stricter to the vignette person in the problem-solving domain.
Four students had to imagine something additional to evaluate the people described in the stories. For example, for the content creation domain, two students noticed that they would need more information about editing videos, one of these students then also noticed in the safety domain that he would need more information about virus-scanning programs.
Fifteen students admitted that they did not read the vignettes in their entirety. Five said they did not read the last sets of vignettes because the whole text was too long for them. Another five read only the words that seemed important to them to understand the vignette’s main point. Five students stated that they did not read the entirety of certain vignettes in the general ICT skills and the safety domains.
Nine students claimed that they did not understand some words and concepts in the stories. These words were mainly technical (e.g., DropBox). One student did not understand the abbreviation ICT.
Thirteen students claimed that they were unable to picture a student in the concrete situations described in the vignette stories. Nine students claimed that the vignettes describing the highest level of skills in specific domains were too advanced (six for content creation). Three students said that it was, in general, hard for them to imagine the vignettes describing the highest or the lowest skills (irrespective of the domain). Also, one student said that it was hard to picture a vignette in the communication domain. For more comprehensive analysis of the responses to the verification questions using cluster analysis and the typology of respondents based on their support of the assumptions, see Online Appendix C.
An Analysis of the Answers of the Different Groups of Respondents
In Table 2, we present estimated logistic regression parameters for all five verifying questions. Explanatory variables are type of school (1 = ICT school, 0 = non-ICT school) and grade (1 = fourth grade, 0 = first grade).
Estimated Logistic Regression Parameters for All Five Verifying Questions and All Four Clusters.

Note. * p < 0.05. ** p < 0.01. Standard errors in brackets.
Concerning student grade, there is one significant difference between the first and the fourth graders. First grade students were more likely than fourth grade students to add additional information when evaluating the vignettes (β = 0.216, SE = 0.098).
Concerning the school type, students not studying ICT were significantly more likely to report that they did not understand some words and concepts in the vignettes (β = 0.593, SE = 0.108).
Discussion
Respondents’ Answers to the Verification Questions
Our analysis revealed that the most supportive answers were given to the question related to the response consistency assumption. Keeping the vignette equivalence assumption is more challenging than keeping the response consistency assumption. This is basically in line with the literature (e.g., Grol-Prokopczyk 2018; Kapteyn et al. 2011).
In the case of our study, it is possible that using an explicit instruction supporting the response consistency assumption (asking respondents to be as strict with people in the vignettes as they are with themselves) might have led to results where this assumption is upheld for the vast majority of the respondents. In further studies, it would be interesting to run experiments where respondents would have different instructions for evaluating the vignettes, some of them directly supporting the vignette equivalence assumption.
The least supportive answers were given to the questions about skipping information in the vignettes and the ability to picture a student in the situations described, which is not supportive of the vignette equivalence assumption. Concerning the reasons for skipping information, the students mentioned that they were not reading the last set of vignettes properly since there were too many of them. It might be more efficient to construct the questionnaire only for certain selected domains.
Regarding difficulty picturing the situation, the respondents mostly stated that the level of ICT skill described in the vignettes was unrealistic for students. However, this does not directly mean that they are not able to picture the concrete level of skill. They were just not able to imagine a student being capable of it, even though they might be able to imagine an adult in the situation. With this in mind, we would suggest reformulating the interview question slightly in the following way: Were you able to picture a person in the concrete situation in the stories? In short, replace “a student” with “a person.” We can still test the impact of this change from student to person on response consistency and vignette equivalence adherence in experimental design.
Concerning the understanding of the words in the text, about a fourth of the students said that they did not understand some words in the stories. Specifically, they highlighted technical terms. However, we would argue that these examples may help other students picture the situations and, therefore, support vignette equivalence. With this in mind, we do not suggest simply not giving any examples at all. It might be better to replace them with other examples that the students know (and ask them whether they know the specific word during the cognitive interviewing). In future studies, researchers might further inquire about what strategies respondents employ to deal with the unknown words/concepts when evaluating anchoring vignettes (e.g., whether they try to imagine what the unknown words might mean or whether they skip the words/passages of the vignettes).
Suggested Changes to the ICT Anchoring Vignettes in our Study
Regarding the vignettes used in this study, we recommend the following corrections based on the analysis of respondents’ answers: (1) replacing unknown words and concepts from our vignettes (like DropBox) with words and concepts more familiar to the respondents; (2) lowering the level of ICT skills in the highest vignette for the content creation domain so it does not appear too advanced to the respondents; (3) shortening the vignettes so that they are not too long for the respondents (or using only a limited number of them).
A General Framework for the Formulation and Verification of Anchoring Vignettes
A similar approach to the one we have used in this study may be used by other researchers. We suggest the following general framework for the formulation and examination of anchoring vignettes (for the visualization of the framework see Figure 2 in Online Appendix D). Step 1—Students providing self-assessment and vignette evaluations
Students read and evaluate the vignettes and provide their self-assessment in the domain of interest. Step 2—Students being interviewed using the verification questions
Students are interviewed with their questionnaire at hand, one by one, using the verification questions:
1. Did you evaluate the people in the stories as strictly as you evaluated yourself? (yes, no)
To ensure respondents understanding of the question, researchers may want to consider further refining the question by “(i.e., neither more nor less strictly).”
Answer no: What was the reason and in which case were you stricter?
2. Did you have to imagine anything additional to be able to evaluate the people in the stories? (yes, no)
Answer yes: What additional information did you have to imagine?
3. Did you always read the whole story? (yes, no)
Answer no: What was the reason?
4. Did you understand all the words and concepts in the stories? (yes, no)
Answer no: Which word or concept was not clear to you?
5. Were you able to picture a person in the concrete situations in the stories? (yes, no)
Answer no: What situation or part of it were you not able to picture?
Note that in comparison to the formulation of the fifth verification question in our study (see Methods section), we suggest in our framework that researchers in the future use the formulation “picture a person” instead of “picture a student” as discussed above. Step 3—Researchers analyzing the data to determine the reasons for non-supportive answers
Resulting from step 3, there are two possible outcomes. The first outcome is when analysis of the interviews reveals that there are important and relevant shortcomings in the current formulation of the vignettes. In this case, the researchers should proceed to step 4.
The second outcome is when the analysis of the interviews reveals that there are no important or relevant shortcomings in the vignette formulation. In this case, the process of vignette formulation refinement through cognitive interviews ends and the researchers can proceed to the use of the vignettes in further research, possibly testing their adherence to the assumptions on a larger sample by using the statistical tests of response consistency and vignette equivalence suggested in the literature (e.g., Bago d’Uva et al. 2011; Kapteyn et al. 2011). Step 4—Researchers reformulating the vignettes based on the analysis
The researchers reformulate the vignettes based on the analysis in step 3. The close analysis of the participants’ comments and the reasons for their non-supportive answers can serve as a basis for the reformulation of the vignettes. Then the researchers go back to step 1 and go through the procedure again.
Limitations of the Study
Our study has certain limitations that should be addressed in future research. First, we created five interview questions that cover the major issues that have been hypothesized to be the sources of the violations of the method’s assumptions in the literature (e.g., Au and Lorgelly 2014; Bonsang and van Soest 2012; Vonkova et al. 2017). Future research could elaborate on these five questions and refine our general framework. One potential verification question, which might extend our framework in the future, could concern the case when vignettes describe multidimensional concepts. In this case, respondents might be asked whether some parts of the vignettes “stood out” for them while being read or if some parts more strongly influenced their evaluation than other parts. This could lead to the violation of the vignette equivalence assumption.
It might also be that respondents in different cultures will differ in their understanding of certain words in the vignettes, as in nursing home (Pan and Fond 2014). This issue should be primarily solved by researchers who should avoid using these potentially biased words. Researchers could also ask the respondents to explain these words during the interview and then examine the differences in the understanding of these words.
Second, we recommend that researchers, after using cognitive interviews, further examine the adherence to the assumptions on a large-scale sample by using the statistical tests presented in the literature (e.g., Bago d’Uva et al. 2011). Although reasons for assumption violations and suggestions for the reformulation of vignettes based on respondents’ understanding of the vignettes are hard to examine by statistical testing, it allows for the testing of the adherence of the assumptions on large samples and can show us whether the assumptions are adhered to by the whole sample or a specific subsample (e.g., defined gender). For example, Kapteyn et al. (2011) suggested the following test of response consistency. In the first wave of large-scale data collection, the respondents were asked questions on sleep-related problems. This information was used by researchers in the second wave of data collection to create a replica vignette—one in which the hypothetical person has exactly the same sleep-related problems as the respondent. If response consistency is supported, then the replica vignette evaluation and self-assessment are, except for some auxiliary assumptions, equal.
It is indeed possible that further statistical testing will reject the adherence to the assumptions. The reasons for this might be “external” to the vignette formulation. For example, one of the reasons might be the specifications of the model used for testing the assumptions (the CHOPIT model is typically used as a framework for the statistical testing and it has specific parametric assumptions which may be violated; see, e.g., van Soest and Vonkova 2014). There might also be other reasons for the rejection of the adherence—the order of the questions in the questionnaire, the way the data collection was conducted etc. For example, the violations of the assumptions might occur to a different degree in interview and paper-based questionnaire surveys. It would be worth investigating how the different administration formats support or undermine adherence to the assumptions.
Of course, the reason for the rejection of the adherence to the assumptions could still be the inappropriate formulation of the vignettes. For example, respondents from different cultures might understand a certain word or a concept in the vignettes differently, as already discussed. Researchers thus might consider conducting the cognitive interviews again, possibly extending our framework for other questions.
Third, our study was conducted on a sample of 38 students from two different types of Czech schools (ICT-oriented study program, pedagogy-oriented study program). Using our framework to examine our anchoring vignettes on a larger sample and with students from other types of Czech upper secondary schools could bring new perspectives on students’ understanding of our vignettes and their adherence to the anchoring vignette method assumptions.
Conclusion
The anchoring vignette methodology holds great promise for improving the comparability of respondents’ self-reports. However, close attention must be paid to its correct application and the formulation of vignettes so as not to violate its basic assumptions. This article represents an important step in refining the qualitative approach to anchoring vignette development, contributing to the proper use of the method across different research fields where the method can be applied.
Supplemental Material
Supplemental Material, sj-pdf-1-fmx-10.1177_1525822x21991281 - Developing a Framework for the Examination of Anchoring Vignette Assumptions Using Cognitive Interviews: A Demonstration in the ICT Skills Domain
Supplemental Material, sj-pdf-1-fmx-10.1177_1525822x21991281 for Developing a Framework for the Examination of Anchoring Vignette Assumptions Using Cognitive Interviews: A Demonstration in the ICT Skills Domain by Hana Vonkova, Jan Hrabak, Katerina Kralova and Ondrej Papajoanu in Field Methods
Supplemental Material
Supplemental Material, sj-pdf-2-fmx-10.1177_1525822x21991281 - Developing a Framework for the Examination of Anchoring Vignette Assumptions Using Cognitive Interviews: A Demonstration in the ICT Skills Domain
Supplemental Material, sj-pdf-2-fmx-10.1177_1525822x21991281 for Developing a Framework for the Examination of Anchoring Vignette Assumptions Using Cognitive Interviews: A Demonstration in the ICT Skills Domain by Hana Vonkova, Jan Hrabak, Katerina Kralova and Ondrej Papajoanu in Field Methods
Footnotes
Declaration of Conflicting Interests
The author(s) declared no potential conflicts of interest with respect to the research, authorship, and/or publication of this article.
Funding
The author(s) disclosed receipt of the following financial support for the research, authorship, and/or publication of this article: This study was supported by a grant by the Czech Science Foundation through the project “Factors influencing the ICT skill self-assessments of upper-secondary school students” (17-02993S).
Supplemental Material
Supplemental material for this article is available online.
References
Supplementary Material
Please find the following supplemental material available below.
For Open Access articles published under a Creative Commons License, all supplemental material carries the same license as the article it is associated with.
For non-Open Access articles published, all supplemental material carries a non-exclusive license, and permission requests for re-use of supplemental material or any part of supplemental material shall be sent directly to the copyright owner as specified in the copyright notice associated with the article.