




Abstract
Food insecurity (FI) is often assessed through experienced-based measures, which address the number and extent of coping strategies people employ. Coping indices are limited because, methodologically, they presuppose that people engage coping strategies uniformly. Ethnographic work suggests that subgroups experience FI quite differently, meaning that coping strategies might also vary within a population. Thus, whether people actually agree on FI coping behaviors is an open question. This article describes methods used to test whether there was a culturally agreed on set of coping behaviors around FI in rural Brazilian majority-female heads of household, and to detect patterned subgroup variation in that agreement. We used cultural consensus and residual agreement analyses on freelist and rating exercise data. This process could be applied as a first step in developing experience-based measures of FI sensitive to intragroup variation, or to identify key variables to guide qualitative analyses.
Since the 1972–1974 global food crises, food insecurity (FI) has emerged as a key outcome measure in nutritional anthropology and public health nutrition (Barrett 2010). Prior to the mid-1970s, the focus was on simple caloric inadequacy—or hunger (Carlson et al. 1999; Radimer et al. 1990). FI is a much broader concept than hunger, addressing several domains at once: anxiety and uncertainty about food access, insufficient food quality (including variety, preference, and social acceptability), and insufficient food intake and its physical consequences (Leroy et al. 2015). Experienced-based measures of FI excel in their capacity to capture the non-nutritional aspects of FI and are easy use, compared with burdensome dietary recall or nutritional assessments, and for this reason, they have been widely adopted.
Experience-based measures usually assess the coping strategies people employ to deal with FI. Maxwell and colleagues (1999, 2003) developed the pioneering Coping Strategies Index (CSI) based on the premise that coping behaviors were an easy-to-assess proxy measure of FI. The field manual for the CSI recommends focus group discussions to identify locally specific coping behaviors and their severity (Maxwell et al. 2003), but the adaptation process includes no local validation or assessment of intracultural agreement. This approach may lower the threshold for adaptation and use of the instrument across settings, but it potentially sacrifices data quality—a familiar tradeoff across the social sciences (Weaver and Kaiser 2019).
Tools like the CSI work from an underlying assumption that all people in a given community follow a uniform progression of behavioral modifications that are consistently tied to FI. That assumption, to our knowledge, has not been empirically tested. But the anthropological literature demonstrates that risk of FI varies by demographic group, even within the same household (Coates et al. 2006, 2010; Hadley et al. 2008; Maxfield 2019). Social consequences, too, such as increased peer teasing among youth, limitations in daily activities among elders, and gender- or age-specific buffering or vulnerability, vary by subgroup (e.g., Bernal et al. 2016; Gundersen and Ziliak 2015; Hadley et al. 2008). This suggests that intracultural variation in FI experiences likely exists but may get lost if measures assess only a single set of coping behaviors for an entire population.
In this article, we describe a procedure used in rural Brazil first to assess whether people could identify a set of widely recognized behavioral changes tied to FI. Second, we explored potential intracultural variation within that agreement. Establishing whether people agree about a set of food-related behaviors that are diagnostic of FI, and exploring if they vary intraculturally, is an important first step to support arguments for nuanced cultural adaptation of FI measures. With some additional steps, these methods could actually be used to develop locally adapted tools. The approach described here might also be used to structure qualitative analyses around questions of FI, as we demonstrate below.
Study Context
Objectives and Approach
The study assessed whether people share ideas about appropriate food-related behaviors and how those behaviors might change with FI in rural northern Brazil, one of the country’s “hot-spots” for FI (Kilpatrick 2011). The goal was not to assess actual food consumption, but rather behaviors around procurement, preparation, and sharing practices—or what we refer to as “context of consumption” (CoC). Existing evidence suggests that ideas about dietary preference and acceptability differ between class groups in Brazil (Newkirk et al. 2009; Oths and Dressler 2018), so we anticipated some intracultural variation in any shared understanding that might emerge.
Setting
The research was conducted in a rural community of about 600 households with a high level of FI (Weaver et al. 2019). The community was formally established in the 1990s by the Movimento dos Trabalhadores Sem Terra (MST; Landless Workers’ Movement) to procure small plots of land for subsistence farming. The population is almost exclusively caboclo (mixed European and Indigenous) or Afro–Brazilian in ancestry. In the last 20 years, market integration and government subsidies have promoted cattle ranching, and, along with this, has come a rapid and nearly total shift from subsistence to purchased foods. Most families now engage in ranching or wage labor rather than subsistence farming to meet their daily needs. Many households are female headed, as men often migrate out of the isolated community to find work. Nearly half of the community relies on Bolsa Familia, a federal direct-cash-transfer program. Most households have a refrigerator, electricity, and a small water storage tank.
Ethical Considerations
All research procedures were preapproved by the University of Alabama Institutional Review Board, and at the country level, by written permission of elected community officials because there was no community-affiliated IRB. Individuals provided verbal informed consent prior to participation in the study.
Research Methods: Sampling and Data Collection
This study consisted of two research phases. The first involved freelist interviews to identify a set of CoC behaviors, while the second consisted of rating exercises to assess how people perceived relationships between those behaviors and varying levels of FI. Both phases used simple random sampling by household number. Potential participants were excluded if they were incapable of understanding and responding to the questions because of any impairment, or if they were not at home after three repeat visits at different times of day. We interviewed heads of household because these tended to be the individuals who were most familiar with household food choices and management.
In the first phase, 40 randomly selected heads of household participated in a freelisting interview where they were asked to list ways a person might be able to tell if someone either did or did not have enough to eat in this community just by looking at them (i.e., without discussing it directly). After standardizing the language around people’s responses with the input of local research assistants who had been trained extensively in cognitive interviewing, there were 116 candidate items (73 for FI and 43 for food security). Since we were looking for commonly shared items, we retained terms that were mentioned by three or more people (there is no standard cutoff for this criterion). This reduced the list to 40 terms. Finally, we reviewed the items with the research assistants and key informants, removing those they deemed unclear, very rare, or so common that nearly everyone would experience them. This resulted in a final list of 29 CoC items that were retained for inclusion in the cultural model.
In the second phase, we conducted rating exercises with a new sample of 62 randomly selected heads of household. Participants were asked to rate each of the 29 CoC items as characteristic of a person who: (1) is very food secure/wealthy; (2) is food secure/well off, but not rich; (3) has a little bit of FI/is from a humble family; or (4) has a lot of FI/is very poor. These prompts included descriptors around both FI and poverty because “food insecurity” (insegurança alimentar) was not a common colloquial term. The interview prompts were carefully designed to specify that we were talking about poverty or wealth vis-à-vis food-related behaviors to avoid conflating FI with other aspects of poverty.
To access larger ideas shared across the community, respondents in both phases were instructed to answer based on what people in the community in general would think, not only their personal opinion (Borgatti 1998). In both phases, we also conducted a brief standard FI assessment using a modified version of the Brazil-validated USDA FI Module (Pérez-Escamilla et al. 2004). This involved reducing the instrument from the original 15 questions to six by collapsing repeat items about varying levels (individual, household) and age ranges (children, adults) into single questions about the aggregate household experience, since we did not need to disaggregate personal and household FI. We interpreted one positive response as indicating moderate FI and two or more positive responses indicating severe FI. We also recorded respondent age, marital status, number of children, and household composition.
In addition to these quantitative assessments, we collected qualitative data from voice recordings of the freelist and rating interviews and field notes from participant–observation. This resulted in over 18 hours of voice recorded interviews, which we translated and transcribed for qualitative analysis. Participant–observation involved talking to people about popular recipes, attending parties where food was served, interviewing local shop owners about food purchasing (and purchasing our own food), learning to cook local dishes, eating at friends’ and neighbors’ houses, preparing and sharing our own dishes, and helping in home food production (e.g., kitchen gardens, small-scale apiculture).
Analytic Methods
Quantitative Analyses
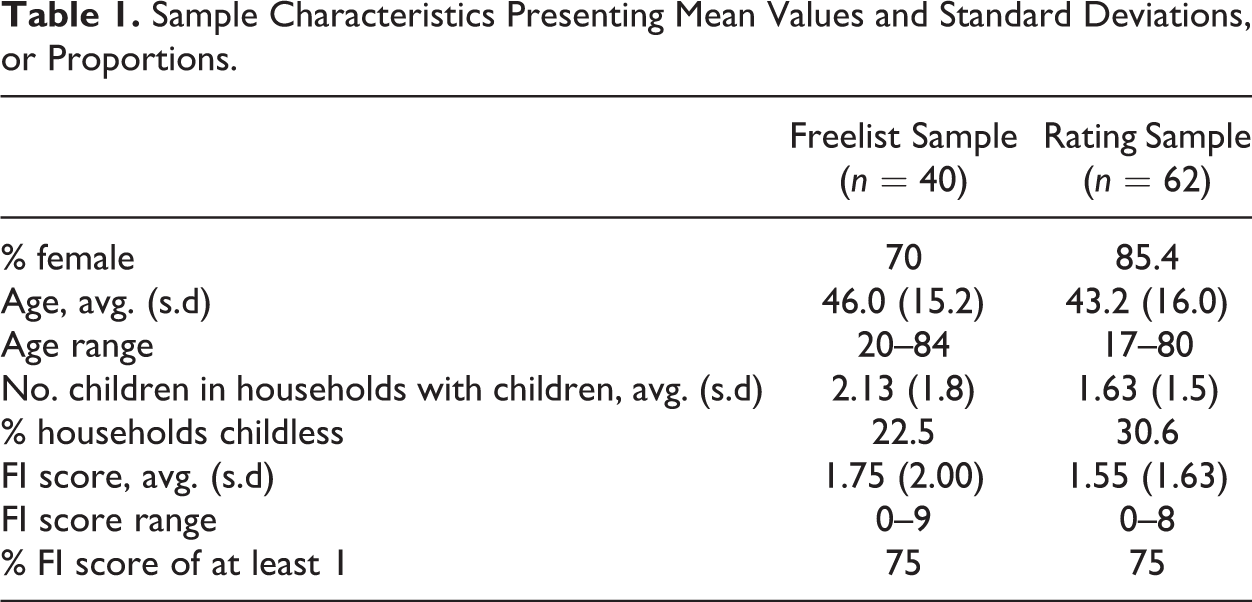
We performed basic univariate and bivariate analyses to assess sample demographics in Phase 1 and 2 samples. The average FI score was 1.8 (SD 2.0, on a score with possible range 0–12) for the freelist sample and 1.6 (SD 1.6) for the rating sample, indicating relatively low level but widespread FI using our modified scoring system. The sample was heavily biased toward women, reflecting the high prevalence of female-headed households (see Table 1).
Sample Characteristics Presenting Mean Values and Standard Deviations, or Proportions.
Cultural consensus analysis: Is there a shared model of context of consumption?
To assess whether participants were drawing from a shared cultural model of CoC, we performed cultural consensus analysis (CCA) on the Phase 2 rating data in Anthropac 4.0 software. Anthropac is a free DOS menu-driven software package. CCA utilizes factor analytic methods, treating individual response profiles as variables rather than cases (Romney et al. 2000). We uploaded a .txt file with the matrix of responses to the rating tasks into Anthropac and selected the informal (or “interval” in Anthropac) method for numeric scale data. Anthropac produces several outputs that can be used to judge the degree of sharing and content of the cultural model. When there is significant agreement, the first extracted factor explains most of the variation between individual responses, while the second captures the patterned agreement that remains once the overall consensus has been accounted for. CCA also produces competence coefficients for each individual, representing the extent to which the individual is knowledgeable in the cultural model.
Conventionally, researchers consider an eigenvalue ratio between the first and second factor greater than 3:1 to indicate that there is a shared cultural model, especially when that ratio is accompanied by a large average competence value (Romney et al. 1986). In our data, there was a large first-to-second Eigenvalue ratio (9.97:1), indicating strong consensus around CoC items. The mean competence was also large and standard deviation low (m = 0.81; SD 0.10), indicating that participants genuinely shared in their knowledge and did not happen upon the same responses due to “luck” (Hruschka and Maupin 2013).
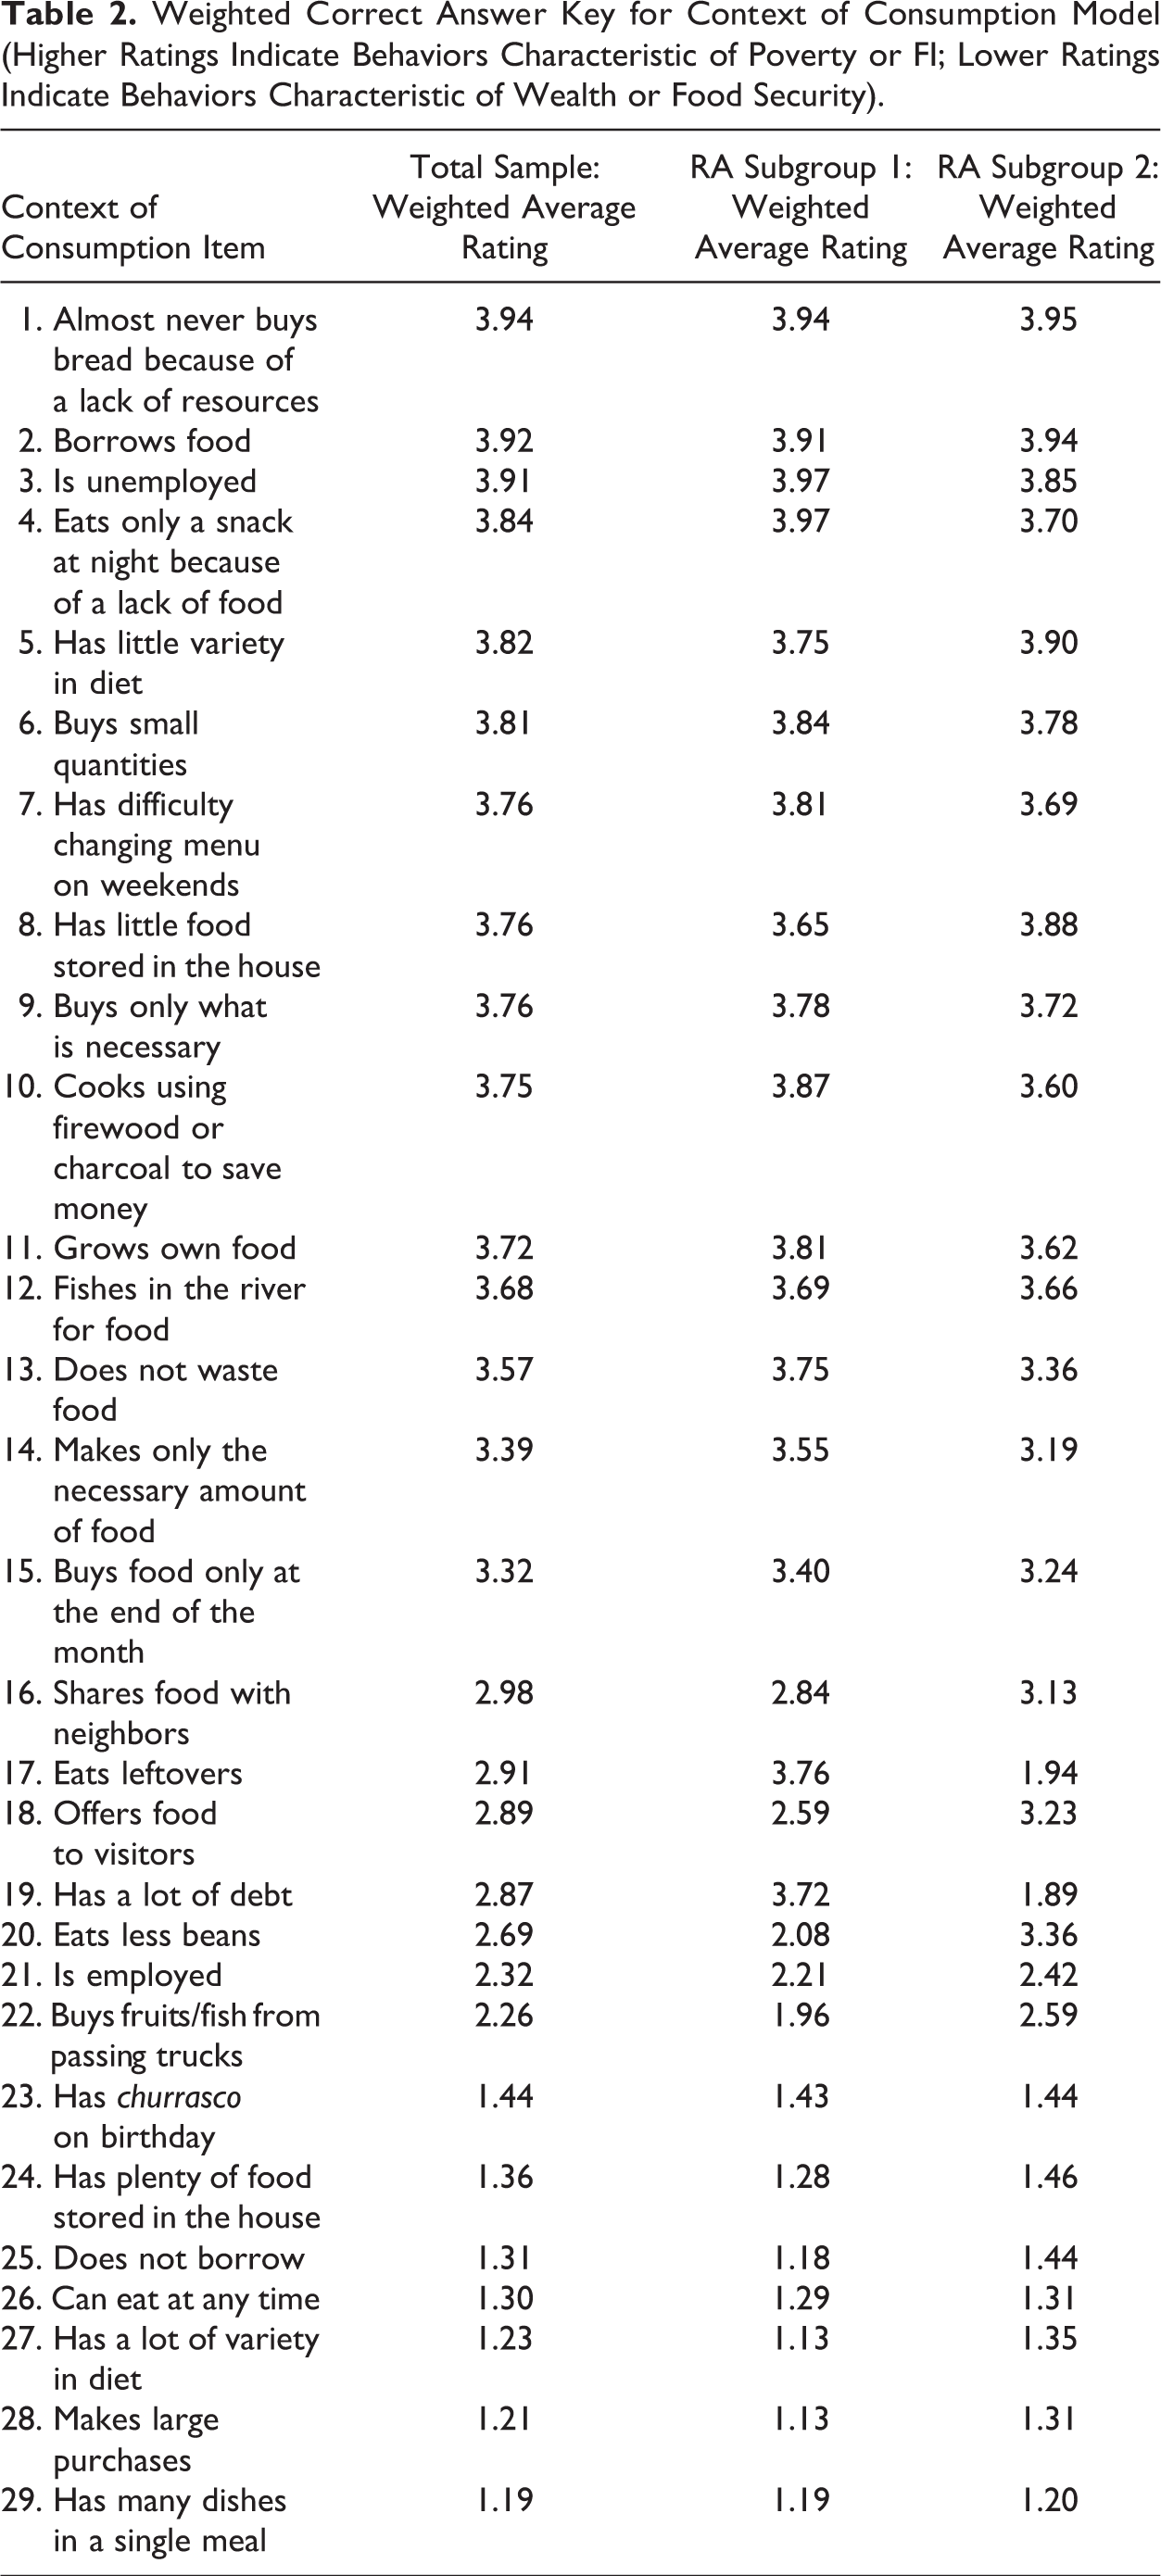
When there is consensus, a first factor “answer key” is produced by Anthropac, which documents the most culturally agreed on responses to the rating task. The weighted correct answer key for this cultural model is presented in Table 2. The first 15 items were those that people associated with poverty or FI. As Table 2 indicates, these included items related to quantity and sharing of food; dietary variety; procuring food; and preparation of food. The final nine items (numbers 21–29) were those that people associated with food security or wealth.
Weighted Correct Answer Key for Context of Consumption Model (Higher Ratings Indicate Behaviors Characteristic of Poverty or FI; Lower Ratings Indicate Behaviors Characteristic of Wealth or Food Security).
We examined the relationship between cultural competence coefficients and measured demographic and FI indicators, but there were no significant associations, indicating that the cultural model was widely shared across demographic groups.
Residual agreement analysis: Is there intracultural variation within the CoC model? If so, how is this variation distributed?
The second coefficient produced by CCA, the residual agreement (RA) coefficient, reflects intracultural variability by assessing if those who disagree with the cultural model do so in a patterned way. Unlike competence coefficients, the RA coefficient does not have straightforward interpretability; thus, residual agreement analysis must first be used to determine whether there are salient differences in cultural knowledge, and then bivariate/multivariate analyses can be used to determine how those differences are distributed (Dressler et al. 2015).
To carry out residual agreement analysis, we used RA coefficients, which range from ‐1 to 1, to divide the sample into two groups: Subgroup 1 composed of individuals with negative RA coefficients, and Subgroup 2 composed of those with positive RA coefficients. We reran CCA within the subgroups and produced separate cultural answer keys for each. Finally, we subtracted the total sample’s answer key from each of the subgroups’ answer keys to produce subgroup deviations for each item in the model. Items with a positive deviation score indicate that the subgroup rated the item higher (more associated with food security) than the overall sample. Items with negative deviation scores were more associated with FI in the subgroup than in the overall sample.
The residual agreement analysis results are presented in Figure 1. Subgroup 1 asserted that poorer people (those with lower FI) have more debt, eat leftovers, and that rich people do not eat many beans. Subgroup 2 asserted just the opposite: that richer people (those with lower FI) have more debt, eat leftovers, and eat more beans (Figure 1).
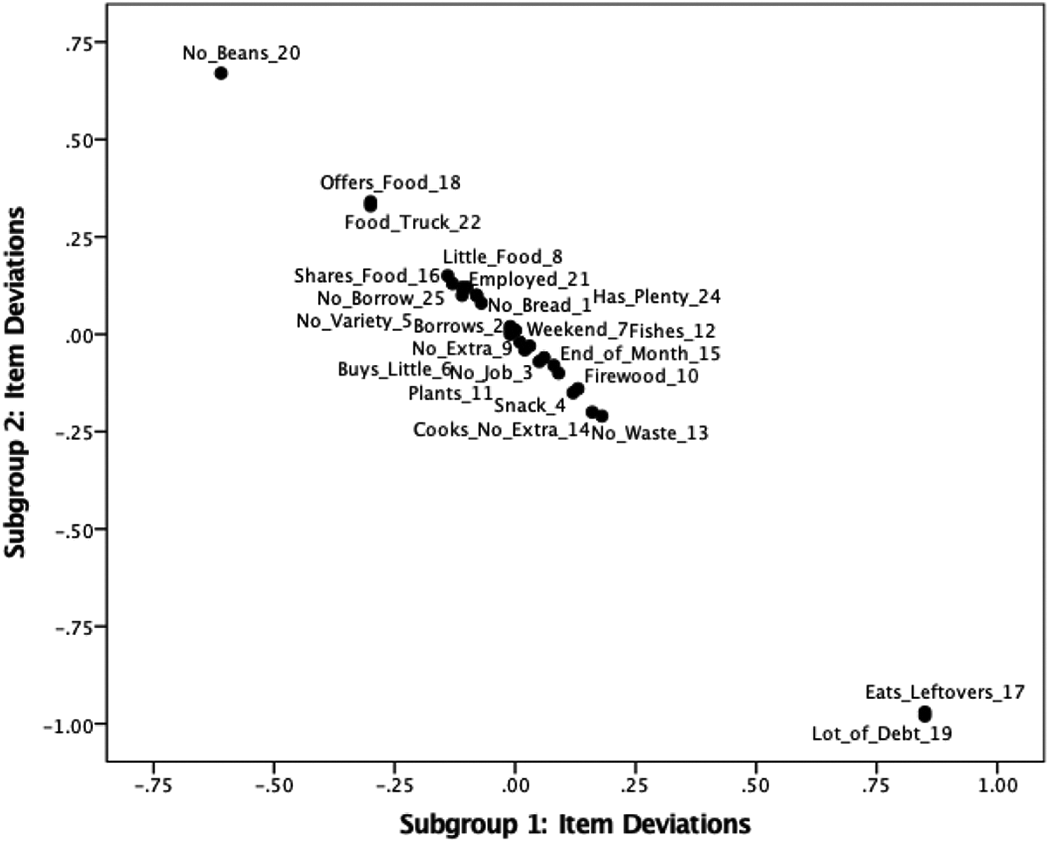
Representation of residual agreement on the context of consumption dimension. Note: Items clustered toward the center are those on which people agreed the most across subgroups; those at either end are the items on which subgroups differed in their assessment.
The next step in residual agreement analysis is to identify how residual agreement subgroups differ in demographic composition. We found that age was significantly correlated with residual agreement coefficients (r = 0.368, p < 0.01); individuals in subgroup 1 (m = 36.58, s.d. = 13.31) were significantly younger than individuals in subgroup 2 (m = 48.52, s.d. = 15.82). There were no differences between subgroups in other measured demographics (gender, number of children). We then turned to the qualitative data to explain the patterns emerging from the residual agreement analyses.
Qualitative Analyses
We used MaxQDA 12 software to carry out open coding with the constant comparative method (Strauss and Corbin 1990) to produce codebooks reflecting key themes across the field notes and interview transcripts. Three individuals (the first author and two students) coded independently to ensure thoroughness. Codes included core categories (e.g., dietary variety, local recipes) as well as axial codes reflecting subcategories (e.g., “poor foods” and “rich foods”) and in vivo codes (e.g., “para fazer mistura,” a Portuguese phrase meaning “to create a mixture” that refers to the importance of having several dishes in a single meal). Finally, we used keyword-in-context searching of the qualitative data to identify references to key items from the residual agreement analysis. The examples below demonstrate how individuals disagreed over the items that patterned the residual agreement analyses already described (items 16–20). Beans: People debated whether bean consumption was a marker of food security/wealth or insecurity/poverty because in 2016, the price of beans more than doubled in just a few months’ time. This was a consequence of the economic crisis following the impeachment of President Dilma Rousseff. “The basic used to be rice and beans. Used to—because now beans have gotten too expensive. But the natural is beans,” remarked a 55-year-old man who lived with his two grandchildren. Others remarked that beans had gotten so expensive that they now surpassed the per-kilo price of beef. This was not a uniform perception, however. Some retained the older conception of beans as a humble staple food. “[Rich people eat] a good salad, good meat. And the poor sometimes eat only rice and beans the entire week,” said one 59-year-old woman. For some, rapidly changing food prices had also changed their perception of beans from staple to luxury item. Because it was so recent, however, this change was not universal. Leftovers: Some felt that the poor would never have any leftovers to eat because they would make only the necessary quantity of food to avoid wasting it. A 51-year-old woman with seven children explained, “[Poor people] have to cook just the right amount of food when they are going to eat so they won’t have leftovers that could go bad. They can’t let their food go bad because the next day they will miss it and wish they had it.” Although most people had access to refrigeration, electricity was unreliable, and middle-aged and older adults remembered a time when refrigeration was totally unavailable. Many therefore held onto the perception that leftovers will spoil even if refrigerated. Others felt the poor would be willing to eat leftovers to avoid wasting. A 30-year-old woman with six children explained that when they do not have money to buy food for breakfast, they eat leftovers from the previous dinner. Thus, poor people avoided creating leftovers, but would be more likely to eat them if they were present. This two-step conclusion seemed to lead to a division in rating the item because many people voiced only one or the other aspect. Debt: Some people felt that only the rich had good enough credit to be able to borrow money, while others felt that debt made poor people poor in the first place. Only the wealthiest had credit cards, but others could buy on credit at the local grocery, provided they settled their bill by the end of each month. One 34-year-old woman with four children who had been through a particularly difficult time recently explained: My husband cut two of his fingers last month hunting, and he stayed almost the entire month without working. We had help from his mom since she is retired, and the church brought a lot of left over food from a celebration that they had. Thanks to God! The biggest worry was to pay our balance at the store because we buy things there during the month and pay by the end of the month.
Discussion: Methodological Applications, Next Steps, and Limitations
We presented a method used to identify and then detect intracultural variation in a set of culturally specific behaviors around food consumption that are indicative of food insecurity (FI). Our study was motivated by the fact that experience-based measures of FI, such as the coping strategies index (CSI) (Maxwell et al. 1999), tacitly assume that people follow a recognizable, uniform progression of behavioral modifications when faced with FI. Yet the anthropological literature on FI experience implies that measures like the CSI might misestimate FI by failing to account for the fact that some population subgroups disproportionately bear the burdens of FI, such as women and girls (Coates et al. 2010; Hadley et al. 2008; Maxfield 2019). Testing whether culturally shared ideas about FI coping behaviors even exist, and if so, how intracultural variation in agreement about those ideas might be patterned, is an important proof-of-concept step toward defending, and even producing, behavior-based FI assessments that are locally relevant and sensitive to subgroup variation.
We proposed a two-phase process of freelisting interviews followed by a rating task around normative food behaviors, or what we called context of consumption (CoC). We used cultural consensus analysis (Romney et al. 1986) followed by residual agreement analysis (Dressler et al. 2015) to assess whether there was a shared cultural model of CoC in our rural Brazilian field site, and how intracultural variation in that model might be patterned. We found very strong evidence for a shared cultural model that was consistent across age, gender, and food security groups.
However, residual agreement analysis revealed that there were several items in the CoC model on which people disagreed, and this agreement was patterned primarily by age. The most-debated behaviors (eating beans, eating leftovers, and having debt) were so polarizing that we could identify two distinct subgroups who understood them in opposite ways. This variation is exactly the kind of information that a less rigorously adapted tool, such as the CSI (Maxwell et al. 1999), would be unable to detect. And yet, different operational definitions of what constitutes FI by age likely pattern experiences of FI and related wellbeing outcomes.
Overall, the methods described in this article were able to determine that people in a particular setting do indeed have shared ideas about food-related behaviors that indicate food security or insecurity. In addition, residual agreement analysis—a relatively new method—was able to uncover fine-grained intracultural differences in understandings of FI between generations, even where there was a high degree of sharing in the cultural model (Dressler et al. 2015; see also Oths and Dressler 2018; Schultz 2019).
Methodological Next Steps
Studies using these methods could go on to develop a CoC assessment tool that would measure individual levels of cultural consonance with the cultural model of CoC (see Dressler et al. 2005). This would allow a researcher to explore potential associations between individual CoC behaviors, residual agreement, and health outcomes like nutritional status, cardiovascular health, and symptoms of depression and anxiety. This would also allow comparison between the performance of a standard FI assessment tool and the locally derived CoC tool.
However, instrument development need not be the next step of this methodological process. As we demonstrated, cultural consensus followed by residual agreement analysis can uncover meaningful shared understandings (in this case, CoC behaviors) and sources of variation in beliefs (in this case, age). These results could then be used to guide qualitative research and analysis addressing agreement and variation in food behaviors, meanings, and food security.
Limitations and Recommendations
The methods presented here represent a first step in a larger process that could be used either to design measurement tools or guide qualitative research. They include particular choices that future researchers might want to approach differently. We chose to eliminate rare items from the freelisting exercise; while this is a common approach, it risks missing important items that were rarely mentioned because they are stigmatized, not because they are unimportant. In addition, we employed random sampling procedures suitable for the study’s larger aims, but this resulted in a sample highly skewed toward women that likely did not capture all perspectives in the community. Finally, future researchers might collect more demographic and household variables, such as access to refrigeration (in a setting where it is not universal) or household food production, that could shape FI.
Conclusion
This article outlined an application of cultural consensus and residual agreement analysis methods to advance theory and measurement in food insecurity (FI). Unlike existing behavior-based FI tools, this approach ensures rigorous attention to locally relevant structures of meaning, insists on verifying that there is indeed agreement about FI-related behaviors in the study setting, and maintains sensitivity to intracultural variation in understandings of those behaviors.
Footnotes
Acknowledgment
The authors thank Rosalie, Regina, and Regiane Pinto, Arlete Santos, the study community, Sarah Homoky, and Erin McFadden for their support of the research and analyses.
Declaration of Conflicting Interests
The author(s) declared no potential conflicts of interest with respect to the research, authorship, and/or publication of this article.
Funding
The author(s) disclosed receipt of the following financial support for the research, authorship, and/or publication of this article: The research was supported by the National Science Foundation (Award # BCS1559785).