
Abstract
This study estimates the relationship between production and salary structure in Major League Soccer (MLS), the highest level of professional soccer (association football) in North America. Soccer production, measured as league points per game, is modeled as a function of a team’s total wage bill, the distribution of the team’s wage bill, and goals per game. Both the Gini coefficient and the coefficient of variation are utilized to measure salary inequality. The results indicate that production in MLS is negatively responsive to increases in the salary inequality; the estimation model with the best fit uses the coefficient of variation to measure dispersion. Furthermore, MLS teams appear to be constrained in their choices of salary inequality by the salary cap and other regulations.
Introduction
Economic theory indicates that the distribution of salaries can affect the productivity of workers and firms. In the theory of tournaments, Lazear and Rosen (1981) discuss the possibility that greater salary inequality can lead to more worker effort and increased productivity. However, cohesion theory (Levine, 1991) implies firms may be able to increase the productivity of workers by equalizing salaries, since a more equal salary distribution will increase unity within the firm. The implication is that firms with more equal salary distributions will be more productive than similar firms with less equal salary structures. The present study attempts to shed light on the question of the connection between salary structure and productivity using professional sports data. Specifically, this article analyzes the possible effect of a Major League Soccer (MLS) team’s payroll distribution on production using data on all MLS salaries from the 2005 through the 2013 seasons. 1
The professional sports industry has proved to be a fruitful area for salary-related studies, since detailed data exist on player salaries, which is not the case in most other industries (Kahn, 2000). Unsurprisingly, the inequality of payrolls within professional sports teams has been a topic of recent research, much of it on leagues in North America. 2 Major League Baseball (MLB) has been extensively studied, with most studies finding a negative relationship between team success and intrateam payroll inequality as predicted by Levine’s cohesion theory (Bloom, 1999; Depken, 2000; DeBrock, Hendricks, & Koenker, 2004; Jewell & Molina, 2004; Richards & Guell, 1998). The National Basketball Association (NBA) has also been studied, but the relationship between salary dispersion and team success is found to be insignificant (Berri & Jewell, 2004; Katayama & Nuch, 2011) or positive and significant as predicted by tournament theory (Simmons & Berri, 2011). Less studied North American sports leagues include the National Hockey League (Sommers, 1998; Kahane, 2012) and the National Football League (Frick, Prinz, & Winkelmann, 2003).
As noted by Katayama and Nuch (2011, pp. 1204–1205), the difference in results between MLB and the NBA can be explained by the cooperative nature of the two games. Since basketball requires substantial coordination among the five players on the court, an NBA player may be conditioned to ignore salary inequality as long as other (higher paid) players are contributing to his current success and future earnings potential. In MLB, outcomes are often determined by individual play, so players may be more selfish when making salary comparisons. Soccer is a sport that combines the individual production aspects of baseball and the cooperative production aspects of basketball, making it an interesting game in which to examine the influence of salary dispersion on team success. Although many soccer matches are decided on the basis of individual matchups and individual skill, extensive integration of play is required for a team to be successful. Franck and Nuesch (2011) analyze the relationship between salary inequality and team success in the German Bundesliga. The authors find a U-shaped relationship, suggesting that teams with little salary inequality would see decreased productivity with increases in inequality (validating cohesion theory), and teams with greater inequality would see greater production with increased salary inequality (supporting tournament theory).
This article advances the literature by placing the discussion of payroll inequality and team success in the context of North American Major League Soccer. The case of MLS is of particular interest regarding the possible effects of intrateam salary inequality. First, MLS is a professional league with a relatively short history, which has only recently seen significant differences in salaries and salary dispersion among teams. Second, MLS has yet to gain a strong foothold in the North American sports entertainment market, implying that any change in the league’s business model needs to be evaluated based on its potential impact on league profitability and survival. Third, MLS is the only major professional sport in North America that has a single-entity ownership structure, so it presents a unique case in terms of league structure.
Measuring salary inequality using both the Gini coefficient and the coefficient of variation, this study finds support for the cohesion hypothesis. Specifically, there is a negative relationship between salary inequality and production for MLS teams, implying that increases in salary inequality tend to decrease team-level production, all else constant. As expected, teams with higher wage bills tend to produce more, but they also face a trade-off in terms of diminished productivity insofar as the increased wage bill also increases salary inequality. In addition, we find evidence that constraints on the maximization behavior of MLS clubs influence their choice of salary dispersion.
Superstar Salaries in MLS
MLS is the top division of professional soccer in the United States and Canada. Teams from 10 U.S. cities made up MLS in its inaugural season of 1996 which include Washington, DC (DC United); Foxborough, MA (New England Revolution); East Rutherford, NJ (NY/NJ MetroStars); Tampa Bay, FL (Mutiny); Columbus, OH (Crew); Dallas, TX (Burn); Kansas City, MO (Wiz); Denver, CO (Colorado Rapids); Los Angeles, CA (Galaxy); and San Jose, CA (Clash). Two more teams, Chicago, IL (Fire) and Fort Lauderdale, FL (Miami Fusion), were added in 1998. MLS contracted to 10 teams for the 2002 season by eliminating both the Florida franchises (Tampa Bay and Ft. Lauderdale/Miami). MLS expanded again to 12 teams in 2005, adding another Los Angeles–based team (Chivas USA) and a team based in Salt Lake City, UT (Real Salt Lake).
Recent MLS expansion has taken the league into Canada with the addition of the Toronto, Ontario (Toronto FC) franchise in 2007. In 2008, MLS added a 14th team, making the decision to revive the San Jose Earthquakes to replace the original San Jose franchise, which had moved to Houston, TX (Dynamo) in 2006. Further expansion has increased the size of MLS to 19 teams, adding Seattle, WA (Sounders FC) in 2009, Philadelphia, PA (Union) in 2010, Portland, OR (Timbers) and Vancouver, British Columbia, Canada (Whitecaps FC) in 2011, and Montreal, Quebec (Impact) in 2012. 3 In addition, the league is expected to add two more teams by as early as 2015 (New York City and Orlando, FL).
Among professional soccer leagues, MLS is unique in several ways. First, it has a closed-league system, in that there is no promotion and relegation. In this way, the league structure is more like that of other North American sports, such as the National Football League, than professional soccer leagues in Europe. Second, MLS has a “soft” salary cap, similar to that in the NBA. The salary cap for the 2013 MLS season was set at US$2.95 million per team, although several teams exceeded that amount in salaries for reasons that will be discussed subsequently. Third, MLS has a single-entity structure. Specifically, the league has an ownership interest in all teams, thereby controlling player contracts, sponsorships, and broadcasting. In terms of controlling player contracts, players sign with the league and not with individual teams, so that players are contracted to MLS, rather than to the franchises themselves. Further, salaries are paid by the league, and for the most part, player movement is determined by MLS. However, each club negotiates salary with the players it employs, so the club controls the degree of salary dispersion within its roster. This salary dispersion is particularly influenced by the pay of “designated players” (DPs) whose pay is exempt from the salary cap. More detail on DPs is provided subsequently. MLS believes that the single-entity structure and salary cap are important to the long-term success of the league. This structure also allows MLS to legally control the escalation of player salaries, maintain greater homogeneity in the quality of teams, improve league competitiveness, and avoid the large versus small market issues that plague other North American sports. 4
Since its inception, MLS has not been an unmitigated financial success, measured as overall profitability or as profitability for individual franchises. Forbes Magazine (Schwartz & Badenhausen, 2008) reports that the league brought in total revenues of US$166 million in 2007 or a little less than US$13 million per team and compared that to the US$3 billion in revenue for the 2010-2011 season in the National Hockey League, the smallest of the big four North American professional sports leagues (Plunkett Research, 2011). Clearly, MLS has a long way to go to reach the status of a major sport in North America. In addition, MLS lost US$20 million in 2007, and only three teams had positive net earnings. One team, Los Angeles Galaxy, accounted for over 20% of league revenue in 2007, an outcome at least partially attributable to the arrival of David Beckham to the team that year. In addition, the Forbes report shows a clear distinction between the revenues of large and small market teams, indicating that the league’s single-entity structure has not eliminated the financial gaps associated with market size. The top five revenue-producing teams are from the 2nd, 3rd, 5th, and 9th ranked media markets in the United States (Los Angeles, Chicago, Dallas, and DC) and the largest media market in Canada (Toronto), while the bottom three revenue-producing franchises are located in the 32nd, 33rd, and 34th ranked U.S. media markets (Kansas City, Salt Lake City, and Columbus). 5 Further, LA Galaxy had revenues more than seven times that of the bottom club (Kansas City).
MLS has been comparatively successful in its attempt to keep the league competitive on the field. In the league’s early history, this did not seem the likely outcome. As noted by Jewell and Molina (2005), DC United won three of the first four MLS championships, termed the MLS Cup. However, in the 13 years since, seven different franchises won the MLS Cup (with DC United winning once). All nine of the remaining original franchises have participated in an MLS Cup final, with only Dallas, New England, and New York failing to win at least one championship. In total, eight franchises have won the MLS Cup in the league’s 18 years of existence, although three teams have won the title on four occasions (DC United, 1996, 1997, 1999, 2004; San Jose/Houston, 2001, 2003, 2006, 2007; LA, 2002, 2005, 2011, 2012). Comparing this to the NFL, generally considered the North American sports league with the highest degree of parity; in the last 18 years, 11 different teams have won the Super Bowl, with only 1 team winning as many as three titles (New England, 2002, 2004, 2005).
Against the back drop of a fairly competitive league with a need to find ways to generate new revenue, enter David Beckham. As chronicled in Grant Wahl’s (2009) book “The Beckham Experiment,” MLS became aware that Beckham might be available after his contract with Real Madrid CF ran out at the end of the 2006-2007 Spanish Primera Liga season. The basic economics of a Beckham deal was a no brainer for MLS: Sign a world-class superstar who could still play at a relatively high level and who would likely generate revenues in excess of what he costs the league. However, the appeal of having Beckham attached to the league was broader than what he brought in short-term finances. His strongest appeal was in the upgrade he would bring to the league’s profile in North America and abroad. Unfortunately, there were some potential negatives associated with bringing Beckham to MLS. Among the many issues involved with signing a player of Beckham’s stature, the problem of fitting his contract under the league’s tight salary structure was arguably the most challenging. In 2007, Beckham’s first year in the league, the salary cap was set at US$2.1 million per team, and Beckham would cost more than twice that amount. Further, if MLS could find a way to massage the salary cap to fit Beckham, what would that do to the competitive nature of the league?
In the end, the opportunity to sign David Beckham was just too good for MLS to pass up. As a response to the Beckham opportunity, MLS established the DP rule in 2007. Sometimes called “the Beckham rule” for obvious reasons, it is designed to allow clubs to expand their teams with high-profile players, the first of whom was David Beckham. Although Beckham’s relationship with the league and his MLS club Los Angeles Galaxy has been somewhat rocky, the impact his signing has had on MLS is clear: The introduction of the Beckham rule in 2007 allowed franchises with larger markets and deeper pockets to spend more on DPs and circumvent the restrictions of the salary cap.
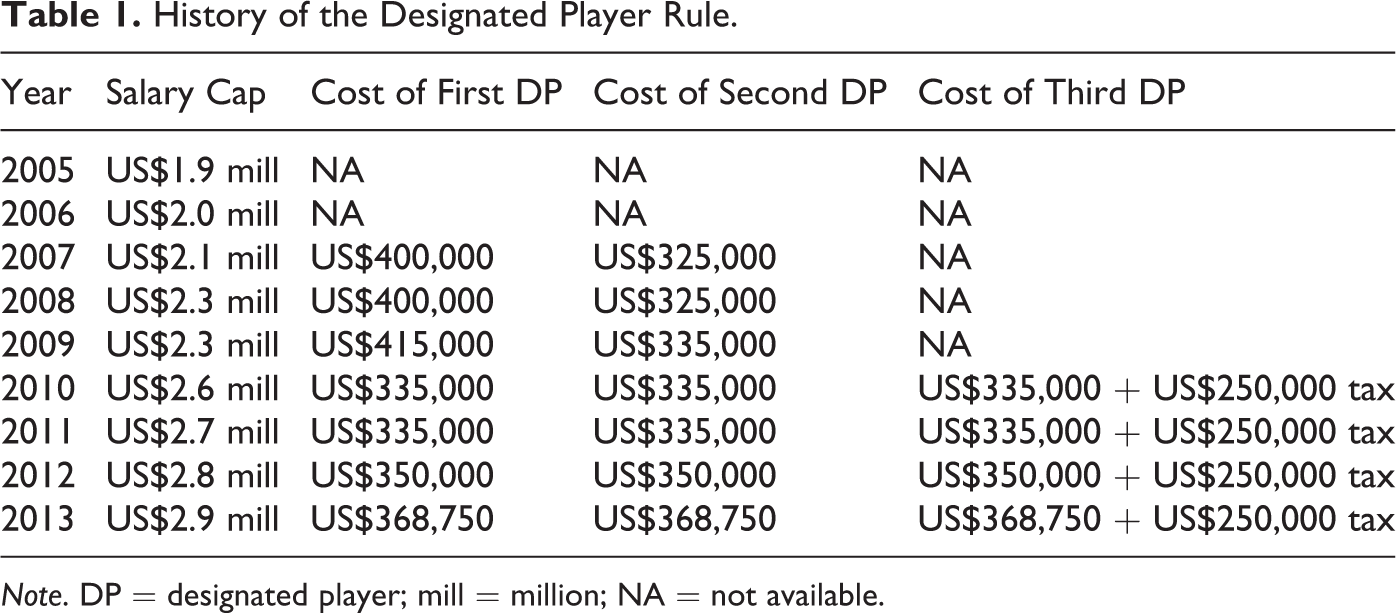
The DP rule is essentially an exemption to the salary cap, similar to exceptions in past NBA collective bargaining agreements that allowed teams to re-sign their own free agents at salaries that exceeded the salary cap. In the case of the NBA, these exceptions (the most well known of which being the “Larry Bird exception” for veteran free agents) benefit teams by ensuring that they have an advantage in signing their own players, and they benefit players by effectively removing some of the downward pressure on wages implied by the cap. In MLS, the DP rule allows the league to sign players of higher quality than would be possible under a hard cap, effectively expanding the pool of potential players and increasing the quality of the league overall. As originally established, individual teams were allowed up to two DPs. The first DP counted US$400,000 against the salary cap, and teams were free to pay as much as they liked above that amount to the DP. The first US$400,000 was paid by the league, while anything above that amount was paid by the team. Teams could also sign a second DP, which would count US$325,000 against the cap, with any salary above that amount covered by the franchise. Clearly, the DP gives the club control over the dispersion of players’ salaries.
One cannot help but notice that the DP rule tends to favor large market teams or at least those franchises, which have higher levels of revenue that can afford to pay for the best players. In an attempt to serve the interests of the largest number of MLS teams, adjustments to the DP rule have been made since 2007. As of the 2013 season, there can be up to three DPs per team although not all teams use these spots. Each DP costs US$368,750 against the salary cap, and teams that choose to have a third DP are required to pay an extra US$250,000 in tax to the league. DPs under age 23 count less than US$368,700 against the salary cap, and DPs signed in the middle of the season only count US$175,000 against the cap. Table 1 summarizes the adjustments made to the DP rule since it was introduced.
History of the Designated Player Rule.
Note. DP = designated player; mill = million; NA = not available.
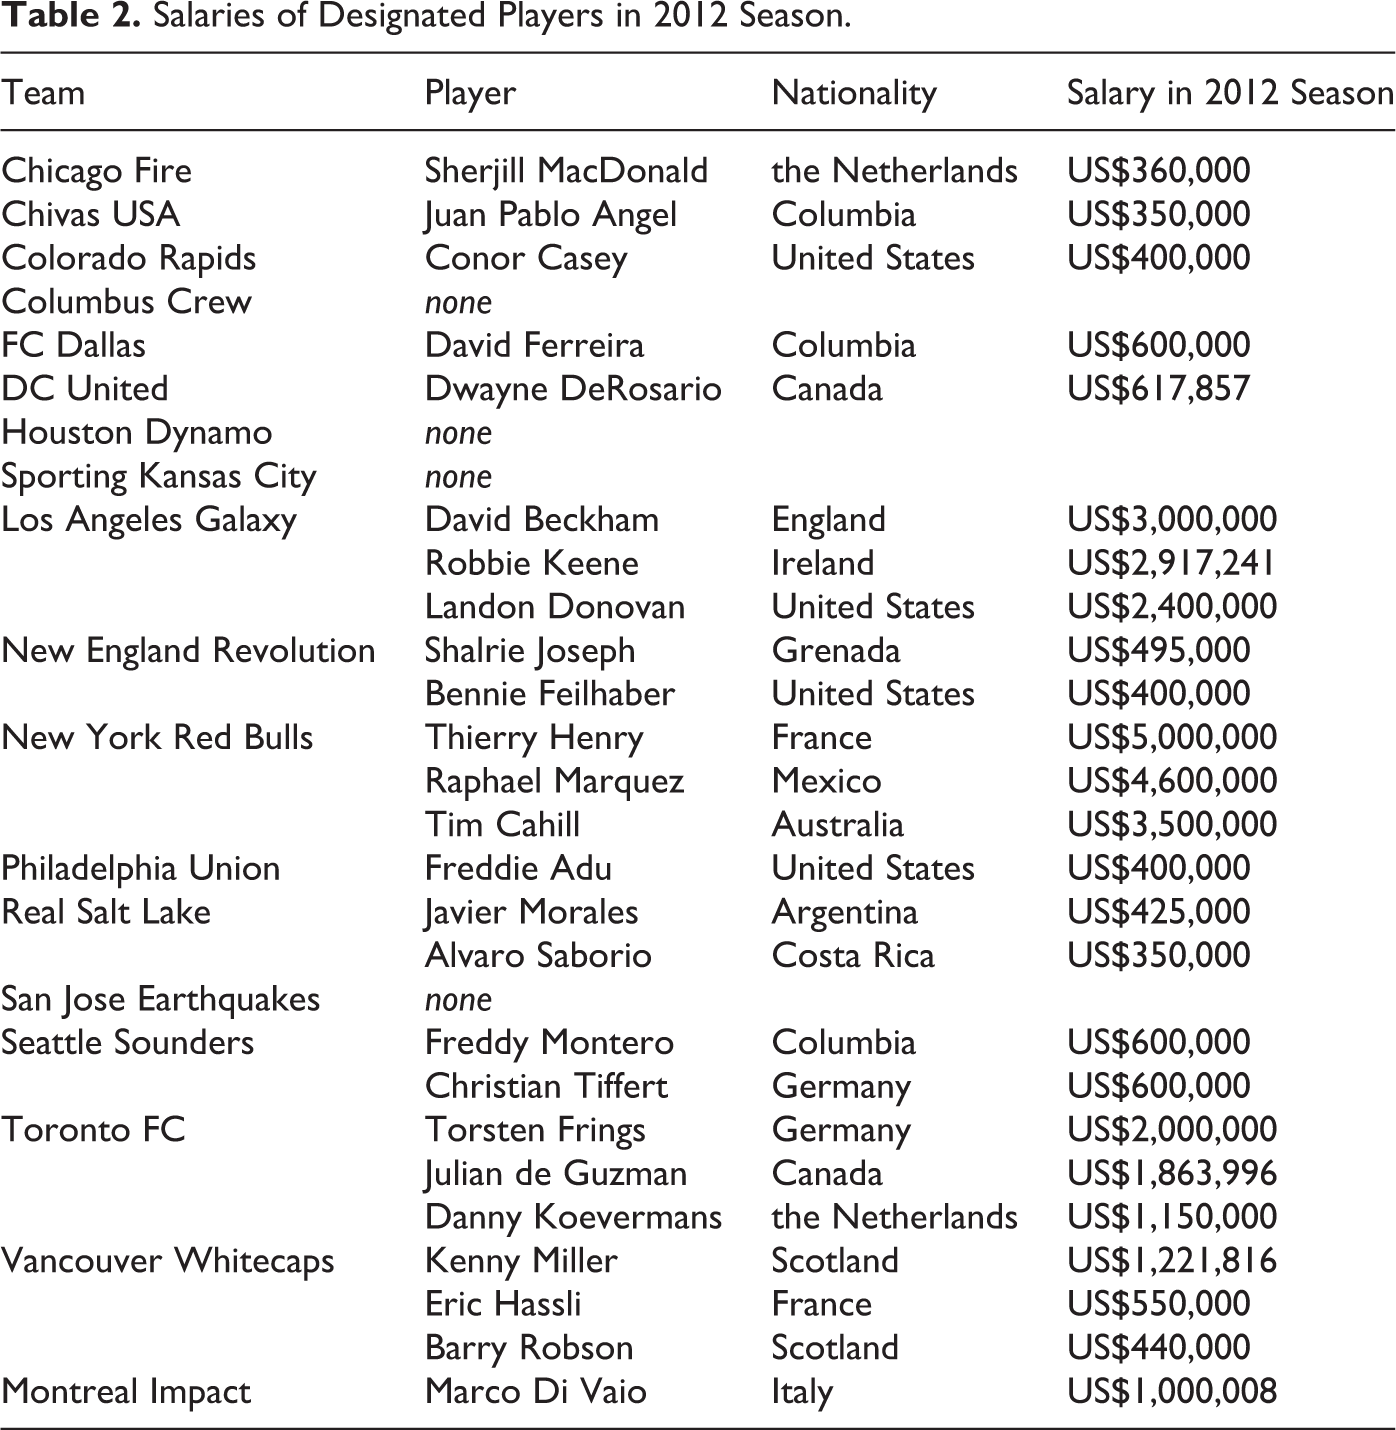
Table 2 lists MLS DPs in the 2012 season, their teams, their home countries, and their salaries. Team salary and wage bill data are gathered from the website of the MLS Players (MLSplayers.org, various years) and represent team salary structure for all players contracted to the league at the beginning of each MLS season. 6 The total of all DP salaries in 2012 was US$36.5 million, the vast majority of which (US$26.4 million or 72%) went to nine players on three large market teams (Los Angeles, New York, and Toronto). It comes as no surprise that it tends to be the franchises in larger markets that have the most designated players and those making the highest wages.
Salaries of Designated Players in 2012 Season.
As a way of leveling the field financially, MLS gives monetary allocations to certain teams that can be used to pay for salaries in excess of the cap. For instance, teams that miss the playoffs are generally given allocation funds for the next season, and teams that lose a player by a transfer to a team outside MLS are given allocation funds as a form of compensation. As mentioned earlier, if a team has filled two of its DP slots and wishes to acquire a third DP, it may purchase that third slot by making a US$250,000 payment to the league. That payment is then shared evenly in the form of allocation funds among teams that do not have three DPs. Allocation money is generally thought of as a way that smaller market teams can stay competitive with larger market teams in signing high-priced talent. Specifically, the DP rule allows large market teams to respond to demand for high-priced talent, while the allocation system is supposed to enable low-revenue teams to stay competitive by effectively raising their salary caps.
Certainly the DP rule helps the large market teams acquire talent they would not be able to sign under a strict salary cap. However, it is implausible that the small market clubs’ ability to compete with larger clubs is improved by the allocation of the revenues the league collects from clubs hiring a third DP. Consider that in 2012 four clubs had three DPs, so the league collected US$1 million dollars to be shared among the remaining 15 clubs; each of the 15 received US$66,666 in allocation funds. The lowest salary of any of the four “third” DPs was US$1.15 million. It is not at all likely that any of the recipient clubs would be able to use an extra US$66,666 to hire a player (or players) to compete with teams that have signed a third DP.
Model and Data
We assume that all MLS clubs face the same production relationship:
where i indexes team and t indexes year. Each MLS club may seek to maximize points (P) by choosing its wage bill (W) and salary dispersion (S), given the values of other production-related variables (X). Point, utility, or win maximization is the normal assumption for European football clubs; on the other hand, MLS clubs may, like other professional sports franchises in the United States, intend to maximize profit (Goddard, 2006). The lack of available information about MLS revenues and costs at the team and league levels makes it difficult to analyze maximization behavior under either assumption and to determine the objective function of the league and its individual teams. Nonetheless, maximization models facilitate a more complete discussion of the relationship between Equation 1, which is estimated in the next section, and team choice of optimal salary distribution. We start with the assumption that maximization occurs without any salary-related restrictions (such as a cap on overall or individual salaries, minimum salaries, and minimum/maximum roster sizes). Then, we illustrate how salary restrictions change the maximizing behavior of MLS teams with respect to the choice of salary inequality.
Maximizing Behavior of Clubs Without Salary Restrictions
Assume clubs maximize profit in the absence of any restrictions on individual or collective salaries. Without loss of generality, assume that revenue is an increasing function of points and points are produced according to Equation 1. Further, assume that revenue exhibits concavity in P. Equation (2) specifies the revenue function for each MLS club i in year t.
Assume that each club’s production costs consist of a fixed component each year (e.g., capital, travel, and operations, denoted F) and a variable component equal to the cost of labor in terms of a club’s wage bill. Equation 3 specifies the profit equation as a function of the choice variables W and S:
Maximization of Equation 3 produces the following first-order necessary conditions:

RP is the partial derivative of revenue with respect to points (i.e., the marginal revenue of points), and PW and PS are the marginal products of the wage bill and salary inequality in producing points, respectively.
Equation 4 implies that RP cannot be zero, so for Equation 5 to hold, PS must equal zero. Thus, in the absence of salary constraints, profit-maximizing clubs increase salary dispersion until further increases yield no additional points or, alternatively, no further decline in points. In other words, this implication of the optimal choice of salary inequality holds under either cohesion or tournament theory. As an example, consider Franck-Nuesch-type point production, where PS is negative for low S and positive for high S; in this case, teams will choose PS at the inflection point though this would not be a profit maximum. Equation 4 also indicates that profit-maximizing clubs choose a total wage bill so as to equate the marginal revenue of points to the marginal cost of points. Therefore, MLS teams with greater revenue-generating potential will have higher wage bills, ceteris paribus. In addition, the marginal product of increasing the team wage bill for low-wage clubs should be greater than the marginal product of increasing the wage bill for high-wage clubs, if the point production function is concave in the wage bill.
Now consider the situation where MLS clubs maximize point production under the break-even assumption of Kesenne (1996) and in the absence of a cap on individual or overall salaries. In this case, the club objective is to maximize Equation 1 subject to the constraint that revenues defined by Equation 2 are equal to production costs. The maximizing equation and first-order necessary conditions for a maximum are as follows:


As λ and RP are positive by assumption, Equation 7 implies that PW must be positive; PS is zero by Equation 8. Thus, the implications for the behavior of MLS clubs under point maximization are similar to those under profit maximization. Specifically, as is the case for a profit-maximizing club, a point-maximizing MLS team will have a positive marginal product of the wage bill at the optimal team wage bill and will set salary inequality such that the marginal product of dispersion is zero.
Maximizing Choice of Salary Dispersion With Salary Restrictions
In the Maximizing Behavior of Clubs without Salary Restrictions section, basic models of profit maximization and point maximization are developed under the condition of no salary constraints. Based on these models, maximizing MLS teams are expected to choose salary inequality where its marginal product equals zero. However, MLS, like all North American sports leagues, has an extensive set of regulations governing player salaries, including restrictions on roster size. These regulations form a complex series of constraints on a team’s choice of both wage bill and salary dispersion. For example, while a club could have a roster of up to 30 players, the 20 highest paid players had to fit under the salary cap. Players 21 through 30 are referred to as “off-budget” players. For the 2013 season, the maximum wage bill (net of DP salaries over US$368,750 and allocation funds) was US$2.95 million, the minimum player salary was US$46,500 (or US$35,125 for off-budget players), and the maximum player salary was US$368,750.
Assuming teams tried to spend up to the salary cap in 2013, they could have hired 20 players and paid them each US$147,500. Dispersion measured by the Gini coefficient would in this case be zero. The highest Gini coefficient possible with a 20-man roster would occur if the team chose to pay 13 players a minimum of US$46,500 and pay the remaining cap money to 7 players. The Gini coefficient in this case is 0.469. However, the average MLS club in 2013 had six off-budget players making US$35,125 each. Thus, a team with 20 players making US$147,500 and 6 additional players making US$35,125 would have a Gini coefficient of 0.164, which represents a minimum dispersion for teams that chose to spend to the cap in 2013. For a team with 13 players paid the league minimum, 7 players paid the remaining allowed under the salary cap, and 6 off-budget players earning $35,125, the Gini coefficient is 0.503. For teams that choose to hire DPs, the Gini coefficient can go much higher, but teams that choose to spend close to the cap are constrained in increasing salary inequality. 7
Given the limitations that MLS salary restrictions place on the choice of salary dispersion, we expect that the constrained optimum choice will vary by teams. Specifically, higher revenue teams that have the incentive to spend past the cap on DPs will be less constrained when choosing salary inequality. Thus, higher revenue teams should be able to choose salary distribution at a point where the marginal effect of dispersion is close to zero, as in the unconstrained case, while lower revenue teams should find themselves constrained to be further away from that distribution of salaries that maximizes profits or points.
Data
The data set includes yearly observations on all teams that competed in MLS from the 2005-2013 seasons. Of the 19 teams, which existed over that period, 12 played for the full 9 years, 1 for 7 seasons (Toronto), 1 for 6 seasons (expansion San Jose), 1 for 5 seasons (Seattle), 1 for 4 seasons (Philadelphia), 2 for 3 seasons (Portland and Vancouver), and 1 for 2 seasons (Montreal). The total number of team-year observations is 138. Output is measured as the number of league points per game (Points). Points is used rather than league points per year to control for a change in the number of regular season games over the sample period; MLS teams played 32 games in 2005 and 2006, 30 from 2007 through 2010, and 34 in the 2011 through the 2013 seasons. As in other professional soccer leagues, MLS teams earn three league points for a win and one league point for a tie. MLS differs from many other soccer leagues in that it has a playoff system to determine the eventual champion. Thus, Points is a measure of regular season success in MLS.
The main purpose of this study is to test the hypothesis that salary inequality influences team-level productivity in MLS. Further, we test whether cohesion theory or tournament theory better describes MLS production, and we test for differences among teams in their choices of salary dispersion. Salary distribution is measured using the Gini coefficient at the team level (Gini) or the coefficient of variation at the team level (CV). With either theory, ceteris paribus, a higher Gini or CV will influence a team’s productivity; the relationship will be negative if cohesion theory holds and positive under tournament theory.
The quality of the team will also influence productivity, as better teams should have higher levels of production. Following the literature on productivity in soccer (e.g., Frick & Lee, 2011), the present study uses the team wage bill relative to the average wage bill that season (RelWage) as a measure of overall team quality. A larger wage bill correlates with better overall team quality and should be positively related to productivity. As a further measure of team quality, we also include the number of players who have played on their country’s national team in international competition (Nationals). The expectation is that having players with international experience should be positively correlated with higher productivity, ceteris paribus. However, if more players with international experience are a proxy for a roster that is more culturally diverse, then productivity may be lower (Kahane, Longley, & Simmons, 2013). Teams in their expansion year, that is, their first year of existence, (Expansion) should have lower production than would otherwise be expected.
Based on Equation 1, the point–production relationship is hypothesized as follows:
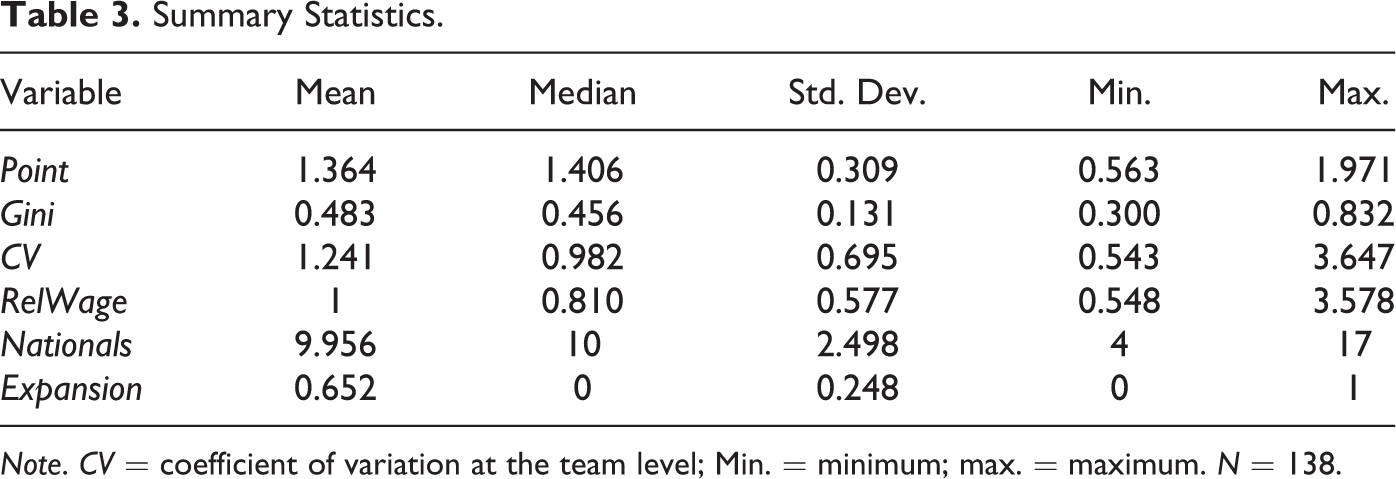
where i indexes team, t indexes year, and D(.) is a function that maps the dependent variables onto MLS league Points. A priori, the coefficients on RelWage and Nationals are expected to be positive, while the coefficient on Expansion should be negative. Further, the coefficients on Gini or CV should reflect the constrained optimum choices of salary inequality that vary by team as discussed earlier. Summary statistics for the included variables are given in Table 3.
Summary Statistics.
Note. CV = coefficient of variation at the team level; Min. = minimum; max. = maximum. N = 138.
Results and Discussion
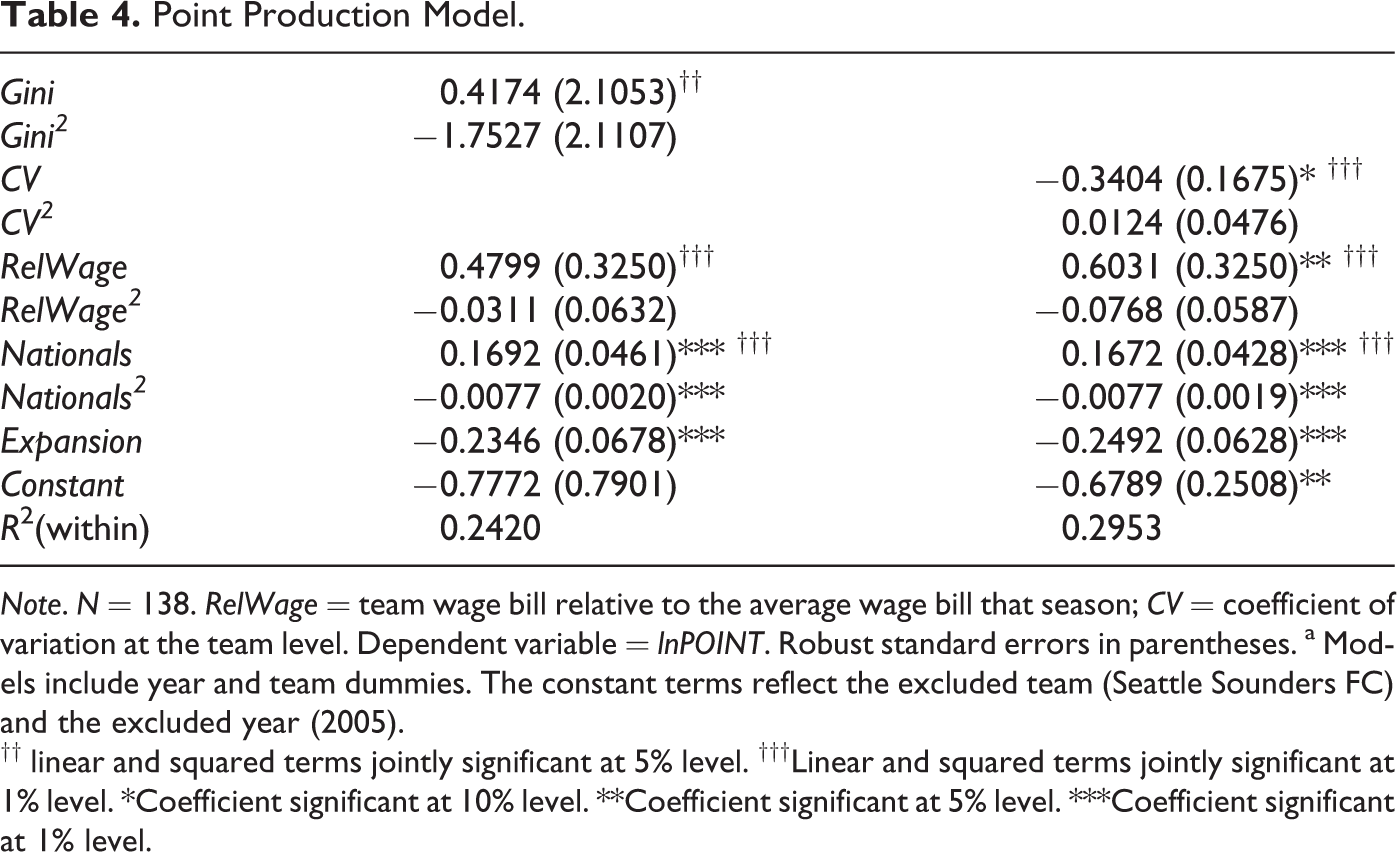
Based on previous literature, one might expect the functional form of MLS point production to be nonlinear in salary inequality and the wage bill. Table 4 reports coefficients from a specification of Equation 9 in which the dependent variable is in natural logs and the independent variables enter linearly and squared. Reported standard errors are corrected for clustering on team.
Point Production Model.
Note. N = 138. RelWage = team wage bill relative to the average wage bill that season; CV = coefficient of variation at the team level. Dependent variable = lnPOINT. Robust standard errors in parentheses. a Models include year and team dummies. The constant terms reflect the excluded team (Seattle Sounders FC) and the excluded year (2005).
†† linear and squared terms jointly significant at 5% level. †††Linear and squared terms jointly significant at 1% level. *Coefficient significant at 10% level. **Coefficient significant at 5% level. ***Coefficient significant at 1% level.
The first column shows results using Gini to indicate salary inequality, and the results shown in the second column are based on using CV. Both estimations include a complete set of team-specific and yearly fixed effects. 8 The coefficient on Gini is insignificant, but the linear and squared terms are jointly significant at the 5% level. The coefficient on CV is significant, and the linear and squared terms are jointly significant at the 1% level. Thus, there is some evidence that MLS point production is nonlinear in salary dispersion; however, the point of inflection is far outside the sample. Using the Gini coefficient, lnPoint is increasing in Gini up to a value of 0.119 and decreasing at higher levels of dispersion. The inflection point is lower than the minimum observed in the sample (0.262), and it is likely a value that is not attainable, given MLS salary regulations. Using the coefficient of variation, lnPoint is decreasing in CV up to 13.75, a value that is much higher than that observed in the sample (sample max. = 3.647).
So, for all practical purposes, the estimates in Table 4 indicate that increases in Gini and CV are significantly associated with reduced Points. These results suggest that cohesion theory more appropriately explains the relationship between team production and salary dispersion in MLS than does tournament theory. The model with the best fit in terms of R 2 uses CV to measure salary dispersion. The estimated elasticity of Points with respect to changing CV shows that MLS production is not highly responsive to changes in the distribution of salaries, as a 1% increase in salary dispersion is predicted to decrease Points by only 0.37%.
A team with more Nationals sees greater productivity, which increases at a decreasing rate. As expected, a team’s relative wage bill is positively related to its point production. Also as expected, teams in their Expansion season see diminished point productivity. Referencing the best-fit model using CV, the estimated elasticity of Points with respect to changing RelWage is approximately 0.4. Interestingly, the elasticity of changing RelWage and the elasticity of changing CV are of similar magnitude, implying that the degree of responsiveness of point production to changing salary dispersion and to changing the team wage bill are similar in absolute value. This implication is extremely important for MLS decision makers: If signing a high-priced player changes the salary distribution as well as increases the wage bill relative to the average (as would be the case with a designated player), an MLS team can expect to have increased point production as long as the percentage increase in the wage bill is larger than the percentage increase in salary inequality.
As detailed earlier, David Beckham was the first high-profile superstar signed by MLS, so it seems appropriate to use him as an example. At the start of the 2006 season, LA Galaxy had a coefficient of variation of 1.69 and a relative wage bill of 1.30. In 2007, LA had a coefficient of variation of 3.52 and a relative wage bill of 2.78. While the addition of Beckham was not the sole reason for these changes in LA’s salary structure, his salary was clearly the catalyst behind a 108% increase in the coefficient of variation and a 114% increase in relative wage bill. Based on the results from Table 4, an increase in CV of 108% would lead to a decrease in Points of 40%, while a 114% increase in RelWage would imply an increase in Points of 45%. In this case, the larger relative change in RelWage implies that Beckham’s addition to LA Galaxy should have led to 5% greater point production in 2007 than in 2006. In fact, LA’s Points decreased slightly from 1.22 in 2006 to 1.13 in 2007, possibly reflecting Beckham’s lack of playing time in 2007 due to injuries. 9
Responsiveness of MLS team production to changes in salary inequality
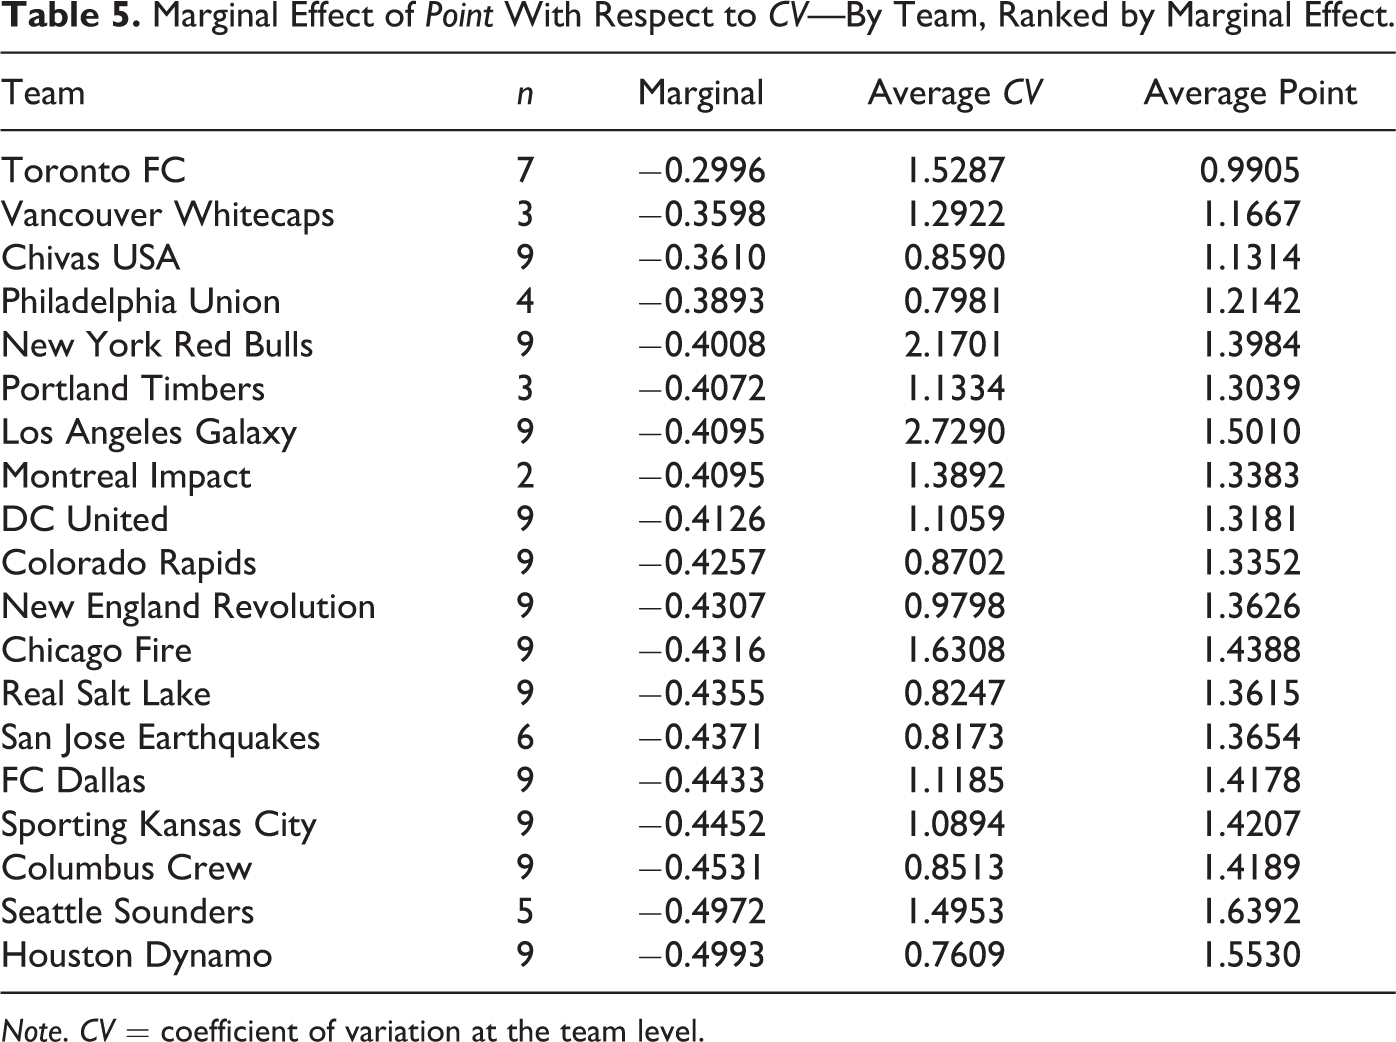
The numerical impact of changing salary dispersion on point production will differ from team to team, inasmuch as Points and salary dispersion vary over teams. Further, constrained maximization as discussed in the previous section will imply that MLS clubs will choose a degree of salary dispersion so that the marginal effect is as close to zero as possible, and teams with greater capacity to spend will be less constrained in choosing salary dispersion. Based on the best-fit model of Table 4, Table 5 lists the predicted numerical changes (i.e., marginal effects) in Points associated with a change in CV. 10
Marginal Effect of Point With Respect to CV—By Team, Ranked by Marginal Effect.
Note. CV = coefficient of variation at the team level.
As hypothesized, the marginal effects of a change in CV on Points are generally larger for those clubs with less salary inequality, and teams in larger markets tend to have marginal effects close to zero. Interestingly, many of the expansion teams have relatively small marginal effects, suggesting that new teams may feel the need to spend more to compete with existing clubs.
Responsiveness of MLS team production to changes in a team’s relative wage bill
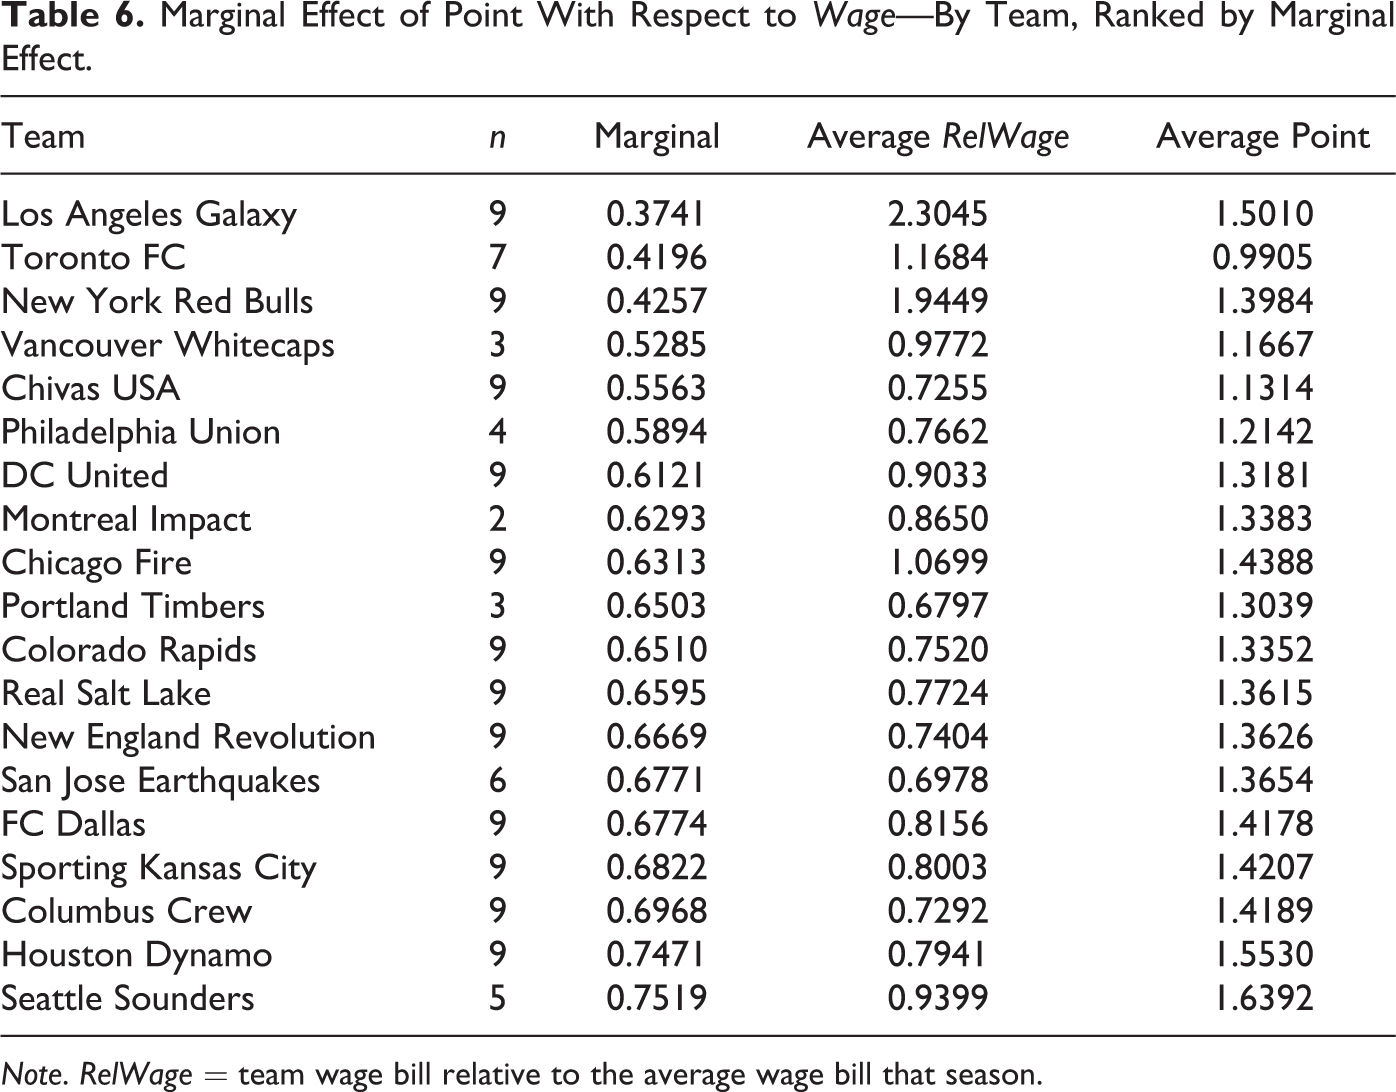
Turning to the relationship between point production and relative wage bill, Table 6 shows the absolute marginal effects of increasing a team’s relative wage bill on Points, evaluated at mean values for RelWage and Points for each team. The theory mentioned earlier indicates that whether clubs maximize profits or points by choosing total wage bill, the marginal effect of wage bill at the optimum will be positive. As is clear from Table 6, the estimated marginal effect of an increase in RelWage is positive for every club. Under either club objective, theory suggests that the marginal effect of RelWage declines as RelWage rises. Interestingly, the clubs with the top three smallest marginal effects are those teams in the largest markets, Los Angeles, New York, and Toronto. These are also the clubs that had three DPs in 2012. Houston, Columbus, and San Jose, three clubs that employed no DPs in 2012, rank second, third, and sixth, respectively, in terms of largest marginal effect of additional wages.
Marginal Effect of Point With Respect to Wage—By Team, Ranked by Marginal Effect.
Note. RelWage = team wage bill relative to the average wage bill that season.
Conclusion
MLS is unique among North American professional sports leagues. MLS has a single-entity ownership structure, has only been in existence since 1996, and has recently seen a change in intrateam salary structure. Because of its unique characteristics, MLS presents an interesting case in which to study the relationship between salary dispersion and team success. The results from this study indicate a negative relationship between salary inequality and team success in terms of league points. Thus, the present study provides support for the cohesion theory. Further, the best-fit model suggests that increasing salary inequality and the team wage bill work in opposite directions by similar magnitudes, highlighting the trade-off MLS teams must make when signing high-priced talent. Finally, evidence suggests that MLS teams are constrained in their choice of salary inequality, suggesting that salary inequality would be worse in the absence of salary restrictions.
MLS is a young league that is yet to gain a strong foothold in the North American market; recent attempts to sign high-priced soccer talent through the introduction of the DP rule may help the league in its efforts to market the professional game. However, the results from the present study indicate that there will be a cost of signing designated players in terms of lower productivity, if the salaries involved cause significant increases in salary inequality. But the results also show that increases in a team’s wage bill increase productivity, as would be expected if the higher priced talent is more skilled than existing players. In the end, MLS and the individual teams that comprise the league will need to consider both the cost and the benefit in terms of productivity when deciding on whether or not to sign superstar players. Further research is needed to evaluate the impact of the DP rule on the overall competitiveness of the league, inasmuch as a competitive league is expected to help the long-term growth prospects of MLS.
An additional consideration for MLS is the influence that superstar players have on attendance and revenues. Lawson, Sheehan, and Stephenson (2008) estimate that David Beckham doubled ticket sales for the MLS games in which he played during the 2007 regular season, home and away. The unique structure of MLS sets up an interesting dilemma for the league and teams; individual teams are likely focused on their own revenues and the relationship between winning and attendance, while the league is likely to be highly focused on revenues. Thus, individual teams may be more concerned about mitigating the negative influence of increasing salary inequality to improve point production, and the league may be concerned about signing high-priced talent to drive revenues. How MLS deals with these conflicting priorities is a subject for future analysis and research.
Footnotes
Appendix
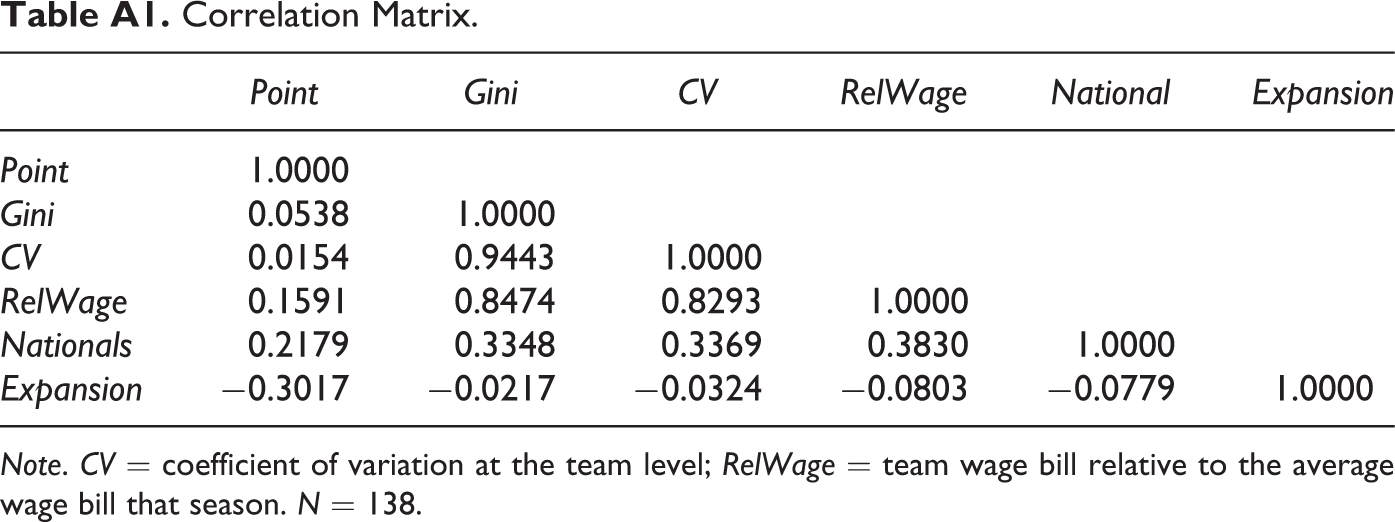
Correlation Matrix.
| Point | Gini | CV | RelWage | National | Expansion | |
|---|---|---|---|---|---|---|
| Point | 1.0000 | |||||
| Gini | 0.0538 | 1.0000 | ||||
| CV | 0.0154 | 0.9443 | 1.0000 | |||
| RelWage | 0.1591 | 0.8474 | 0.8293 | 1.0000 | ||
| Nationals | 0.2179 | 0.3348 | 0.3369 | 0.3830 | 1.0000 | |
| Expansion | −0.3017 | −0.0217 | −0.0324 | −0.0803 | −0.0779 | 1.0000 |
Note. CV = coefficient of variation at the team level; RelWage = team wage bill relative to the average wage bill that season. N = 138.
Declaration of Conflicting Interests
The author(s) declared no potential conflicts of interest with respect to the research, authorship, and/or publication of this article.
Funding
The author(s) received no financial support for the research, authorship, and/or publication of this article.