
Abstract
Betting markets have grown considerably lately. Despite their impact on the economic importance of professional sports, they just received academic interest recently. This article determines factors affecting the amount of money bet as well as the number of matched bets placed on the largest European soccer league, namely, the English Premier League between 2009-2010 and 2015-2016. Data from the betting exchange Betfair suggest season progress, weekday, number of substitutes, both teams market values, as well as uncertainty of outcome to determine market transactions and, hence, the economic importance.
Betting on sports is a rapidly growing market with worldwide turnover of 58 billion euros in 2015 as estimated by the European Gaming and Betting Association. This value exceeds the gross domestic product of countries like Panama or Costa Rica, and these official numbers ignore that substantial illegal betting is not covered by that figure. While the market size is huge and growing, surprisingly little is known about the demand for sporting bets, as existing studies mostly focus on inefficiencies of betting markets or match fixing. One reason for this research gap is connected to the unavailability of evaluable data. While access was not given until now, knowledge of the market is of crucial importance for various reasons: First, in order to deepen the insights into the economic impact of single sports events, it is crucial to include sporting bets into corresponding analysis. So far, existing analysis mostly focuses on ticket sales, television (TV) contracts, and merchandise and neglects the economic value of sports bets (Roberts, Roche, Jones, & Munday, 2016). However, data in this article suggest that economic importance of sport betting is potentially superior with respect to total revenue. Hence, the economic importance of sports competition tends to be underestimated to date.
Second, even though revenue of betting exchanges or bookmakers does not benefit the clubs directly, they profit from increasing betting indirectly, for example, with respect to (shirt) sponsorship engagements of betting companies. The number of (online) bookmakers which act as a shirt sponsor of a Premier League club is quite large. In 2002, Fulham was the first club with a shirt sponsor from a company of the gambling industry, namely, Betfair. In the season 2016-2017, 10 of the 20 teams had a shirt sponsorship contract with a company from the gambling industry. Thus, the rise of the betting industry has an important economic effect on the teams in the Premier League, leading to millions of (additional) pounds earned through sponsorship deals.
Focusing on sporting bets puts economic significance of league matches into perspective and allows for comparisons between teams within a certain league as well as across leagues. Furthermore, analysis of demand for sport bets can also increase the understanding of demand for sport contests in general. Even though there is extensive literature on drivers for attendance at sport events, 1 some ambiguities remain, especially with respect to the impact of outcome uncertainty. 2
The ambiguities with respect to demand for sporting contests and the role of uncertainty of outcome may be related to empirical issues, for example, censored data due to sellouts of stadiums, unavailable data such as TV or online stream audience, or problems with respect to the inclusion of (ticket) prices. Using data on betting demand reduces methodological issues as demand is not censored and exact numbers on demand and prices are available. Hence, results can deliver valuable information on determinants of demand for sport events in general.
To the best of our knowledge, the studies by Humphreys, Paul, and Weinbach (2013) and Paul and Weinbach (2010) are rare examples that analyze determinants of the demand for sports bets. While Paul and Weinbach (2010) investigate the number of bets placed on National Basketball Association (NBA) and National Hockey League (NHL) games, Humphreys et al.’s (2013) study is the only research that parses volume of dollars bet as they focus on The National Collegiate Athletic Association (NCAA) men’s basketball matches. Both studies find that determinants of demand for sports bets are comparable to the determinants that affect fan behavior, such as teams’ qualities, TV coverage, timing, and outcome uncertainty. Given the scarce literature on the determinants of betting volume in relation to a fast-growing economic importance of sports betting, this article closes several gaps in the literature. First, this is the first analysis for any European market. While U.S. betting is dominated by point spread betting, European betting refers mainly to match odds betting. European betting can have heavy underdogs and favorites in terms of odds, whereas U.S. betting has equal odds on both teams. Second, it is the first analysis for soccer, which is the premier European sport with the English Premier League being the economically most relevant league. Third, it is the initial research using betting exchange market data. Forth, it is the first analysis of a high turnover betting platform. On average, bettors bet 2.7 million pounds per Premier League match. 3 Our results confirm that the quality of participating teams is a major determinant for the demand of sports bets. Furthermore, time, economic factors, and uncertainty of outcome affect demand significantly. This article is organized as follows: The next section provides a literature review on sports betting in general as well as potential market inefficiencies. The following empirical analysis determines drivers of betting volumes and number of matched bets on English Premier League. The article concludes with final remarks and avenues for future research.
Literature Review
Sports betting has drawn huge academic interest in the past and still does today. Major research interests refer to the way bookmakers set their prices, 4 whether odds are biased 5 and—as of late—what affects demand for sports bets.
Part of academic research in determinants of betting behavior deals with general motives of bettors. While early studies generally describe the bettor as an investor whose single interest is to maximize profits, Samuelson (1952) is the first to challenge this assumption. Later, Conlisk (1993) models theoretically that gambling provides utility in itself. The importance of consumption motives is empirically shown by Paul and Weinbach (2013). 6
Doing more detailed research on the determinants of betting behavior has longtime been limited due to the reason that only information for the supplier-side (bookmakers’ odds) has been available. Investigating the demand-side on the betting market becomes possible by observing betting volume. This has hardly been done in the past. Gramm, McKinney, Owens, and Ryan (2007) investigate what drives betting volumes in horse racing. They find that the day of the event is important as the quality of the participants raises betting volume, while a larger number of simultaneous races has a negative effect. Paul and Weinbach (2010) test which factors influence betting on NBA and NHL games during the 2008-2009 regular season, operationalized by the number of bets being placed on these matches. They find that betting behavior is similar to fan behavior as the quality of the teams is found to be positively related to the betting volume as well as games which are thought of as more high scoring than others. Bettors further seen to dislike heavily lopsided contests opposed to televised games, which attract more betting action than others as do games being played on public holidays. Paul and Weinbach (2013) find similar results. In their study of the NBA seasons from 2004-2005 to 2006-2007, they confirm the positive effects of TV coverage and the quality of the teams. Further, they find an increased number of bets for weekend games as well as the games of the most popular teams seem. Humphreys et al. (2013) are the first (and to date only) to analyze the amount of dollars bet as a dependent variable to investigate determinants of betting volume of NCAA men’s basketball games from the 2008-2009 season. Similar to previous research, they find bettor behavior being closely related to fan behavior as the quality of the teams, increased uncertainty of outcome, and TV coverage have positive effects on the betting volume.
Empirical Analysis
Our data set contains information on bets on each match of the English Premier League played between the seasons 2009-2010 and 2015-2016. The data stem from the online betting portal betfair.com. Betfair is the world’s leading sports betting and gaming exchange with about 5 million customers worldwide. 7 Revenue exceeded 1,500 million in 2016 (https://www.paddypowerbetfair.com/∼/media/Files/P/Paddy-Power-Betfair/documents/annual-report-2016.pdf).
Betfair bettors have two alternatives to bet: They can either bet on an event occurring (back bet) or an event not occurring (lay bet). 8 Traditional betting refers to former alternative where only back bets are possible. Betfair itself both act as a traditional bookmaker by setting fixed betting odds and as a betting exchange, that is, it matches back and lay bets at stated odds and withholds a certain percentage of profits in order to generate earnings. A bet comes off only in case that a back (lay) bet can be matched to at least one lay (back) bet. 9 The following analysis focuses on exchanged bets as information on “traditional” bets placed on betfair.com is unavailable. The business model differs from that of traditional bookmakers by mainly working as an intermediary between bettors. In contrast to traditional bookmakers, the Betfair exchange platform realizes profits independent from the game outcome since they do not wager their own money but charge a commission on winning bets. As they do not take any risk, their commission can be lower than the commission of other bookmakers, resulting in potentially favorable odds to bettors. 10 Since there is no risk in being the intermediary instead of wagering own money, the betting exchange does not limit individual wagers.
Furthermore, bettors can offer bets at individual odds respectively choose between different odds and are not restricted to fixed odds offered by the bookmaker. Odds offered at a particular time are identical to all bettors in the market and are fixed once a bet is matched. However—as already explained—a bet comes off only in case another bettor lays or backs, respectively, the odds offered. For each of the 2,660 matches (380 matches per season), we know the sum of wagers and the number of matched bets for manifold bets. However, we only include bets that are placed before the start of a match into our analysis since in-game betting volumes are changing in accordance to game dynamics which are difficult to cover as time stamps for all bets would be needed.
There are more than 200 different kinds of pregame bets for the majority of matches, for example, bets on match outcome, the correct score, the number of goals, or a combined bet of the winner of the first half and the winner of the match, to name but a few. Whereas North American sports betting is mostly dominated by point spread betting, our data include a variety of different betting types. Point spread betting in European soccer betting markets is typically called “(Asian) handicap” betting, which is also included in our data. Table 1 summarizes the most prominent types of bets in our data. It shows that only 2% of the matched volume refers to Asian handicap bets. However, about 78% of pregame bets in our sample are placed on the following “standard” types of bets: match odds (home win, away win, or draw), over/under 2.5 goals, and correct score. We use the sum of matched (back and lay) bets (NumberBets) as well as the amount of pounds bet (PoundsBet) per match as our response variable.
Matched Volume Broken Down to Different Betting Types.

Figure 1 shows the distribution of the amount of pounds bet and the number of matched bets placed on a Premier League match. Both distributions are similarly skewed to the right. Hence, we use the logarithm of both variables in the following regressions. As both volume of pounds bet and number of matched bets reflect demand for sporting bets, we assume that these two variables are highly correlated. Figure 2 confirms this assumption.

Distribution of pounds bet and number of matched bets.
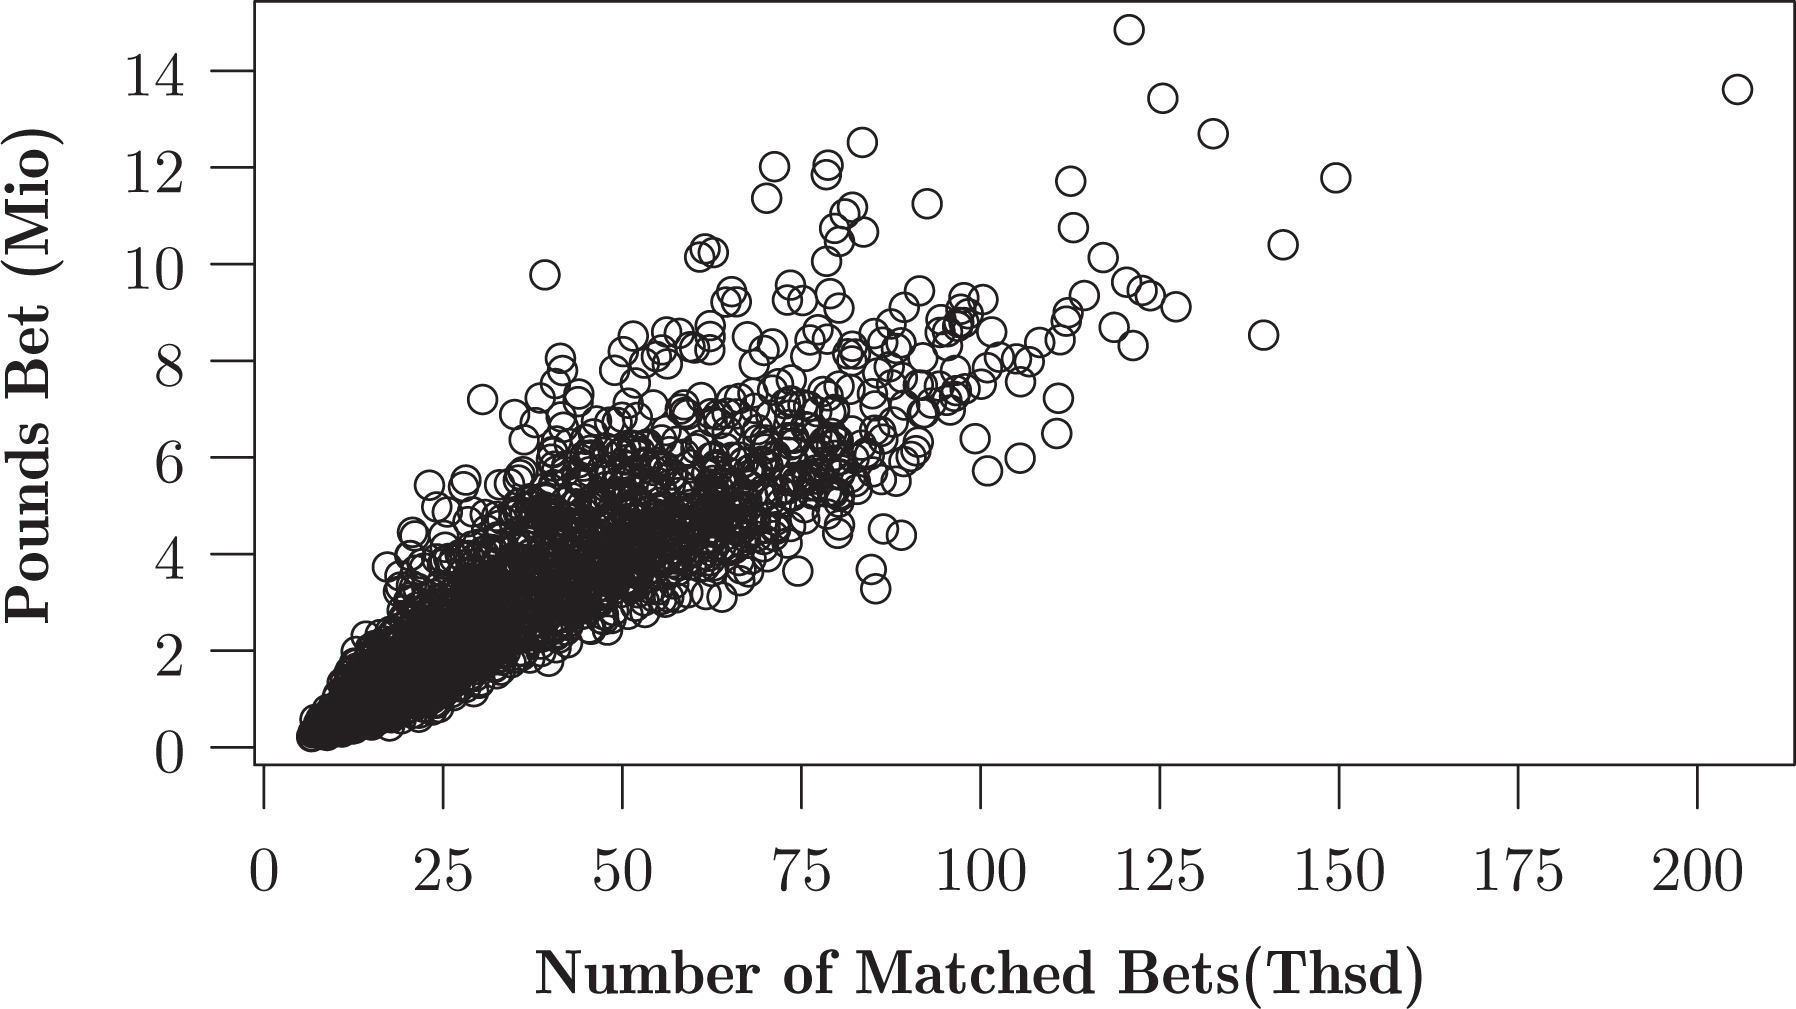
Scatter plot pounds bet and number of matched bets.
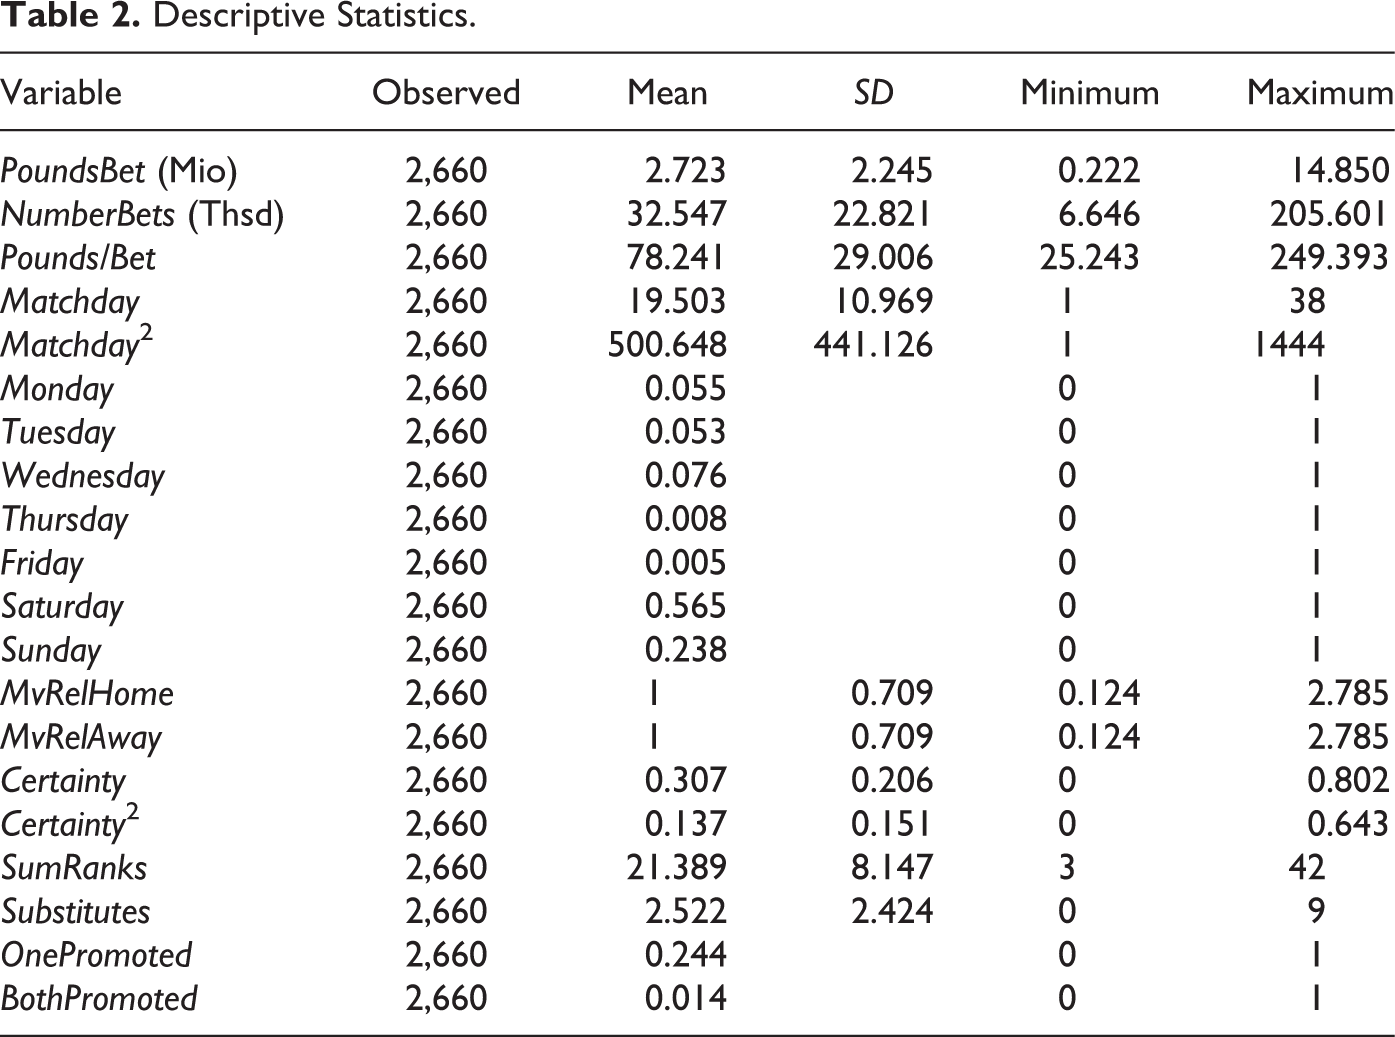
The corresponding correlation coefficient is .9. Bettors place on average more than 32.5 thousand bets on a game corresponding to a volume of more than 2.7 million pounds and an average wager of about 78 pounds 11 (see Table 2), indicating a huge economic significance of sporting bets. 12
Descriptive Statistics.
In order to analyze and comprehend bettors’ behavior, we focus on determinants which have been suggested to affect demand for sporting bets. Similar to Paul and Weinbach (2010) and Humphreys et al. (2013), we estimate two models with the number of matched bets (NumberBets) and the amount of money bet (PoundsBet) as response variables. For both models, we use regressors reflecting characteristics of the home and away team. In addition, we account for temporal factors, such as the season, the day of the week, or the matchday. We also considered the kickoff time as an explanatory variable, but excluded it in the end as time depends on the weekday of a match in most cases.
Figure 3 illustrates the distribution of weekdays. Most matches (56.5%) take place on a Saturday. While both Paul and Weinbach (2010) and Humphreys et al. (2013) consider information on the month of a year, we choose to use the matchday 13 instead. This enables us to model the seasonal dynamics in more detail. We assume that demand for sporting bets is higher for matches played at the beginning and end of a season. Therefore, we also include the square of the matchday in the regression.

Distribution of matches through the week.
Over the years, gambling laws and restrictions have changed in several countries. Hence, the number of potential bettors are subject to fluctuations over time. Furthermore, demand for sporting bets may be affected by a (global) time trend. Figure 4 shows that the average number of matched bets placed on a match increases almost linearly from 2009 to 2015 (from about 26,000 to 37,000), while the total amount of money bet decreases (from about 3 to 2.5 million). The average wager decreases from 102 pounds in 2009 to 64 pounds in 2015. We therefore include year dummies into our analysis.
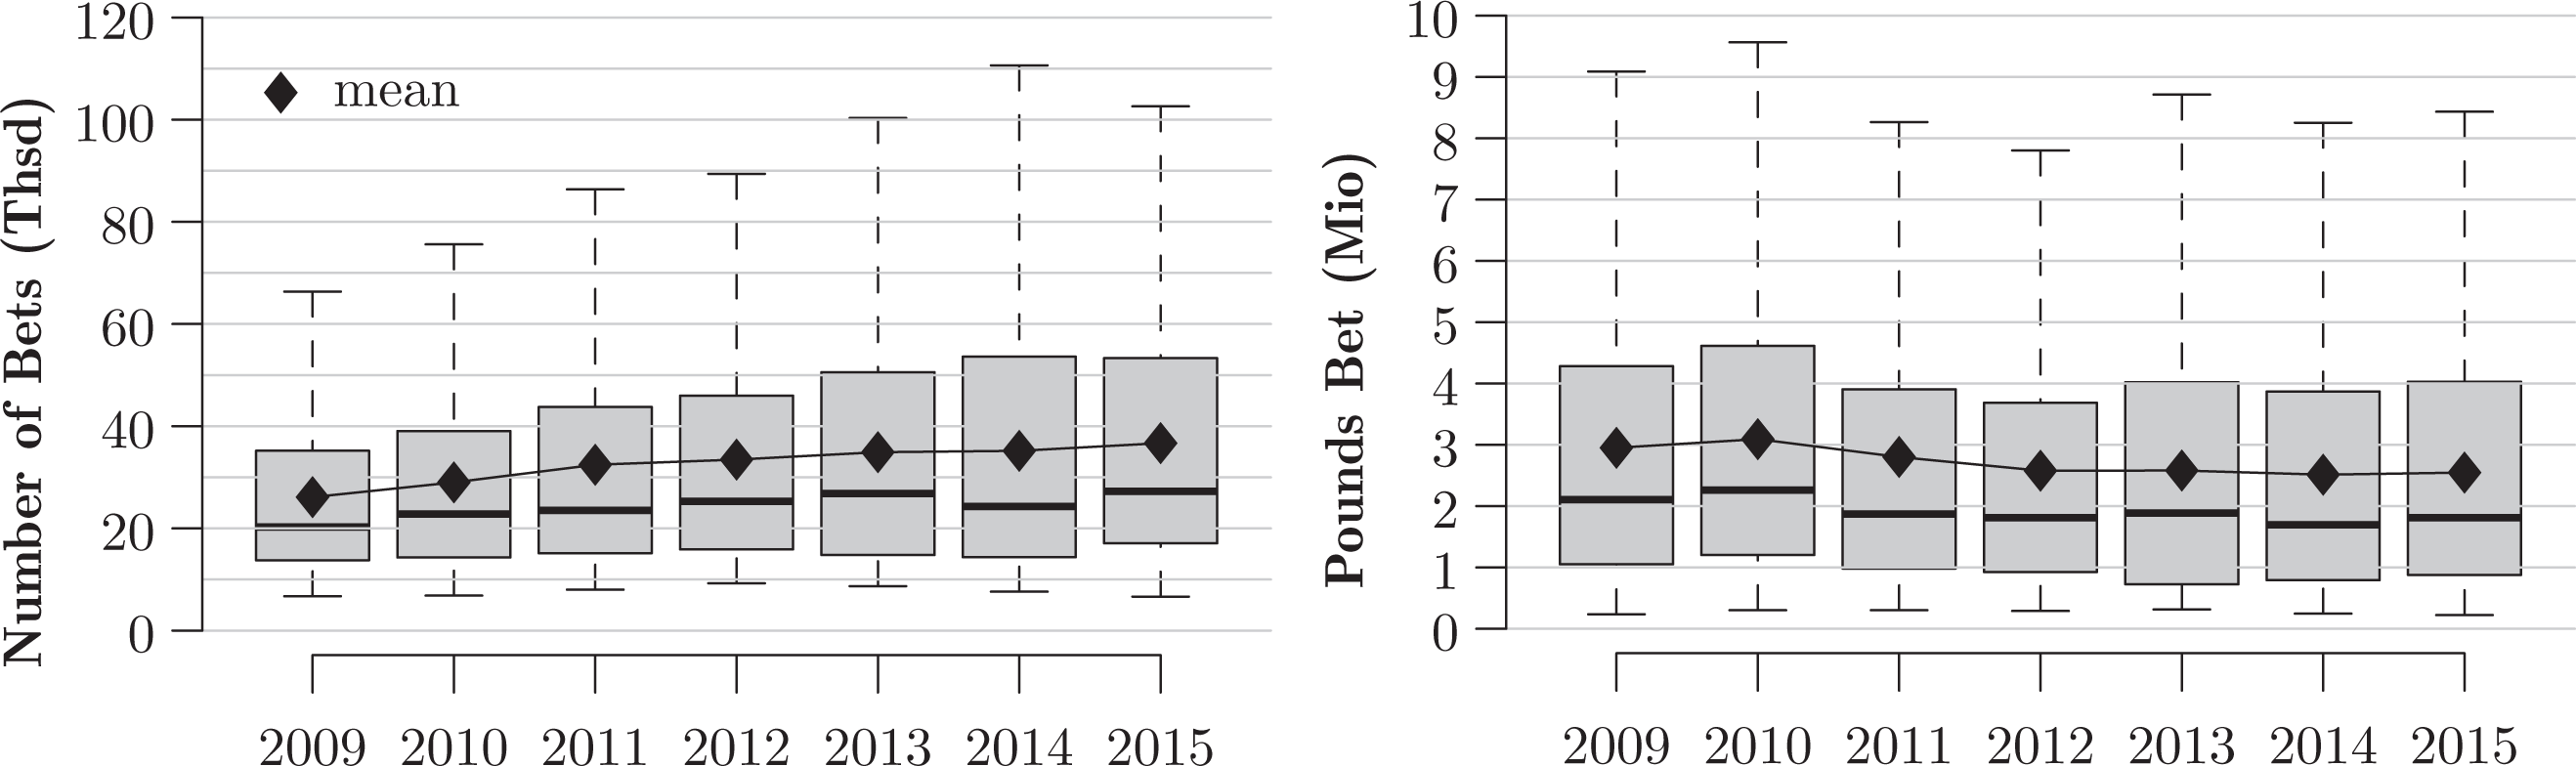
Boxplots: Average number of bets/pounds bet per season.
We further assume a match’s uncertainty of outcome, the number of potential substitutes, and the quality as well as popularity of the participating teams to determine bettor’s behavior.
The uncertainty of outcome may have two opposing effects on betting action. On the one hand, (un)certainty reflects the financial attractiveness of a bet. The higher the perceived certainty of a match outcome, the more likely the bet on this outcome will succeed. Hence, more bettors may choose to place a bet on this outcome. On the other hand, uncertainty may positively affect the decision to place a bet on a match because these matches are perceived as more “exciting”. Hence, these matches might have a higher betting volume as risk-seeking bettors as well as bettors who are afraid of risk are drawn to these games. Given the specifics of the Betfair betting exchange with a back and a lay side, an uncertain outcome on the back side of the market is matched with an uncertain outcome on the lay side at the same odds, that is, if the back odds for a home win are at 2.0, the lay odds against a home win are also at 2.0, since both outcomes have comparable probabilities. For relatively certain outcomes, low back odds are matched with high lay odds, for example, if the back odds for a home win are at 1.05, the lay odds against a home win are at 21, 14 since both outcomes have very different probabilities. 15
We control for uncertainty of match outcome by using betting odds. Since bettors who place bets on Betfair can choose between different odds, it seems inappropriate to use Betfair odds. Hence, we make use of another popular bookmaker, namely, bwin. We measure the match uncertainty as the absolute difference between the winning probabilities of the two teams, which we derive from their respective betting odds.
Another determinant of demand for sporting contests refers to the quality of a contest. Better teams attract more fans than teams of lower quality (see, e.g., Borland & MacDonald, 2003). As Paul and Weinbach (2010) and Humphreys et al. (2013) show that the same is true for demand for sporting bets, we include the sum of both team’s ranks before the respective match 16 as well as market values of both the home and away team in the regression. A further aspect affecting the demand for sports and its bets refers to TV transmissions. The abovementioned studies find a significant and positive effect of TV coverage on bet volume. However, we omit this variable since Betfair users—on the contrary to betting platforms analyzed in the two studies—are residents from different countries. Since Premier League matches are partly broadcast in these countries and partly not and we are not able to connect bet volume to countries, it is not possible to analyze the effect of TV on bet volume for the given data. Furthermore, the availability of online streams could blur the effect of live TV coverage. The Internet offers (often illegal) streams for all games covered in our data set. Hence, the effect of TV coverage and online streaming is not taken into account.
The availability of substitutes is a relevant determinant for the demand for a certain product. The more substitutes are available, the lower the demand. A potential substitute for placing a bet on a certain match is placing a bet on another match. Even though it is possible to bet on future matches, we expect that the number of matches taking place in the Premier League at the same time has a negative effect on betting action.
The decision to place a bet on a certain match may also be affected by a team’s status as being promoted to the Premier League for various reasons. On the one hand, promoted teams are often of minor playing quality than teams that have played in the first division since several seasons because financial opportunities are much larger in the Premier League compared to the Championship competition. This may reduce the interest for matches with promoted teams. Second, it is more difficult to forecast the winning probabilities of promoted teams since no or only few observations are available for matches of these teams against other Premier League teams. Bettors, just like bookmakers, may therefore underestimate or overestimate winning probabilities of promoted teams which may result in financially more attractive bets (Deutscher, Frick, & Ötting, 2018). Third, fans of recently promoted teams might be euphoric about the promotion of “their” team to become interesting in betting on them. This could also result in arbitrage opportunities by betting against those bettors new to the market (similar to the sentiment bias with bookmaker odds, e.g., Feddersen, Humphreys, & Soebbing, 2017). Since the data do not allow to distinguish between those explanations empirically, we simple control for recently promoted teams. We include dummy variables to reflect whether one or both teams were promoted to the Premier League prior to the season.
Table 2 shows descriptive statistics for the variables that we consider in our analysis. The sources for the explanatory variables are the websites www.weltfussball.de, www.transfermarkt.de, and www.football-data.co.uk. On average, about 2.7 million pounds are bet per Premier League game. Minimum values of PoundsBet as well as NumberBets refer to the match of Aston Villa against Swansea in the season 2015-2016. Most money was placed on the match Manchester United against Arsenal FC in 2010-2011, while most bets were placed on the match Manchester City versus Manchester United in 2011-2012. The data set includes both very balanced and unbalanced matches. The winning probability of the home team equals the winning probability of the away team in 25 games. Manchester City against Crystal Palace (2013-2014) represents the most unbalanced game in our observation period. The mean market value of a Premier League team is 192.9 million euros (min: Norwich in 2011-2012, max: Chelsea in 2013-2014). The spread between the least and most valuable team is very large. In 2011-2012, Chelsea’s team was 21 times more valuable than the least valuable team from Norwich. As the mean market value increases over the years, we use the relative market value per team and season in the following analysis. Finally, promoted teams participate in approximately 26% of all matches. Table 3 presents correlation coefficients for the main explanatory variables.
Correlation Matrix of Main Explanatory Variables.
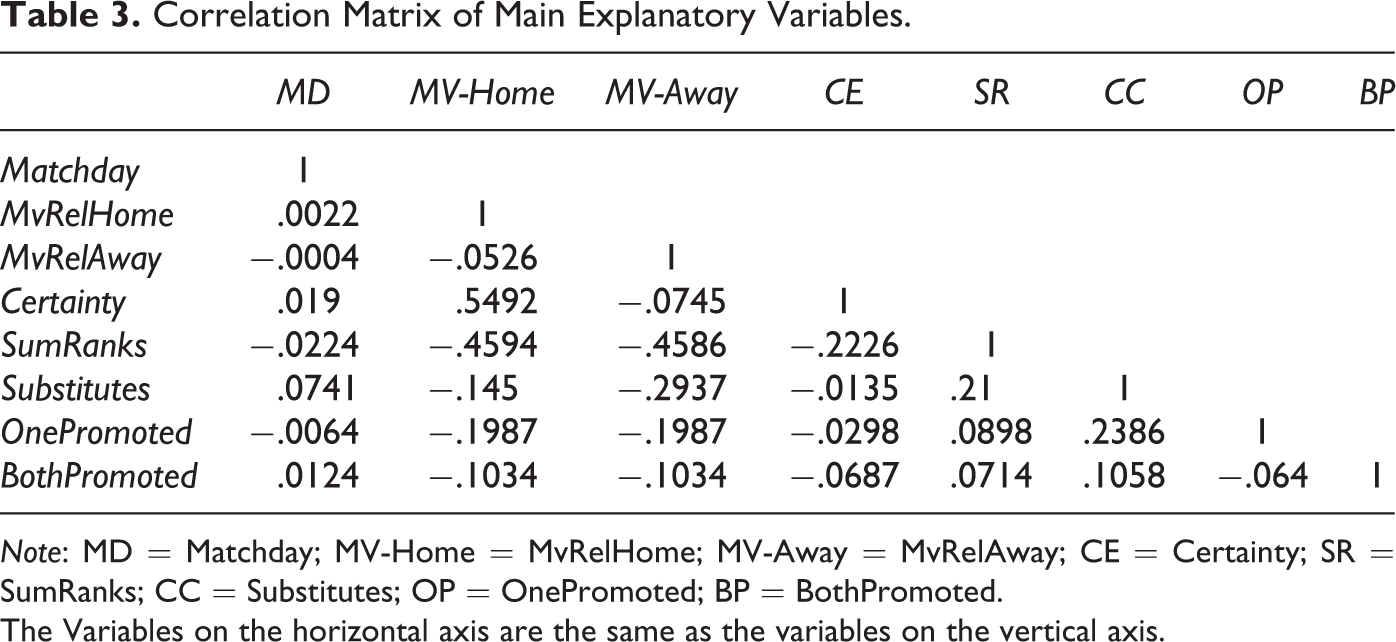
Note: MD = Matchday; MV-Home = MvRelHome; MV-Away = MvRelAway; CE = Certainty; SR = SumRanks; CC = Substitutes; OP = OnePromoted; BP = BothPromoted.
The Variables on the horizontal axis are the same as the variables on the vertical axis.
Methodology
The empirical analysis focuses on determinants for betting volumes in sports betting. Hence, we refer to the number of matched bets (NumberBets) per match as well as the sum of wagers (PoundsBet) placed on a match as the dependent variables in Equation 1. Due to the positive skewness of our response variables (cf. Figure 1), the betting volumes enter the model (1) in logarithmic form. Several explanatory variables are included in a linear and a quadratic form in order to account for possible diminishing/increasing marginal effects. In the first part of the analysis, we present results of ordinary least squares regressions. In the second part (see Flexible Approach section), we use the flexible Generalized Additive Models for Location, Shape and Scale (GAMLSS) in order to consider possible nonlinear effects of noncategorical variables. Furthermore, the GAMLSS framework allows to model several parameters of the assumed distribution of the dependent variable simultaneously instead of considering only the mean (Rigby & Stasinopoulos, 2005). For our data, this is beneficial due to the presence of heteroscedasticity.
Linear Model
This part of the subsection describes the estimated model in more detail. Equation 1 shows the regression model including all covariates mentioned above. A Breusch–Pagan test rejects the null hypothesis of homoscedasticity of our linear model (1). Hence, we use heteroscedasticity-consistent standard errors in our analysis. In the following, yijms represents either the number of matched bets or pounds bet on a match between home team i against away team j at matchday m in season s. For notational simplicity, we omit the indexes, leading to the following form of our model:
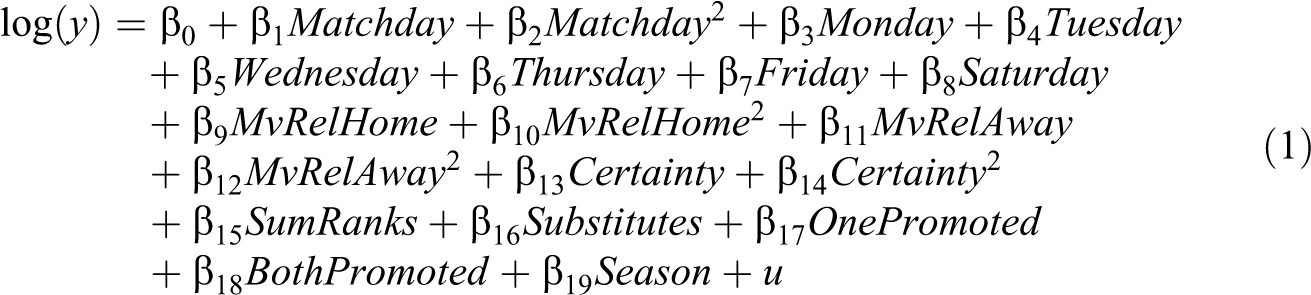
Table 4 reports the regression results for the dependent variables PoundsBet and NumberBets. Table 5 shows the respective standardized β coefficients of the variables. Accordingly, R2 and adjusted R2 are very high in both regressions, indicating that the chosen variables explain a considerable variation of demand for sporting bets. Almost all variables are statistically significant on a 1% level.
Regression Results.

Note. Robust standard errors are in parentheses.
*p < .1. **p < .05. ***p < .01.
Regression Results: Standardized β Coefficients.

*p < .1. **p < .05. ***p < .01
Due to the high correlation between PoundsBet and NumberBets, results of the estimated models are very similar. There is only one difference between the two models: While there is an increasing marginal effect of uncertainty of outcome on PoundsBet, the effect on NumberBets is rather linear. However, both variables are positively affected by an increasing certainty of outcome. The more likely a match outcome, the more pounds and bets are placed on a match. This contradicts the results of Paul and Weinbach (2010) and Humphreys et al. (2013) who find that bettors tend to prefer uncertain over lopsided matches. The contradictory result of NCAA bets may be due the number of “points” scored per game. Soccer represents a “low-scoring” sports, that is, a single goal can decide a match. Hence, luck can have great influence on the match outcome resulting in more frequent unexpected match outcomes than in “high-scoring” sports, such as basketball. In a basketball match, the favorite has far more possibilities to score, resulting in lower probabilities to lose a match. Therefore, small differences in ex ante winning probabilities may be more decisive in basketball than in soccer matches.
Table 4 also shows that Matchday has a nonlinear (inverted U-shaped) effect on the dependent variables. The turning point for PoundsBet is 15 whereas it is 21.5 for NumberBets. We discuss this result in more detail in Flexible Approach section. With respect to the weekdays, results show that highest demand exists for matches played on Fridays and lowest demand for matches played on Wednesdays and Saturdays. 17 Except for Tuesday, all variables indicating the day of the week are statistically different from the reference category Sunday. The negative coefficient of Saturday is potentially caused by the fact that the number of potential substitutes, that is, matches played in other popular soccer leagues, such as the German Bundesliga, French Ligue 1, or Spanish Primera Division, is very high. According to our estimation results, the higher the number of available substitutes, the lower is, on average, the demand. Conversely, if only few matches with popular teams are scheduled on the same day, the demand for bets on these matches should be higher. Accordingly, the demand for matches played on a Monday is very high, as there are only few matches played in other European soccer leagues on this weekday. 18 The quality of the match significantly affects the demand for sporting bets. The better both teams are ranked in the table prior to a match (SumRanks) and the higher the relative market value of the home (MvRelHome) and away team (MvRelAway), the higher the demand for bets. However, the market value has a nonlinear, inverted U-shaped, effect on demand. In case the market value of the home team exceeds about the 3-fold and the away team about the 2.8-fold of the average market value, demand for bets decreases once again. There is no observation of a team with a market value above 2.785 in our data set, however.
The coefficient of the variable Substitutes confirms that the number of substitutes and the demand for an asset are related to each other: The more matches are played simultaneously, the less the demand for bets of a match. Betting volume is (significantly) higher if promoted teams participate (see Tables 4 and 5).
The standardized β coefficients presented in Table 5 show that variables reflecting the playing qualities of the home and away team (MvRelHome, MvRelAway) and the number of Premier League matches taking place simultaneously (Substitutes) have strongest impact on demand for bets.
Flexible Approach
Our regression models include several variables in both linear and quadratic form (see Equation 1). In order to investigate whether effects of a higher order might be accurate, we introduce the very flexible class of GAMLSS, which allows to estimate smooth functional effects of noncategorical regressors (Rigby & Stasinopoulos, 2005). Estimating smooth functional effects enables us to examine the relationship between dependent and independent variables in more detail. Furthermore, the GAMLSS model framework allows to simultaneously model several parameters of the distribution of the response variable (e.g., mean and variance) instead of modeling only the mean as in a classical linear regression model. Due to our heteroscedastic data, we can improve the model fit by additionally including the standard deviation of the betting volumes into our analysis. Formally, we apply the semiparametric additive formulation of GAMLSS by Rigby and Stasinopoulos (2005), given by:
where θ
k
is a parameter of the distribution assumed for the response variable
Another advantage of the GAMLSS framework is that several distributions for the response variable are allowed, which do not have to be part of the exponential family. Due to our skewed betting volumes (cf. Figure 1), we tried several different right-skewed distributions for our response variable


The explanatory variables described in Empirical Analysis section enter the model in (3) and (4) in different ways. The dummies used in the linear model (1), that is, dummy variables for season, weekday, and promoted teams, are included in the linear parts both in (3) and (4). We estimate smooth functional effects for the noncategorical variables of our model which refer to competitive balance measured by the difference in winning probabilities (Certainty), market value for the home and away team (MvRelHome, MvRelAway), matchday (Matchday), and the sum of the positions of the teams in the league table (SumRanks). Thus, both predictors for μ and σ are as follows 19 :

The vector
As estimated smooth functional effects are very similar for both response variables, we present subsequently only those for the dependent variable PoundsBet. The estimated effects of the dummy variables are very close to the ones of the linear model (cf. Table 4). The smooth functional effects for model (5) are presented in Figures 5 and 6. For the effects on the mean (Figure 5), the effects of SumRanks, Certainty, and MvRelHome are linear functions with negative slopes. Surprisingly, the marginal effect of the (relative) market value for the away team on demand for sports bets diminishes, whereas the marginal effect for the market value of the home team is linear. For the Matchday, a more flexible smooth function is estimated. The estimated effect shows that the effect of Matchday varies considerably. There is a local maximum at matchday 20, which refers to matches played between December 28 and January 4. Hence, the high demand for sports bets may be explained by public holidays worldwide in most countries. Demand for sporting countries is positively affected by holidays which tends to be true for sporting bets, too. In some countries, employees also receive a Christmas bonus at this time of the year which may increase the demand for bets as well as additional money is spendable.
Estimated smooth functional effects from model (5) on the mean including point-wise confidence intervals.
Estimated smooth functional effects from model (5) on the standard deviation including point-wise confidence intervals.
The mean of the betting volume decreases after its maximum and increases again at the end of a season. These effects are hard to accommodate within a linear model. The substantial increase in betting volumes at the end of the season may refer to the fact that at this time, there are often matches which are of crucial importance for some of the teams, for example, with respect to championship, qualification for the European competitions Champions or Europe League or relegation. This great importance of some of the matches may positively affect demand for sporting bets. Furthermore, summer break begins after the last matchday; hence, these are the last opportunities for bettors to place bets on matches in the Premier League for a while. The general course of Matchday may be explained by two reasons. First, in the course of a season, more information on teams’ shape and playing qualities is available. Hence, bettors are able to forecast the potential winner of a match more precisely, resulting in less attractive odds which may decrease demand for bets. Second, some bettors may quit betting in the course of a season due to unsuccessful bets.
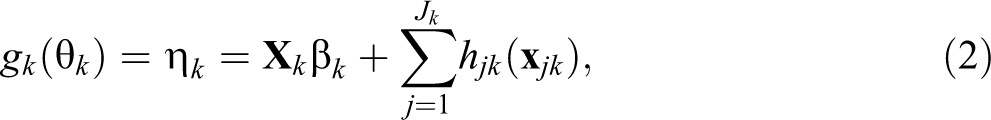
Modeling the standard deviation as a function of Matchday and Certainty did not improve the model fit according to the Akaike information criterion. Thus, there is no systematic trend for the standard deviation with respect to Matchday and Certainty. The estimated smooth functional effects for MvRelHome, MvRelAway, and SumRanks on the standard deviation are the only ones which improved the model fit. All effects seem to be rather linear, indicating that the standard deviation in betting volumes tends to be lower for teams with a higher market value (cf. Figure 6).
Final Remarks
Our empirical results indicate that determinants for demand for sporting events are similar to those for sporting bets. Match quality, uncertainty of outcome, time, and economic factors significantly affect bettors’ behavior, confirming previous results on betting demand (Paul & Weinbach, 2010; Humphreys, Paul, & Weinbach, 2013). However, Betfair bettors of Premier League matches prefer (ex ante) lopsided matches while bettors of NBA, NHL (Paul & Weinbach, 2010), or NCAA basketball (Humphreys et al., 2013) matches rather enjoy wagering on close and uncertain games.
Limitations to the study are given by, first, missing control for live TV coverage of games, which has shown to influence betting (Humphreys et al., 2013). Further, by not including TV coverage, our approach might yield an omitted variable bias, since the information on TV coverage might correlate with other variables in our model. TV stations might prefer to cover matches of high-quality teams or matches with a high ex ante uncertainty of outcome. Thereby, the coefficients of our variables MvRelHome/MvRelAway and Certainty would be biased. However, betting at Betfair is possible from (almost) all over the world and information on bettors’ origin is unavailable. Given that live TV coverage of games differs between countries, it is impossible to link TV coverage to betting behavior in our context. Second, this article regards a singular source, Betfair, for the estimation of betting market turnover. While this restriction is derived from the lack of additional available data, Betfair is among the biggest betting exchanges worldwide. Since betting odds do not vary substantially between bookmakers, we assume similar betting behavior at other bookmakers. Third, this article applies pregame betting only while it does not account for in-game betting, which draws large interest from bettors as well. Still, in-game betting critically depends on the dynamics of the game such as early goals. The wide range of potential game dynamics is hard to capture in an econometric model. Fourth, we do only analyze betting volumes summed up per match and do not analyze how much money is bet on a particular outcome, for example, on the win of a certain team. Followed by that point, the effect for some variables, for example, the uncertainty of outcome of the match, might differ across the several betting types.
By deepening the comprehension of determinants of betting volumes, it is possible to identify unusual deviation between expected and actual betting volume for singular games, referees, or teams. Whereas the usual procedure by fraud detection systems such as “Sportradar” is to compare fair and actual betting odds in order to detect fixed matches (see Forrest & McHale, 2015), further insights can be achieved by analyzing also the betting volumes (Ötting, Deutscher, & Langrock, 2017). Since in liquid betting markets large betting volumes are needed to observe odds movements, some fixed matches might be missed in large markets due to only little odds movements. Thus, analyzing betting volumes additional to betting odds can serve as a starting point in detecting match fixing (Deutscher, Dimant, & Humphreys, 2017).
Considering the betting volumes from just one betting platform can give an idea of the financial importance of game outcome. Imagining the growing number of online bookmakers, paired with the large black market for illegal betting, gives an idea that the financial importance of a match is no longer to the participating teams but to the business covering sport betting. It surely does not wonder that team sponsoring by bookmakers has become the rule.
Footnotes
Appendix
Declaration of Conflicting Interests
The author(s) declared no potential conflicts of interest with respect to the research, authorship, and/or publication of this article.
Funding
The author(s) received no financial support for the research, authorship, and/or publication of this article.