
Abstract
Toward the end of the 1990s and into the 2000s, Major League Baseball teams moved away from fixed ticket prices, to first setting prices according to expected game demand, and subsequently to dynamically changing prices in response to demand. Teams have also collaborated with secondary ticket marketplaces to sponsor resale. By exploiting a team panel covering seasons 1999-2017, we use fixed effect models to estimate the impact of these pricing innovations on team revenue and team value. Variable pricing increases revenue and team value by 4.2% and 9.5%, respectively. The introduction of dynamic pricing and sponsored secondary markets has no statistically significant effect on revenue or team value.
The economics of ticket pricing for sports events has changed considerably over the past 30 years. By leveraging innovations in data analytics and ticketing technologies, and increased public acceptance of demand-based pricing, many franchises have introduced new ways to price tickets. Variable pricing and dynamic pricing have been widely adopted by the four major North American professional sports leagues, although there is variation in adoption rates across and within leagues (Huefner, 2017). There has also been a shift in the legalization and legitimization of secondary ticket markets with many teams now sponsoring, rather than fighting, resale (Shapiro & Drayer, 2012). This article uses a two-decade panel of Major League Baseball (MLB) teams and applies a quasi-experimental approach to estimate the effect of variable pricing (VP), dynamic pricing (DP), and sponsored secondary markets (SSM) on revenue and team value.
Up until the late 1990s, sports franchises would price tickets largely according to seat location, setting prices before the season began, and keeping prices constant for the season (Fort, 2004). However, fans do not value all games the same. Marquee matchups are more exciting to watch, demand is lower in colder months, and there is more interest for Saturday afternoon games. The Colorado Rockies are credited with being the first team to introduce VP in 1997 by charging an extra US$8 per ticket for popular games. VP refers to setting, before the season begins, different prices for identical seats in different games. DP gives teams the opportunity to change the price of a ticket, for a given seat in a given game, at any time up to the start of the game (Paul & Weinbach, 2013). Teams vary prices depending on the weather, pitching matchups, playoff selection likelihood, winning streaks, and countless other possibilities.
The two aforementioned strategies take place on the primary market, that is, when teams sell single-game tickets the first time. There has also been a revolution in the secondary market, when fans buy tickets from season ticket holders, ticket brokers, or other fans. Traditionally, the secondary market was referred to as scalping and took place outside the stadium and sometimes outside the law. However, with the rise of the Internet and the creation of online marketplaces, such as StubHub, reselling tickets has become easy and legitimate. The teams that initially resisted secondary markets were faced with legal and practical challenges. Teams eventually endorsed resale as an opportunity to share profits through partnerships with resale platforms and to improve data analytics. We use the term “sponsored secondary market” to cover any franchise-owned resale marketplace or partnerships with independent resale marketplaces.
Figure 1 illustrates the growth of VP, DP, and SSM between 1999 and 2017. The data collected to create this figure extend Huefner’s (2017) cross-sectional study of VP and DP to a 19-year panel and also include information on SSM. Figure 1 shows that adoption took place slowly over time. We will argue later that there was uncertainty around these new pricing practices, how they should be implemented in each franchise, and their potential success.
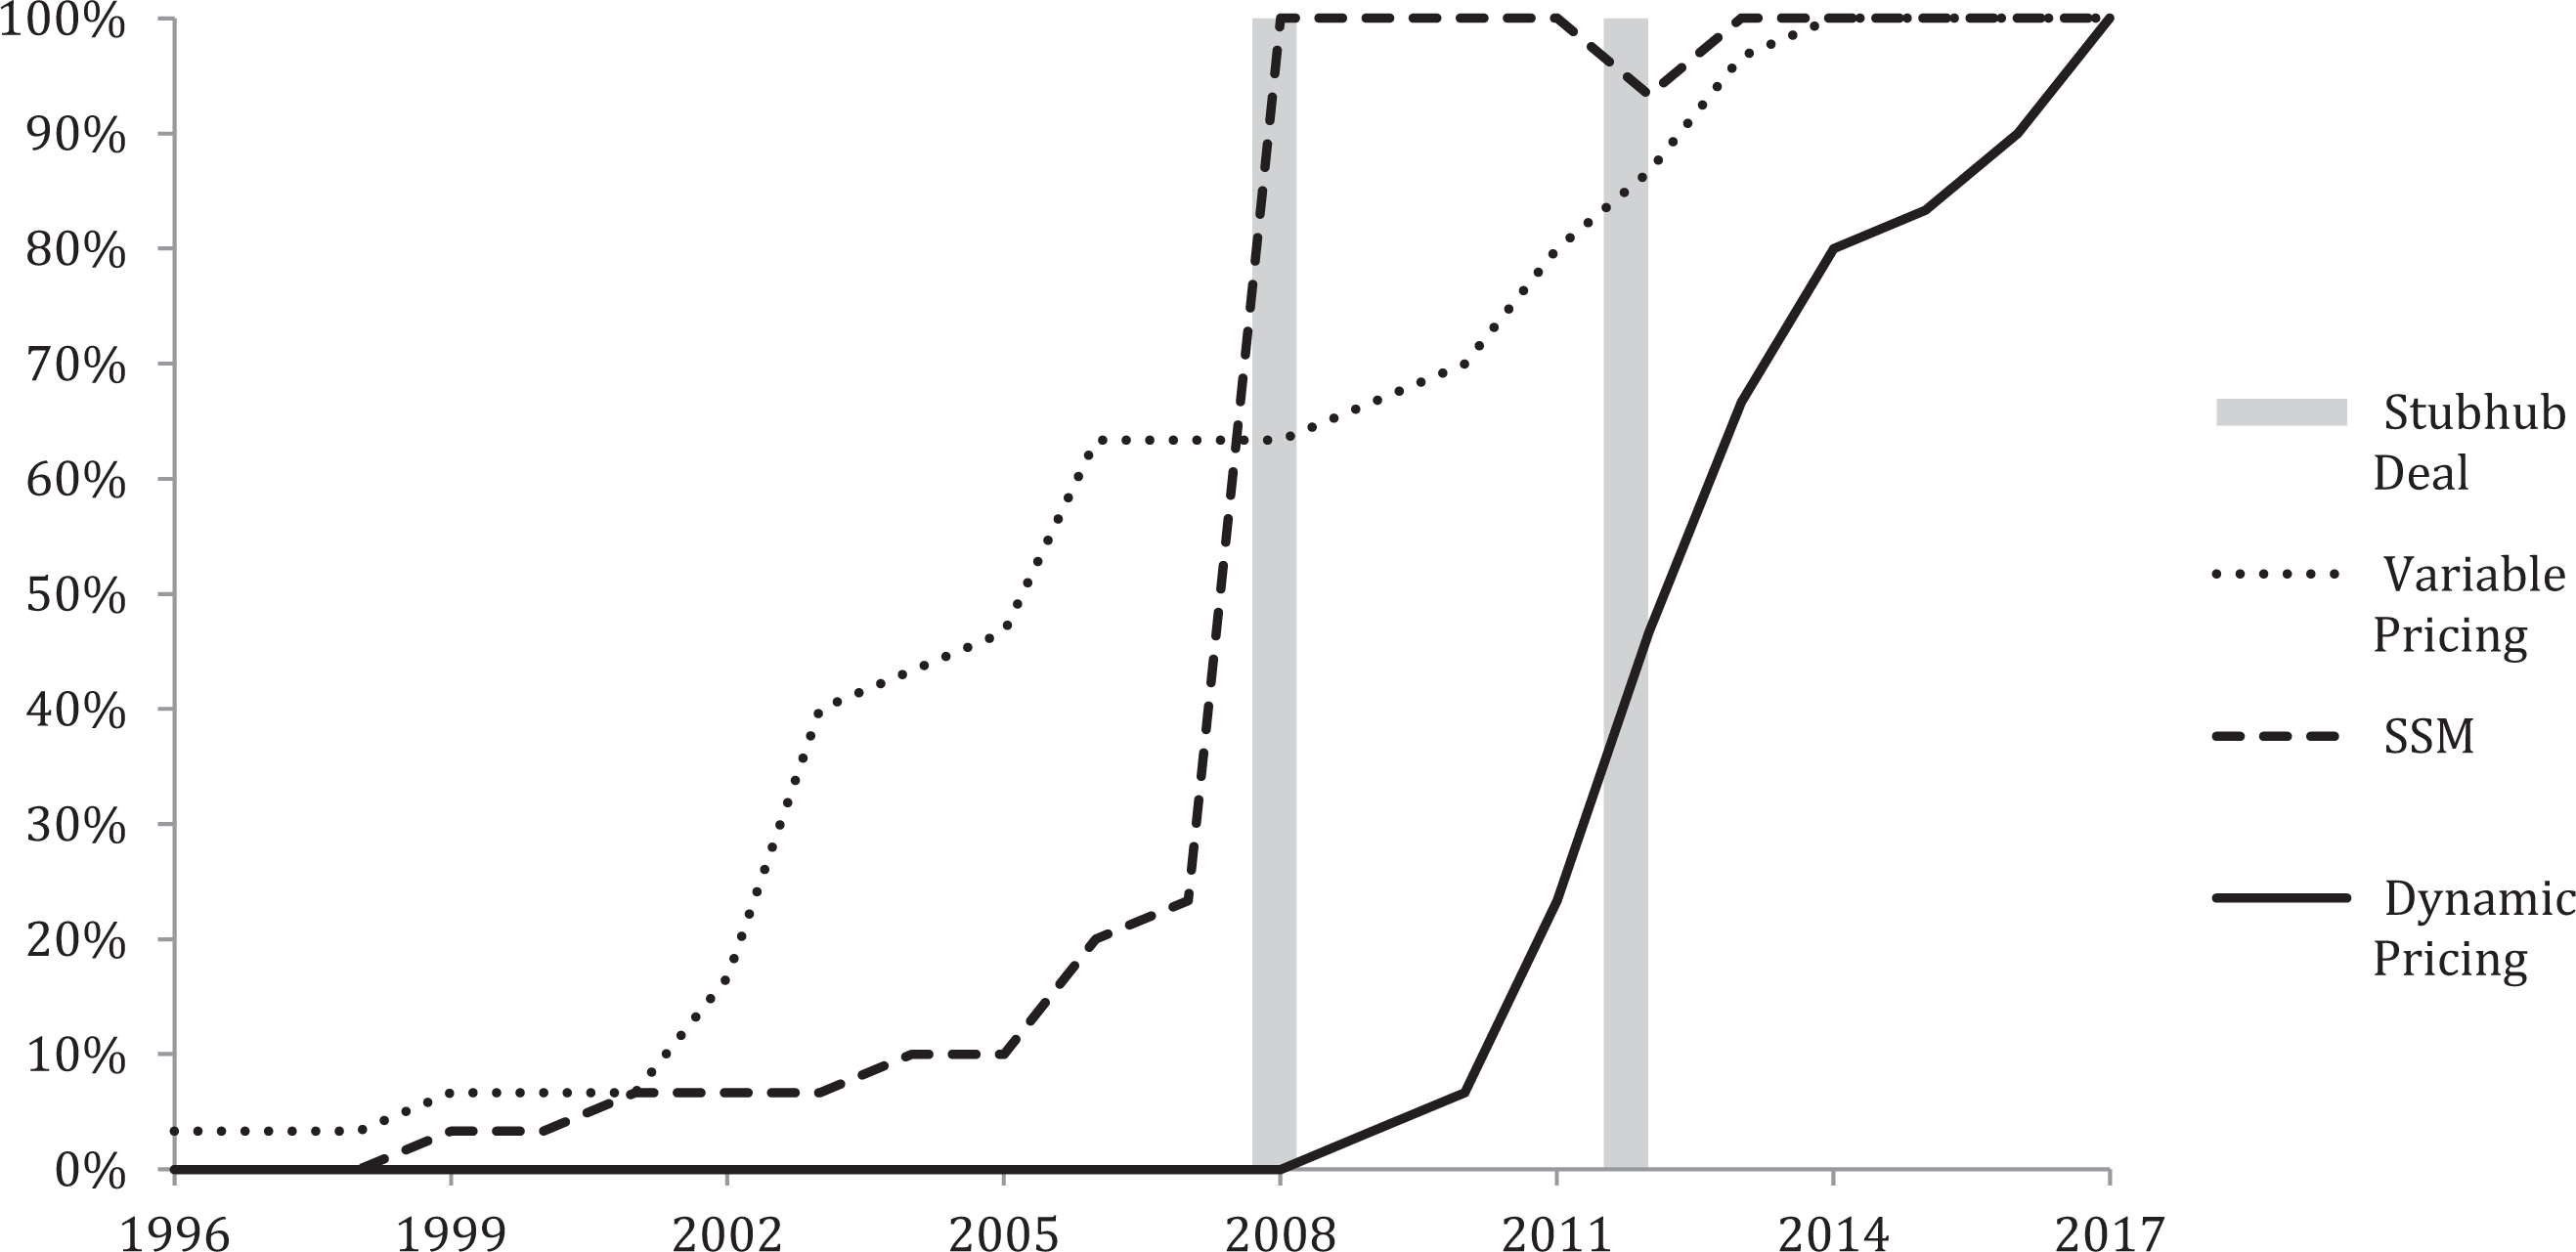
MLB team adoption rates for variable pricing, dynamic pricing, and sponsored secondary markets. (a) The vertical lines in 2008 and 2012 represent the MLB–StubHub agreement and subsequent renewal 5 years later. (b) The dip in 2012 occurs after the New York Yankees and the Los Angeles Angels left StubHub because it did not want to set a price floor and signed with Ticketmaster the following season (Kosman, 2012).
This article investigates whether the three pricing innovations (VP, DP, and SSM) have had an effect on revenue and team value. The quasi-experimental nature of adoption allows us to use a difference-in-difference approach. Use of VP is associated with an increase in revenue of 4.2% and team value of 9.5%. These figures are higher than the impacts reported in the study of Rascher, McEvoy, Nagel, and Brown (2007). In contrast, we find no incremental effect of adding DP (on top of VP) on revenue or team value. This surprising result could be due to the quality of the data or the validity of the empirical methodology, and we discuss these issues at length in Results section. Keeping these caveats in mind, we also argue that the absence of incremental impact is not entirely inconsistent with the literature because our estimates measure the average incremental effect among the teams that add DP, and this effect must be smaller than the maximum possible incremental effect that is simulated in the literature (Kemper & Breuer, 2016; Jiaqi Xu, Fader, & Veeraraghavan, 2019; Zhu, 2014).
Our approach suggests caution in interpreting simulated gains under the hypothetical optimal scheme because such figures ignore unforeseen technical and operational challenges and organizational learning associated with trial-and-error optimization (Bouchet, Troilo, & Walkup, 2016). 1 Finally, the introduction of an SSM does not have an effect on revenue or team value. This is consistent with the popular belief that the introduction of SSM was a defensive response to the growth of secondary markets.
The welfare benefits of price discrimination are notoriously difficult to pin down in ticket markets (Ho, Liang, Weinberg, & Yan, 2017; Leslie, 2004; Jiaqi Xu et al., 2019), and the same holds for resale markets once one takes into account acquisition and transaction costs (Leslie & Sorensen, 2013). VP and DP are welfare enhancing if they implement more efficient allocations of seats. The distributional effects of price discrimination are generally thought to be positive because price-sensitive consumers can obtain lower prices. At the same time, VP and DP increase teams’ ability to leverage market power with potentially large surplus transfers.
This article applies to sports a difference-in-difference approach, which has been successful in industrial organization to study price discrimination (e.g., Nevo & Wolfram, 2002). The application to VP and DP is similar to Courty and Pagliero’s (2012) study of seat pricing in concerts. While most of the literature in sports has studied individual franchises and looked at a single pricing innovation (Kemper & Breuer, 2016; Jiaqi Xu et al., 2019), this is the first article to study the average effect of a new pricing solution across adopting teams within a league.
The article is structured as follows. The next section provides background information about ticket pricing in the MLB. Data and Summary Statistics section presents the data, and Model and Identification section the empirical approach. Results section discusses the results. Summary and Conclusions section summarizes and concludes.
MLB Adoption of VP, DP, and SSM
Several transformations have taken place over the past 30 years in the primary and secondary markets for sport tickets. Huefner (2017) argues that this revolution in pricing was fueled by the growing success of revenue management techniques, including VP and DP, used in the leisure industry (e.g., airline, hotels, cruise ships). Although these practices were known to many sport franchises, seat-based pricing was the industry standard up to the mid-90s, largely because of a broad skepticism that revenue management would work in baseball (Rishe & Mondello, 2004). 2 The president of the Blue Jays, for example, reports that “sports in North America are traditionally slow to change, especially baseball” (Blair, 2002). 3 External factors also contributed to team adoption. Increase in team payroll puts pressure on ticket prices and forces teams to look for alternative revenue sources. Rishe and Mondello (2004) highlight this link: “seasonal changes in team payroll significantly affect the size of ticket price increase.” At the same time, the advent of secondary resale marketplaces revealed obvious revenue opportunities and also socialized fans to demand-based pricing (Shapiro, Dwyer, & Drayer, 2016).
Ticket pricing and revenue management are under the control of individual MLB franchises. The hosting team keeps the majority of revenues from home games, with ticket revenue being teams’ greatest source of income. MLB teams were the first among North American leagues to explore new ways to price tickets and to deal with secondary markets. When a team experiments with a new pricing practice, other teams typically wait for possible fan backlash, implementation hiccups, or other impediments. Once the innovation is proven successful, teams within the league (and in other leagues as well) consider adoption (Huefner, 2017). For example, the Colorado Rockies was the first team to implement VP in 1997. Other teams imitated the practice, and by 2014, three quarters of all MLB teams were using it. This pattern holds for DP (Bouchet et al., 2016). It also holds for the adoption of SSM up to 2008, the year MLB negotiated a league-wide deal with StubHub that gave any team the option to have a StubHub SSM (Drayer, Stotlar, & Irwin, 2008).
VP can take countless forms, from charging a higher price for marquee matchups like the Rockies did, to charging an extra dollar for games during the summer months, to having multiple tiers of games that depend on game days, division rival games, interleague games, and other variables. Whereas MLB teams using VP must still set ticket prices before the season begins, DP allows teams to vary ticket prices over time as new information is revealed about a game’s demand. (See Section 2 in Online Appendix for detailed discussion of DP.) Paul and Weinbach (2013) show that starting pitcher, team success, and weather influence prices, but some teams take other variables into account such as seat inventory, secondary market prices, playoff probabilities, and so on. The application of DP to sports was influenced by significant decreases in the cost of data analytics and ticketing technologies (Bouchet et al., 2016). The entry by independent pricing specialist firms, such as Qcue, which had 15 MLB clients by 2012, also played a significant role in facilitating DP adoption.
While VP and DP took time to become widely accepted, the adoption of SSM was a reactive response to the explosion of online secondary markets (Drayer et al., 2008). Traditionally, teams tolerated occasional resale by season ticket holders but discouraged fans from buying tickets from online scalpers. For example, in 2006, the New York Yankees denied renewal to season ticket holders suspected of systematically reselling tickets. But it quickly proved impossible to exert control over the growing online secondary markets (Courty, in press). Teams also figured that they could claim a portion of the profits within the secondary market. For fans, SSM offers a centralized access to a wide variety of tickets, provides convenience (ownership transfer is often automatically certified by the provider leaving no uncertainty regarding authenticity), eliminates fraud, and lifts the uncertainty associated with the “terms and conditions” of a resold ticket. Teams typically have links on their websites that refer to their partner in the secondary market as their “official” or “sponsored” secondary marketplace, encourage fans to resell their tickets on the sponsored marketplaces, and highlight the increased flexibility and convenience.
It is likely that having an SSM and using VP or DP is complementary because teams can use the pricing data from the secondary market to help inform their pricing strategy on the primary market. Consistent with this view, Watanabe, Soebbing, and Wicker (2013) show that secondary market agreements triggered teams to increase price dispersion within stadiums. Shapiro and Drayer (2012) document interactions between DP and secondary market prices in MLB. Through the use of secondary markets, teams gather data on fans, as they are able to track the ticket from the original purchaser to the electronic scanner at the ticket turnstile on game day. Derek Schiller, a Braves’ executive, reports What has become apparent is free-market economics have given the secondary market more opportunity to have flexibility in pricing than the primary market. Somewhat in response to that, having demand-based pricing allows us to more accurately reflect what the true value of the ticket is for any given game. (Tucker, 2012, p. 1C).
Table 1 reports the adoption years by team for VP, DP, and SSM. While the Colorado Rockies were the first team to adopt VP, it was the San Francisco Giants who first entered in the secondary market in 1999 and the first to introduce DP 10 years later. Six teams have adopted DP without first adopting VP. Since VP is inherently implemented within DP, we assume these teams are using VP once they adopt DP. Teams first adopted VP, followed by joining the SSM, and then implementing DP. The high adoption rates in Figure 1, and the observation that no team has yet to go back on an adoption decision, speak to the success of these pricing innovations.
Adoption Years for Sponsored Secondary Markets, Variable Pricing, and Dynamic Pricing.
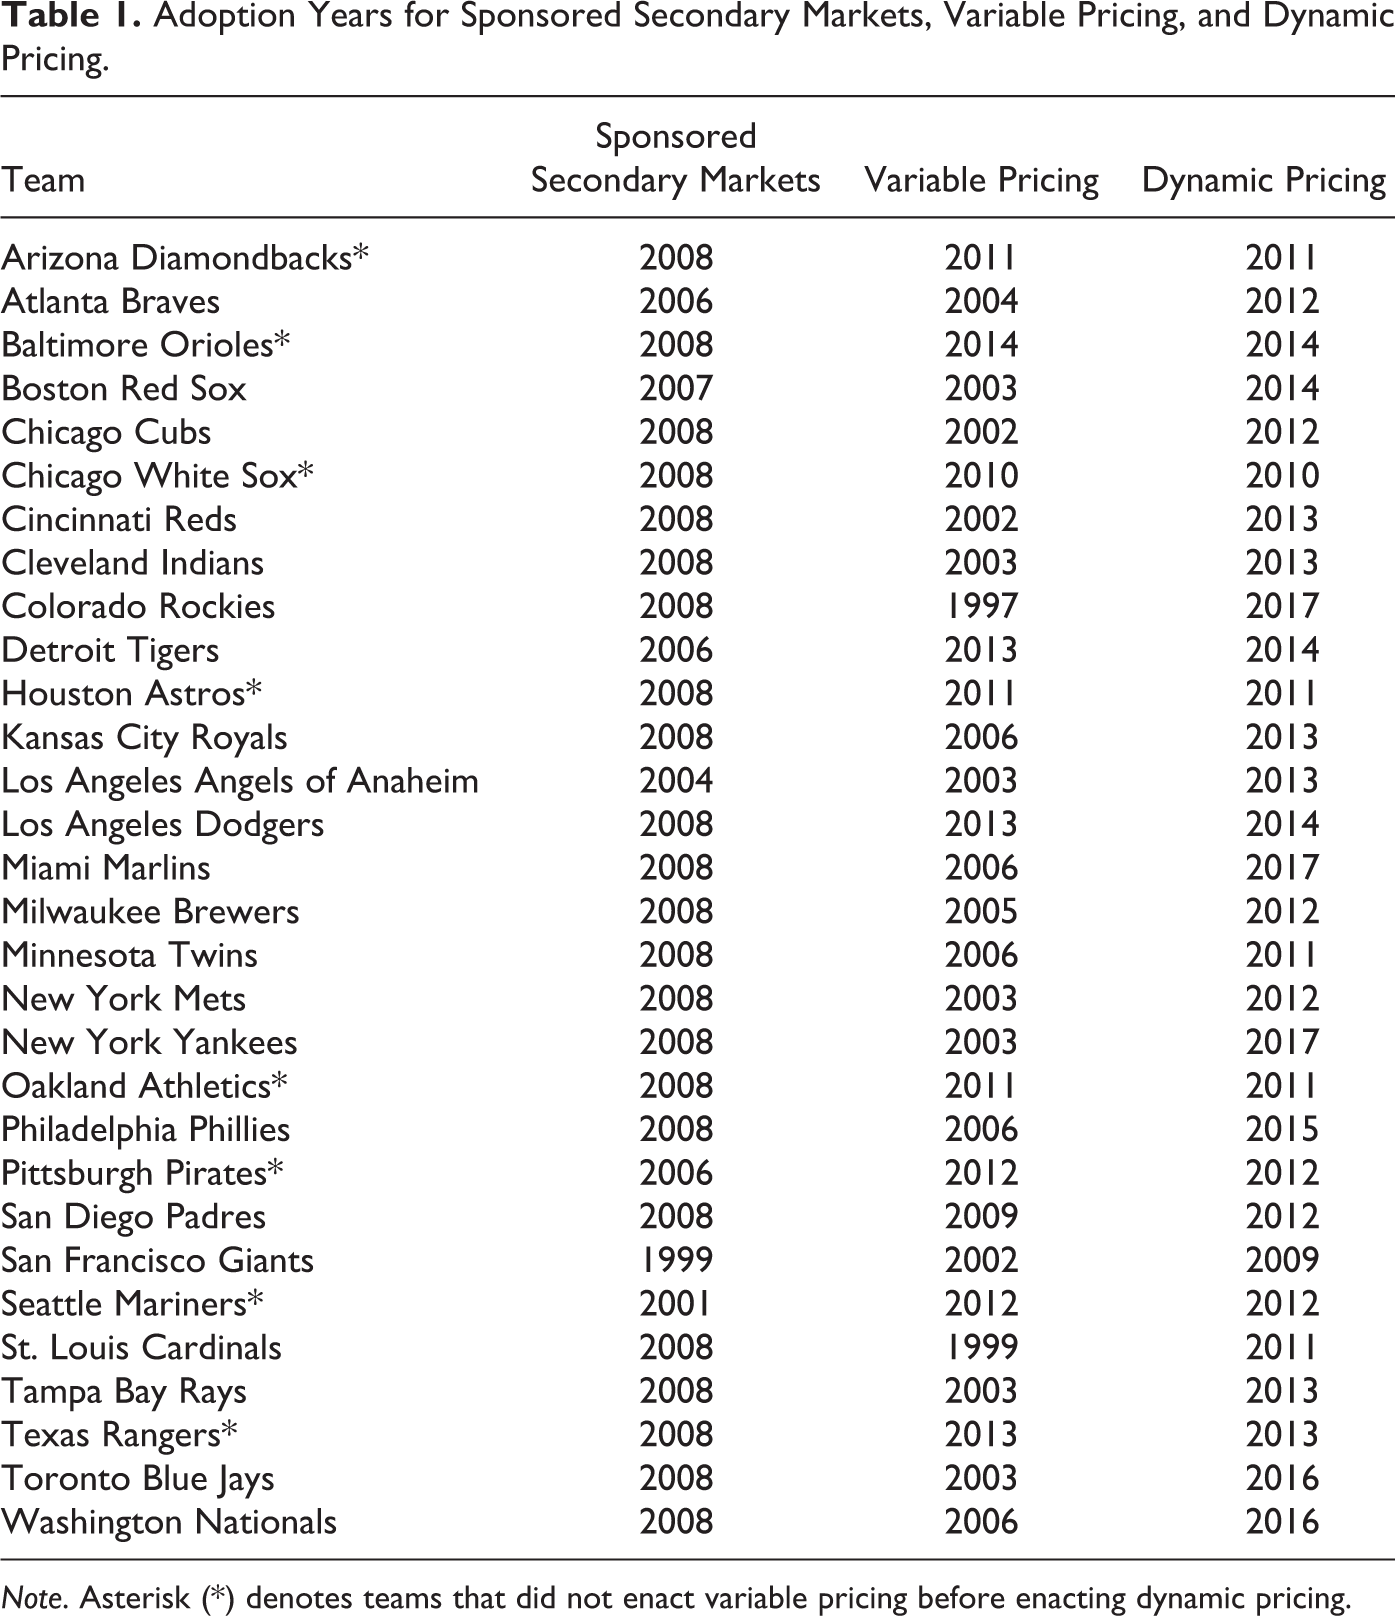
Note. Asterisk (*) denotes teams that did not enact variable pricing before enacting dynamic pricing.
Data and Summary Statistics
The panel stretches from 1999 to 2017 and covers 31 MLB teams. 4 Table 2 presents summary statistics of the variables used. The two dependent variables, revenue and team value, were collected by Forbes Magazine and downloaded from Rodney Fort’s web page. Revenue provides information on the short-term benefit of a new pricing practice, whereas team value captures the capitalized long-term benefits. Team value and revenue have means of US$573 million and US$180 million, respectively. Figures 2 and 3 plot these two measures in logs averaged across all teams. The average growth rate appears relatively constant for revenue. The average growth rate for team value has increased in the last 7 years, with an uptick in 2011-2012 and 2014-2015. We also plot the corresponding time series for the three teams with the highest and lowest value in 2017. Because we use a log scale, Figure 3 implies that revenue differences across teams have increased in dollar terms. For example, the revenue difference between the New York Yankees and the Oakland Athletics has grown from about US$100 million in 1999 to more than US$300 million in 2017. Although on average, team value and revenue have fairly smooth paths, individual team outcomes can vary quite significantly from year to year.

Log team value—most versus least valuable teams. Natural log of team value measured in millions of dollars. The solid line plots the arithmetic average over all teams. In addition, the three teams with highest (Yankees, Red Sox, and Dodgers) and lowest (Reds, Athletics, and Rays) values in 2017 are displayed.

Log revenue—most versus least valuable teams. Natural log of team revenue measured in millions of dollars. The solid line plots the arithmetic average over all teams. In addition, the same six teams as in Figure 2 are displayed.
Summary Statistics.

Note. Team value and revenue are measured in millions of dollars. Population is measured in thousands of persons. Income is measured in dollars.
The data on team adoption were obtained by searching newspaper articles (see Online Appendix 7.1 and 7.2 for details) and checking the results against existing sources where possible. We construct two variables to capture the extent of DP use. Our main variable, called DP, captures the season when DP was introduced. For eight teams, DP was partially implemented for a selected subset of seats and, more rarely, for a selected subset of games. For six of these teams, DP was later expanded, and for most teams, this happened within two seasons of introduction. The “DP expansion” variable excludes the seasons with partial DP implementation.
Approximately 57% of observations have an SSM at some point in the 19-year sample, 61% use VP, and 26% DP. VP is broken down into a variable for two tiers or more (2+ Tiers) and another for three tiers or more (3+ Tiers). Of the 11 teams (accounting for 36% of the team-year observations) that have implemented at least three tiers, five had four tiers or more, with the most tiers being six for the Atlanta Braves.
A concern with SSM is that all teams adopted it in 2008. Prior to 2008, there are only 26 team-year observations with an SSM, and these 26 observations correspond to seven teams adopting SSM prior to all teams doing so. We will return to this issue when we discuss the statistical power of the SSM coefficient estimates. Table 3 reports correlations between the main variables of interest. Team value and revenue, VP, DP, and SSM are positively correlated and are correlated with time. Thus, dealing with time effects will be important in the empirical analysis. We also computed partial correlation between our three treatment variables after controlling for a linear year trend. The partial correlations with VP are small and insignificant (.02 for VP-DP with p value .62 and .01 for VP-SSM with p value .86). The partial correlation between DP and SSM is small (−.15) but statistically significant. Conditional on a time trend, multicollinearity between DP and SSM could be an issue.
Correlation Table.
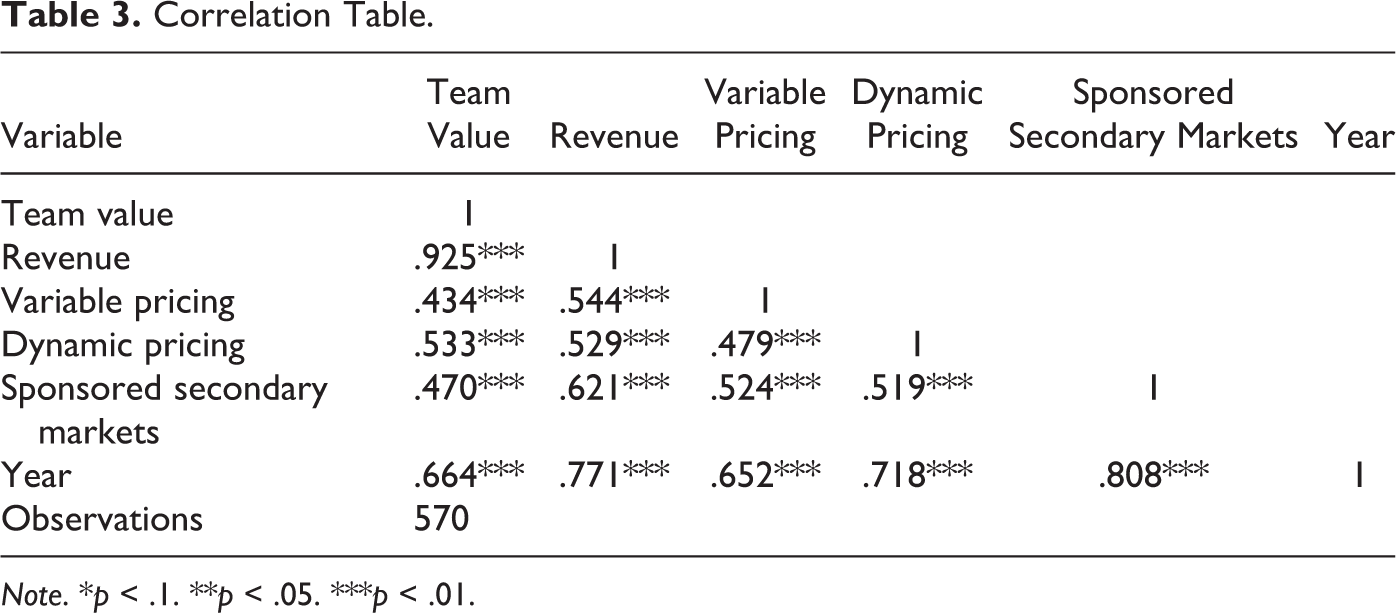
Note. *p < .1. **p < .05. ***p < .01.
The pricing variables could be subject to measurement errors. Take SSM as an example. Unless we found evidence otherwise, we assume that all teams adopted an SSM in 2008. This default assignment rule could be a source of measurement error. This is further discussed in the robustness section. For VP and DP, we can compare our variable against other sources that have documented adoption for specific teams or for a cross section of teams in a specific year. We obtain perfect match with Paul and Weinbach (2013, Table 2) for VP and perfect match with Huefner (2017, Table 4) for both VP and DP in the 2016 season. See discussion in Section 2 of the Online Appendix.
Impact of Variable Pricing, Dynamic Pricing, and Sponsored Secondary Markets on Log Revenue.
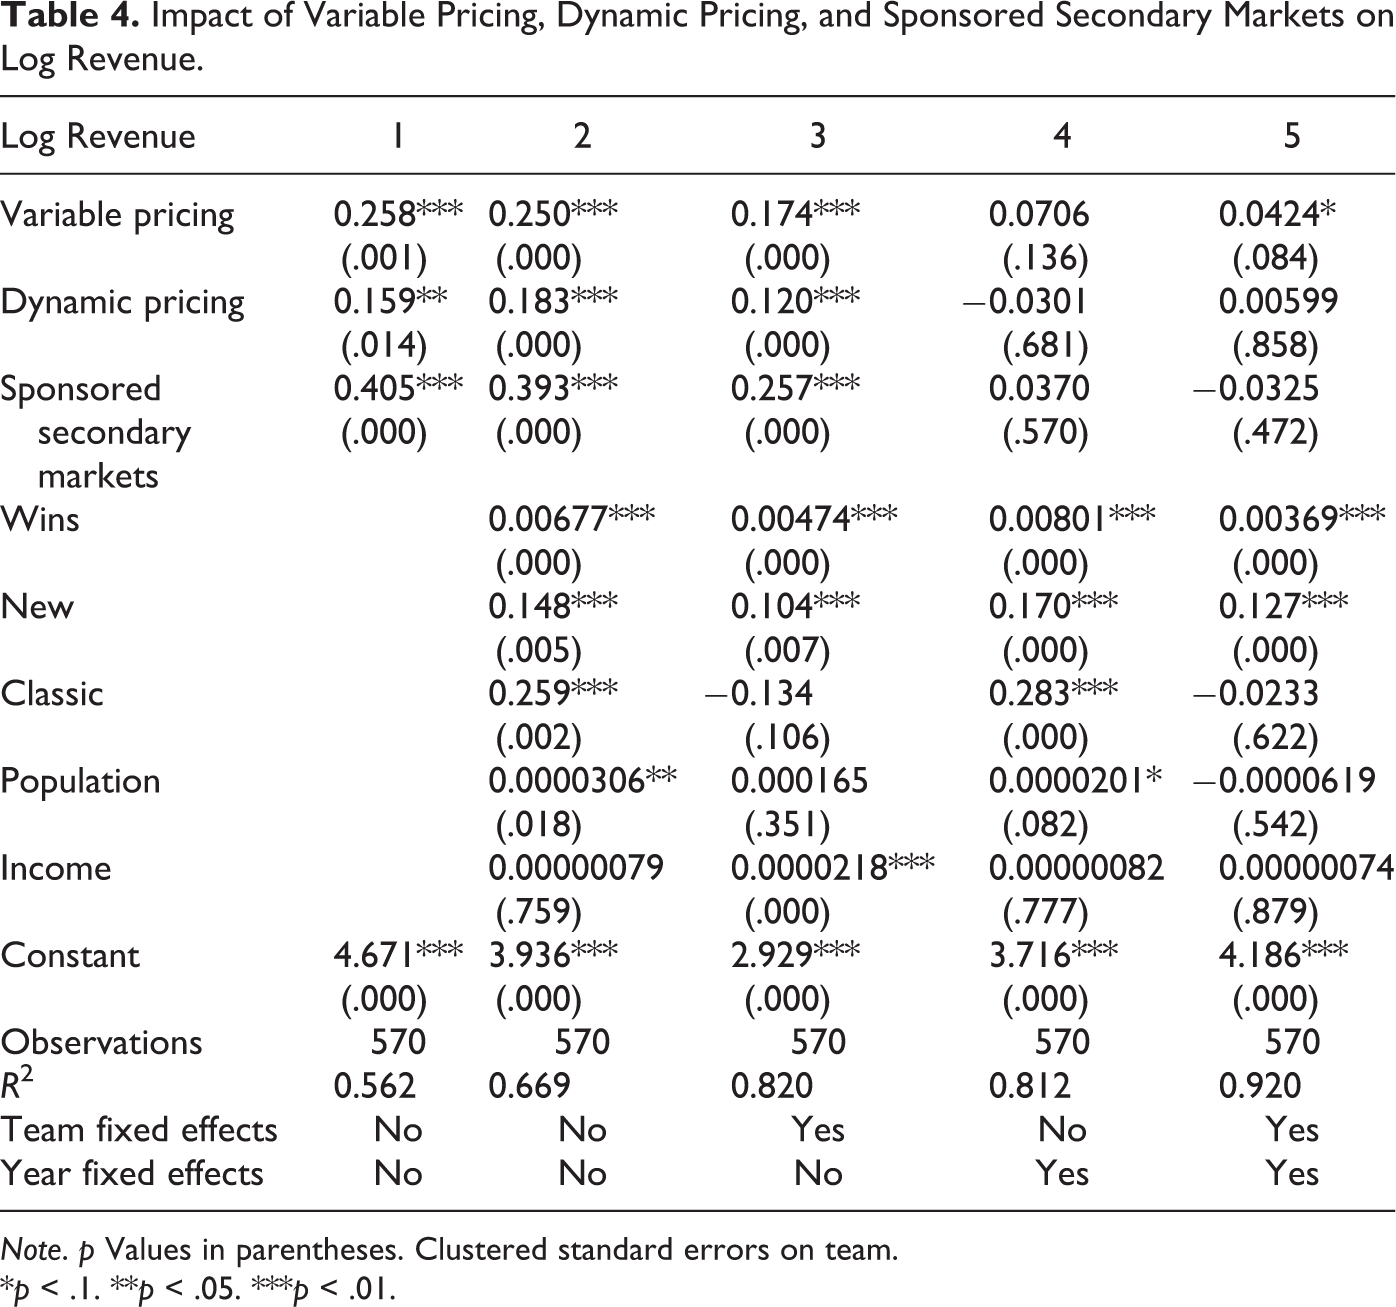
Note. p Values in parentheses. Clustered standard errors on team.
*p < .1. **p < .05. ***p < .01.
Following the literature, we control for stadium age, population, median local income, and team win count for the previous season (Drayer & Shapiro, 2009; Rishe & Mondello, 2004; Watanabe, Soebbing, & Wicker, 2013). About 35% of the teams have a new stadium (less than 10 years old), slightly more than half a “regular” stadium (between 11 and 47 years old), and 12% a classic stadium (older than 47 years). Classic stadiums have an average age of 91.
Model and Identification
We present the revenue model keeping in mind that the same approach is used for team value. Denote by

where
The three coefficients of interest are
The quasi-experimental assumption that the adoption years are conditionally exogenous could be violated. To start, it could be that the adoption year is triggered by time-varying team outcomes. A reverse causality narrative, for example, could be that teams in financial difficulties explore new revenue streams through pricing innovations. We are not aware that this is the case, but to be sure, we constructed a balanced panel of team revenue around each team’s VP adoption year. Figures 4 and 5 plot the average team value and revenue where the adoption year corresponds to “t.” There is no revenue dip in the years prior to adoption (t = −2, −1) as would be expected under the financial distress adoption hypothesis. In fact, there is no evidence that the adoption year is correlated with team outcomes prior to adoption.
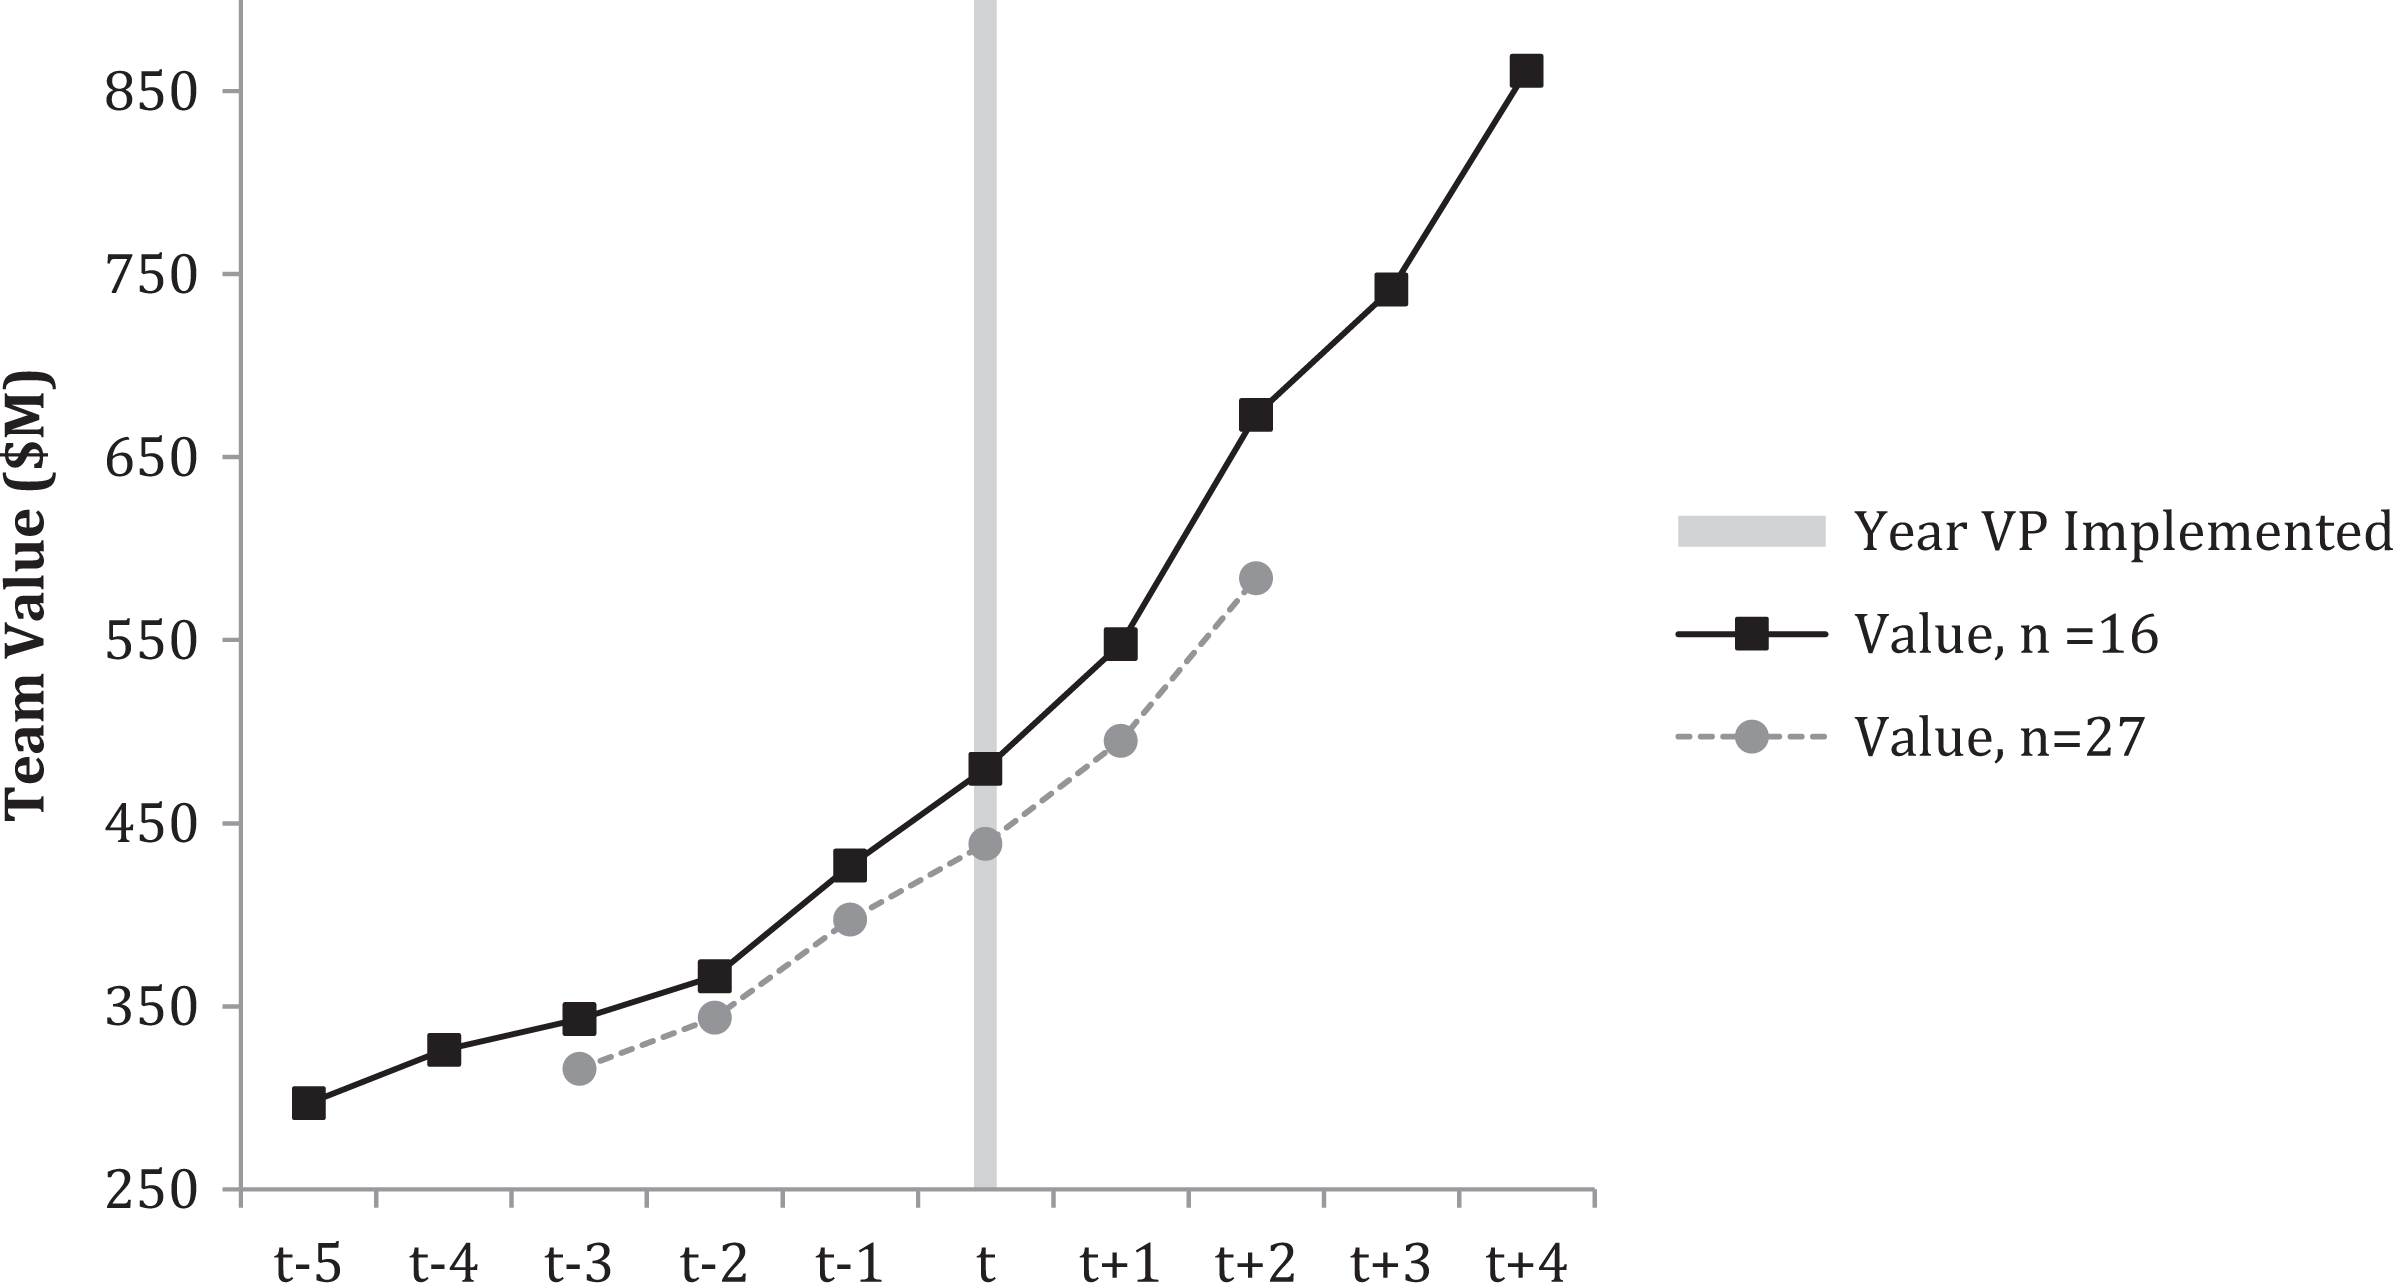
Team value trends pre- and post-variable pricing adoption. (a) The horizontal axis is centered around the year a team adopts variable pricing (gray vertical line at year t). (b) The gray lines plot average revenue for the 27 teams with at least six valid observations around the adoption year. (c) The black lines plot the average revenue for the 16 teams with at least 10 observations around the adoption year.
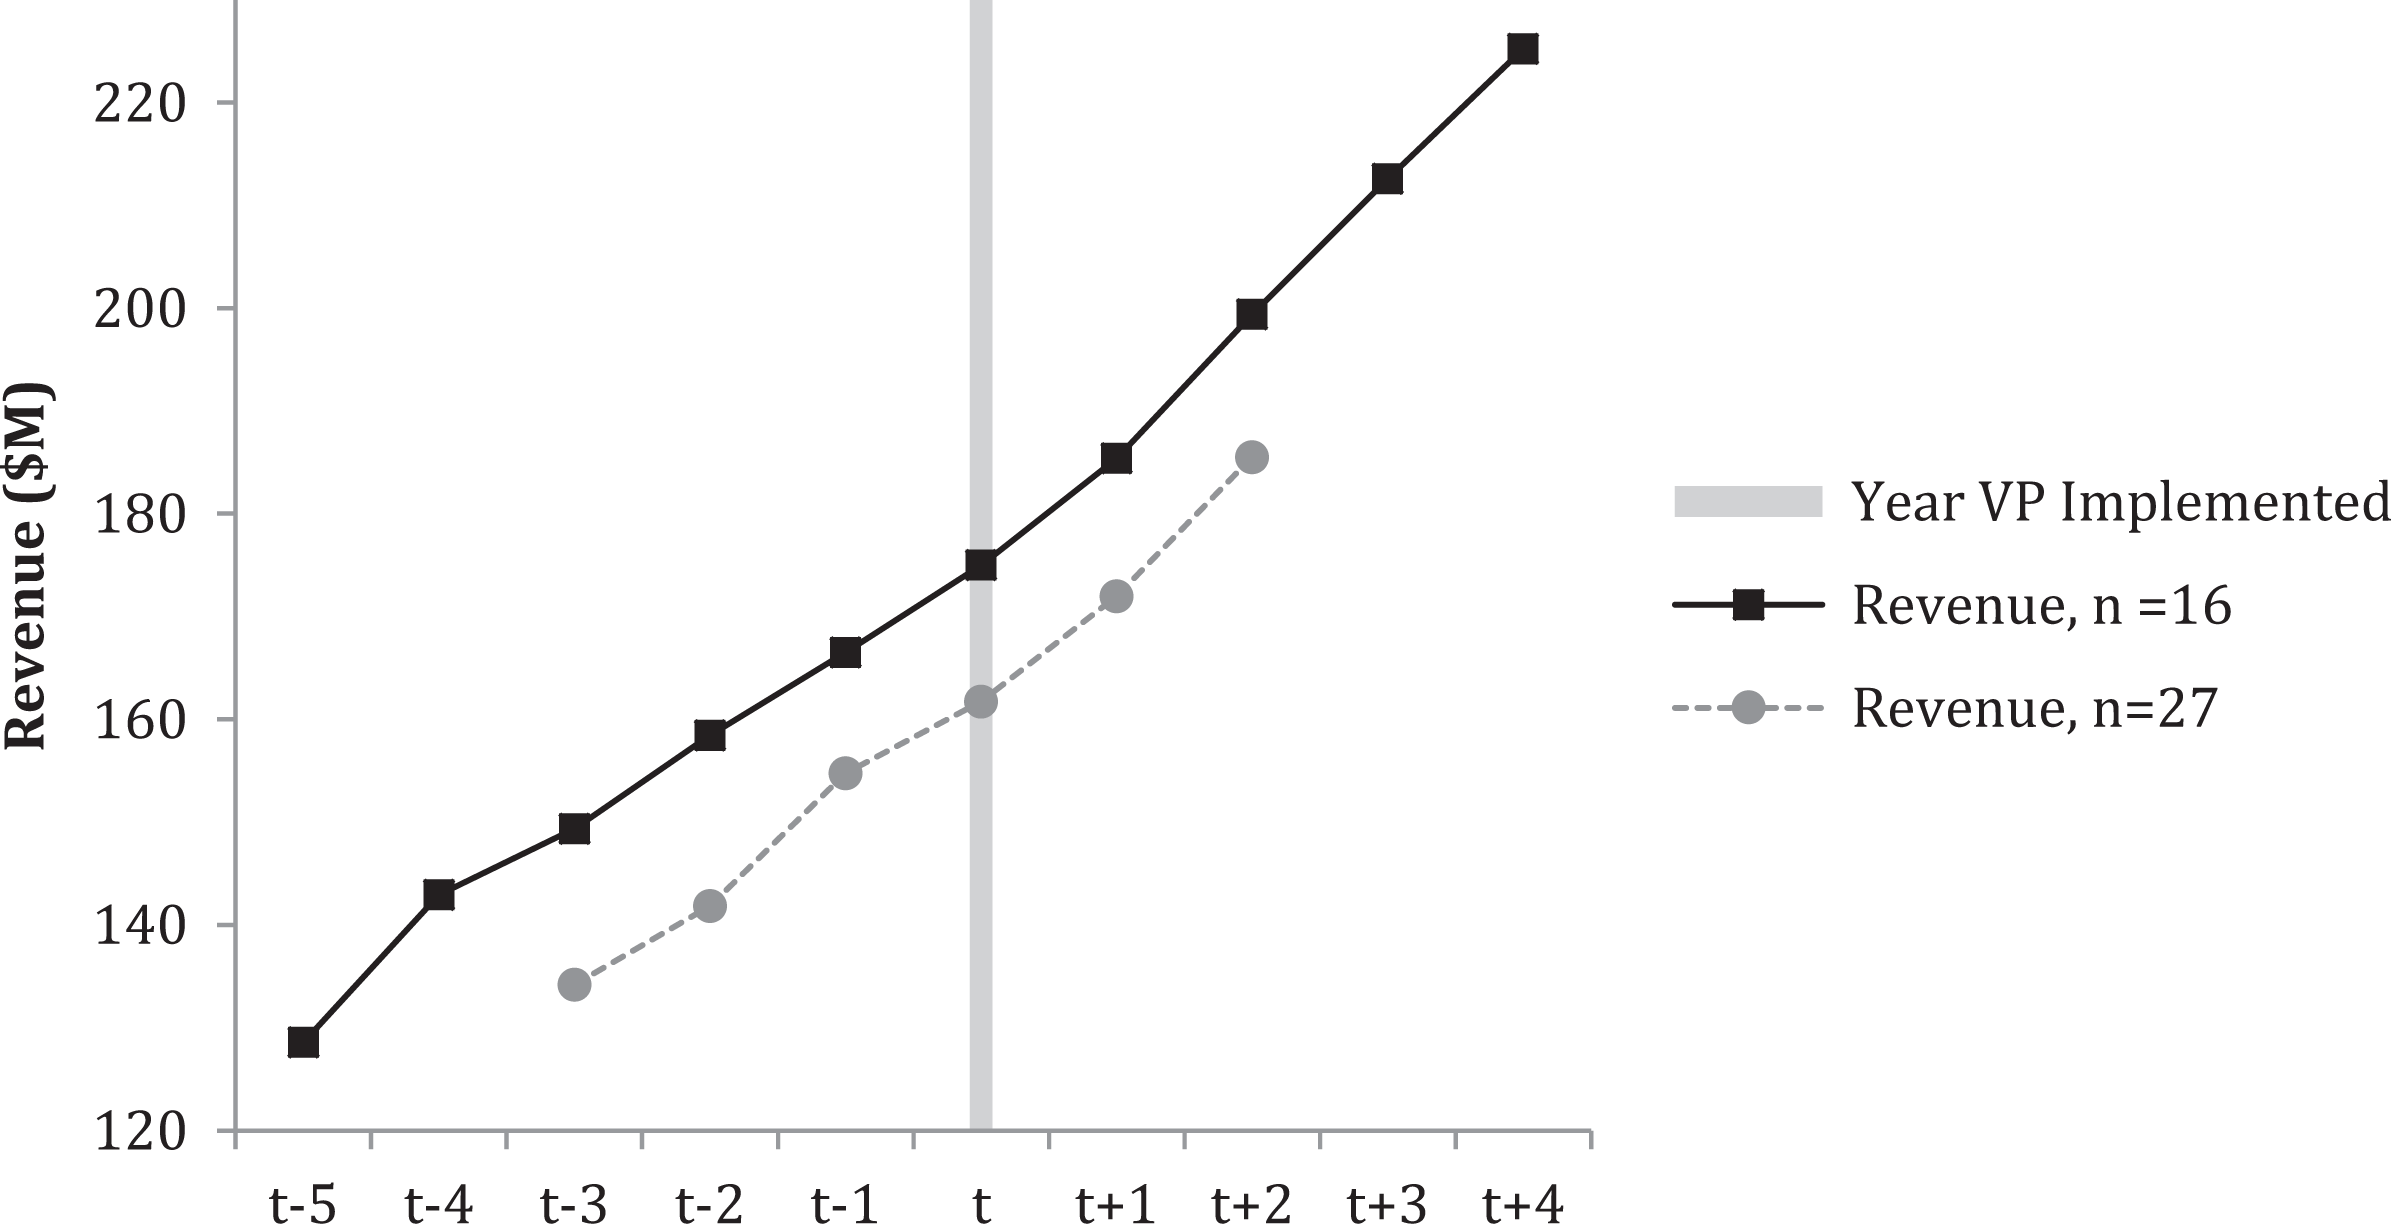
Revenue trends pre- and post-variable pricing adoption. (a) The horizontal axis is centered around the year a team adopts variable pricing (gray vertical line at year t). (b) The gray lines plot average revenue for the 27 teams with at least six valid observations around the adoption year. (c) The black lines plot the average revenue for the 16 teams with at least 10 observations around the adoption year.
A second source of bias occurs if adoption is correlated with teams’ revenue/value growth rates. Assume teams grow at different rates, and for the sake of argument, say that high growth teams adopt early. Treated observations will tend to have higher outcomes because these observations come from high growth teams. Nontreated observations, which come disproportionally from low growth teams, will tend to have low outcomes. The impact estimates will be biased upward because the team and year fixed effects do not take care of endogenous team trends. To address this concern, we compute team growth rates prior to adoption using a variant of Equation 1 and only observations prior to adoption. We reject the null hypothesis that all teams grow at the same rate. However, the correlation between teams’ growth rate and adoption year is small (.06) and statistically nonsignificant (.75), suggesting that this source of endogeneity is not a concern.
There are other reasons why the conditional independence assumption could be violated. For example, teams could adopt a given pricing practice along with other management practices that are not observed by the econometrician. Watanabe et al. (2013) show that some teams have increased the price differential in seat pricing, and Drayer (2011) argues that some teams have started to integrate the primary and secondary markets. If there are such unobserved changes, that are correlated with VP, DP, and SSM and have an impact on teams’ outcomes, the coefficient estimates from Equation 1 should be interpreted as a measure of the joint effect of the changes that have taken place simultaneously.
Results
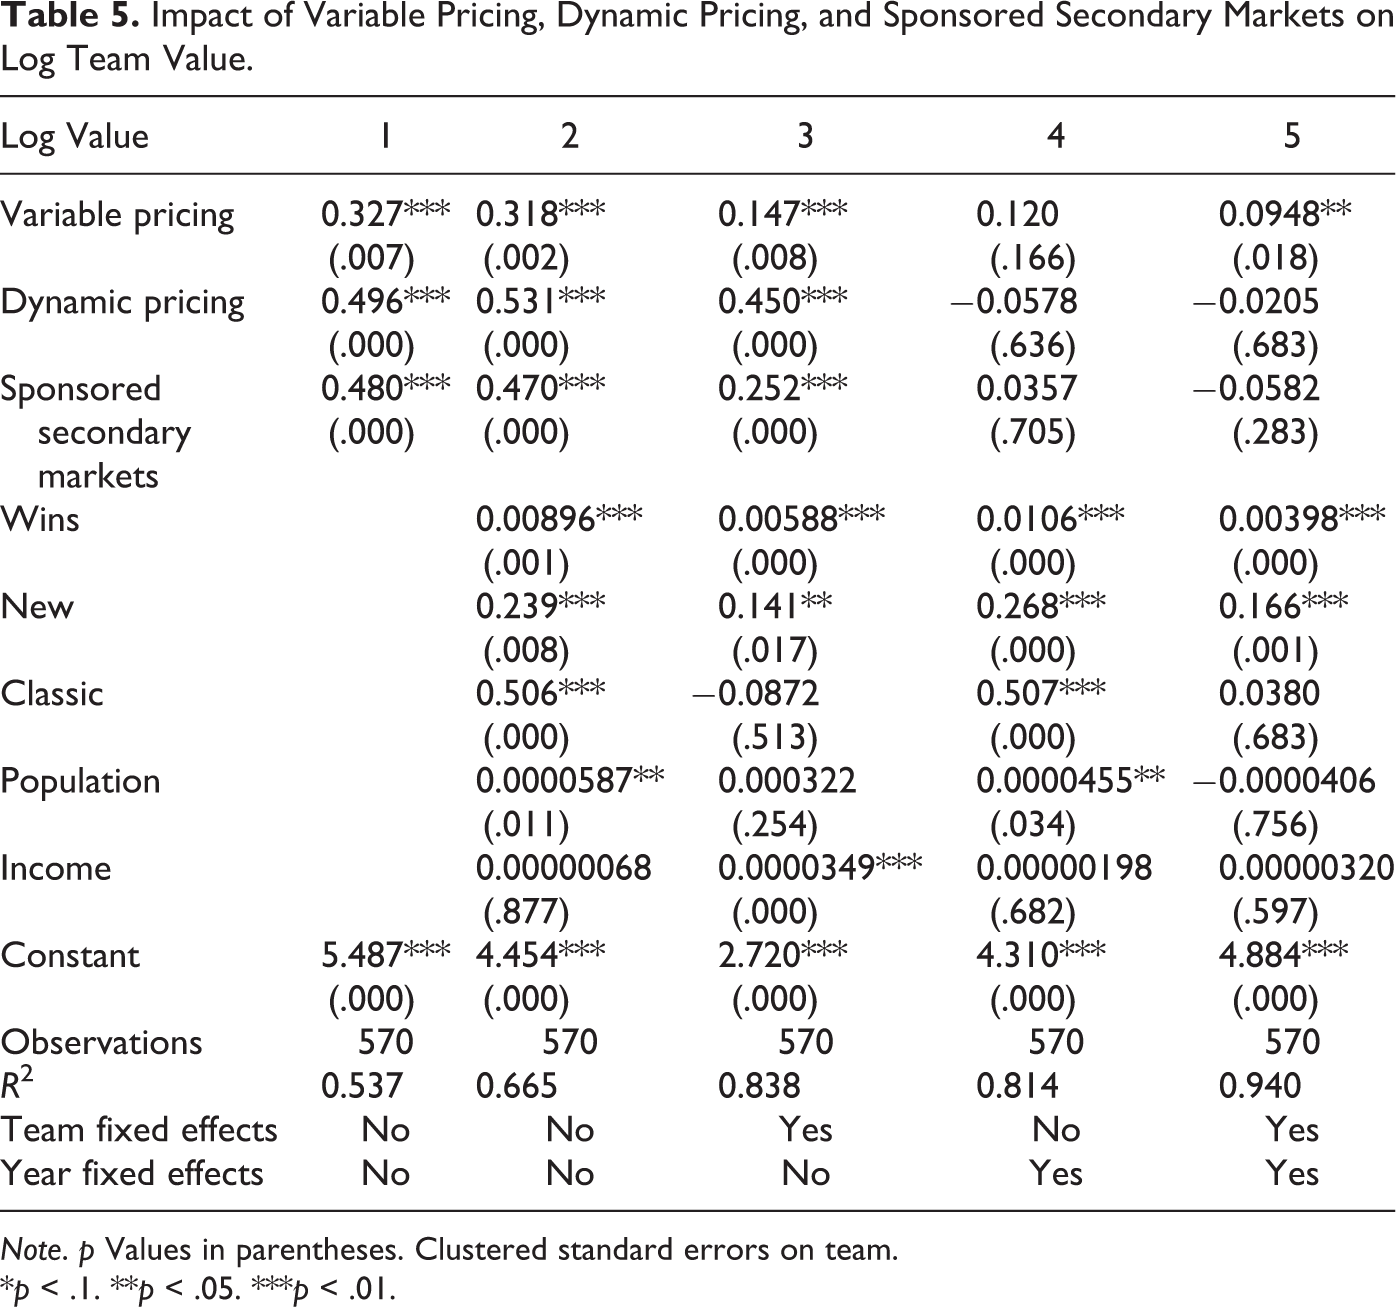
Tables 4 and 5 present the main results for revenue and team value, respectively. Starting with Table 4, the first column includes only the three treatment variables of interest. The coefficient estimates are positive with magnitudes that are unrealistically high. The second column adds the time-varying control variables (wins, stadium’s age, population, and income) and the third column team fixed effects. This has little effect on the coefficient estimates. Column 4 adds year fixed effects alone (removing the team fixed effects). This takes care of the fact that team outcomes and adoption are correlated with time. The coefficients on the three pricing practices decrease to reasonable values. Column 5 presents the saturated model with team and year fixed effects.
Impact of Variable Pricing, Dynamic Pricing, and Sponsored Secondary Markets on Log Team Value.
Note. p Values in parentheses. Clustered standard errors on team.
*p < .1. **p < .05. ***p < .01.
The coefficient on VP is statistically significant at the 10% level and implies that implementing VP is associated with a 4.2% increase in revenue, compared to a team that does not, holding all other control variables constant. The impact of DP is economically small and statistically insignificant. The impact of SSM is economically relevant (−3.2%) but statistically insignificant. Table 5 replicates Table 4 for team value with similar results. The coefficient on VP is highly significant in column 5 with the implication that implementing VP increases team value by approximately 9.5%. The coefficient on DP and SSM are again statistically insignificant in column 5.
A concern with the SSM variable is that the statistical power of our estimates could be low because we have few conditionally independent treated observations. 5 For our two main specifications, the power statistics for the SSM coefficient estimates are .31 for revenue (Table 4, column 5) and .39 (Table 5, column 5) for team value. These power statistics are below the conventional level of .8. 6 To further investigate the impact of SSM, we test for a change in performance for the teams that adopted in 2008. Table A3 in the Online Appendix compares the growth rate of revenue and team value for the teams that adopted an SSM in 2008, keeping in mind that this approach is valid under the strong assumption that no other changes took place between seasons 2007 and 2008. Surprisingly, we find a negative effect of adoption on team performance, and this effect is statistically significant in most specifications. Although unexpected, the signs of the effect of SSM are consistent when we use pre-2007 adopting teams (Tables 4 and 5) and when we look at the 2008 adopting teams (Table A3 in the Online Appendix). This is important because these two estimates use different sources of variations. These two pieces of evidence, taken together, point to the conclusion that SSM do not have a positive impact on team outcomes.
Another concern is that the three main treatment variables could be multicollinear. As explained in the Data section, only the partial correlations between DP and SSM are statistically significant after controlling for a time trend. To further investigate multicollinearity, we ran column 5 in Tables 4 and 5 with the three treatment variables (VP, DP, and SSM) alone and in pairs. If multicollinearity was an issue, we would expect the coefficient estimates on a given treatment variable, say DP, to change as the set of treatments changes, that is, depending on whether VP and/or SSM are added as control variables. For each treatment variable, there are four possible sets of treatment controls (none, one additional treatment, the other, and both). For revenue and team value, we find that the coefficient estimates are remarkably stable across the four possible specifications. As a final check before concluding that multicollinearity is not an issue, we compute the variance inflation factor for VP, DP, and SSM, and they are all below the conventional threshold of 10.
Turning to the control variables, the year fixed effects in Table 4 column 5 suggest that revenue has grown at an annualized rate of 6.9% and team value at a rate of 10.4%. To put these figures in perspective, the annualized inflation rate in the United States from 1999 to 2017 was 2.2%. As expected, our sample period corresponds to a time of rapid growth in revenue and value for baseball franchises. The coefficients on wins, population, and income stay constant throughout all specifications. Although they vary in their statistical significance, the economic impacts of these variables are economically reasonable. Wins has a positive and statistically significant effect. Winning 10 more games increases team revenue by about 3.7% and team value by about 3.9%. New stadium has a large and positive effect on both revenue (12.7%) and value (16.6%). Classic stadium has a large positive effect when team fixed effects are omitted and is insignificant otherwise suggesting that teams with classic stadium have above average revenues. These findings are consistent with previous studies (McEvoy, Nagel, DeSchriver, & Brown, 2005; Rishe & Mondello, 2004; Watanabe et al., 2013).
Robustness
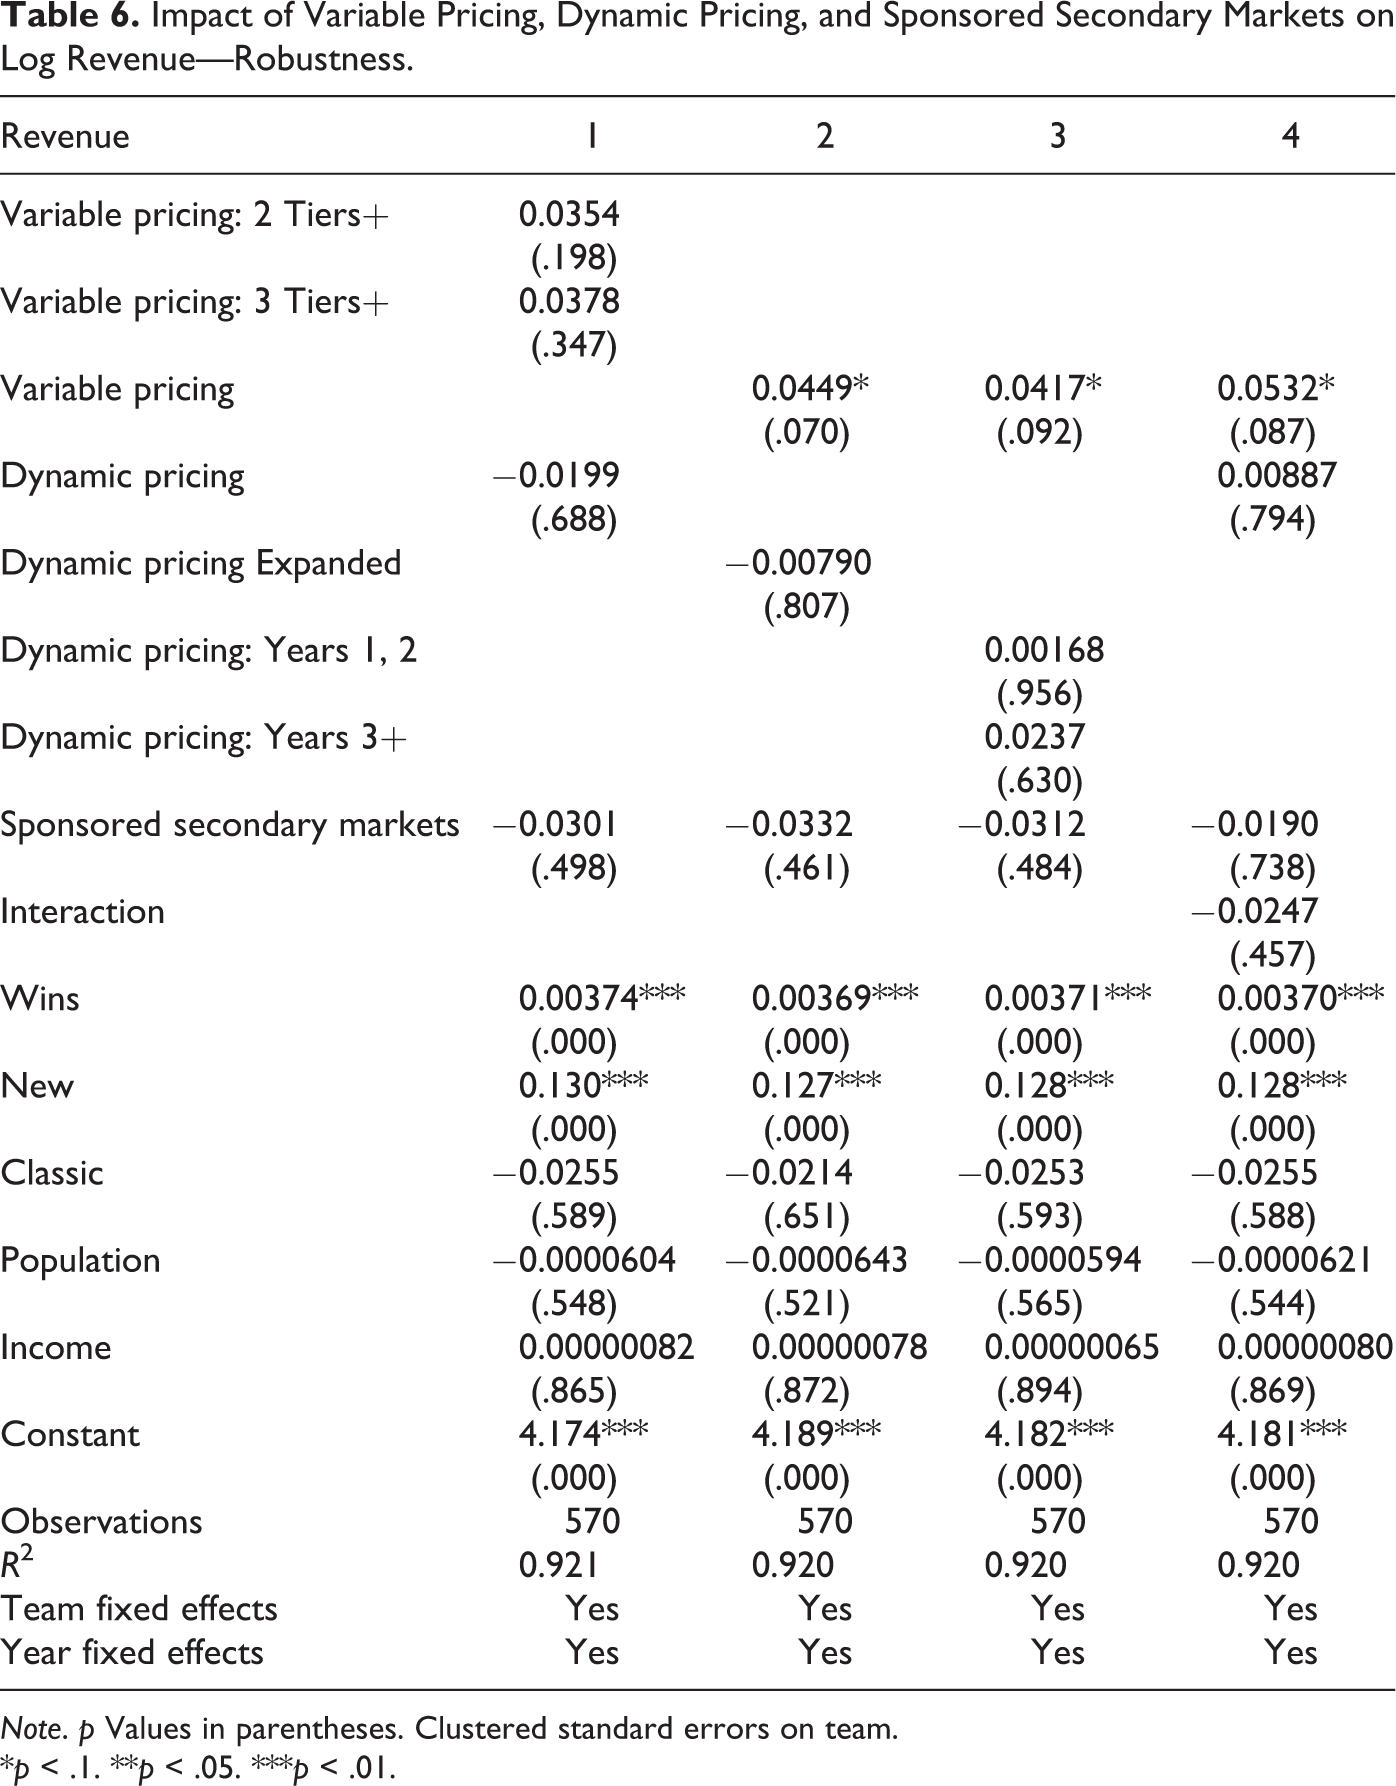
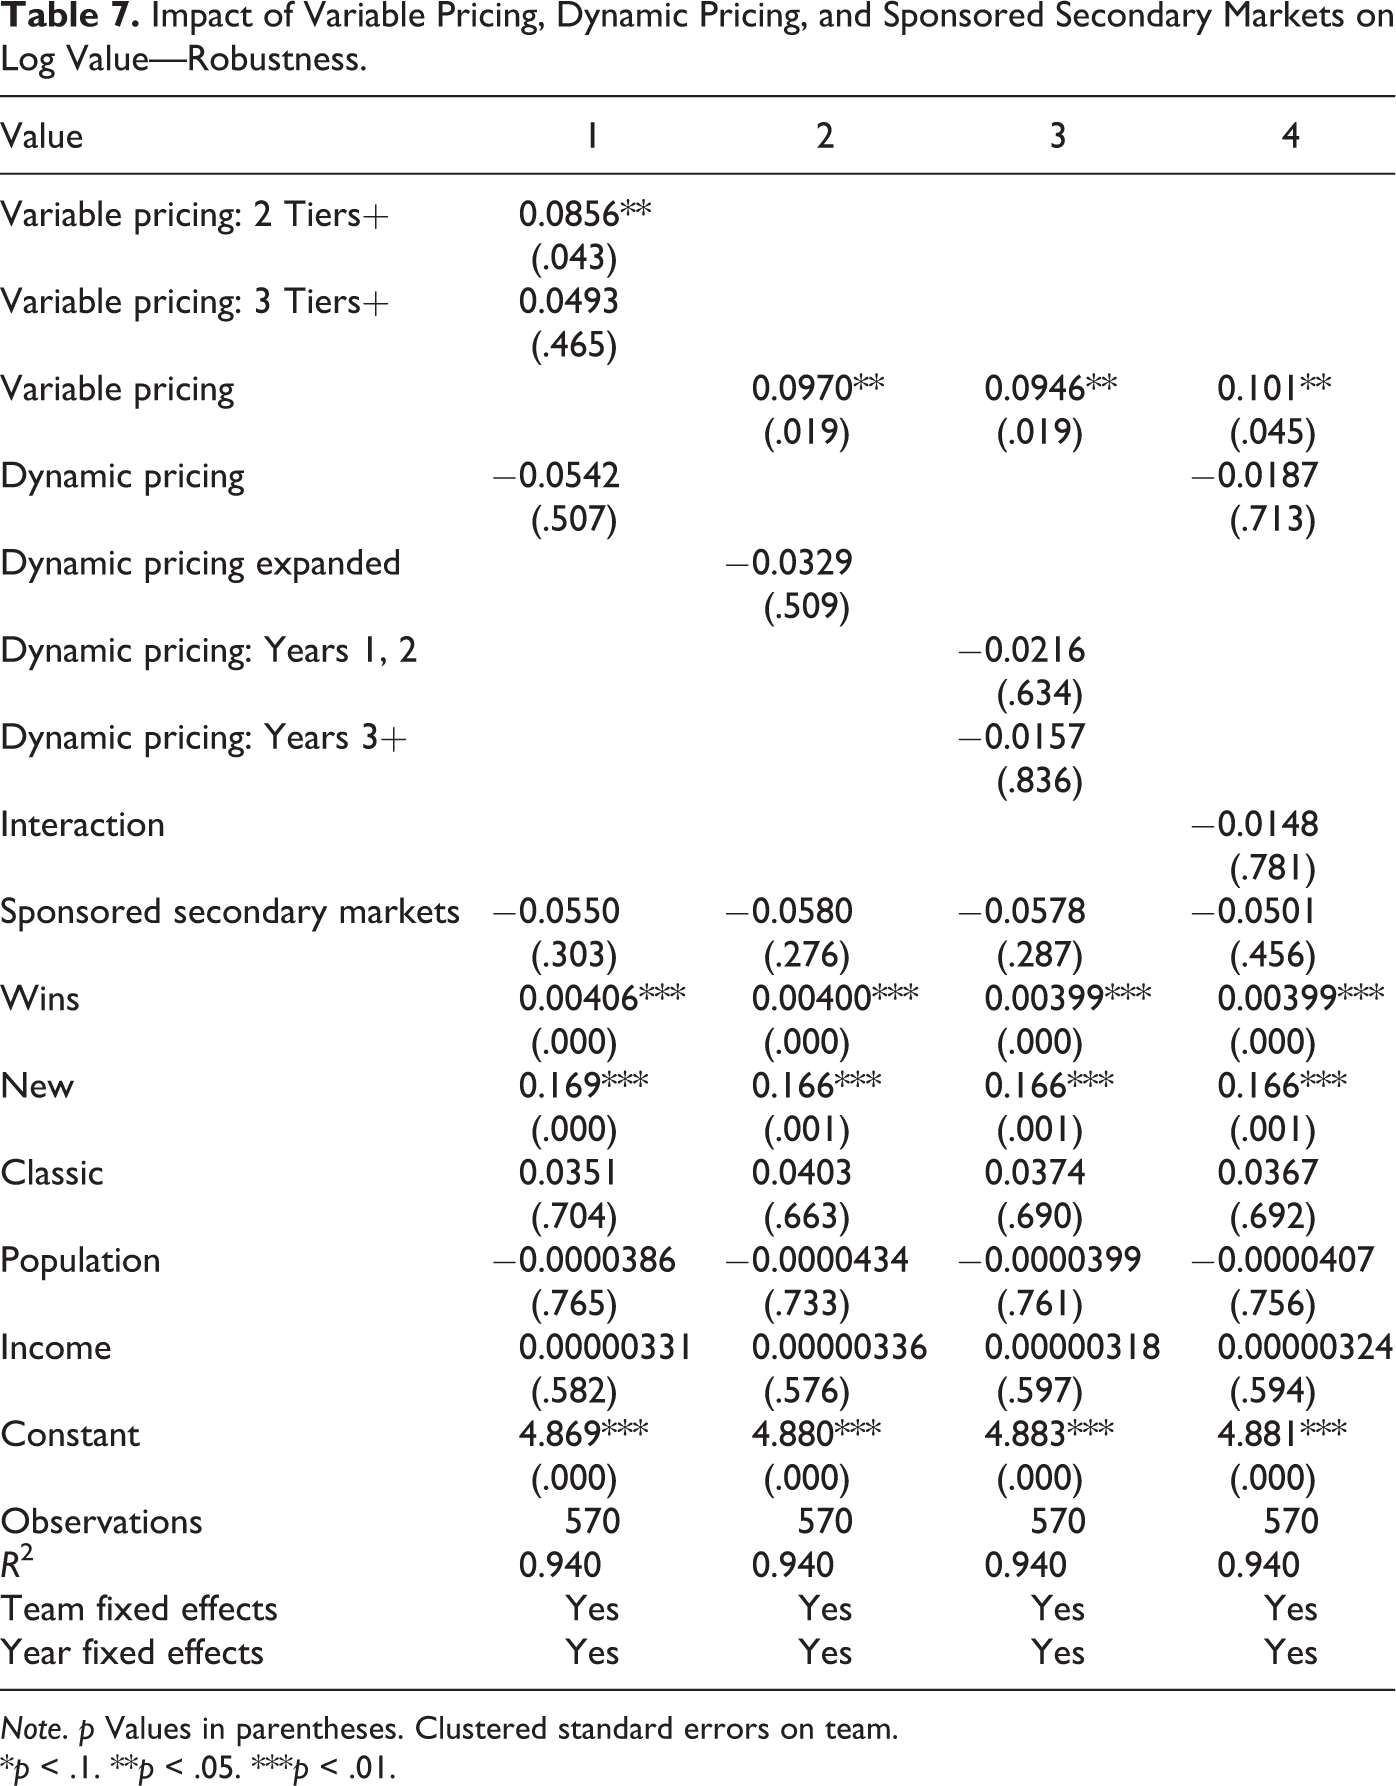
Tables 6 and 7 present the main robustness specifications. Column 1 in Tables 6 and 7 splits the VP variable into two subvariables that measure the intensity of VP: two or more tiers and three or more tiers. For revenue, Column 1 suggests that the return to two tiers is about 3.5% and the additional return of three or more tiers is 3.8%, although these figures are not statistically significant. For value, the return to two tiers remains the same, and there is an additional, although statistically insignificant, 5% marginal effect of having three or more tiers.
Impact of Variable Pricing, Dynamic Pricing, and Sponsored Secondary Markets on Log Revenue—Robustness.
Note. p Values in parentheses. Clustered standard errors on team.
*p < .1. **p < .05. ***p < .01.
Impact of Variable Pricing, Dynamic Pricing, and Sponsored Secondary Markets on Log Value—Robustness.
Note. p Values in parentheses. Clustered standard errors on team.
*p < .1. **p < .05. ***p < .01.
Column 2 replaces the DP variable with a new variable called “DP expanded” that excludes all team-years with a partial use of DP. We would expect the coefficient on the variable “DP expanded” to be larger than the coefficient on DP. This is not the case. The impact remains small and insignificant. Column 3 splits the DP variable between a treatment for the first 2 years after introduction and a treatment from Year 3 and beyond. If it takes time for teams to properly optimize prices using DP, we would expect the impact of DP to increase after the second year of introduction. This prediction holds for both revenue and team value, but the difference in coefficient is not statistically significant. 7
Column 4 adds an interaction term for VP and SSM. The idea is that the SSM may improve data analytics and increase the return to revenue management. Unfortunately, we cannot do the same for DP and SSM because all teams adopted DP after the 2008 league-wide deal with StubHub, leaving no variation in DP conditional on SSM. We find no additional effect of using both VP and SSM simultaneously.
Although not reported, we tried additional robustness specifications. We replace team fixed effects with random effects. This is valid under the assumption that the team effects are not correlated with the team pricing practices excluding, for example, the possibility that teams with higher revenues adopt first. The coefficient estimates remain stable. Similarly, the results are not materially different when we replace the year fixed effects in favor of a linear time trend and a time trend squared. These alternative specifications put much stronger restrictions on the data with little changes on the results. If team unobserved heterogeneity played an important role, we would expect the random and fixed effects estimators to differ. Similarly, if there were complicated year cycles, we would expect the specification with simple time trends (time and time squared) to give biased results. The fact that this is not the case suggests that there may be no concern of endogeneity left in the full specification with team and year fixed effects.
Discussion and Implications
The impact estimates for VP, DP, and SSM are averages over the teams and years when these schemes were used. However, teams do not start with the same scheme and make custom adjustments over time. This is certainly true for DP. Some teams update prices often, for many sections and for most games, while other teams may use DP less extensively. See Section 2 in the Online Appendix. The counterpoint to this is that most franchises partner with the pricing specialist Qcue, with the nuance, however, that franchises may still differ in how extensively they vary prices. In fact, Bouchet, Troilo, and Walkup (2016) interviewed sports executives from the four major North American professional sports leagues and found that franchises differ in the frequency of price changes, the automation of decisions, the information used to inform price changes, and the use of formal analytics. Thus, heterogenous implementation likely plays a role although the widespread use of Qcue acts as an attenuating factor.
This is also true for VP. Some teams use two tiers and others three or more tiers. Regarding SSM, teams can put restrictions on transactions (e.g., price floor) and influence the fees charged to users. Moreover, DP and VP should have a lower impact on revenue for teams that offer a larger fraction of stadium capacity to season tickets. The opposite likely holds for SSM. Capturing these differences in the econometric model is not possible. One implication is that our DP impact estimates should be lower than the optimal impact computed in studies doing counterfactual profit simulations (e.g., Jiaqi Xu et al., 2019; Zhu, 2014). This is because these studies assume that the optimal DP policy is implemented, which is typically not the case in practice. The optimal counterfactual policy should deliver a higher return than the policy used in practice. Another implication is that finding a small average impact does not rule out the possibility that the return could be positive and large for some teams in some years.
Keeping these considerations in mind, the 4.2% impact associated with VP for revenue is higher than the 2.8% figure reported in Rascher et al. (2007). The finding of no impact for DP is more puzzling. There is always the possibility that the exogeneity assumption does not hold or that the sample size is small. Leaving these considerations aside, the absence of effect is not entirely implausible. To start, note that our estimates compute the benefit of DP relative to VP. The literature has shown that the impact of DP is small for teams that already had thoroughly and effectively implemented VP. Moreover, implementing the optimal DP scheme is difficult. For example, Jiaqi Xu, Fader, and Veeraraghavan (2019) show that the DP policy used by the franchise they study decreased revenue relative to fixed prices. Zhu (2014) also finds mixed evidence, making the point that the impact of DP depends on consumer sophistication (whether consumers strategically wait for the best possible price). 8 Finally, Kemper and Breuer (2016) report that the optimal DP scheme increases revenue by about 4% relative to fixed prices. These figures, however, are for individual franchises. 9 Given the wide range of impact values, it is not impossible that the average effect is small. Possibly, team management’s skepticism toward massive promises from DP (relative to VP) was justified. 10
There are many reasons why SSM may have had a small, or even possibly, negative impact. To start, there are limited variations in the use of SSM found in the data. Specially, due to the fact that most teams joined the secondary market in 2008, following the MLB–StubHub deal, and that no team has since dropped its SSM, there are limited conditionally exogenous variations in the use of SSM to exploit. But there are other reasons to be skeptical. Recall that SSM was a defensive response to the growth of secondary markets. Some MLB teams tried, but did not manage, to regulate resale prices or ban secondary markets altogether. In the end, the only viable option was to channel resale to a sponsored site. Moreover, the economics of ticket resale says that the return to SSM could be small and difficult to identify statistically. To make this point clear, assume that 10% of a team’s tickets are resold at face value on its SSM and that the team takes a 10% net margin on each transaction (Llovio, 2007). The increase in the team’s revenue from having an SSM is only 1%, 11 that is, if there is no spillover on the primary market. But an SSM could decrease a team’s overall revenue if it decreases demand in the primary market (Courty, 2003; Cui, Duenyas, & Sahin, 2013).
Summary and Conclusions
Using a panel data of MLB teams over 20 years, we find that VP increases revenue and team value by 4.2% and 9.5%, respectively. These impact estimates are reasonable in magnitude and robust to various specifications. VP has been a successful tactic for baseball teams, a result seen in other industries (e.g., airline, hotel, concert, Broadway shows).
However, adding DP to VP or introducing a SSM appears to have no effect on revenue or team value. This may seem surprising and could be due to limitations with our data or empirical approach. While acknowledging these shortcomings, we argue that the results are not entirely inconsistent with the literature or with casual evidence from individual franchises. The results do not rule out the possibility that DP could have had a significant impact in specific instances (specific seating sections or games). On average across all teams and years, however, we find no statistically significant incremental effect of moving from VP to DP. Further research could investigate whether this is due to our methodology and revisit our tentative conclusion. Our results suggest that SSM adoption does not make a difference on revenue or team value. Although this result is also subject to data limitations, it is, if correct, less surprising because the adoption of SSM was a reactive response to the growth of secondary markets. Further research will help clarify and solidify these puzzles.
There has been a small revolution over the past 30 years in how tickets are sold in sports. The three pricing innovations considered in this work are used in all four major North American professional sports leagues (Courty, in press; Huefner, 2017) and in other sports and continents as well (e.g., Kemper & Breuer, 2016). We chose baseball because it offers the most appealing natural experiment to estimate the impact of changes in pricing policies on team outcomes. Our panel data methodology can be replicated to other sports (see discussion in Online Appendix 7.3) and using data from other continents as long as there are sufficient exogenous variations in pricing innovations, keeping in mind that other identification approaches may apply when this is not the case. It is likely that ticket markets will continue to adapt as ticketing technologies continue to evolve. Further research could look at individual teams, or at other leagues, to better separate VP and DP, and potentially gain insight into the impact of SSM.
Supplemental Material
Supplemental Material, Appendix - The Impact of Variable Pricing, Dynamic Pricing, and Sponsored Secondary Markets in Major League Baseball
Supplemental Material, Appendix for The Impact of Variable Pricing, Dynamic Pricing, and Sponsored Secondary Markets in Major League Baseball by Pascal Courty and Luke Davey in Journal of Sports Economics
Footnotes
Authors’ Note
This essay is based on Luke Davey’s master’s thesis.
Declaration of Conflicting Interests
The author(s) declared no potential conflicts of interest with respect to the research, authorship, and/or publication of this article.
Funding
The author(s) received no financial support for the research, authorship, and/or publication of this article.
Supplemental Material
Supplemental material for this article is available online.
Notes
References
Supplementary Material
Please find the following supplemental material available below.
For Open Access articles published under a Creative Commons License, all supplemental material carries the same license as the article it is associated with.
For non-Open Access articles published, all supplemental material carries a non-exclusive license, and permission requests for re-use of supplemental material or any part of supplemental material shall be sent directly to the copyright owner as specified in the copyright notice associated with the article.