
Abstract
We ask whether a scandal in a university’s athletics department affects the quality of the incoming student body. To do so, we evaluate the child sex abuse scandal at Penn State University in 2011. The violations involved a former employee with the crimes occurring a decade prior. The plausibly-exogenous shock allows us to make a causal identification of the scandal's effect on the university. We use synthetic control methods establishing economically meaningful impacts. We find that the average high school GPA is 0.12 points less and the proportion of students with high SAT Math scores is down 4.8 percentage points.
Introduction
College football generates substantial revenue for universities who compete at its highest level. For example, the University of Alabama’s athletics department generated $177.5 million in 2018 with most of the revenue coming from its football operations. This led to a profit of almost $50 million. 1 Presumably, these profits can go to enhance the educational mission of the university. 2 Likewise, one can reasonably be concerned that unprofitable athletics programs detract from the university’s financial well-being.
Beyond the direct financial consequences, we ask whether athletics departments spill over and affect the university’s educational objectives. Presumably, these additional revenues help improve the quality of the student experience and education provided. Athletics success potentially has marketing advantages as well as the university’s name brand and student experiences are showcased (Stinson et al., 2012). The connection between the athletics department and the overall financial and academic strength of the university must be closely linked.
Surprisingly, there is little causal evidence documenting the importance of athletics on the university. Our objective is to fill this void by evaluating the connection between a university’s athletics department and the university’s academic strength. One way to assess the well-being of a university is to evaluate the quality of the incoming student body. If a university is providing high-quality programs that match student needs and prepare them for successful careers, then more academically successful high school students will apply and be accepted into the university. Talented entering students improve the reputation of an institution, which can in turn lead to numerous other positive outcomes such as improved graduates’ job placements and alumni giving (Tucker, 2004). Thus, our goal is to document a relationship between the athletics department and the quality of the entering class of students.
The question becomes how to measure changes in the athletics department activities. Reverse causality is one of the hurdles to be cleared. If a university is attracting many students, then overall university revenues should be stronger, which potentially frees up funds to be invested in the athletics department. Consequently, financial strength can be causing improved outcomes in sports. Similarly, a struggling institution can be expected to cut funds to athletics, leading to worse outcomes on the field.
A good identification strategy, then, searches for an exogenous shock to the athletics department, unrelated to the university’s overall financial health. The exogenous event we consider is a sports scandal. Specifically, in this paper, we will investigate one of the most sensational sports crimes of the last few decades—the child sexual abuse scandal involving a former football coach at Penn State University. While the perpetrator was a former coach, some of the abuse violations occurred on university property and were potentially witnessed or known about by currently employed coaches and administrators. The scandal, erupting in 2011, was national news for many months. Not only did coaches get fired, but university administrators lost their jobs and were even convicted of the crime of child endangerment. In fact, the university’s president, Graham Spanier, was given a two-month prison term. 3 The punishment to the university not only included restrictions to the football team, but involved a monetary sanction of $60 million and total expenses, including tort damages to be paid to the victims, reaching $220 million. 4 Importantly, the crimes occurred over ten years before they became public and the university was sanctioned. Thus, in 2011 it acts as an exogenous shock.
Our research objective is to evaluate the impact of this particular athletics department scandal on the academic ability of the incoming student body at Penn State. By focusing on the most sensational scandal, our objective is to document empirically the existence of harm to the university. If we cannot find an adverse impact in admissions with this particular sports scandal, then it is unlikely that less-sensational violations have meaningful impacts on the academic ability of enrollees at other higher education institutions. Also, the academic value of this scandal is that it is arguably exogenous to the university’s health. As stated, the actual crimes were committed more than a decade before news of them became public. Thus, the scandal is plausibly exogenous.
We use synthetic control analysis to evaluate the causal impact of the scandal on admissions. From a donor pool of universities who also compete in football at the Division 1, a “synthetic” Penn State is created identifying which universities track Penn State closely in the period prior to the scandal. We then can compare the admissions outcomes at Penn State after the scandal to those arising in the synthetic Penn State. Differences between the two are our measurement of the scandal’s causal impact.
We document that the average high school GPA of incoming first-year students at Penn State drops substantially in the years following the scandal. Similarly, the proportion of students scoring high on the SAT Math exam reduces. We also show that these effects persist years after the scandal, so that it has had a longer-term effect on the university. Additionally, by conducting placebo tests, we show that these changes cannot be replicated at other universities for this time period. This provides further evidence supporting the causal impact of the scandal on the university’s well-being. Finally, we test alternative years for the break in the data and find that the divergence is greatest for a treatment in the year 2011. Thus, the change to admissions outcomes coincides in time with the scandal, which provides yet further evidence supporting the argument that the child sex abuse scandal caused a worsening in admissions outcomes.
Surprisingly, we are the first to formally document the adverse impact of a sport’s scandal on the university. 5 Athletics’s success, on the other hand, has received considerable attention. Numerous studies have evaluated football and basketball performance. In these studies, like ours, the impact of the success is measured by statistics of incoming students such as the proportion of first-year students with high SAT scores exceeding a set level. 6 Athletics’s success is typically measured by the school’s football team being ranked highly at the end of the year or the basketball team making the NCAA tournament. 7 Ultimately, mixed results arise with some studies finding a relationship and others not. 8 The shortcoming of these interesting research papers is that they are unable to address the endogeneity problem. Success in collegiate sports is driven in part by a school’s willingness to invest in the athletics department. A regression estimating a sport’s success on SAT scores, for example, is unable to establish whether there is, in fact, a causal impact. Since success on the field is endogenous, the factors that lead to victories can also be those factors that lead to admissions office effectiveness. Importantly, reverse causation is an especial concern. Rather than athletics causing better student recruitment, better admissions outcomes can improve university revenue, which can be invested in the athletics department. 9 Therefore, we make an important contribution to this literature by not only considering a sports scandal, rather than success, but exploiting a quasi-natural experiment that allows for a causal identification of athletics on admissions.
The closest paper to ours is Anderson’s (2017) investigation into the relationship between college football success and a number of university outcomes, including admissions. He uses gambling market spreads and a Propensity Score Matching design, recognizing the endogeneity problem between athletics success and the university’s financial and academic strength. He finds that football wins are strongly related with alumni donations and applications. Inconclusive results arise when considering the proportion of students with SAT scores in the 25th percentile. Using an exogenous scandal, we are able to document a drop in the quality of incoming students. Similarly, Rooney and Smith (2019) build a data set of (nonsport) scandals at Top 100 universities. In a difference-in-difference estimation, they document worsening in the academic ability of enrollees as well.
We also complement research on the spillover effects of college sports. For example, Lindo et al. (2012) and Hernandez-Julian and Rotthoff (2014) evaluate the effect of college football on the academic success of nonathlete students. Eren and Mocan (2018) document a connection between the success of Louisiana State University’s football team and judges’ decision making. They show that unexpected losses coincide with more rejection of youthful offender status petitions. McCannon and Wilson (2019) consider the Duke Lacrosse scandal, which involved a sensational case of student-athletes arrested for assaulting a woman at a party. Ultimately, it was learned that the accusations were false and that the prosecutor involved had actively suppressed that information during (potentially not coincidentally) his contested re-election campaign. McCannon and Wilson (2019) evaluate the prosecution of sex crimes across all of North Carolina and show that their prosecution, especially close to re-election time, were affected by the scandal. The Penn State scandal itself has been the subject of research in communication studies (Sanderson & Hambrick, 2012) and business ethics (Lucas & Fink, 2014).
Sports economics research has evaluated sports scandals directly. For example, the effect of corruption in Italian soccer (Carmichael et al., 2017) and reforms to reduce favoritism in figure skating judging (Zitzewitz, 2014) have been studied. A scandal’s impact on the school has not received attention. A complementary literature investigates the cartel behavior of the NCAA through its sanctioning activities (Humphreys & Ruseski, 2006; 2009).
Finally, sex abuse scandals have received attention. Dills and Hernandez-Julian (2012) evaluate the impact of child sex abuse in the Catholic church and enrollment in Catholic schools. Hungerman (2013) looks at how this scandal leads to a shift in charitable giving. Finally, Lindo et al. (2019) investigate the impact of Title IX investigations on applications and enrollment.
In the section “Data,” we describe the data used. A brief explanation of the synthetic control method is presented in the section “Synthetic Control Method.” Section “Results” presents our results. First, the synthetic Penn State is identified. Second, we provide our primary findings. Third, we conduct numerous placebo tests to establish the uniqueness of the effect on Penn State. Section “Conclusion” concludes.
Data
We obtain data on university admissions from Peterson’s College Data. Peterson’s provides a proprietary, comprehensive data set of information about colleges and universities in the United States. The organization surveys thousands of accredited institutions each year. Importantly for our study, it provides information on each school’s incoming first-year class.
From this data set, we use straightforward measurements to describe each university. Namely, we collect information on the current enrollment, number of faculty, in-state tuition, and out-of-state tuition. As we will describe in the following section, these variables will be used to identify which universities, as a group, look similar to Penn State.
Regarding outcome variables, we collect two primary measurements of the quality of the incoming, first-year student body. First, we use the average high school GPA. Second, we collect their SAT scores. Due to missing information from Penn State University in the SAT Verbal scores, we focus only on the SAT Math scores. Also, to complement the GPA variable, since it is a continuous measurement of academic aptitude, for the SAT Math score we record the proportion of incoming first-year students who score above 700. Thus, while the GPA variable focuses on the student body average, the SAT score we consider here focuses on the right-tail of the quality distribution of the incoming class. This approach is common in the economics of education literature.
As will be discussed, the sample of observations from which to draw the comparison schools must be determined. For our main results presented here, we choose to focus only on universities that compete in Division 1 football as our “donor pool.” While the sensitivity of our main results to this decision will be checked, we feel it is the appropriate set of potential comparisons as we are evaluating specifically a scandal in a major football program.
Finally, missing observations exist in the data set as not all universities fully report each year. Consequently, we limit our sample of schools to those with complete information in all years we study. We focus on higher education outcomes from 2002 to 2016. This time span allows us to use numerous prescandal years to fit a comparison set of schools well, and allows for numerous years after the scandal to fully assess the scandal’s impact on the university. Consequently there are 32 schools in our sample for the high school GPA and 37 for the SAT Math investigation. Table 1 provides descriptive statistics pooling all colleges and universities over all years covered in our study.
Descriptive Statistics.
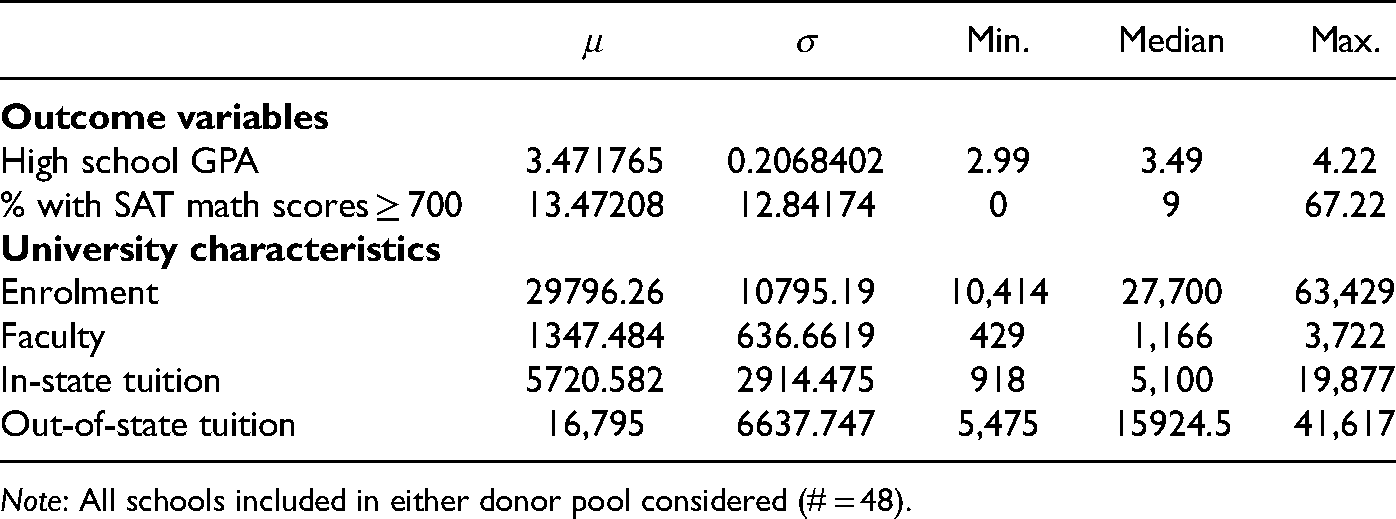
Note: All schools included in either donor pool considered (# = 48).
Substantial variation exists in outcomes variables across our donor pool. As to be expected, universities who compete at a high level in college football have large enrollments and faculty sizes.
Our identification strategy rests on the premise that information on the scandal reached many potential applicants and their families. To provide suggestive evidence of this, we depict Google Trends data on internet search behavior. First, the top panel of Figure 1 depicts the relative frequency of keyword searching on “child sex abuse” on Google across the United States.

Google Trends. Notes: The top panel is the time series of Google searches for “child sex abuse” in the United States. The bottom panel is the time series of Google searches for “Penn State University.” Google Trends data normalizes the searches by the greatest value observed in the time series.
A clear spike occurs in 2011, coinciding perfectly with the breaking of the news on the scandal. Thus, the event stands out in the public’s consciousness of the crime. The bottom panel of Figure 1 depicts the relative frequency of Google searches for “Penn State University” in the United States. Here, searches cycle and peak in the fall of each year. This coincides with the beginning of the school year and the football season. The peak in 2011, though, is substantially greater. Thus, the scandal was salient.
Synthetic Control Method
In our empirical analysis, we use the synthetic control method developed by Abadie and Gardeazabal (2003) in their study of terrorism’s effect on economic growth in the Basque region. The method’s objective is to create a “synthetic” unit, which is comprised of a weighted basket of similar units. In our context, our goal is to create a synthetic Penn State University using data from other universities. Variables that are used to predict the university’s admissions outcomes are used to match the best synthetic unit to the true, actual unit. Here, we use the school characteristics described in the previous section.
A donor pool of similar units is used to construct the synthetic. Our primary results use the set of universities that compete at the Division 1 level of college football. In our Supplemental Appendix, we show that our main results persist if we consider alternative donor pools. Weights on each unit within the donor pool are determined to minimize the difference between the true unit and the synthetic unit in the periods prior to the treatment. These weights sum to one. 10
With these constructed weights, the outcome variables can be calculated for the synthetic unit. For our investigation, we are interested in two outcome variables: high school GPA and proportion with SAT Math scores over 700. The values the synthetic takes in each year can then be compared to the values taken by the unit of observation. As is common, we only consider our outcome variables in four-year increments (2002, 2006, 2010), rather than every year, in the creation of the synthetic. This is done to avoid the over-valuing of the outcome variables in the determination of the units comprising the synthetic (Islam, 2019). Including all pretreatment values of the outcome, the variable has been shown to bias the treatment effect’s estimate (Kaul et al., 2017).
Results
We first create the synthetic Penn State University using the predictors previously described. Due to missing observations, the donor pool differs slightly for the two outcome variables. As a consequence, the universities selected to make up the synthetic Penn State differ. We show how in both exercises that the synthetic closely matches the actual Penn State in the pretreatment period.
Second, with the synthetic created, we conduct the analysis to evaluate whether (and by how much) the true Penn State University has diverged from its synthetic since the scandal. Again, both outcome variables will be considered.
Finally, we check the robustness of the results by conducting a placebo test. In it, each university in the donor pool is treated as if it had experienced a scandal the year the real scandal occurred at Penn State. These “false” scandals can be used to check the robustness of the results. If the divergence identified with many placebos matches what is observed at Penn State, then one could reasonably question our finding’s validity. If these placebo tests are unable to replicate the divergence observed at Penn State, then we can be more certain that we are actually measuring the causal impact of the scandal on the university’s admissions. We also evaluate the timing of the break in the time series to assess whether the divergence observed coincides temporally with the scandal.
Synthetic Penn State
As stated, there are 32 universities who compete at the Division 1 level in football with full reporting of the high school GPA (and all of our predictors) in our data set over the entire sample period. Also, there are 37 universities, who again compete in Division 1 football, with full reporting on SAT Math scores over the period. Overall, 70% of donor schools are included in both lists. Thus, the donor pools are similar, but sufficiently distinct. This has value in that if the scandal creates an adverse outcome with each donor pool, then we can be more confident in the insensitivity of the results.
Table 2 provides the list of the universities who ultimately constitute the synthetic Penn State. The final column presents the weight placed on each school.
Synthetic Control Weights.

The list of universities is reasonable. For example, U.S. News & World Report currently ranks Penn State as #57 in the National Universities list. Maryland and Georgia Tech rank #64 and #29, respectively. Temple, Colorado, and Miami are also quite comparable (tied for #104 and #91, respectively). Maryland competes in the same athletic conference (Big Ten), and Mississippi State (SEC), Kansas (Big 12), Colorado (Pac-12), and Georgia Tech (ACC) each compete in comparable conferences. Also, Temple, Maryland, and Miami are in close geographic proximity, with the first two being southeast of Penn State, and Miami being to the southwest. They will actively compete for the same students. All are public universities. Thus, while quantitatively they fit Penn State’s data best, they also make up a reasonable set of peer institutions. Some distinction in the units making up the synthetic is to be expected. Since the matches on GPA and SAT are done separately, it is reasonable to presume that the set of colleges who match Penn State in the average high school GPA may not necessarily be the same set of schools who replicate Penn State in the proportion of the entering student body with high SAT scores. Rather, replicating the mean is not necessarily the same thing as matching the quality’s right tail.
Using these weights, we can quantify the goodness of fit between the synthetic and the actual Penn State. The years prior to the scandal, 2002–2010, are considered.
Regarding the university characteristics, the synthetics record a systematic level-shift reduction compared to the values observed at the true Penn State. The synthetics generate a lower enrollment and faculty size. Both in-state and out-of-state tuition are less as well.
What is crucial, though, is that the universities which make up the synthetic are able to closely track Penn State in our outcome variables. Regarding the traits of the incoming first-year students, the outcome variables track extremely well. The synthetic Penn State is able to nearly perfectly match the high school GPA values for each selected year prior to the scandal. Similarly, the percentage of the incoming class who is able to achieve the high SAT Math score closely replicates the true Penn State. The root mean squared prediction errors measure the tightness of the fit, and indicate a stronger fit for the GPA outcome variable. Also, the ratio of posttreatment to pretreatment prediction error is smaller for the GPA synthetic than the SAT synthetic. That both ratios are relatively large indicates that divergence has occurred between the actual and synthetic Penn State after 2011, relative to the tightness of the fit prior.
Divergence
Given that the synthetic control method seems to be able to match Penn State quite closely, we turn to the time series analysis of the university, relative to its synthetic, in the scandal’s post period. We proceed by depicting graphically the divergence between the actual Penn State and its synthetic. Figure 2 shows the average high school GPA across time.
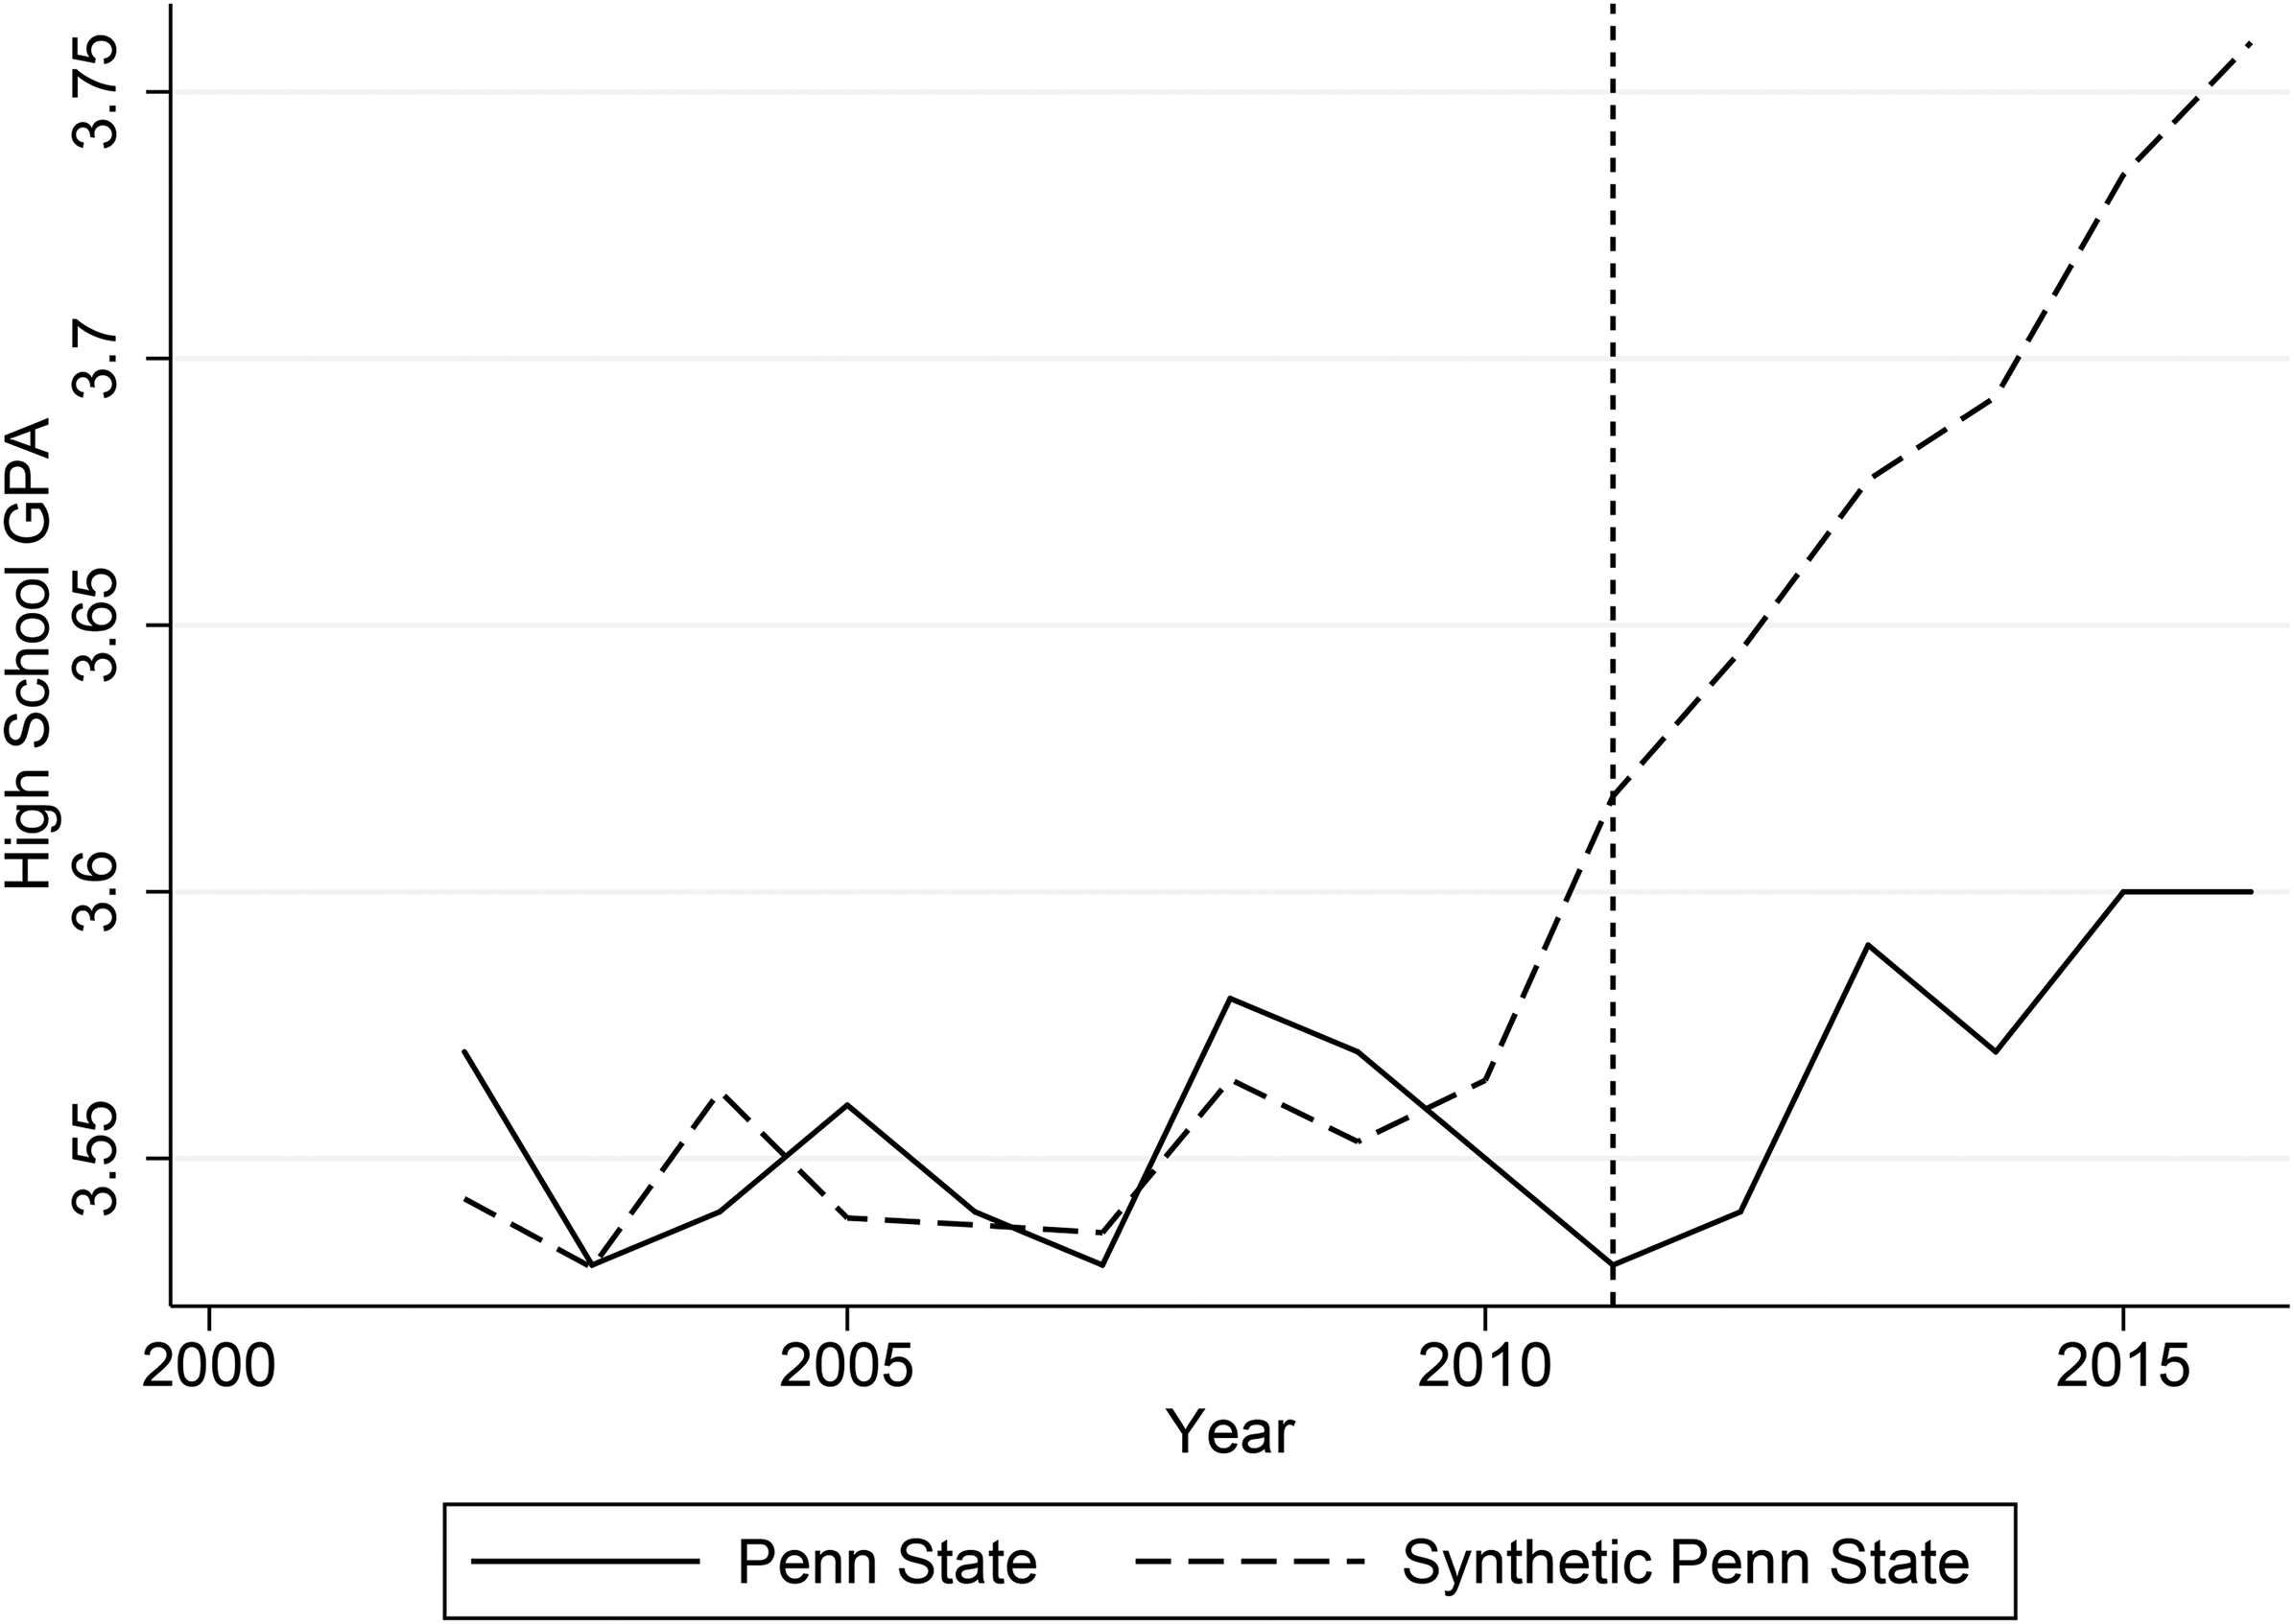
Synthetic Control Results: GPA.
A noticeable split occurs precisely when the scandal hit the university (2011). Prior to that year, and as suggested in Table 3, the two-track close together in the pretreatment period. A significant split occurs after the scandal. The gap between the true and synthetic Penn State remains relatively stable through 2016 (≈ 0.15 points), suggesting a longer-term, permanent impact on the university (rather than a transitory one).
Predictor Balance and RMSPE.

Turning to SAT Math scores, Figure 3 depicts the proportion of incoming, first-year students with SAT Math scores in excess of 700.
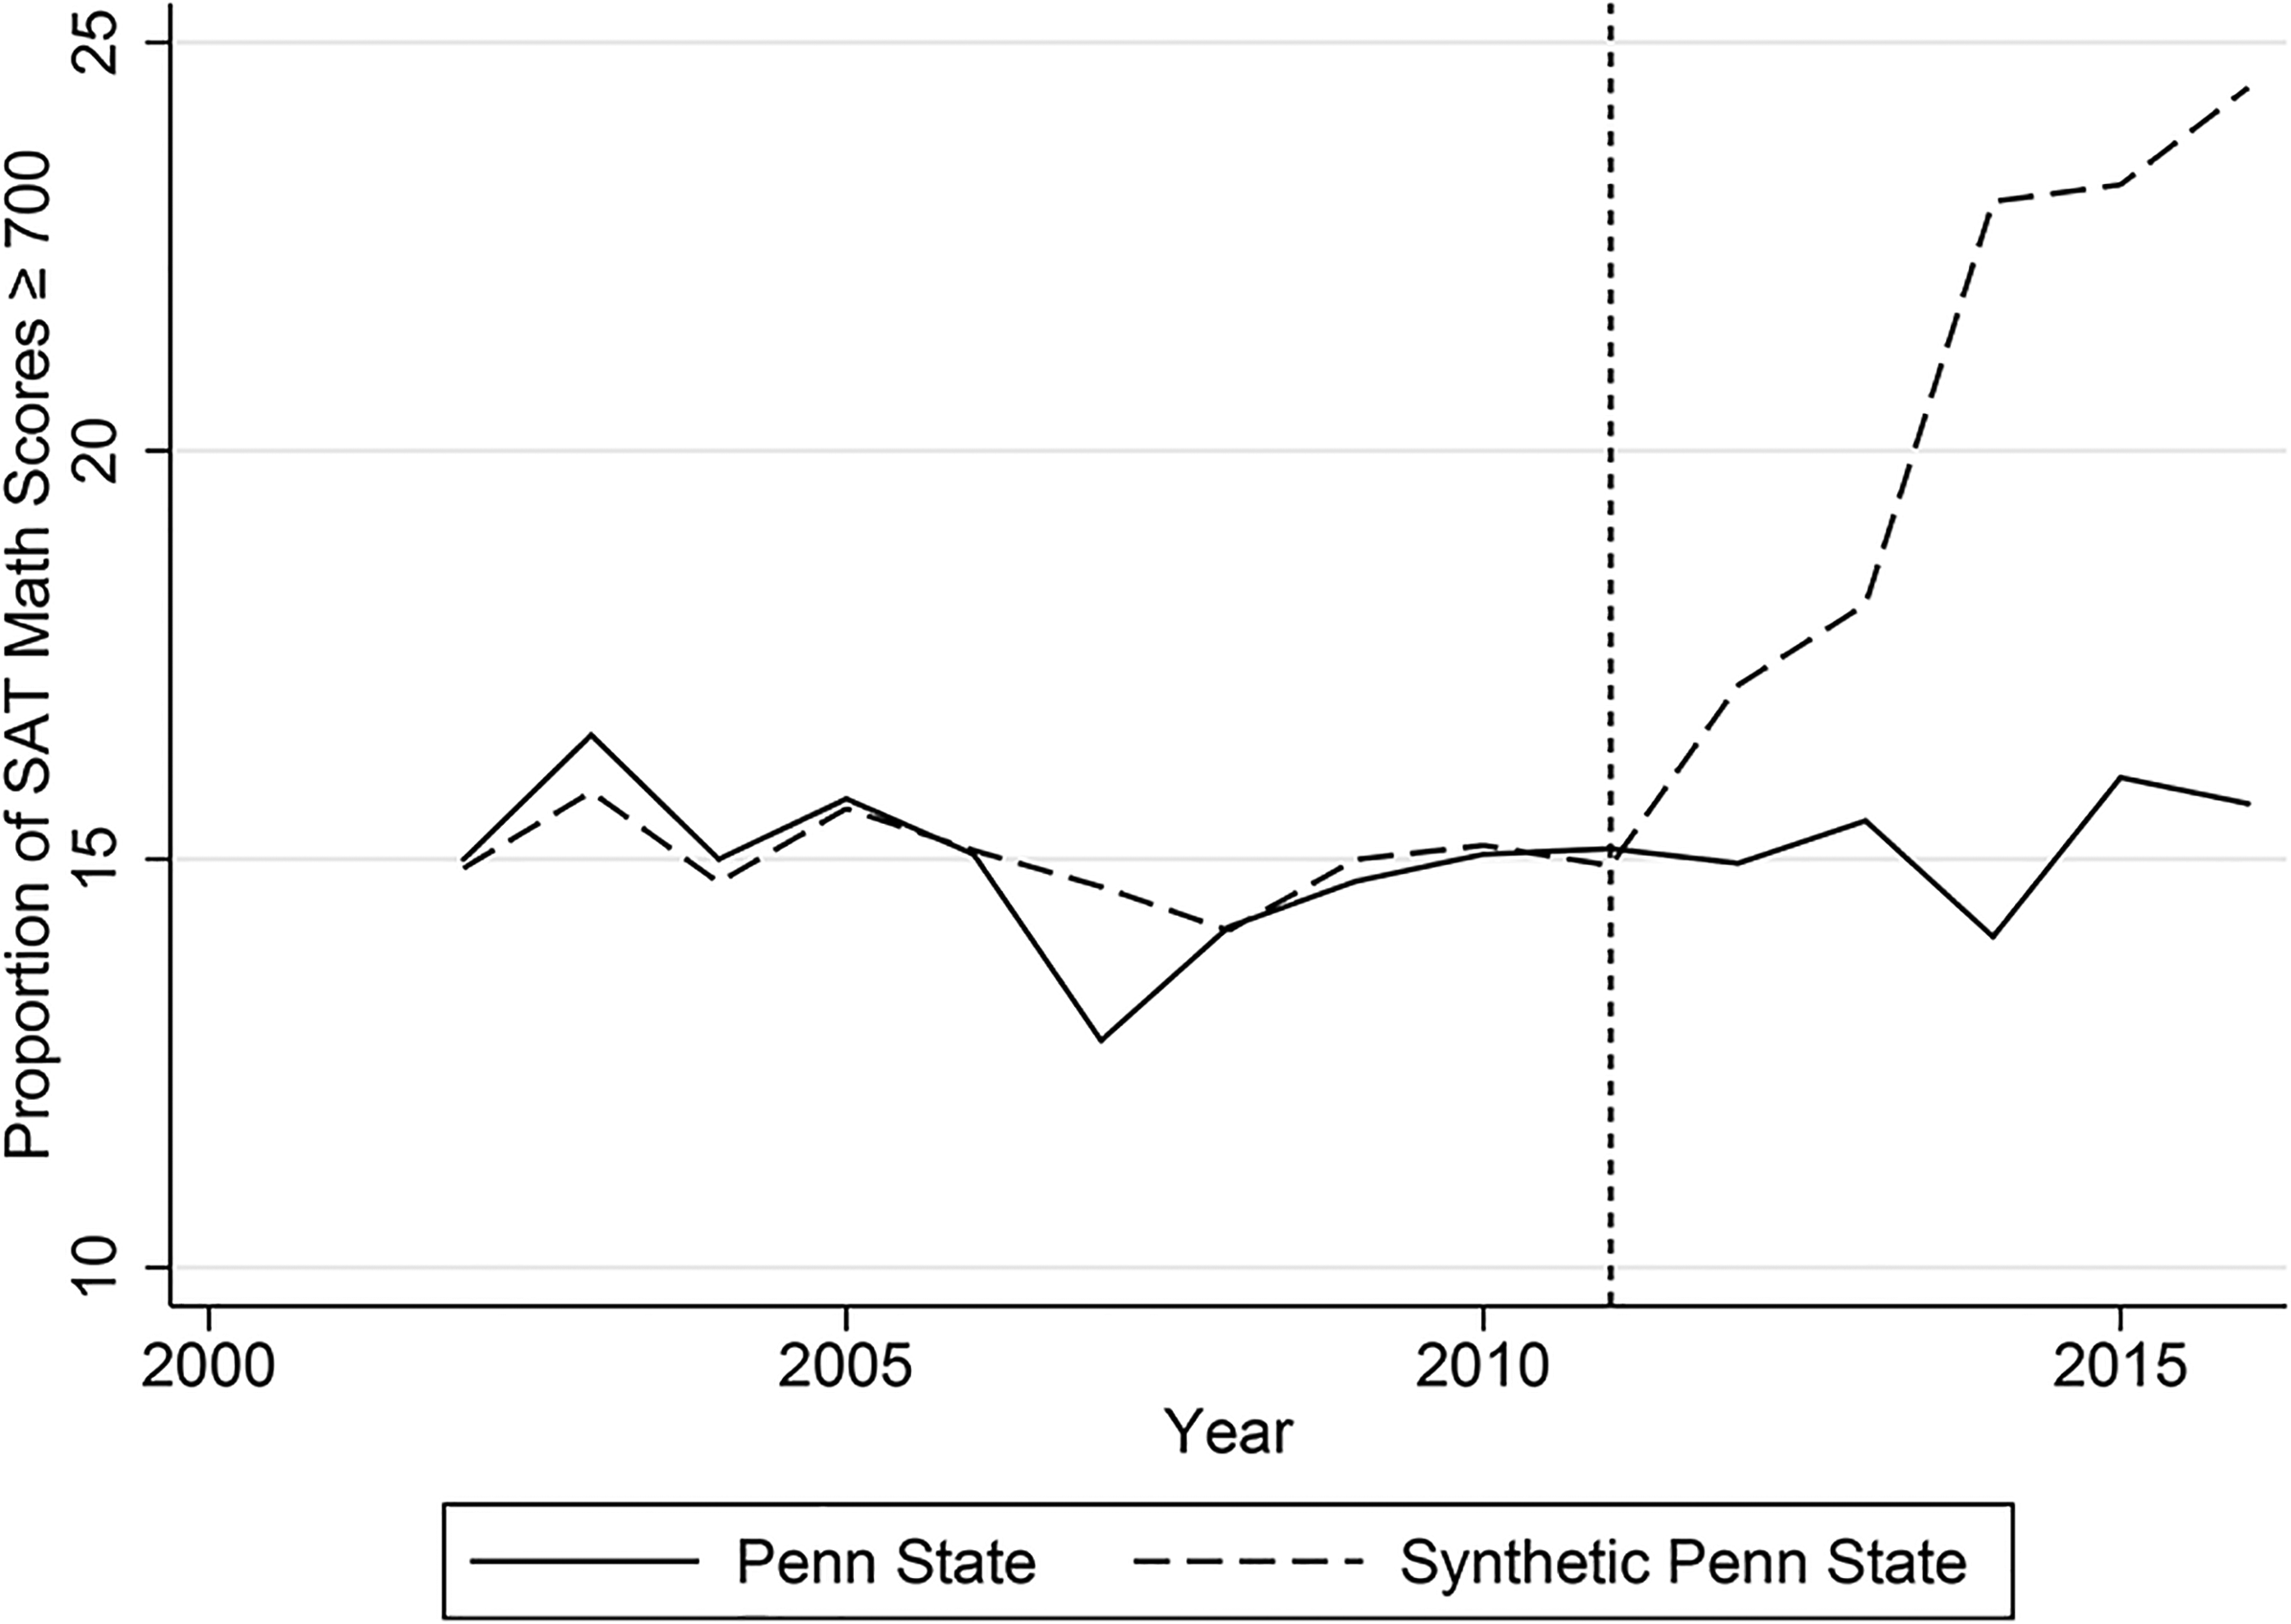
Synthetic Control Results: SAT.
Again, while the two tracks closely in the pretreatment period, the synthetic diverges from the actual Penn State values after the scandal. At the time of the scandal, Penn State had approximately 15% of its incoming first-year students with SAT Math scores exceeding 700. By 2016, this had climbed to approximately 16%. The synthetic, on the other hand, went from 15% to 22%. Thus, the university was unable to keep up with the improvements of its peer institutions.
To provide an estimate of the average treatment effects, we run simple difference-in-difference regressions. The dependent variables for the two regressions are the two outcome variables. The actual Penn State values and the synthetic Penn State values are pooled together. We then estimate the regression with an indicator for the observation being from the true Penn State, an indicator for the observation coming after the scandal, and the interaction term between the two. The coefficient on this last is the difference-in-difference coefficient and is our estimate of the average treatment effect. Table 4 presents the estimates.
Average Treatment Effects.
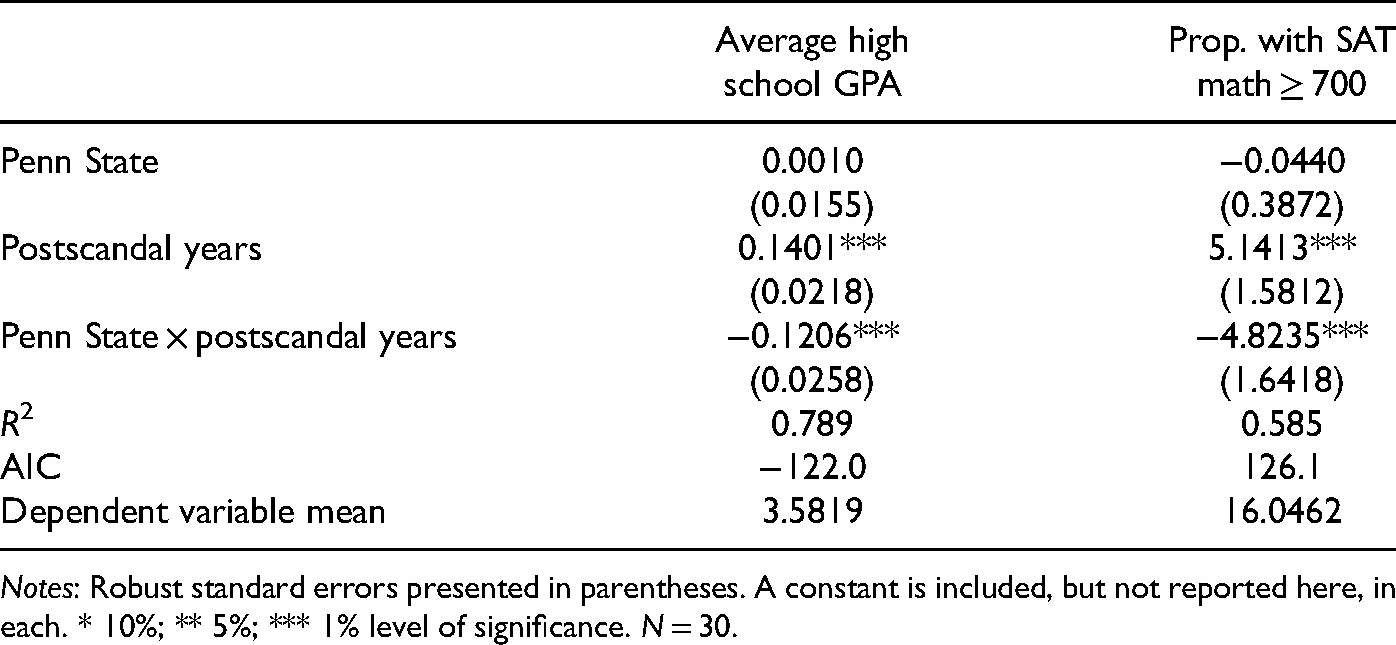
Notes: Robust standard errors presented in parentheses. A constant is included, but not reported here, in each. * 10%; ** 5%; *** 1% level of significance. N = 30.
The scandal caused the university’s entering class to have a high school GPA of 0.12 points lower and the proportion with the high SAT Math scores to reduce by 4.8 percentage points. Using the fifteen years of data from Penn State, the former represents a 3.4% reduction at the mean and the latter represents a 32% reduction at the mean. Thus, the effects are economically significant as well. The impact on the right tail of the quality distribution is larger, suggesting it had a larger distortionary effect on higher-quality applicants.
Placebo Tests
While interesting and suggestive, synthetic control analysis is designed to match the two closely in the pretreatment period. Thus, it is not surprising that divergence occurs after the scandal. While Table 4 shows that the two lines are statistically distinct after the treatment, a falsification test would be of value.
One approach used in synthetic control analysis to deal with this concern is to conduct numerous placebo tests. With this, each unit in the donor pool is evaluated as if there was a shock in the year of the Penn State scandal. The rest of the donor pool is used as its donor pool. A synthetic is created, as was done for Penn State in the previous section. The divergence between the placebo’s actual and synthetic values is produced. As stated, this procedure is done for each university in the donor pool.
If the divergence observed for Penn State can be replicated for many of the other universities in the donor pool, then the significance of the previous results can be called into question. If Penn State stands out as an outlier, then we can have confidence in the scandal’s causal impact.
Following Abadie et al. (2010), we consider only those placebos where the goodness of fit in the prescandal period between the actual and synthetic is sufficiently strong. If a university cannot be closely matched with a synthetic prior to the scandal, then the comparison of the two after the scandal can simply be attributed to noise.
Considering first the high school GPA of incoming students, Figure 4 graphs the difference between the synthetic and actual values for each university in the donor pool across time. Penn State is depicted as the dark, bolded line.
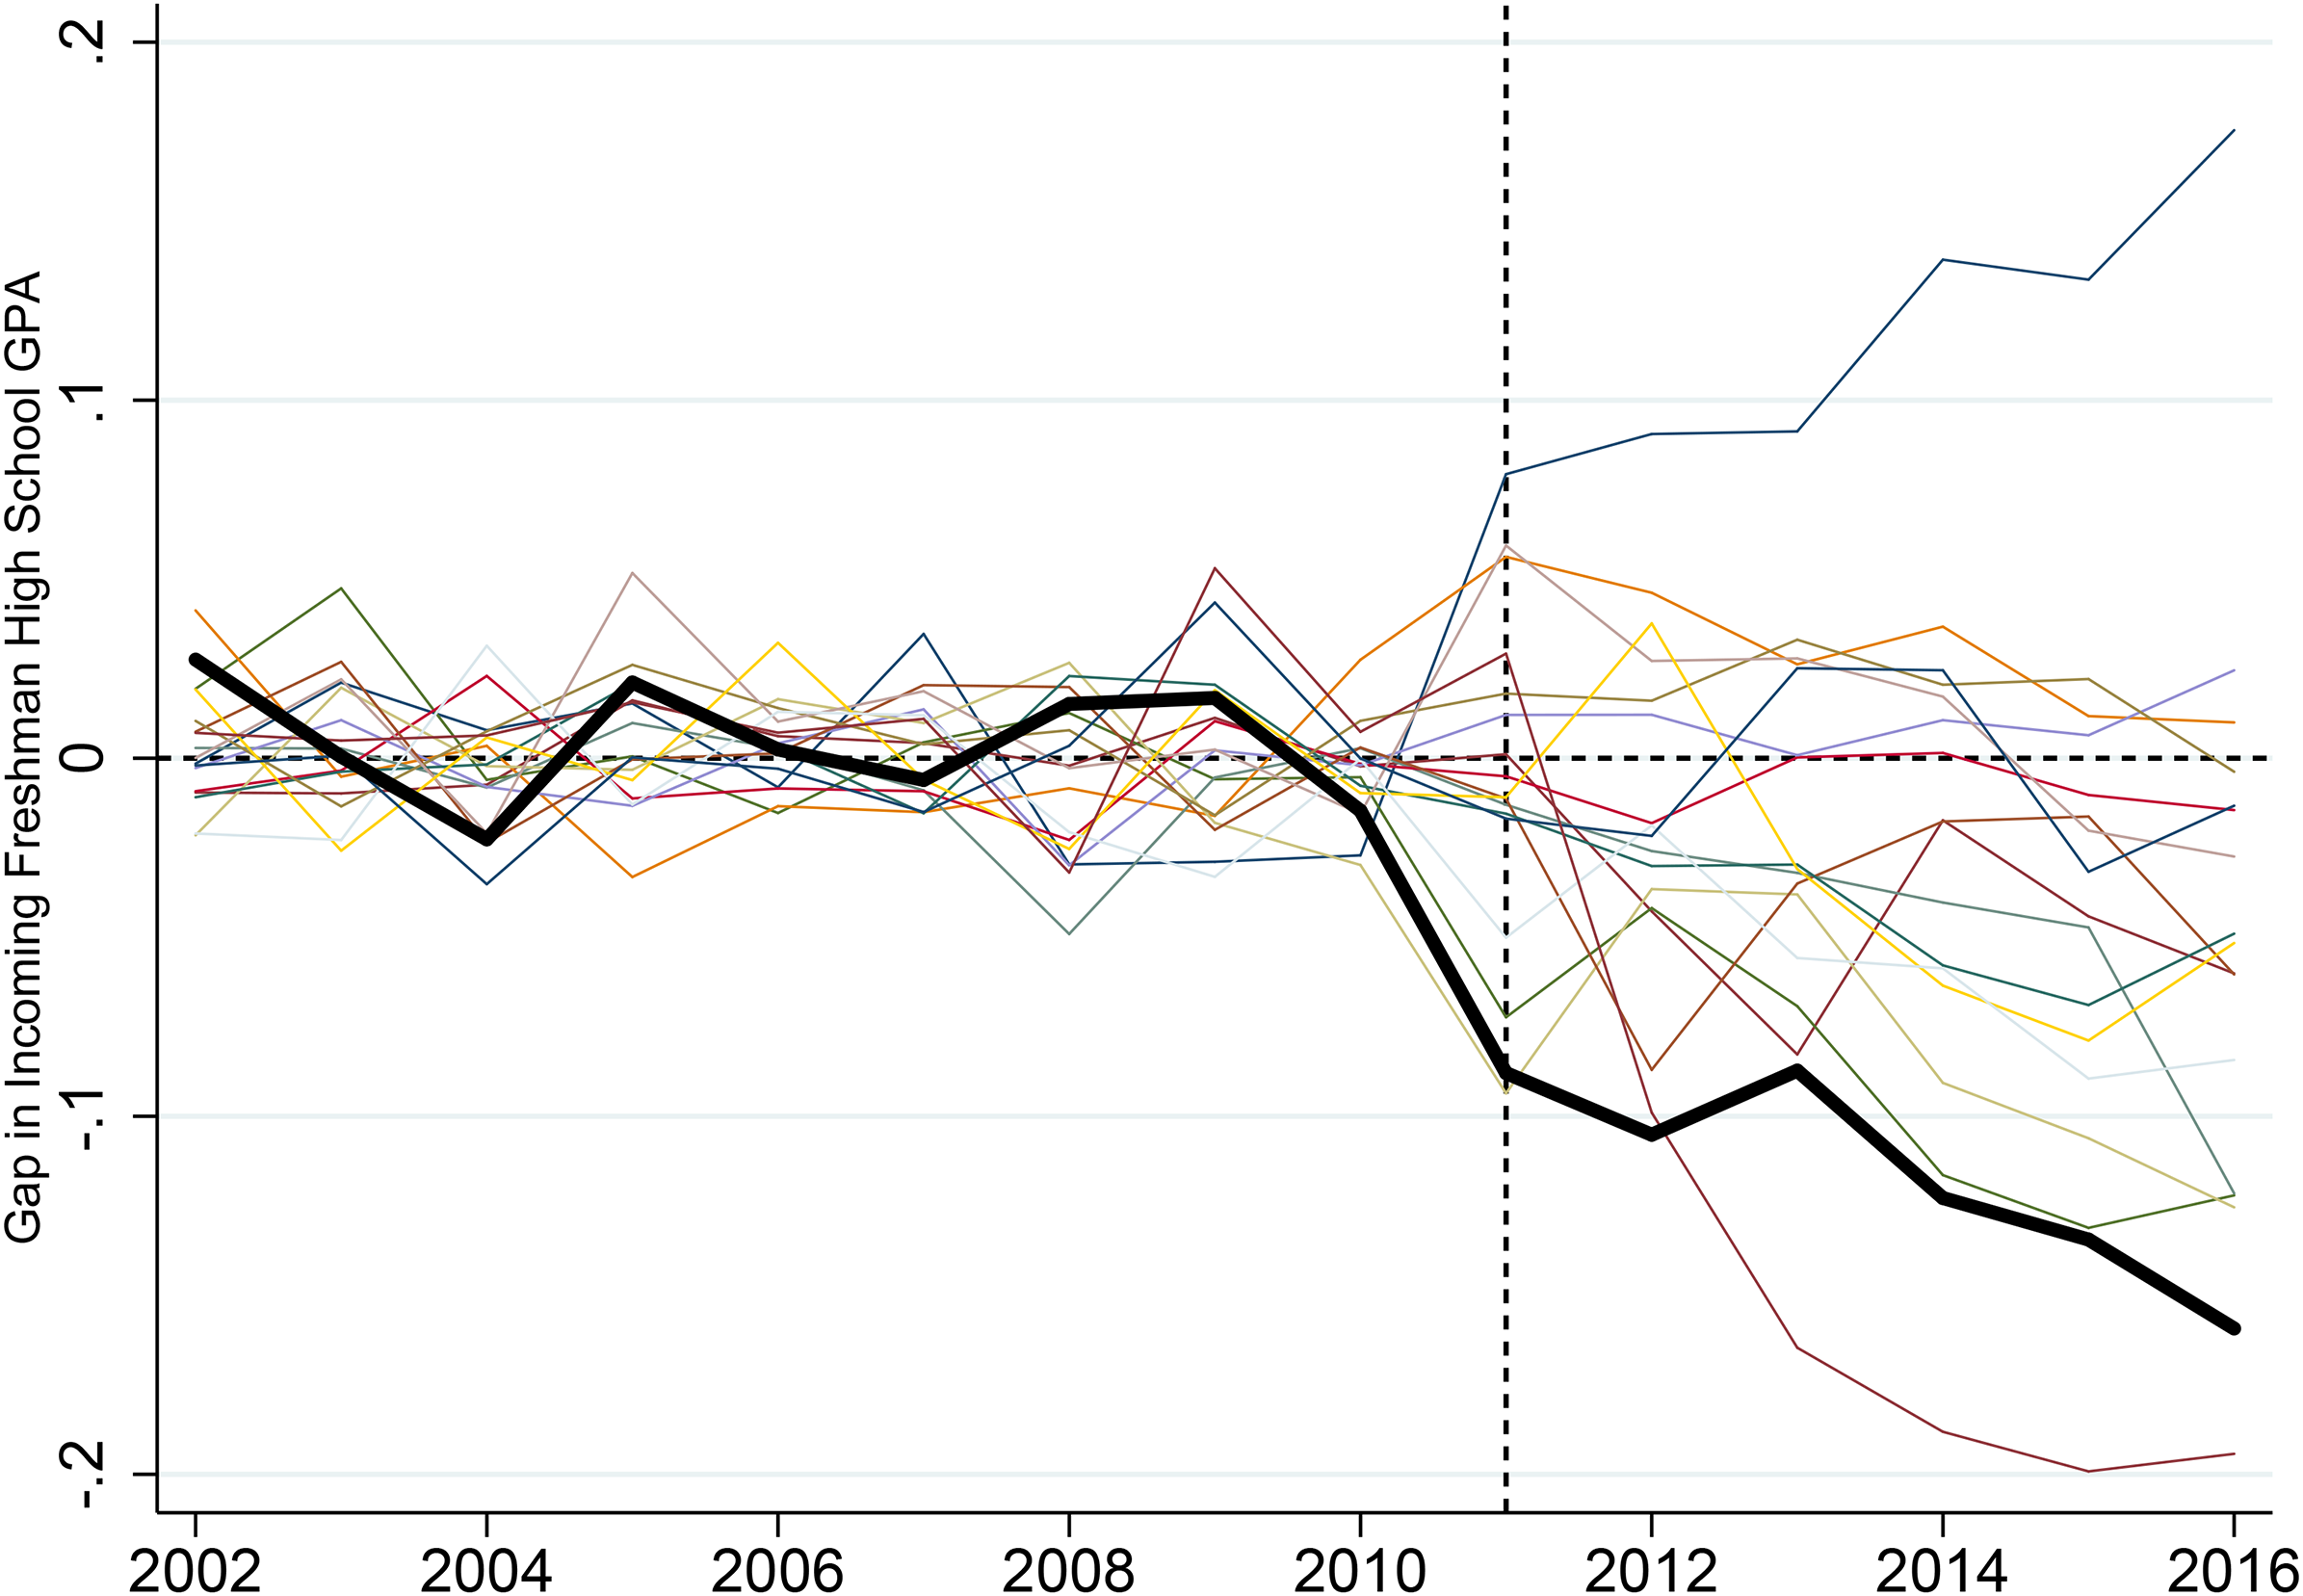
Placebo Test: GPA. Notes: We exclude any placebo where its mean squared prediction error is more than two times that of Penn State.
As one can see, the gap between the synthetic and actual, prior to the scandal, is close to zero for both Penn State and all other universities in the donor pool. A wide variety of divergences arise with the placebos after the scandal. Some are recorded as having a positive improvement in high school GPAs, relative to its synthetic, while others record a reduction. By 2016 all universities, except one, show less divergence between the synthetic and the actual values than Penn State.
Cunningham (2018) discusses constructing p-values based on the placebo tests. After assigning placebo treatments to schools that did not experience a scandal, posttreatment to pretreatment RMSPE ratios are calculated for each university. The p-value is constructed by considering where the treated institution’s RMSPE ratio ranks among the placebo schools. Table 1 presents the ratios for each outcome variable and their associated p-values. With GPA as the outcome variable, the ratio of the pre to posttreatment prediction errors is 7.14975, which ranks first out of 28 schools. Hence, it yields a p-value of .0357 (= 1/28).
Similarly, we conduct placebo tests for the donor pool used for the SAT Math score analysis. Figure 5 presents the difference between each university’s actual and synthetic value across time. Again, Penn State is depicted in the dark, bolded line.
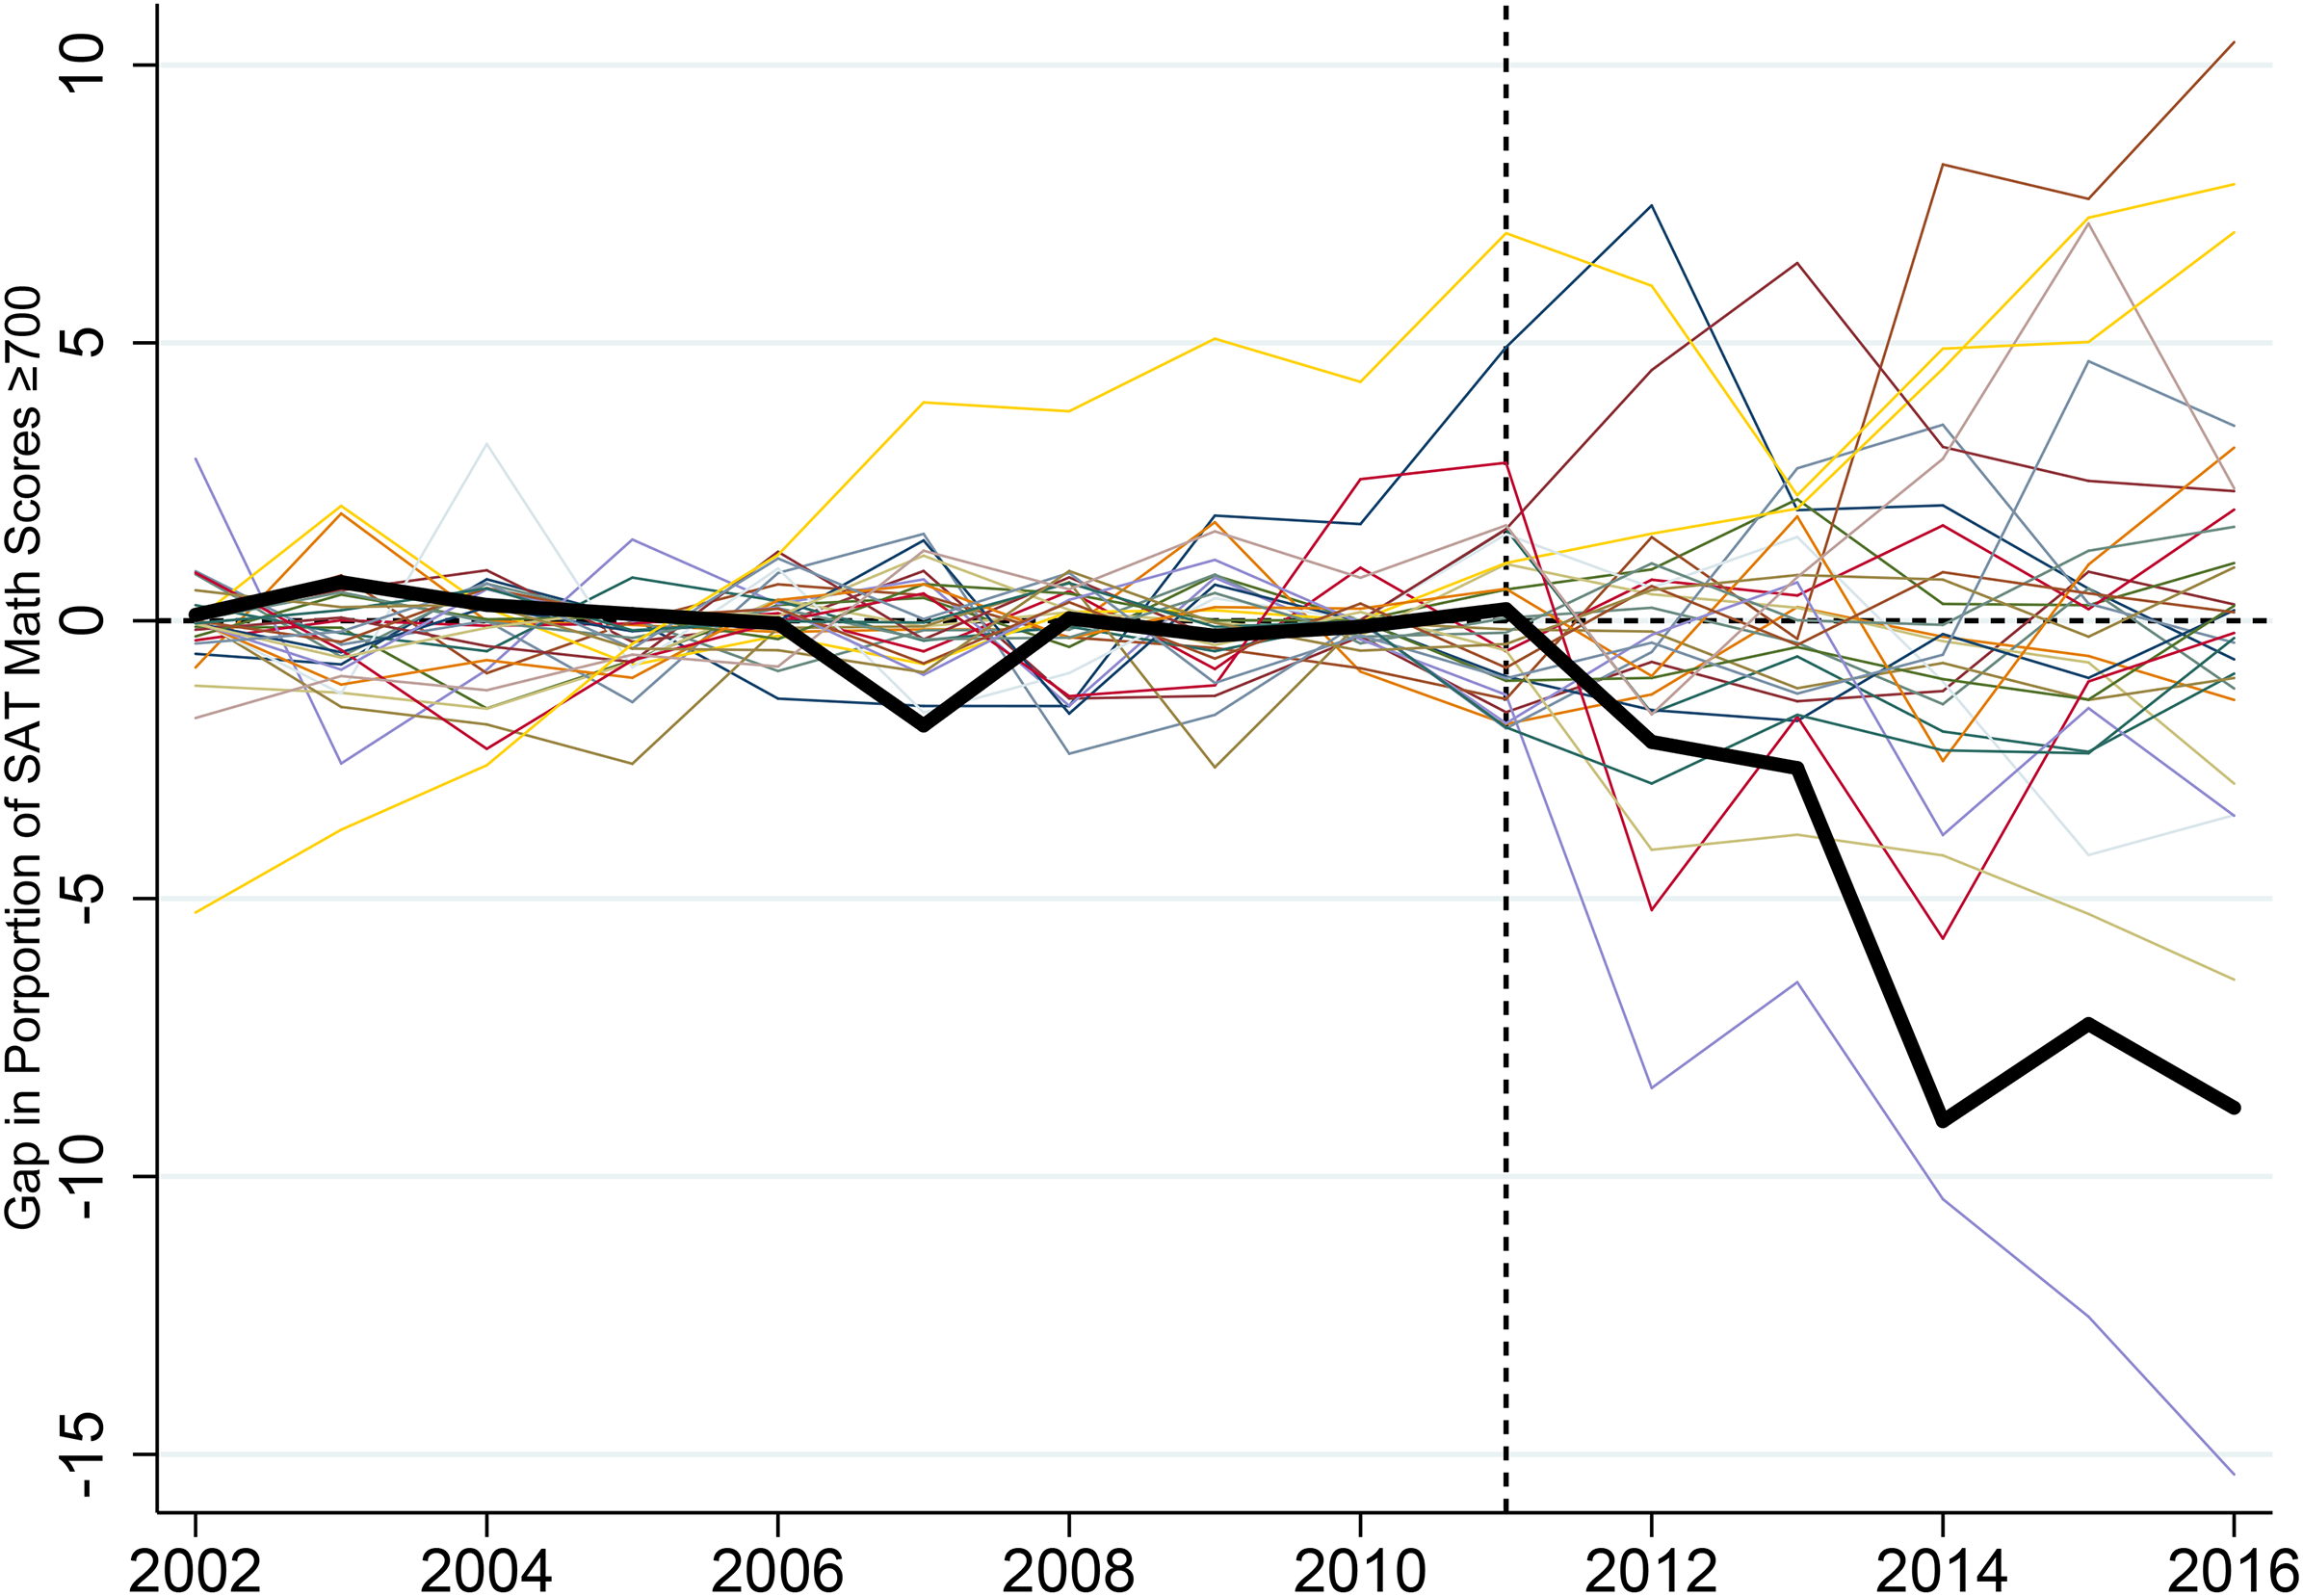
Placebo Test: SAT. Notes: We exclude any placebo where its mean squared prediction error is more than two times that of Penn State.
Once again, each placebo is able to get a relatively tight fit prior to the scandal. After the scandal, there is a similar number who see improvements and a number who see decreases in admissions quality. Noticeably and importantly, Penn State stands out as a relative outlier. The drop in the proportion of incoming first-year students with high SAT Math scores is substantially different. In fact, 96.3% of the placebos experience less divergence.
For the sake of robustness, we consider alternative donor pools, but for the sake of brevity, we do not include its analysis here. To summarize, though, one can be concerned that the results are sensitive to the donor pool selected. Up to this point, we chose to consider universities who compete in Division 1 level football and have full information on all predictors. We consider two alternatives. First, we expand the set of predictors to include university endowment. Our donor pools shrink slightly due to missing observations. Our observed divergence remains, which cannot again be replicated by others in the donor pool. Second, we instead cast a wider net and re-evaluate the results considering all colleges and universities in the NCAA. 11 The only restriction is that they must have complete data available for all variables used across the entire sample period. Expanding the donor pool comes at the risk of including schools fundamentally different from Penn State since they do not have high-profile football programs affecting their recruitment, but have the potential benefit of constructing a better fitting synthetic. Again, we record substantial divergence between the actual and synthetic Penn State after the scandal, with a close fit prior. Placebo tests on this larger donor pool continue to present Penn State as an outlier amongst institutions of higher education. These additional findings arise for both admissions quality measurements. They are available in our Supplemental Appendix. As a consequence, our findings of an adverse impact of the sensational football scandal on the quality of the admissions are robust.
The final robustness analysis we conduct is to consider “false” scandal years at Penn State. That is, we consider a hypothetical event occurring at Penn State in different years and then re-calculate the ratio of the root mean squared prediction errors before and after these events. If the divergence we are recording is largest in 2011, then we can be confident that it is the year 2011 when the break occurs. Table 5 presents the ratios calculated for both outcome variables.
Alternative Treatment Years.

Notes: We report the ratio of the root mean squared prediction errors after the time break to before it for each year for each outcome variable.
The ratio is greatest for GPA in 2011. It is substantially greater than every other year. Thus, a clear break occurs in the data in the precise year of the scandal. For SAT, both 2011 and 2012 exhibit large divergence. Importantly, the ratios are increasing monotonically up to this point. Thus, a break in these time series is occurring right around 2011, the year of the scandal.
Conclusion
We ask whether the athletics department influences the quality of the university they are a part of. Many universities spend substantial amounts of funds on athletics (Hoffer et al., 2015), and it is therefore important to appreciate athletics’ spillover onto the rest of the institution. To measure the quality of the university, we measure the average high school GPA and the proportion with SAT Math scores in excess of 700 for incoming, first-year students. To measure the athletics department, we take advantage of a high-profile scandal with Penn State University’s football program. The scandal was a major news story for an extended period of time across the country and it arose in one of the dominant football programs. If athletics departments are to ever affect the quality of a university’s admissions, it must be that this scandal adversely affected this university. If we are unable to document an impact here, then it is highly unlikely that the academic ability of enrollees at institutions of higher education are fundamentally affected by the athletics department.
Following a synthetic control analysis approach, we document substantial reductions in admissions quality at Penn State following the scandal. In the years following the adverse event, the average high school GPA of first-year students reduced approximately 0.12 points, and the percentage of incoming students with high SAT Math scores reduced by almost 5 percentage points. These are nontrivial, economically significant reductions affecting both the mean and the right-tail of the student distribution. These effects cannot be replicated in other universities, and are centered temporally on 2011.
While there is obviously more to the educational service provided by a university, the quality of its admissions is (arguably) a proxy for all other outcome variables of interest. As student demand increases, so too does university revenue. This allows the university to invest in higher quality faculty, more and better student services, and create an improved overall academic environment. Future work, though, may want to consider the impact of athletics departments on other dimensions of higher education.
It is important to emphasize that the divergence observed in the estimations comes not from Penn State worsening, relative to its recent past, but from not being able to keep up with the improvements that its “peer” institutions have enjoyed. 12 This is important to note as there is anecdotal evidence of worsening demographics in the state that have corresponded to suffering enrollments of other colleges within the state. 13 Further, our data precludes the study of the impact of the scandal, and other unrelated changes in demand, on the price charged. Price effects are also an important dimension we do not explore but should be considered.
Also, while we argue that exploiting an exogenous shock to the athletics department provides the opportunity to conduct a causal investigation of athletics’ impact on admissions, one may be concerned that the adverse effects of a scandal are not mirrored when considering positive impacts, such as success on the field. We feel that documenting the existence of an effect is an important step.
Synthetic control analysis is a valuable econometric tool to investigate formally how a single event leads to changes in an outcome variable. One is left to wonder whether the findings are externally valid. Rather, would one expect the findings for Penn State University to apply to other colleges and universities? In short, a limitation of our study is we do not evaluate numerous scandals. We are unable to study other high-profile scandals at other institutions. The crimes committed by the trainer at Michigan State is too recent (2017) to be able to assess the postscandal effects, and the “death sentence” applied to the football program at Southern Methodist University (1987) is too far back in time for us to be able to collect data. Nevertheless, our ability to measure a causal impact is novel and is valuable to the understanding of how institutions of higher education function in the United States.
Supplemental Material
sj-pdf-1-jse-10.1177_15270025211039444 - Supplemental material for Athletics and Admissions: The Impact of the Penn State Football Scandal on Student Quality
Supplemental material, sj-pdf-1-jse-10.1177_15270025211039444 for Athletics and Admissions: The Impact of the Penn State Football Scandal on Student Quality by Candon Johnson and Bryan C. McCannon in Journal of Sports Economics
Footnotes
The authors appreciate the comments and suggestions from Craig Depken, Brad Humphreys, and Mark Wilson. Candon Johnson is currently employed by the U.S. Food and Drug Administration (FDA). The views expressed in this study are those of the author and do not represent the opinions of the FDA.
Declaration of Conflicting Interests
The authors declared no potential conflicts of interest with respect to the research, authorship, and/or publication of this article.
Funding
The authors received no financial support for the research, authorship, and/or publication of this article.
Supplemental Material
Supplemental material for this article is available online.
Notes
Author Biography:
Appendix
Table A6 lists those universities that make up the donor pool. The top panel is those used in the investigation into changes in high school GPA of incoming, first-year students. The bottom panel lists the donor universities for the investigation of the SAT scores.
References
Supplementary Material
Please find the following supplemental material available below.
For Open Access articles published under a Creative Commons License, all supplemental material carries the same license as the article it is associated with.
For non-Open Access articles published, all supplemental material carries a non-exclusive license, and permission requests for re-use of supplemental material or any part of supplemental material shall be sent directly to the copyright owner as specified in the copyright notice associated with the article.