
Abstract
This paper studies whether Major League Baseball umpires displayed home bias in their pitch calls, using data on pitch call accuracy from the 2010–2019 seasons to isolate evaluator bias from player performances. The main findings are consistent with umpire home bias, as home batters on average received more called balls on actual ball pitches and fewer called strikes on actual strike pitches, which work in their favor. The bias is not entirely explained by umpire, player, or stadium characteristics, nor is it attributable to umpiring inconsistencies.
Introduction
This paper evaluates whether home bias exists among Major League Baseball (MLB) umpires in their pitch calls. Umpire home bias is an example of a principal-agent problem, where the interests of the evaluators (i.e., the umpires) from showing favoritism toward the home team exceed the rewards from the league for being objective evaluators. 1 Such bias leads to inaccurate performance evaluations as they no longer measure the true productivity of the evaluated individuals (Parsons et al., 2011). 2 However, identifying umpire bias requires assessing umpires’ productivity, which can be challenging for several reasons. First, an objective benchmark to assess umpire productivity may not exist when the officiating rules require subjective interpretations. Furthermore, disentangling umpire performance from player performance may be difficult. For example, an umpire calling more fouls against a team may reflect his or her bias against the team, but it is also possible that the players commit more fouls in the first place. Finally, umpiring calls may in turn affect the decisions by the players, as players may adjust their strategies based on the observed calls.
The main contribution of this paper is to use the accuracy of pitch calls, which can be evaluated by comparing the actual pitch locations versus the pitch calls, to address the aforementioned issues and provide additional evidence on umpiring bias. In the context of MLB, call accuracy can be objectively evaluated since ball and strike zones are well defined in the rulebook (Tainsky et al., 2015), 3 and the pitch locations can be accurately tracked. Call accuracy also controls for the impact of pitcher and batter performances relative to call instances. While the number of ball and strike calls would also depend on the pitcher's and the batter's abilities, the accuracy of pitch calls (conditional on the actual location of the pitches) would only reflect the umpire's ability to distinguish between balls and strikes.
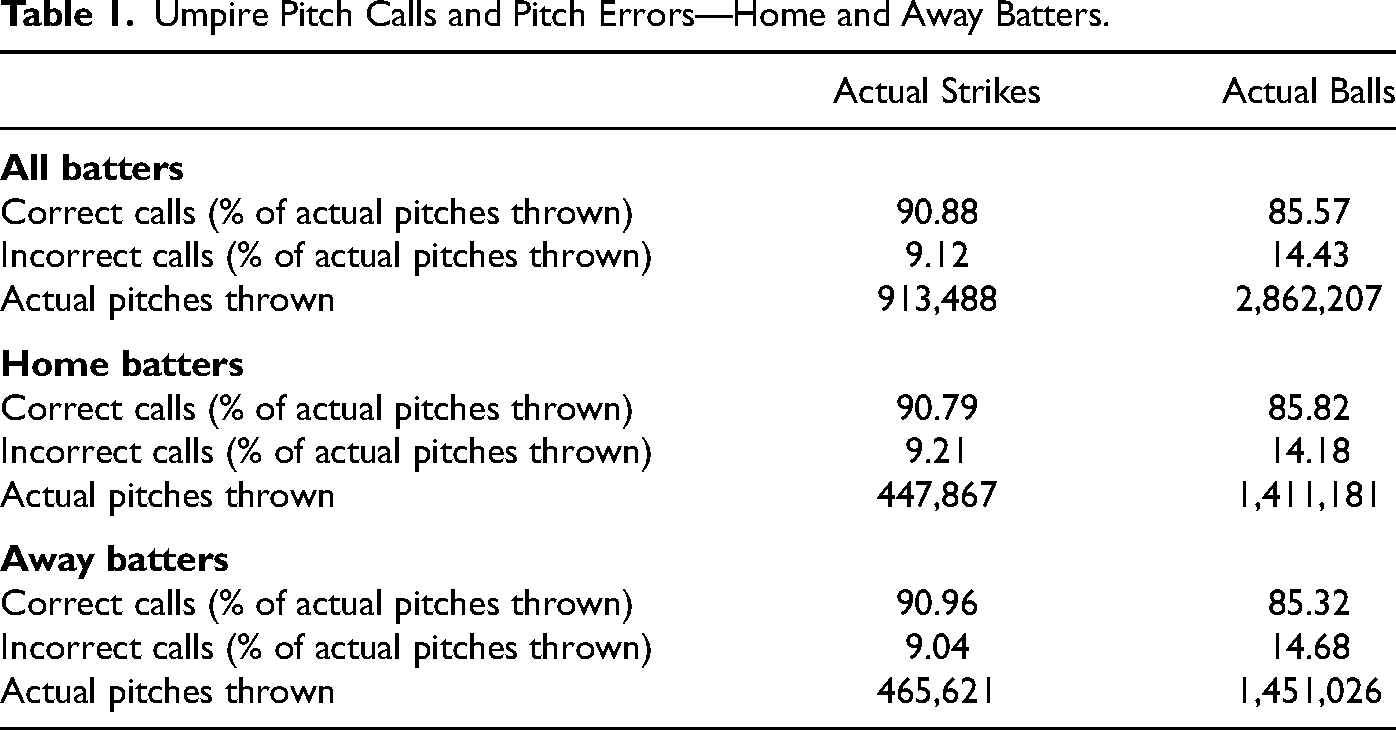
Figures 1 and 2 demonstrate the degree of inaccurate calls by comparing the difference between actual pitch calls and actual pitch locations from the 2010–2019 seasons. About two-thirds of all pitch calls were balls and one-third of pitch calls were strikes. However, among all of the actual pitches thrown, slightly less than a quarter of them would have actually fallen inside the strike zone while the rest should have been called as balls. The top panel of Table 1 highlights the frequency of erroneous calls. Among all actual strikes and all actual balls thrown, umpires made inaccurate calls at a rate of 9.12% and 14.43%, respectively. In this paper, I measure umpire home bias as whether these inaccurate calls disproportionately favored the home team over the away team.

Percentage of called strikes and balls.

Percentage of actual strikes and balls.
Umpire Pitch Calls and Pitch Errors—Home and Away Batters.
Why might umpires favor the home team over the away team? On one hand, umpire performances are subject to reviews from the league that employs them. Starting from 2001, MLB has employed strike zone monitoring technology (QuesTec) to objectively evaluate pitch locations and pitch calls. More scrutiny from the league should reduce the incentive for umpiring bias if umpires are rewarded and punished according to their performance; however, MLB rarely imposes severe punishments for underperforming umpires (Bradbury, 2019). On the other hand, MLB games are often attended by a predominantly one-sided audience. The fans may increase the social pressure faced by the umpires, causing them to award more favorable calls to the home team (Endrich & Gesche, 2020). Thus, in the absence of punishment mechanisms, umpires may internalize the social pressure from the crowds and make calls disproportionately benefitting home teams (Garicano et al., 2005). Evaluating which of the monitoring forces is stronger (the league or the home crowds) is an empirical question that this paper attempts to answer.
To evaluate umpire home bias, pitch-level data for every pitch called in every MLB game from the 2010–2019 seasons were utilized. The findings of this paper suggest umpire home bias in MLB exists since home batters received more favorable calls from the umpires relative to away batters. In particular, umpires mistakenly called 0.07 fewer strikes per game against home batters among actual strikes thrown, and called 0.7 more balls per game against home batters among actual balls thrown. The results are robust to the inclusion of stadium and player fixed effects and are not entirely explained by umpiring inconsistencies. Furthermore, the errors favored the home team even more when attendance increased and in high-leverage situations. Interestingly, while umpire experience decreased the overall error rates, it did not reduce the instances of home bias. Umpires with more experience are still more likely to give favorable calls to home batters relative to away batters.
Eliminating the influence of umpiring errors on the outcome of sporting events has been an ongoing debate in sports. On one hand, umpires have been an integral part of such events since the inception of the professional leagues. On the other hand, the erroneous calls may have a significant impact on the game outcome itself. As an example of an effort to remove such influence, all Triple-A Minor League Baseball games starting from the 2023 season are utilizing robot umpires in pitch calls in an attempt to “eliminate the individual and sometimes inconsistent strike zones that vary from umpire to umpire, and with it the possibility that a game can turn on a bad ball/strike call” (Associated Press, 2023, p. 6). The findings in this paper contributes to the debate by providing an estimate on the marginal benefits of removing human umpires from making pitch calls, in particular for the away team. While the results suggest the degree of umpire home bias is relatively modest, they also suggest such bias is exacerbated by forces that may increase the pressure umpires face. As a result, home teams would have a smaller advantage in winning ballgames if human umpires were to be removed from making pitch calls.
This paper contributes to existing studies on umpiring bias by providing supporting evidence in the context of MLB pitch calls, while at the same time addressing the empirical issues in measuring umpire performance. Studies have shown that soccer referees tend to award home teams more stoppage time (Garicano et al., 2005; Rickman & Witt, 2008), more penalty kicks when trailing (Dohmen, 2008), as well as fewer fouls and cards against them (Bryson et al., 2021; Buraimo et al., 2012). Referee home biases have also been found in hockey penalties (Guerette et al., 2021), basketball turnovers (Price et al., 2012), and boxing points (Balmer et al., 2005). 4 The main departure of this paper is the empirical strategy utilized. In this paper, I focus on call accuracy to measure umpiring bias rather than the call instances used in most of the existing studies. The strategy is similar to that of Gong (2022), who used the accuracy of foul calls for National Basketball Association (NBA) games before and during the COVID-19 epidemic to test whether referee biases for home team are weakened by the absence of crowds.
This paper is a part of a small but growing group of studies that use baseball to study human behavior. As noted in Parsons et al. (2011) and Bradbury (2019), the advantages of using baseball data include the sheer number of observations available, a well-defined and accurate measure of incentives, and a clear distinction between the agents responsible for a decision. Studies using data from MLB have found evidence of discrimination in performance evaluations (Kim & King, 2014; Parsons et al., 2011), on the effects of monitoring on shirking (Bradbury, 2019; Mills, 2017b), on the impact of temperature on labor productivity (Fesselmeyer, 2021), and on the relationship between performance evaluation quality and evaluator's productivity (Mills, 2017a). The findings in this paper complement these studies by identifying the extent of umpiring preference for home batters. To my best knowledge, this paper is among the first to estimate such bias in professional baseball.
The structure of this paper is as follows: the second section describes the data, the third section outlines the methodology, the fourth section reports and discusses the results, and fifth section concludes.
Data
The main data in this paper comes from Skillalytics, which collects pitch-by-pitch data from MLB Statcast (Gilliland, 2022). Statcast has tracked the location of every pitch, known as the X-coordinate (horizontal location) and the Z-coordinate (vertical location) in the MLB games, as well as the coordinates for the top and the bottom of the strike zone for each batter. Each pitch can be identified as an actual strike or an actual ball by combining the pitch location with the strike zone coordinates. Pitch types (e.g., slider, fastball), pitch characteristics (such as velocity and spin rates), and pitch outcomes (e.g., called pitches or ball in play) are also recorded in the data. The dataset also contains information regarding the pitcher-batter matchup for each pitch. From the same dataset, I obtained the ball and strike counts before the pitch, names of the pitcher and the batter as well as their pitching/batting hands, the home and away teams, as well as the date and time of each game. Finally, I merged the pitch-by-pitch data with a game-level dataset, Baseballr, that contains information on the inning and the score for both teams for every pitch (Petti & Gilani, 2022). Baseballr also obtains its information from MLB Statcast regarding game-level information.
Skillalytics, as well as the MLB Statcast data that it utilizes, are suitable to address the topic under investigation for a few reasons. First, Skillalytics contains the exact location of each pitch as it enters the home plate, as well as the strike zone for every at-bat. This allows each pitch to be identified as an actual strike that enters the strike zone, or an actual ball that does not. Second, the actual pitch call for every pitch is recorded. This allows umpiring performance to be observed, as the pitch call can be compared with the actual pitch location. Finally, every pitch in every MLB game is recorded in the dataset. The sheer volume of the data (more than 7.3 million pitches thrown and more than 3.7 million pitches called in the 2010–2019 seasons) reduces the possibility that any observed preferences in pitch calls are driven by statistical outliers.
I focus on the pitches where umpires needed to make a pitch call, calling the pitch as either a strike or a ball. 5 Comparing the pitch call with the actual pitch location, a call can be either: (a) an actual strike correctly called as a strike, (b) an actual strike incorrectly called as a ball, (c) an actual ball correctly called as a ball, or (d) an actual ball incorrectly called as a strike. While both Scenarios (b) and (d) represent erroneous calls, Scenario (b) would benefit the batter at the expense of the pitcher, and Scenario (d) would benefit the pitcher at the expense of the batter.
Table 1 reports the frequency of pitch call errors for both away and home at-bats. Among all called pitches, there were about 0.91 million pitches thrown that were actual strikes and 2.86 million that were actual balls from the 2010–2019 seasons. Among the actual strikes, umpires called 90.88% of pitches correctly as strikes and incorrectly called 9.12% of them as balls. Umpires were less accurate with their calls on actual balls, with only 85.57% of them called correctly as balls and 14.43% of them incorrectly called as strikes. The splits for home versus away batters were consistent with umpire home bias. Umpires incorrectly called 9.21%of actual strikes as balls for home batters and only 9.04% for away batters, which benefitted home batters at the expense of away pitchers. Similarly, the erroneous calls for actual balls thrown also disproportionately benefited home batters. Among these pitches, umpires incorrectly called 14.68% of them as strikes for away batters while they incorrectly called only 14.18% for home batters.
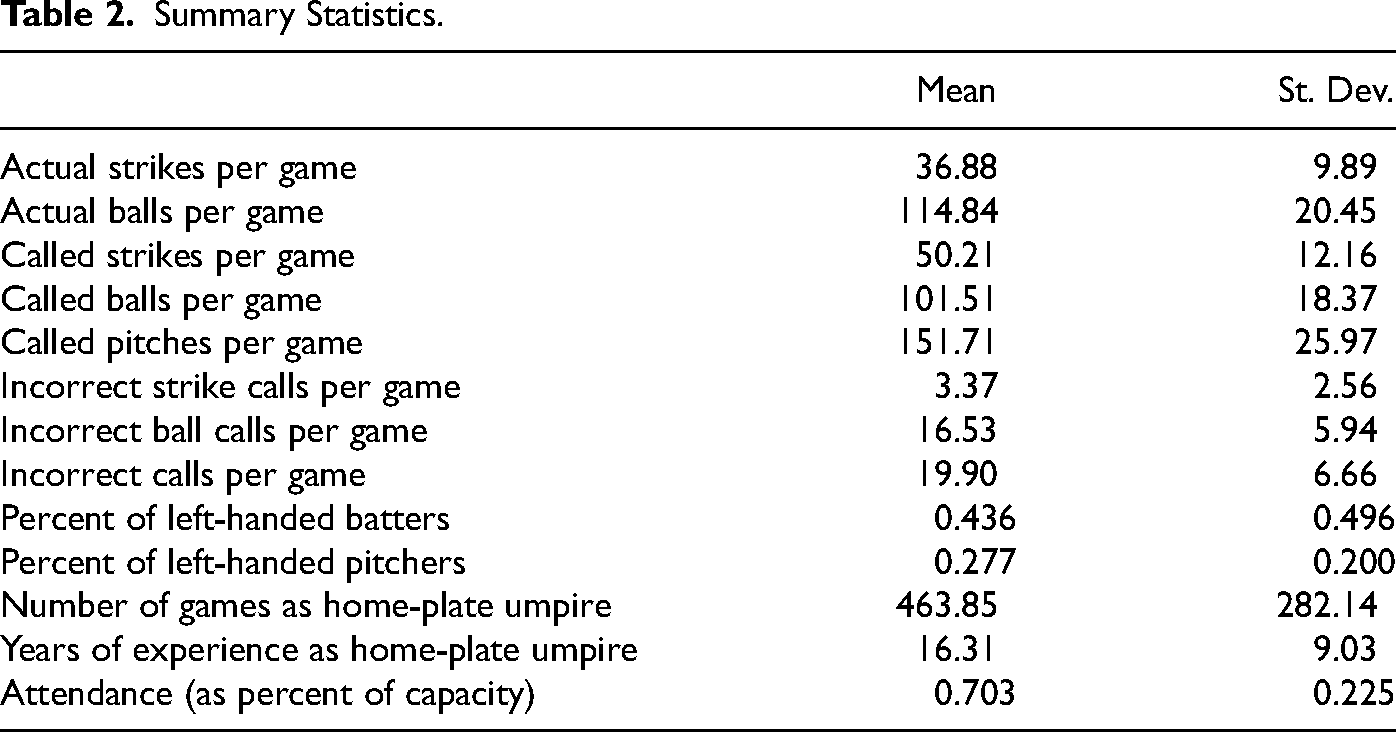
Game-level data is obtained from Retrosheet, which collects information from MLB box scores for each game. There are a total of more than 24,600 games in the pitch-by-pitch data. Of all these games, attendance figures and name of home-plate umpire are available for more than 99% of the games. Umpire-level data, including the years served as MLB umpire and the number of games as home-plate umpire in each year, is also obtained from Retrosheet. Table 2 presents the summary statistics of pitches called per game as well as other control variables. There were about 152 pitches called per game on average, with about 37 of the pitches as actual strikes and 115 of the pitches as actual balls. Umpires called 50 strikes and 102 balls per game, with an average of 19.9 erroneous calls per game. Left-handed batters accounted for 43.6% of all called pitches, while left-handed pitchers accounted for 27.7% of all called pitches. Umpires on average had 16 years of experience and about 464 games of experience as home-plate umpire. Finally, among all the games in the sample, fan attendance was at 70.3% of stadium capacity on average.
Summary Statistics.
Methodology
To measure whether umpires perform differently between home and away batters, I begin with the following specification:
The main coefficient of interest, β1, can be interpreted as umpire productivity against home batters relative to away batters (e.g., Lopez & Mills, 2019), since the strike zones can be accurately defined for each batter. A positive β1 implies umpires perform better when home batters are at the plate, since the pitch calls are more accurate against home batters relative to away batters. However, different types of call errors may benefit either the home batters (at the expense of away pitchers) or the away batters (at the expense of home pitchers). Therefore, umpiring performance differences do not necessarily imply umpiring biasedness.
To test whether the errors benefit one team over the other, I first divide the called pitches into two subsamples: actual strikes thrown and actual balls thrown. Then, for each subsample, I test whether the erroneous calls favor home batters over away batters, following the same specification as Equation (1):

In both equations, the direction of the β1 coefficient determines whether the inaccurate calls systematically favor home batters over away batters. If umpires are more accurate in calling actual balls as balls for home batters, the coefficient for β1 in Equation (2) will be positive, and the inaccurate ball calls will favor home batters over away batters. On the other hand, if umpires are calling fewer actual strikes as strikes for home batters, which implies a negative β1 in Equation (3), the inaccuracy in strike calls also will favor home batters.
The underlying assumptions behind the methodology are that (a) an unbiased umpire will adopt the official definition of a strike zone to make pitch calls and (b) an unbiased umpire will on average perform similarly against both home and away batters based on the official strike zone. In practice, however, it is difficult to test assumption (a) as the exact strike zone an umpire uses in a game is not directly observable, and thus any observed umpiring preferences may be driven by inconsistent strike zones. Nevertheless, improvements in pitch tracking technology, such as the earlier QuesTec and the later Zone Evaluation systems, would allow the league and its umpires to evaluate umpiring performance and improve on it. 7 On the other hand, while the estimation equations have controlled for pitcher-, batter-, time-, and umpire-specific factors that can affect umpiring performance, there may be other unobserved factors that potentially contributes to performance differences. While both (a) and (b) need to be assumed to interpret the observed preference for home batters as umpire home bias, the results in this paper can at least be interpreted as evidence consistent with the bias. I will also address the inconsistency issue by performing additional robustness checks that focus on borderline pitches and will present the findings in the “Results” section.
If umpire rulings are in favor of home batters, will the bias be affected by social pressure or umpiring experience? I examine two sources of social pressure: the leverage situation in a game, and fan attendance. The leverage situation refers to the importance of ball and strike calls on the win percentage of a game. I consider the following situations where pitch calls are more relevant for game outcomes: the pitch calls on 2-strike or 3-ball counts, where the next strike or ball call will potentially end the at bat, and the calls in tied or 1-run games at 7th inning and after, where each additional out or man on base will have a greater impact on win percentages. Fan attendance refers to the number of paid attendances as a percentage of stadium capacity. Umpiring experience is measured as either the years of home-plate umpiring experience or the number of games the umpire has served as the home-plate umpire.
To test whether these factors contribute to umpire home bias, I include an interaction term between these variables and the home batter dummy in the following specifications: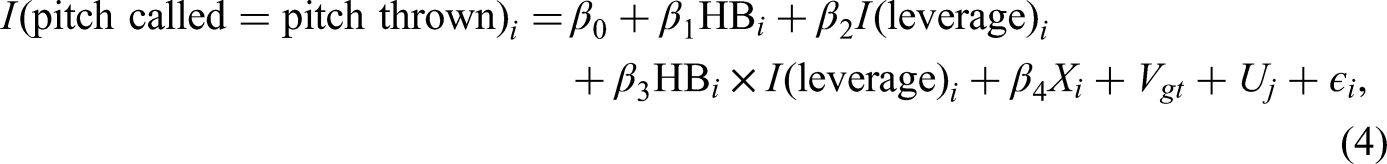


Results and Discussion
Main Results
Table 3 shows the main results on whether home bias exists in MLB umpires’ calls. The estimates from the linear probability model are presented in columns (1) and (2). Column (1) suggests that umpires on average called fewer actual strikes as strikes for home batters than for away batters, which is more favorable for the former. Compared with away batters, home batters were 0.19 percentage points less likely to receive an erroneous call from the umpire. In terms of pitches, home batters on average received 0.07 fewer correctly called strikes per game. The evidence in column (2) also favors home batters. Compared with away batters, home batters received 0.61 percentage points more ball calls, or about 0.7 actual balls being correctly called as balls. Columns (3) and (4) report the results from the probit model, and the marginal effects from probit model are presented in Table 4. The marginal effects suggest that umpires on average called 0.18 percentage points fewer actual strikes as strikes and 0.61 percentage points more actual balls as balls against home batters, as compared with away batters. The magnitude of the effects is comparable with the linear probability estimates. Among the control variables, both the pitching and batting stances and the ball and strike counts have statistically significant associations with call accuracy, whereas the pitch types (not reported) do not.
Umpire Home Bias: Baseline Estimates.
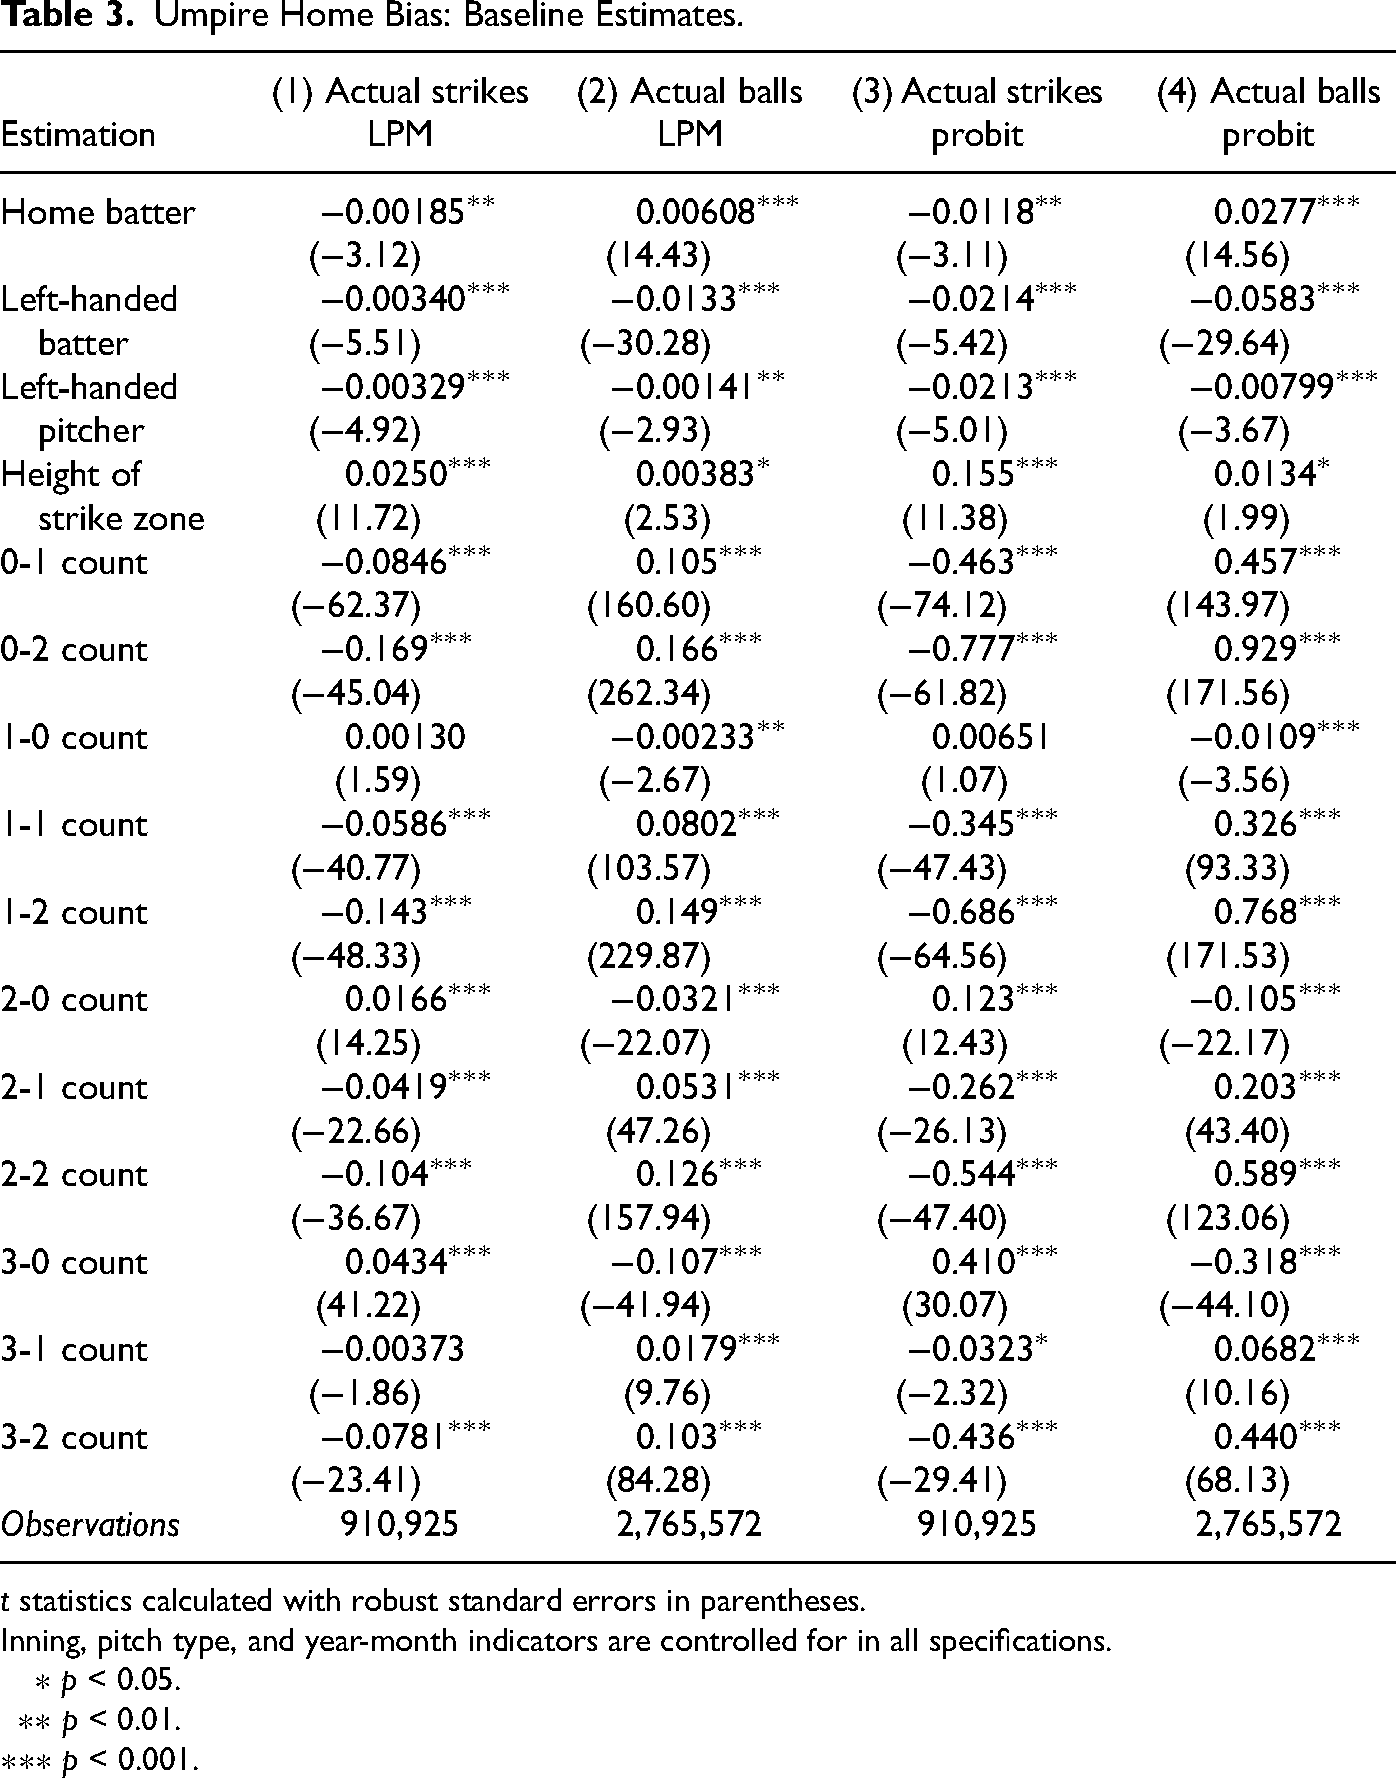
t statistics calculated with robust standard errors in parentheses.
Inning, pitch type, and year-month indicators are controlled for in all specifications.
∗ p < 0.05.
∗∗ p < 0.01.
∗∗∗ p < 0.001.
Umpire Home Bias: Marginal Effects From Probit Estimates.
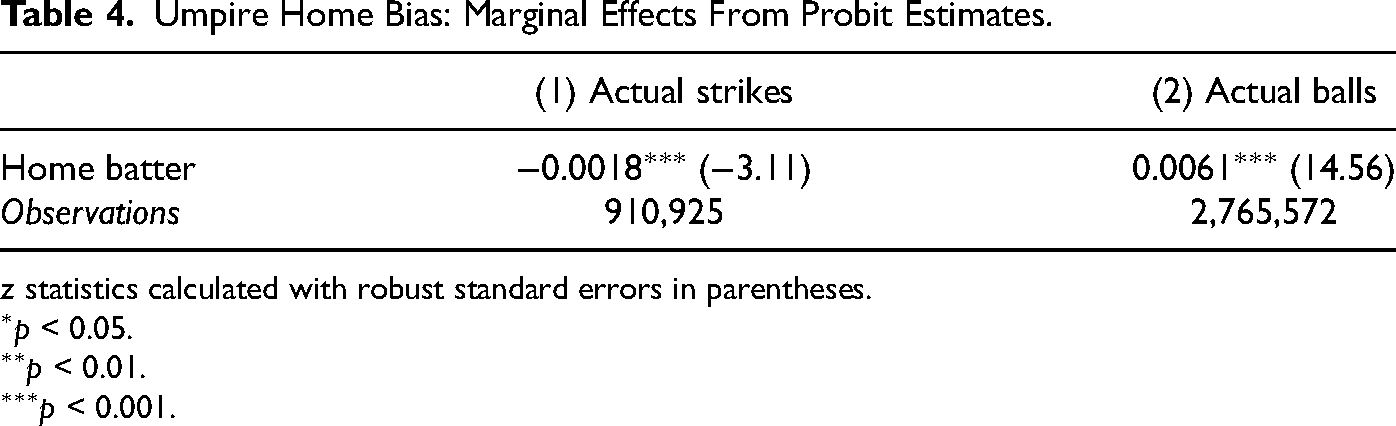
z statistics calculated with robust standard errors in parentheses.
p < 0.05.
p < 0.01.
p < 0.001.
I also consider additional confounding factors potentially affecting umpiring accuracy. First, I address the possibility that the dimension of sporting venues, namely, the physical distance between the field and the stands can affect umpiring decisions (Buraimo et al., 2012; Dawson & Dobson, 2010). I include a stadium dummy for each MLB stadium as well as any neutral-site venue that hosted MLB games. Second, I address the possibility of the “Matthew effect” where player status affects umpiring decisions (Kim & King, 2014). I control for the effect by including pitcher and batter dummies. Table 5 presents the linear probability model estimation results with additional fixed effects included. 8 The results suggest umpire home bias is not entirely explained by stadium dimensions or Matthew effects, since the coefficients in the table appear to have the same signs as the ones from the main results.
Umpire Home Bias: Including Other Fixed Effects.
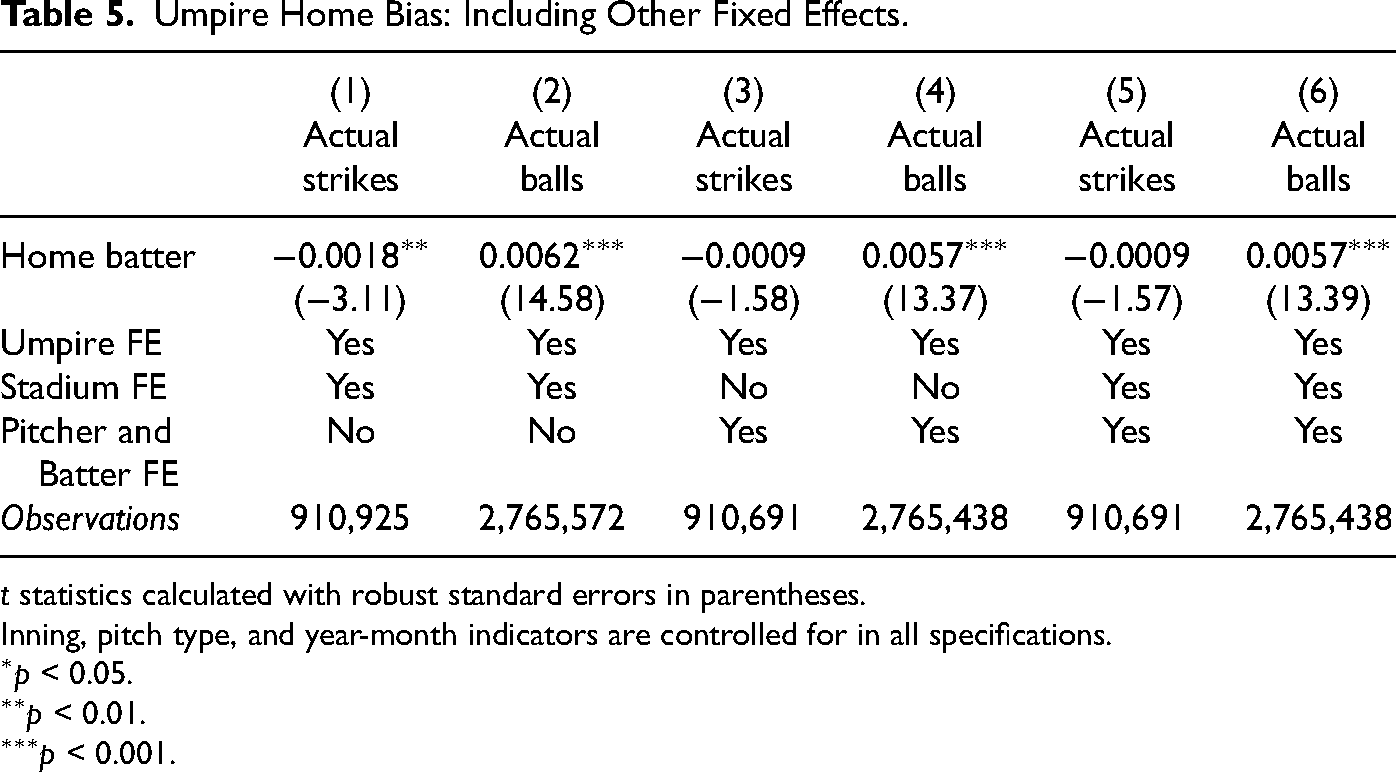
t statistics calculated with robust standard errors in parentheses.
Inning, pitch type, and year-month indicators are controlled for in all specifications.
p < 0.05.
p < 0.01.
p < 0.001.
Next, I evaluate whether high-leverage situations affect umpire calls. Table 6 looks at situations when the next pitch may potentially result in a strike out or a walk, and when the scores are close in late innings, defined as tied or 1-run games in the 7th inning and afterwards. Columns (1) and (2) suggest that in high-leverage counts (2-strike or 3-ball counts), umpires are less accurate in their strike calls and more accurate in their ball calls. The interaction terms suggest high-leverage counts have a mixed effect on umpire home bias. While home batters would receive even fewer strike calls that favored them, they would receive slightly fewer ball calls that benefitted them as well. On the other hand, the evidence from high-leverage at-bats is consistent with umpire home bias. Columns (3) and (4) suggest that home batters were more likely to receive favorable ball calls in high-leverage at-bats, which would have worked in their favor, and while they were less likely to receive unfavorable strike calls than away batters, the difference is not statistically significant.
Umpire Home Bias in High-Leverage Situations.
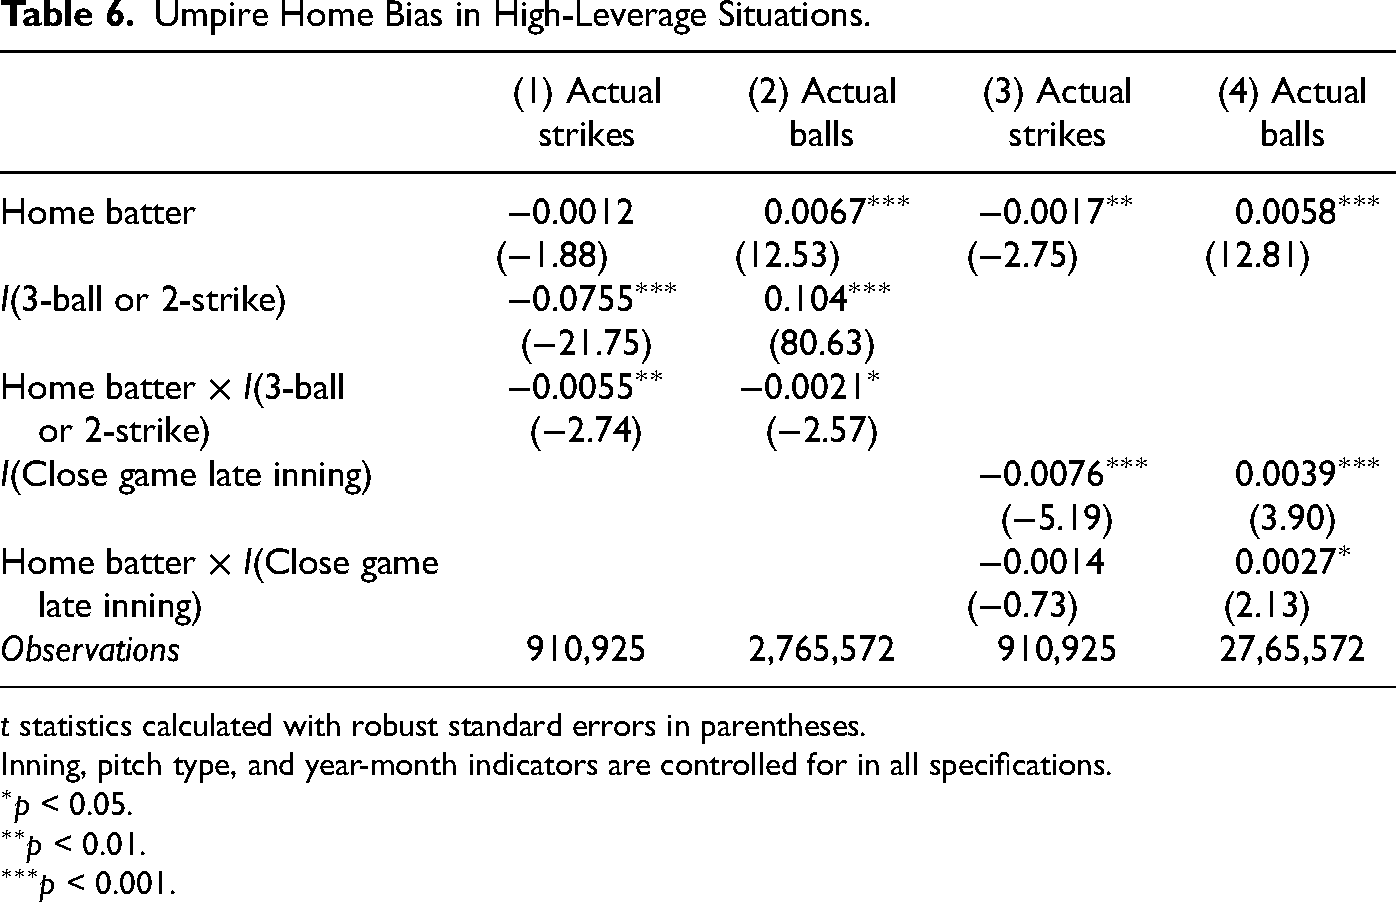
t statistics calculated with robust standard errors in parentheses.
Inning, pitch type, and year-month indicators are controlled for in all specifications.
p < 0.05.
p < 0.01.
p < 0.001.
Finally, I examine the role of attendance and umpire experience on umpire home bias. Table 7 presents the results. As columns (1) and (2) indicate, higher attendance increased the probability that a strike was accurately called but reduced the probability that a ball was accurately called. The interaction terms, however, reaffirm the preference toward home batters. In particular, increase in attendance raised the likelihood for home batters receiving correct ball calls as opposed to away batters. Since home batters on average were already more likely to receive such calls, higher attendance is associated with an increase in umpire home bias. Columns (3) to (6) look at the impact of umpiring experience on umpire home bias. Having more years or games of experience as home-plate umpires is associated with improved accuracy in pitch calls. However, the interaction terms imply home batters’ likelihood of receiving more favorable calls did not decrease with umpiring experience, which suggests umpiring home bias is not significantly related to experience.
Effect of Attendance and Umpire Experience on Umpire Home Bias.
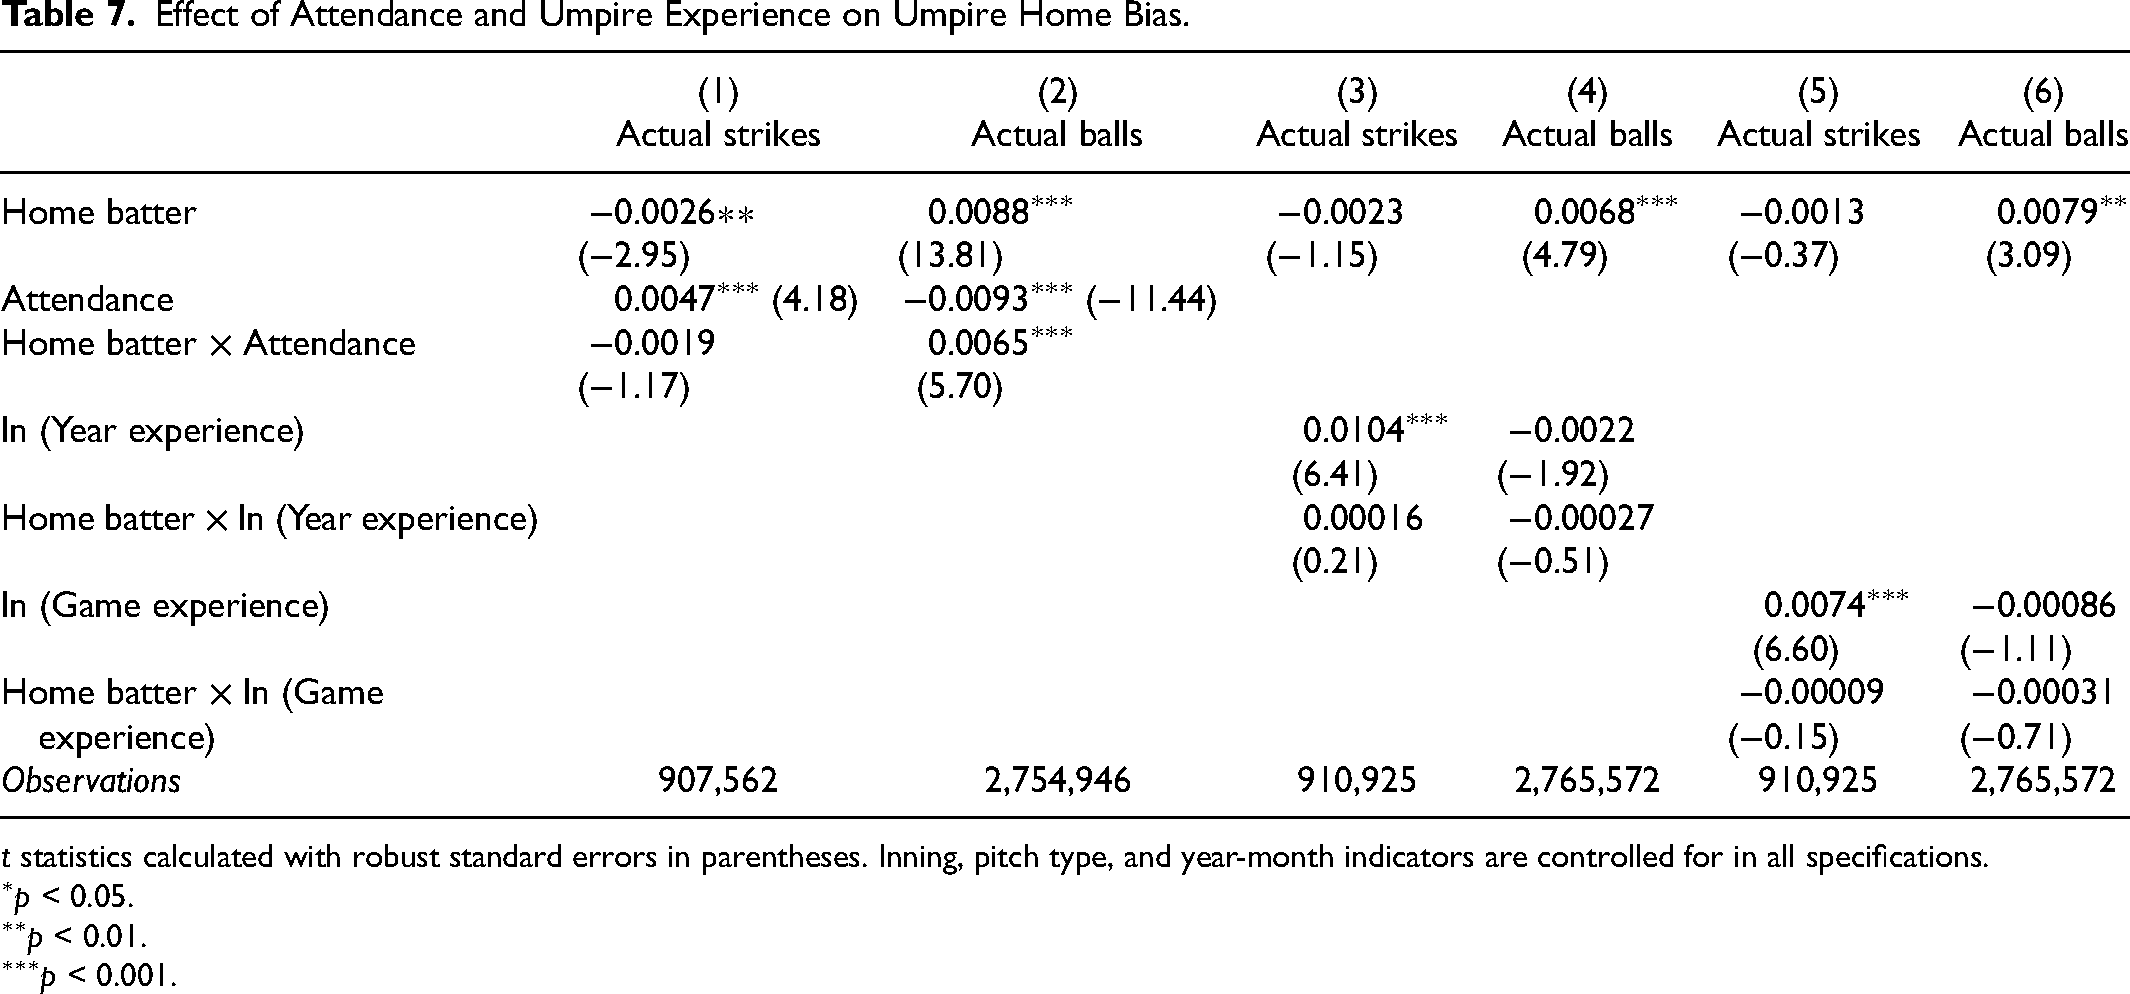
t statistics calculated with robust standard errors in parentheses. Inning, pitch type, and year-month indicators are controlled for in all specifications.
p < 0.05.
p < 0.01.
p < 0.001.
An implicit assumption behind umpire home bias is that an unbiased umpire will call balls and strikes based on the official definition of strike zones, and thus, if umpires do not call the pitches accurately, they are biased in favor of one team over the other. However, umpires may have their own perceptions of strike zones and call the pitches accordingly. This implies the calls that seemingly benefit one team over the other may be driven by umpires being “consistently inconsistent” in their strike zone definitions rather than being biased in their calls. To illustrate this possibility with an example, suppose the lower boundary of an umpire's strike zone is consistently below the lower boundary of the official strike zone (i.e., the umpire is “generous” in calling low pitches as strikes). If away batters face more of these low pitches than home batters, the umpire will incorrectly call too many actual balls as strikes according to the official strike zone, even though his calls are consistent with his definition of the strike zone.
While an umpire's perceived strike zone is not directly observable to outsiders, an unbiased umpire should still make the same call for all pitches that enter the plate in the same coordinates. Therefore, as long as the average pitch locations faced by home and away batters are identical, strike zone inconsistency should not affect the likelihood of receiving the correct call against either batter. Table 8 shows the average X- (width) and Z- (height) coordinates of pitches faced by home and away batters. For each of the strike zone areas 1 to 9 and ball zone areas 11 to 14, 9 the average X- and Z-coordinates of the pitches faced by home and away batters were nearly identical. There is not enough evidence suggesting the average pitch location faced by either batter is different.
Pitch Coordinates: Home Vs. Away Batters.
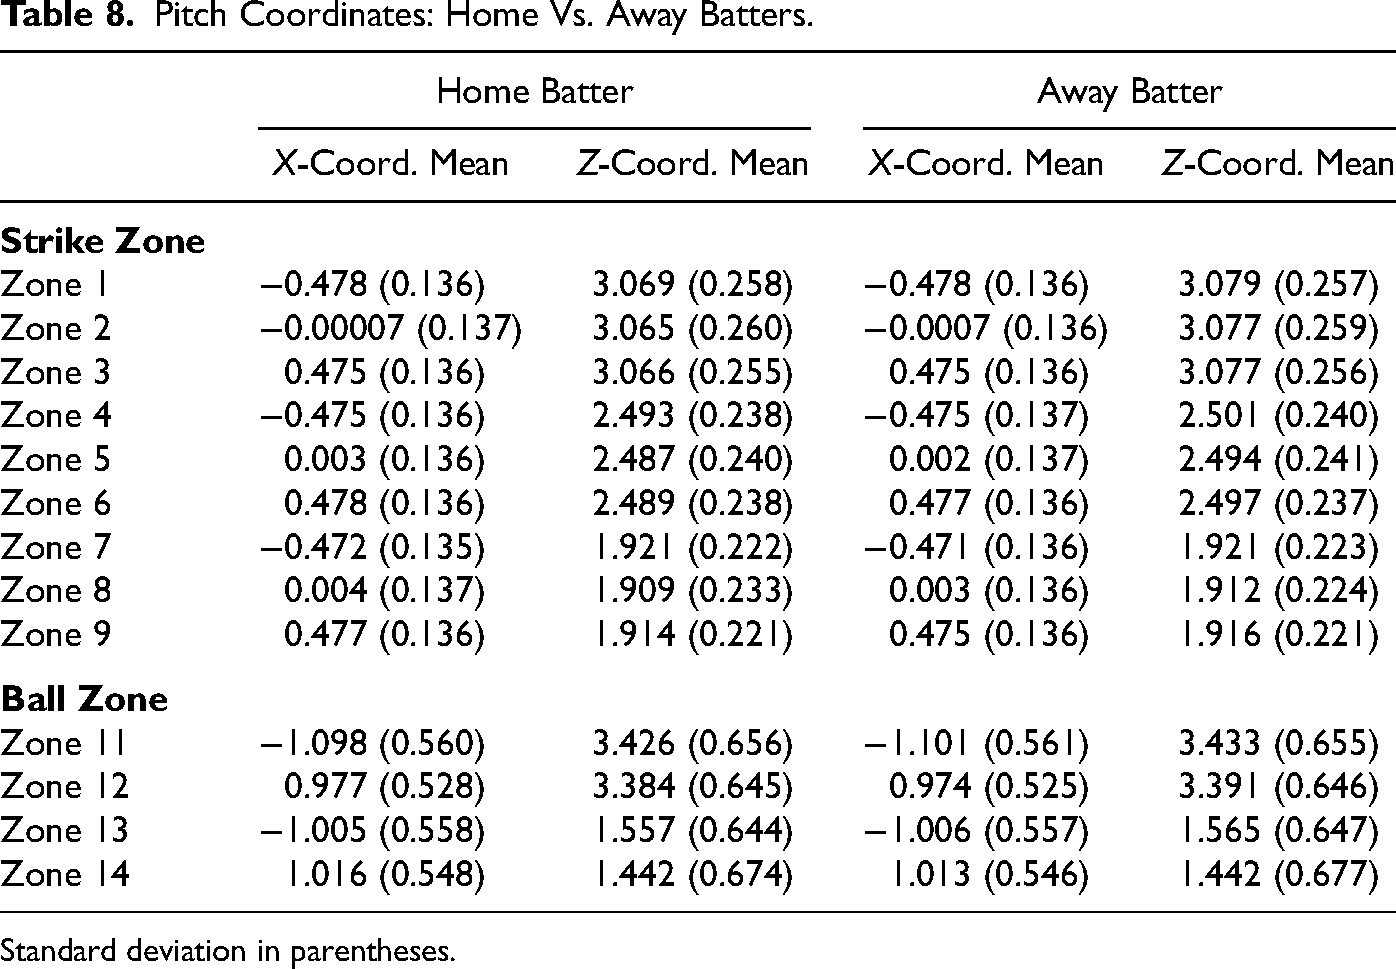
Standard deviation in parentheses.
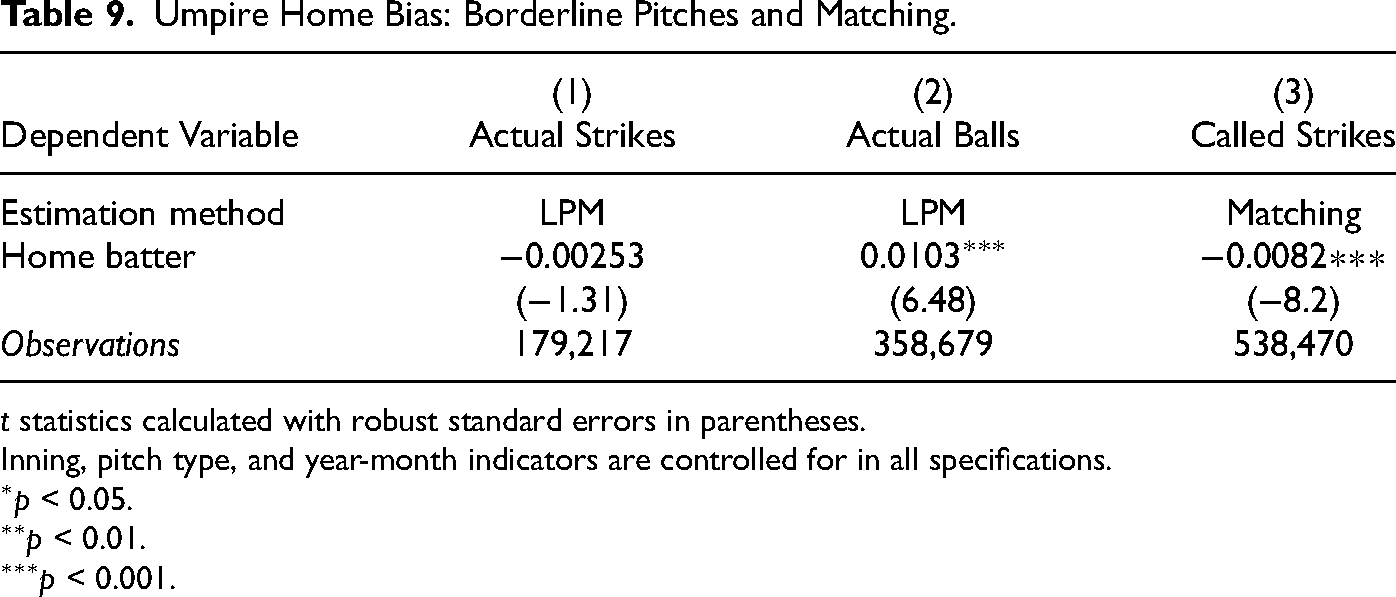
Nonetheless, I perform two additional tests to ensure the results are not entirely driven by umpiring inconsistency. First, I limit the sample to borderline pitches, defined as pitches that enter the plate within 1 inch of the official strike zone boundaries, and re-run the main regressions to check if the results are still robust. In the second test, I apply nearest-neighbor matching technique among the borderline pitches. Matching is a statistical technique that compares the means of the two groups (treatment group that receives a program, versus control group that doesn’t), assuming in a randomized experiment that individual characteristics will on average be the same between the two groups. In the context of this paper, nearest-neighbor matching implies comparing the pitch calls of actual pitches that share similar X- and Z- coordinates. 10 If, relative to away batters, home batters received more favorable calls on average for pitches with similar coordinates, the evidence is consistent with umpire home bias. The main assumption behind both tests is that umpires should be giving the same call to similar pitches regardless of whether their perceived strike zones are identical to the official strike zone. For the matching test, the sample is also limited to borderline pitches.
Table 9 presents the results from both tests. As columns (1) and (2) suggest, limiting the sample to borderline pitches reduces the observations to around 180,000 actual strikes and 360,000 actual balls. However, home batters were still more likely to receive favorable calls from the umpires. The coefficients suggest home batters received fewer strike calls among actual strikes and more ball calls among actual balls. Column (3) presents the nearest-neighbor matching result. Among the borderline pitches that were closest to each other, home batters on average received 0.8 percentage points fewer strike calls than away batters. Such difference gave home batters an advantage over away batters. In sum, the results remain consistent with umpire home bias and suggest strike zone inconsistency does not entirely explain the observed bias.
Umpire Home Bias: Borderline Pitches and Matching.
t statistics calculated with robust standard errors in parentheses.
Inning, pitch type, and year-month indicators are controlled for in all specifications.
p < 0.05.
p < 0.01.
p < 0.001.
Discussion
The findings of umpire home bias are consistent with the referee bias observed in soccer and other sports as summarized in Dohmen and Sauermann (2016). On the other hand, it is somewhat surprising that umpire home bias still exists even in an environment where relatively objective measures of umpire performances exist and therefore umpiring biasedness can be relatively easier to identify. Furthermore, while monitoring technologies such as QuesTec have been shown to improve umpiring performances by providing feedback to umpires (Mills, 2017b), the evidence in this paper suggests improved performance does not necessarily translate into reduced biasedness. Monitoring technologies were implemented throughout MLB during the sample period, yet the result suggests there is still a modest, yet statistically significant, umpiring preference in favor of the home team.
The existence of evaluation bias suggests that the employers of evaluators may need to provide extra incentives, whether they be performance bonus or punishment, to increase evaluators’ efforts in reducing bias. It also justifies a deeper understanding of the potential factors driving evaluation bias. The impact of leverage or fan attendance on call accuracy has been well-documented in Archsmith et al. (2021) and Smith and Groetzinger (2010). The results in this paper suggest fan attendance had the strongest impact on umpiring biasedness among all the potential factors. This is consistent with the social pressure hypothesis, where a one-sided fanbase pressures the umpire to award more favorable calls toward the home team.
On the other hand, the impact of umpiring experience on call accuracy is somewhat ambiguous in theory. Human capital accumulation theory such as Mincer (1974) has suggested productivity of umpires should be positively related to umpiring experience, and therefore umpires should be less affected by home crowds in their decisions. However, older and more experienced umpires may also develop longer-run relationships with the teams they referee, which may result in a systematic biasedness favoring these teams (Hlasny & Kolaric, 2017). While the results suggest umpire performance improves with experience, which is consistent with the human capital accumulation channel, there is not enough evidence to suggest umpiring biasedness is reduced with experience.
Several policy implications can be made from the results. First, an improvement in evaluator performance does not necessarily reduce evaluation bias. The results in this paper suggest the degrees of home biasedness between experienced and inexperienced umpires are similar. This implies the same factors that may pressure inexperienced umpires to make favorable calls for home teams may still affect experienced umpires. Therefore, instead of relying on experience, evaluators will need to recognize the sources of bias and eliminate their impact to reduce evaluation biases. Second, to reduce evaluation bias, there needs to be an unbiased party to monitor the evaluators. When the monitors themselves are biased, such as the presence of one-sided attendees in a baseball game, it will exacerbate any evaluation bias.
Conclusion
Evaluators are crucial in assessing worker productivity. It is therefore important to ensure evaluators are unbiased in their evaluations. However, assessing the performance of evaluators can be challenging. In this paper, I provide some evidence regarding evaluators’ biasedness and potential explanations for it with using umpiring data from MLB. The results are consistent with umpiring home bias, as the call errors disproportionately favored home batters over away batters. Social pressure that increased the punishment from making unfavorable calls also contributed to the home bias. Umpires were less likely to make unfavorable mistakes against home batters when games were well attended. Furthermore, home bias did not disappear with more experience. Umpires with more home-plate umpiring experience had similar rates of home biasedness as umpires with less experience.
There are a few possible directions for future research. First, given that the leagues stand to benefit from unbiased evaluators, it is also important to evaluate whether the effects of any productivity-increasing policies also reduce evaluation bias. As the results of this study indicate, improvements in evaluation productivity do not always guarantee a reduction in evaluation bias. Second, the results also warrant a deeper investigation into the implicit reasons behind the bias. As the famous example in Price and Wolfers (2010) showed, once NBA referees became aware of the racial bias in foul calls, they no longer displayed any preferences in their subsequent calls. Understanding the reasons behind home bias and providing incentives to reduce it could help mitigate the principal-agent problem in umpiring.
Footnotes
Declaration of Conflicting Interests
The author declared no potential conflicts of interest with respect to the research, authorship, and/or publication of this article.
Funding
The author received no financial support for the research, authorship, and/or publication of this article.