
Abstract
No, it was not. We do not find evidence that the COVID-19 pandemic affected the distribution of medals in a systematic way. Countries that suffered a higher share of deaths due to the pandemic, or that imposed stricter lockdowns, performed just as prior performances and standard economic and demographic variables alone would have predicted. Hence, while COVID-19 has surely affected the performance of some individual athletes, it did not have a perceptible effect on the distribution of medals across countries. The only impact of the pandemic on the outcome of the Games was to reduce the advantage that host countries traditionally have. This effect, probably caused by the lack of local spectators in most competitions, was particularly strong for teams’ events, where the “host effect” vanished.
Introduction
In the months before the 2020 Summer Tokyo (postponed to 2021) and the 2022 Winter Beijing Games, numerous anecdotal accounts circulated in the press about athletes who could not prepare themselves appropriately because of COVID-19. 1 Indeed, some athletes were not allowed to participate because they contracted the virus just before the Games started; others could participate, but were affected by long-Covid symptoms. Furthermore, some athletes who never got the virus were also affected because they could not practice properly or participate in pre-Olympic competitions due to lockdown restrictions. In this paper, we provide a systematic analysis of whether the COVID-19 pandemic affected the aggregate performance of countries in those games.
Despite the presumption of a negative effect of the pandemic on athletes’ performance, the Olympics is a zero-sum game, which means some athletes’ or countries’ loss would become others’ gain. But did the countries most affected by COVID-19 perform worse than expected, benefiting countries where the consequences of the pandemic were lighter? We find that neither country-level direct measures of COVID-19 incidence nor proxies for lockdown stringency are systematically associated with less Olympic success. We investigate how countries’ COVID-19 incidence, proxied by a COVID-19 death ratio and countries’ lockdown stringency, affect country-level medal shares (top 3 and top 8 shares). Our results show that COVID-19 was not a game changer for the 2020 Tokyo and 2022 Beijing Games. COVID-19 incidence and lockdown stringency have no statistically significant impact on medal shares at the aggregate level or in the subcategories for individual, team, indoor, or outdoor games.
We do find, however, an impact on the host advantage during the Olympics. Historically, the country hosting the Games wins considerably more medals than predicted by standard economic and demographic variables. However, for the two Olympic Games during COVID-19, the host effect becomes significantly weaker. This happened primarily in teams’ events, for which the host effect virtually vanished, but is also observed in individual events. Presumably, this reflects the lack of local supporters, since most competitions happened either without any audience or with very restricted attendance.
Literature
The COVID-19 pandemic has generated a large body of research studying its various effects. Here we discuss the limited number of studies on the impact of COVID-19 on sports performance. See Singleton et al. (2022) and Szymanski (2003) for a review of the literature on commercial sports through the lens of economic theory.
Proxying productivity by the number of passes of a football player, Fischer et al. (2021) find that COVID-19 infection leads to a 6% temporary productivity drop and to a 5% drop after half a year. Even if the individual effects that they identify are also present in our context in some form, they may be too small to affect the distribution of medals at the country level.
Our paper is intrinsically connected to the literature that seeks to explain countries’ performance in Olympic Games. Existing studies have investigated the factors behind Olympic performance at the country level. Lowen et al. (2016) find that women’s empowerment campaign enhances a country’s female participation in Olympic Games. Noland and Stahler (2017) find that host advantage is more significant in judged contests, while country size and gross domestic product (GDP) per capita have smaller impacts on Olympic performance over time. Rewilak (2021), using data for Summer Olympic Games during 1996–2016, also finds evidence for a host advantage effect. Potts (2022) finds that athletes’ respect of rules and a lower corruption level lead to smaller numbers of disqualifications in Olympic Games. At the athlete level, Greenleaf et al. (2001), based on the interviews with past Olympians, identify the departure from normal routine as the most important factor that negatively affected their performance.
Among Olympic studies, a prominent example is Bernard and Busse (2004), who consider the role of population and economic resources in determining medal totals from 1960 to 1996 Summer Olympics Games. They show that both a large population and high per capita GDP generate high medal totals, and being the host country is a medal booster. We build on their setup to examine how COVID-related variables affected countries’ performance once we control for those factors. We depart from their approach by (a) considering both Summer and Winter Games; and (b) by considering only Games since 1992, to avoid dealing with the classification complications caused by transition economies before 1992.
On how COVID-19 affected the home advantage and host effect, two papers obtained results related to ours using data from soccer matches. Cueva (2020) finds that the home advantage is halved during pandemic and that referee bias against away teams disappears during lockdown. Bryson et al. (2021) find negative effects on the number of yellow cards issued to away teams. Considering indoor basketball games, De Angelis and Reade (2023) also find a smaller home advantage during the pandemic. We find that their results extend to the aggregate of sports included in Olympic Games.
Data
This section briefly describes the data sources and variable definitions. Please refer to Appendix I for details.
Based on data from the Olympic Games official website, we construct the following Olympic performance measures by country: the top 3 medal share (gold, silver, and bronze) and the top 8 share for each Olympic event. In our baseline regressions, we count the number of medals at the country level, assigning an equal weight to all medals. We use the share measure, instead of medal count, because it is not sensitive to the changing number of total medals over time. We include only countries that sent out at least one athlete to that specific Olympic Game. We use data since 1992, so we do not have the Soviet or planned economy dummies in the analysis. We explain in Appendix II how we deal with some of the complications related to the breakup or consolidation of countries, and so on.
Our COVID-19 death and lockdown stringency data come from the Oxford COVID database. Following the approach of much of the growing literature on the consequences of the pandemic (see, e.g., Liu et al., 2022), we construct the COVID-19 incidence variable based on the cumulative number of COVID-related deaths divided by population. The lockdown stringency index covers nine subindexes, including four lockdown measures (Shutdown) and another four mobility restriction measures (RestMob), as well as a measure for public information campaigns. We use either the combined index or split it into two subindexes (Shutdown and RestMob).
We consider both “long” and “short” definitions of COVID-19 cumulative incidence and lockdown stringency. The former considers the period from the onset of the pandemic until just before the Games started; the latter considers the 6 months before the Games. The original COVID data from the Oxford Covid database are at a daily frequency. We aggregate them to the monthly level by taking the average of the daily COVID variables over the relevant period of time (short period or long period).
Empirical Strategy
Our data is a panel by country over time, so a natural choice for our empirical strategy is a panel data estimation using the following specifications:

The country fixed effects absorb much of the economic, cultural, and demographic factors that do not change or change slowly over time, and are associated with a country’s share of medals. A Hausman test rejects the null, indicating that the random effects estimator is inconsistent. Therefore, we adopt a specification with country fixed effects. 2
Because many participating countries end up with no medals, the dependent variable (
Results
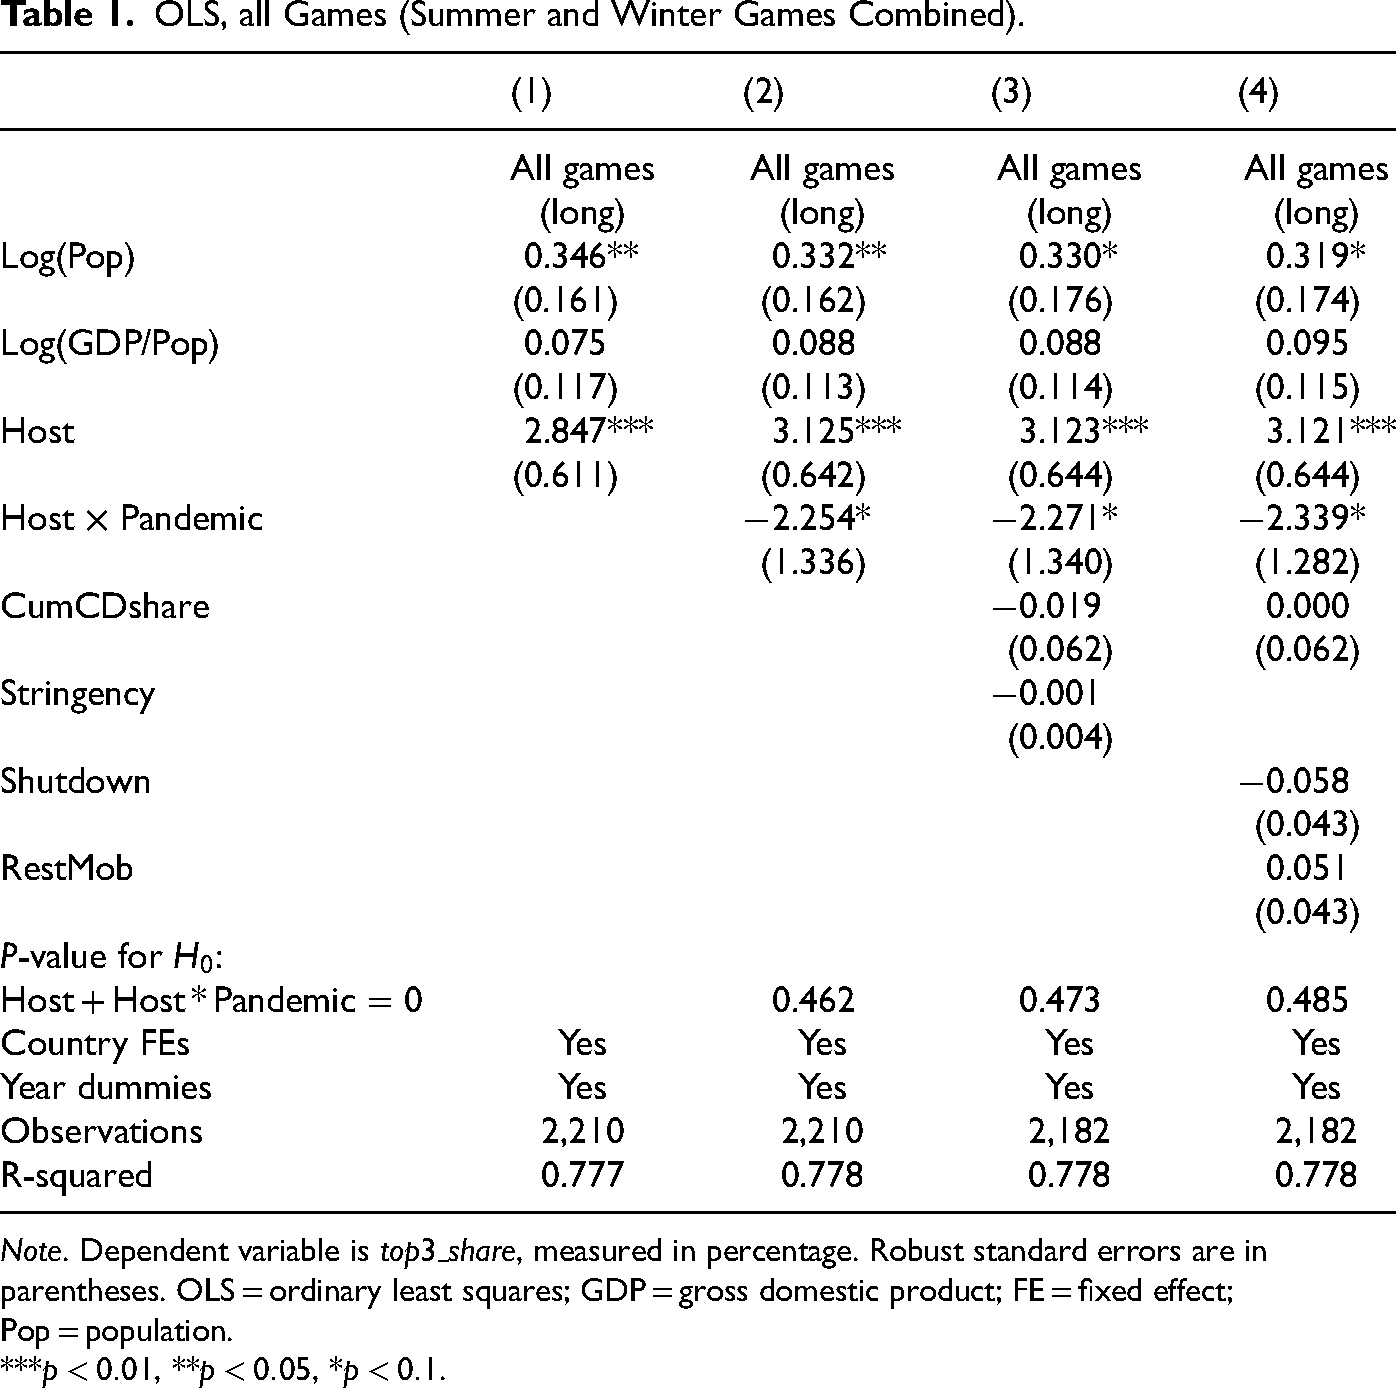
In Table 1, we show our baseline results. Observe, first, that population has the expected positive effect on Olympic performance. The impact of GDP per capita is estimated to be positive but not statistically different from zero, probably due to insufficient variation when we include country fixed effects. Since the effects of those variables are well known, we do not report them in the subsequent tables, although they are included in every regression.
OLS, all Games (Summer and Winter Games Combined).
Note. Dependent variable is
***
The host effect is positive, as usual. However, during the pandemic, its effect is reduced by more than 70%. 3 Presumably, this may be caused by the absence of local fans in the competitions. The p-value reported in the table shows that the host effect during the pandemic is weak and statistically not significant at the 10% level. Interestingly, all COVID-related variables are highly insignificant in the regressions. It is not simply that standard errors are too high to allow for precise inference; the point estimates are very close to 0.
In Table 2, we split the sample between Summer and Winter Games. Columns 1 and 2 are the analogs of columns 3 and 4 of Table 1 for Summer Games, whereas columns 3 and 4 are their analogs for Winter Games. The null results from the baseline analysis are unchanged. In fact, even the
OLS, Summer Versus Winter Games.
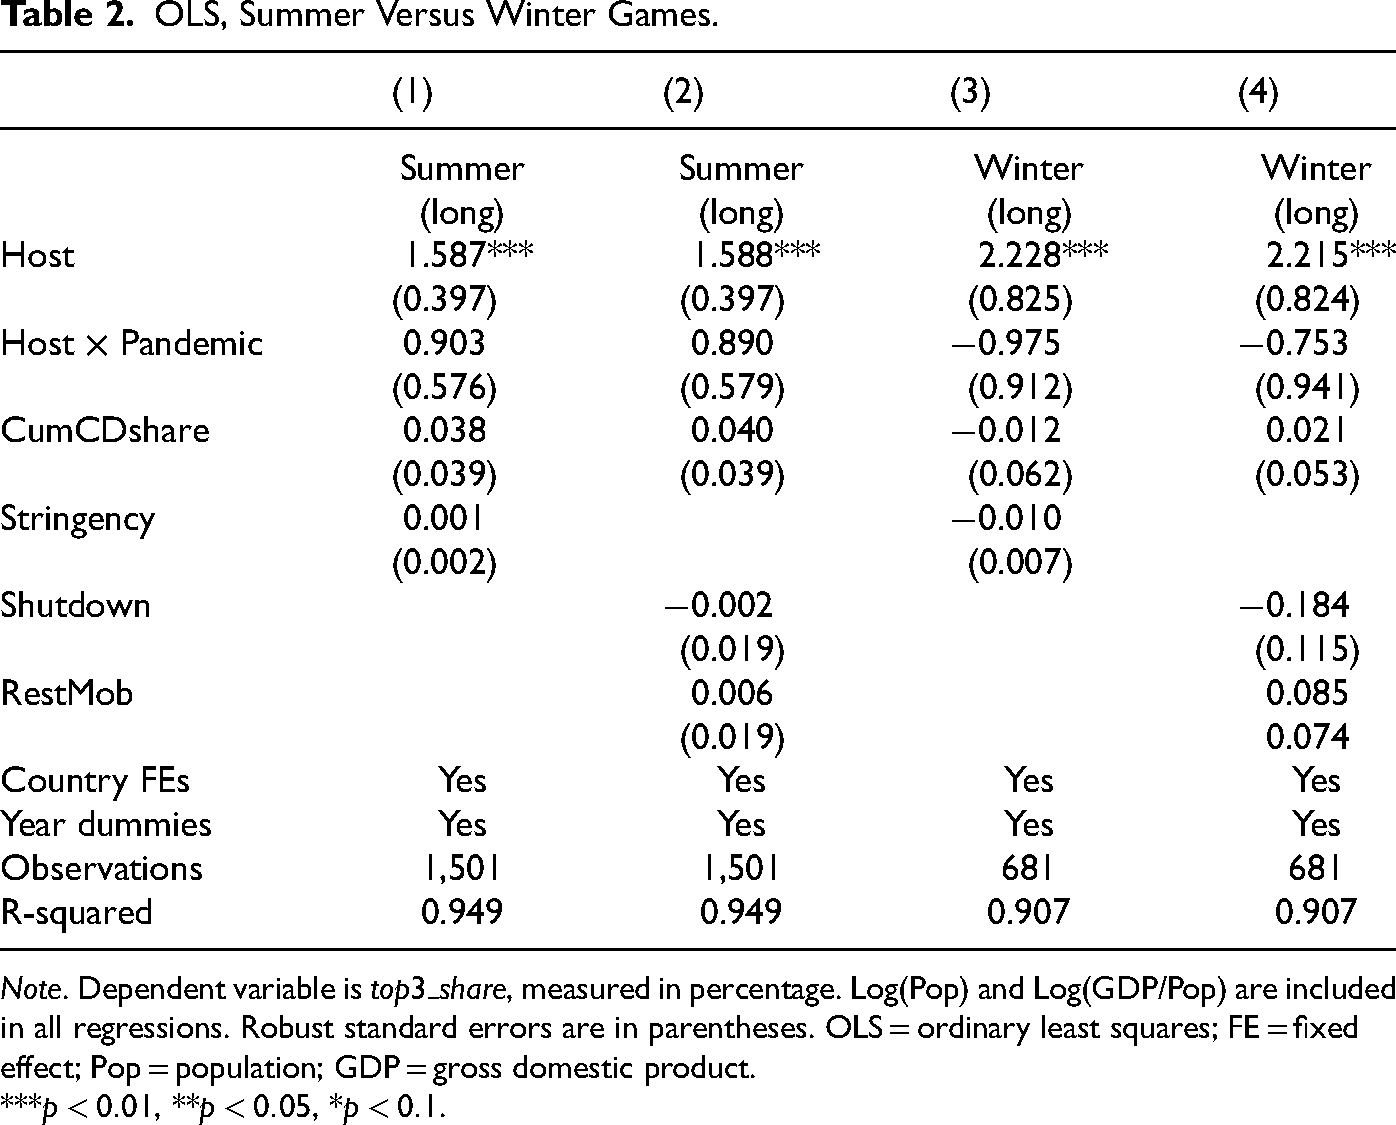
Note. Dependent variable is
***
In Table 3, we split the sample between individual and team competitions. Its structure is analogous to Table 2. It is plausible that the pandemic may have a negative effect on individual sports, for which replacement of top athletes may be more consequential than for team sports. Nevertheless, the null results from the baseline analysis remain unchanged. We do observe, however, that the negative
OLS,Individual Versus Team Events.

Note. Dependent variable is
***
In Table 4, we redefine the pandemic variables to consider only the 6-month period prior to the beginning of the Games (short period). Column 1 shows the analog of column 4 of Table 1, while columns 2 and 3 split the sample between individual and teams’ sports, respectively. We confirm that the mitigation of the host effect is due to the teams’ competition. We also find that the restrictions related to the shutdown of activities in the previous 6 months show a negative effect on countries’ aggregate performance in the Games. Based on the result from the first regression in Table 4 and the summary statistics reported in Appendix III, the top 3 share would drop by about 0.6 percentage point for a country with the highest shutdown index of the sample (11.95 for Honduras, based on the short COVID-19 period), compared to the pre-COVID period. The corresponding estimate is only 0.13% when
OLS, COVID Variables Based on the Short COVID-19 Period.
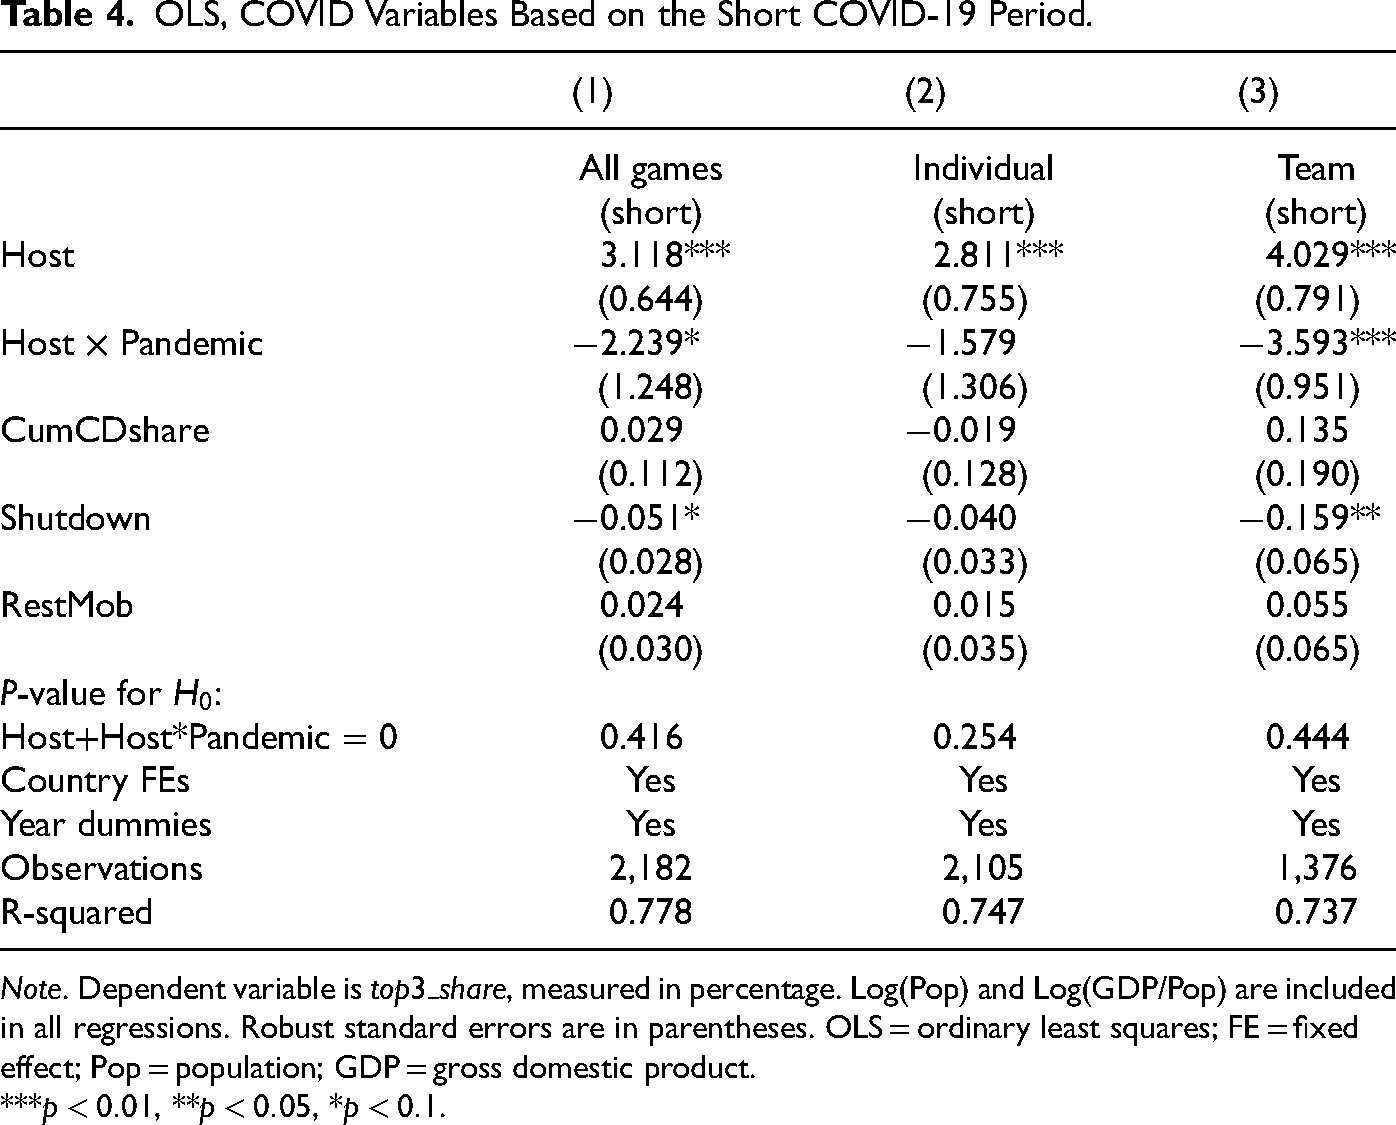
Note. Dependent variable is
***
In Table 5, we show results from a Tobit estimation with random effects. The first three columns use the “long” definition of the pandemic variables, considering all events in column 1 and then splitting between individual and team sports in columns 2 and 3, respectively. The last three columns are the analogs for the “short” definition of the pandemic variables. The estimated
Tobit, all Games (Summer and Winter Games Combined).
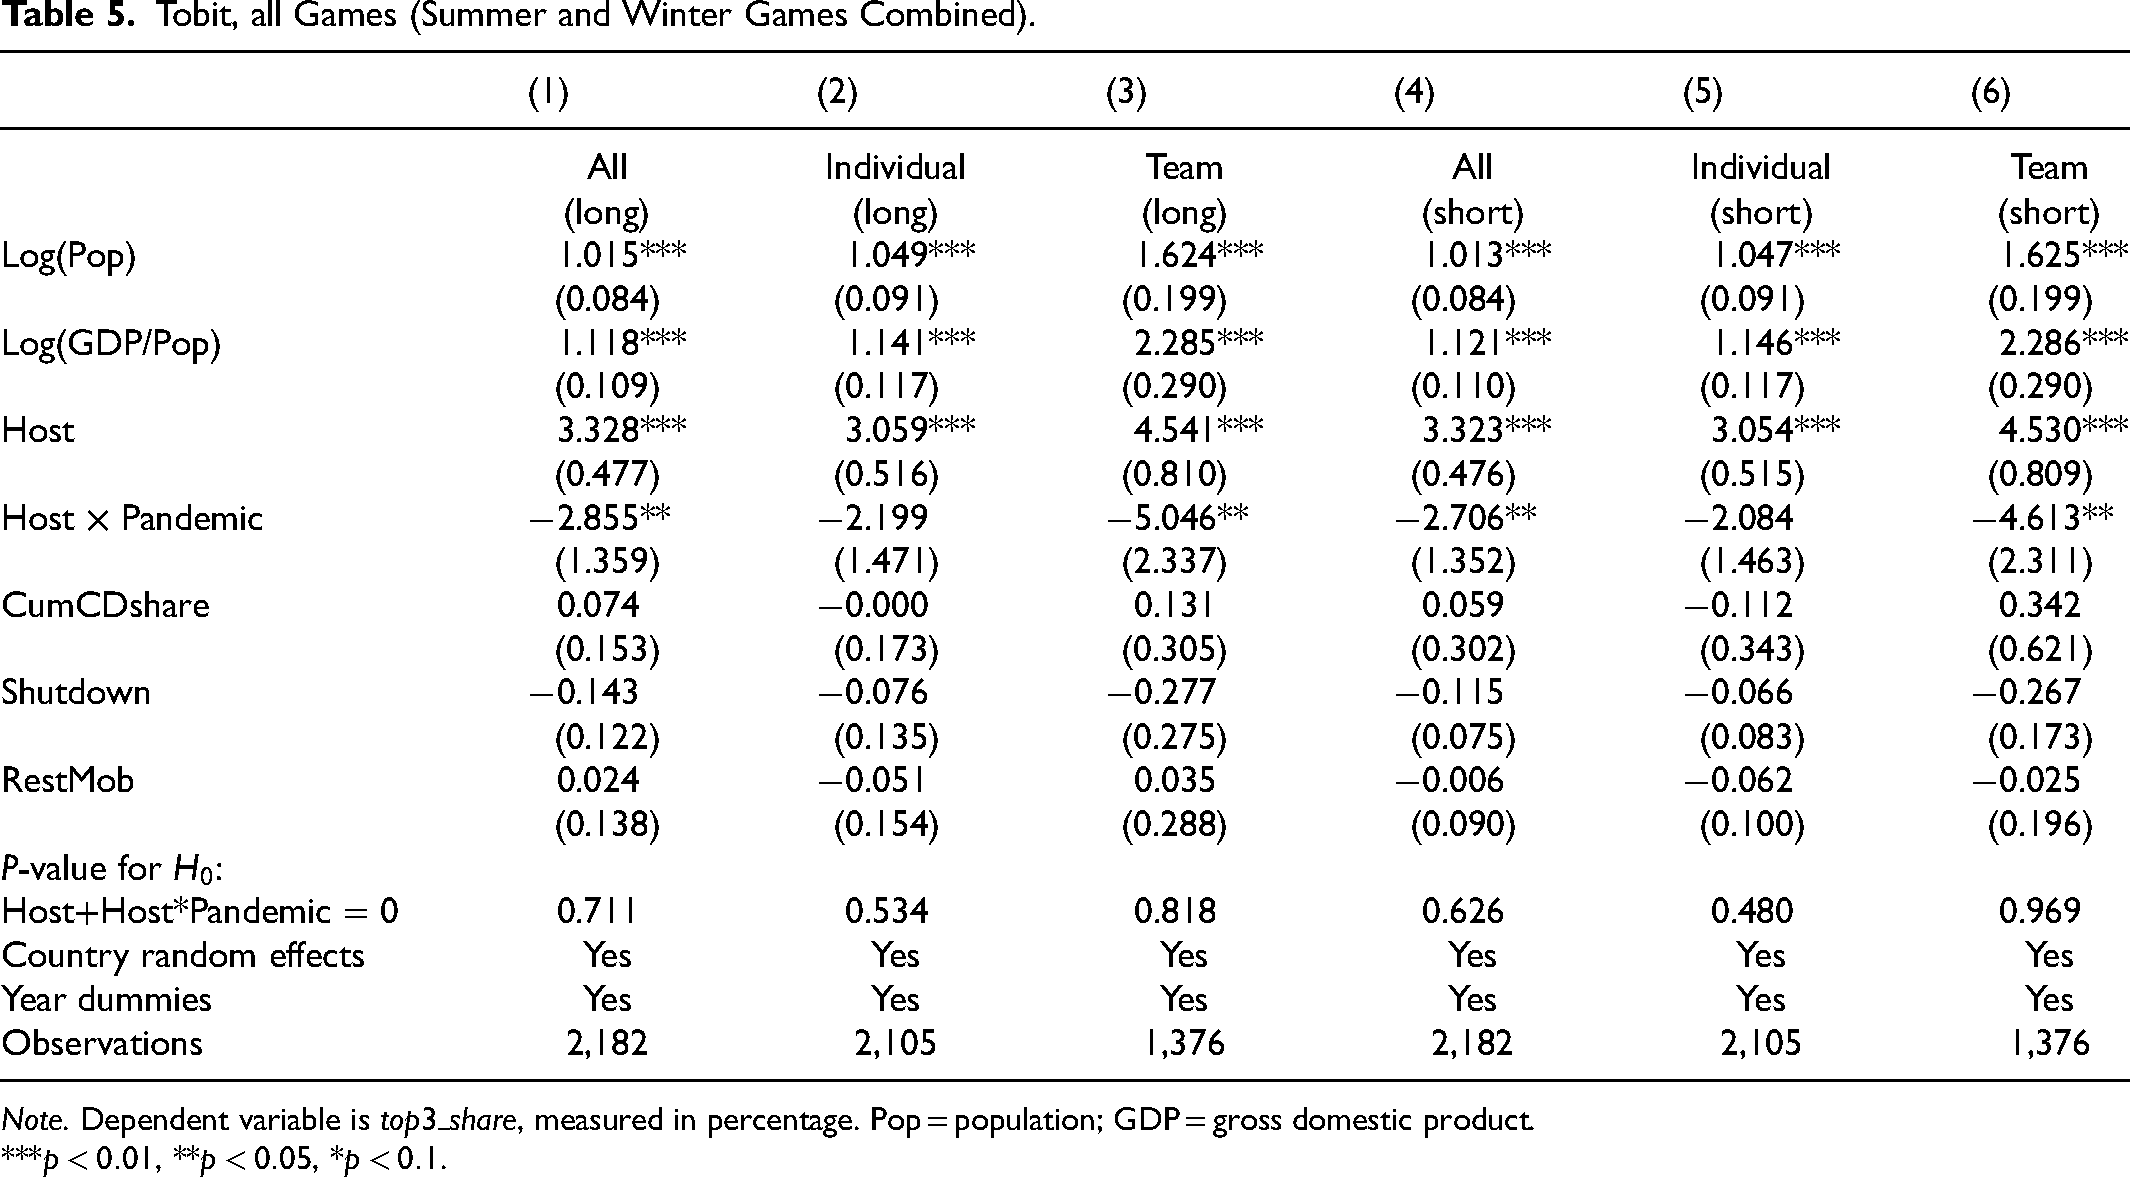
Note. Dependent variable is
***
In Appendix III, we show additional results. First, we split the sample for Summer Games between indoor and outdoor events (Table A2). Second, we consider the share of results among the top 8, instead of the top 3 (Table A3). In both cases, the results change very little, with the only notable difference being that the
A potential concern is that most countries in most Games receive no medals, so their top 3 shares are mostly zeroes, making the data rather skewed. When we drop those zero observations, our sample shrinks by almost two-thirds. The Host dummy remains significant and positive in the regressions, in line with the literature, but its interaction with the Pandemic dummy is no longer statistically significant. The results can be found in Table A5. The p-value reported in the table shows again that the host effect during the pandemic is weak and statistically insignificant at the 10% level.
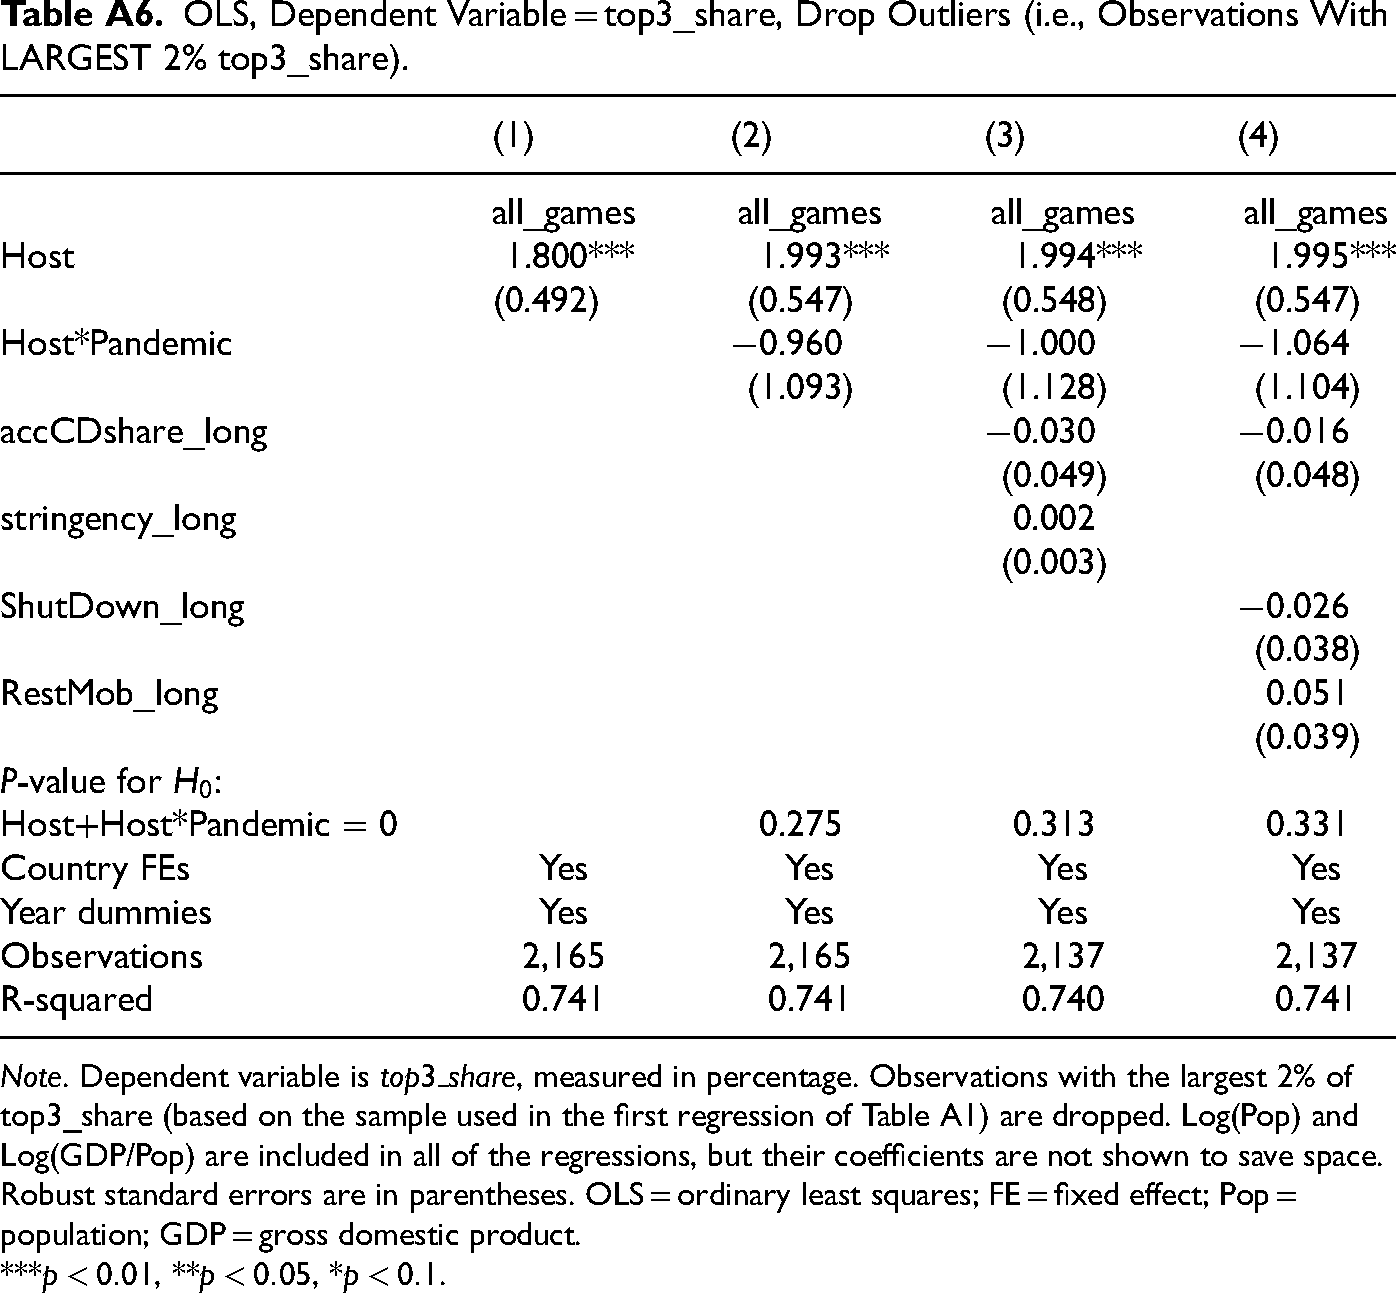
Finally, to deal with outliers, we also tried dropping the observations with the largest
Conclusion
Societies in most countries value Olympic Games, as evidenced by the significant resources spent on them. Large global health shocks could affect the competitiveness of the games in important ways, distorting its results. Yet we show that, despite its wide and heterogeneous economic and social effects across countries, the COVID-19 pandemic was virtually inconsequential for the distribution of medals in the last two Olympic Games. The results are robust to various measures of the key variables and estimation techniques. We do find, however, that the host effect identified in the literature (which may be a distorting effect) virtually vanishes during the pandemic.
Our results show that team sports are more likely to be affected by the lack of spectators during the pandemic. Countries had adopted various policies during the pandemic to address this issue, such as physical distancing, face covering, health screening and monitoring, and contactless transactions. By implementing these strategies and prioritizing the health and safety of spectators, sporting events can be conducted more safely during a pandemic while still allowing fans to enjoy the excitement of live sports.
Although our findings suggest that COVID-19 was not a game changer for the Tokyo 2021 and Beijing 2022 Olympic Games, they should be interpreted as a short-run assessment. In contrast, its long-run impact remains to be seen. For instance, lockdown policies affect young children’s participation in sports. Some youth athletes may lose interest in sports altogether due to prolonged disruptions caused by lockdowns. Financial strain on families, decreased access to facilities, and changes in priorities may also contribute to a decline in participation rates. In addition, countries and families may invest more in outdoor sports that are relatively less affected by future outbreaks of contagious diseases. This is the first analysis of the impact of the Covid-19 pandemic on countries’ performance in Olympic Games. Future research may investigate the precise mechanisms behind our findings.
Footnotes
Acknowledgments
We would like to thank two anonymous referees for their insightful comments and suggestions. We would like to thank Yixuan Zhang for her excellent RA work. We also thank Weihong Li and other participants at the 2023 CES North America Conference for their discussions and comments.
Declaration of Conflicting Interests
The authors declared no potential conflicts of interest with respect to the research, authorship, and/or publication of this article.
Funding
The authors disclosed receipt of the following financial support for the research, authorship, and/or publication of this article: This project is supported by a fund for building world-class universities (disciplines) at Renmin University of China. Project No. KYGJC2023003.
Notes
Appendix I: Data
Appendix II: Special country notes
Russia, as a country, was banned from the 2018 Pyeongchang Olympics Games. Athletes of the OAR participated in the games, representing themselves rather than Russia. In Tokyo 2020 and Beijing 2022 Games, Russian players formed ROC to participate in the games.
8
For these three events, we assign their medals to Russia and use Russian GDP and population data in the corresponding years. To be consistent with the data in other years, we continue to use the same country ISO code, “RUS,” for Russia. Note that this treatment is only for analytical convenience, and it does not represent our opinion regarding Russia’s status during the games.
Appendix III: Additional tables
OLS, Dependent Variable = top3_share, Drop Outliers (i.e., Observations With LARGEST 2% top3_share).
| (1) | (2) | (3) | (4) | |
|---|---|---|---|---|
| all_games | all_games | all_games | all_games | |
| Host | 1.800*** | 1.993*** | 1.994*** | 1.995*** |
| (0.492) | (0.547) | (0.548) | (0.547) | |
| Host*Pandemic | 0.960 | 1.000 | 1.064 | |
| (1.093) | (1.128) | (1.104) | ||
| accCDshare_long | 0.030 | 0.016 | ||
| (0.049) | (0.048) | |||
| stringency_long | 0.002 | |||
| (0.003) | ||||
| ShutDown_long | 0.026 | |||
| (0.038) | ||||
| RestMob_long | 0.051 | |||
| (0.039) | ||||
| P-value for : | ||||
| Host+Host*Pandemic = 0 | 0.275 | 0.313 | 0.331 | |
| Country FEs | Yes | Yes | Yes | Yes |
| Year dummies | Yes | Yes | Yes | Yes |
| Observations | 2,165 | 2,165 | 2,137 | 2,137 |
| R-squared | 0.741 | 0.741 | 0.740 | 0.741 |
Note. Dependent variable is
***