
Abstract
Chiral molecules are ubiquitous and necessary for life as we know it. In extant life, the amino acid and sugar constituents of proteins and biopolymers consist of only one enantiomer. This “homochirality” is plausibly generic to any biochemical life and therefore may represent a pure, agnostic biosignature. The ultraviolet (UV) circular polarization spectrum offers a practical method for detecting chirality for generic biomass and hence can be a powerful tool for detecting such biosignatures in an extraterrestrial setting. Here, we demonstrate distinctive UV chiral signatures from astrobiology mission-relevant chemoautotrophic microbes when measured in transmission spectroscopy. Polarization and spectral absorption features are strongly evident at wavelengths expected for protein secondary structures and other chiral molecules, even though the microbial samples are not expected to have survived the study environment. When measured with reflection spectropolarimetry, which would be required for a remote sensing observation, we obtained only null results. Following 10 keV electron irradiation in the Minos chamber at the Jet Propulsion Laboratory Ocean Worlds Laboratory, which is equivalent to exposure of approximately 1 month on the Europan surface in a region where radiation is most intense, chiral signatures persisted to a degree dependent on sample thickness and composition. A control measurement of a Murchison meteorite sample was also undertaken.
1. Introduction
A rich diversity of chiral 1 signatures has been revealed in the visible region of the electromagnetic spectrum for photosynthetic organisms: circular polarization signals, which are subtle, yet highly significant (Sparks et al., 2009a; Sparks et al., 2009b; Sparks et al., 2021; Patty et al., 2017; Patty et al., 2018; Patty, 2019; Patty et al., 2019; Patty et al., 2021). By expanding our exploration of the detectability of chiral properties into the ultraviolet (UV), where generic chiral signatures abound not only for photosynthetic organisms but also for any biomass, we aim to expand our ability to use polarimetry to access arguably the purest agnostic biosignature known, that is, homochirality. To an extremely good approximation, all life on Earth encodes only left-handed amino acids into proteins and right-handed sugars into nucleic acid biopolymers. Beyond nucleic acids, amino acids, proteins, carbohydrates, and other biogenic molecular assemblies are chiral, with protein secondary structure and amino acids typically dominating the UV circular dichroism (CD). Empirically, this unique characteristic of life offers a means by which to test for the presence of biological processes in an extraterrestrial environment (Sparks et al., 2009a; Patty, 2019). Circular polarization spectroscopy in the UV may, therefore, offer a ubiquitous, generic, agnostic biosignature.
Homochirality and its influence on the circular polarization of light is exploited in the standard biophysical technique of CD 2 spectroscopy, which is used to probe protein conformation (e.g., Fasman, 1996; Kelly and Price, 2000; Dodero et al., 2011). In that context, there is a vast literature of ultraviolet CD measurements of individual biochemicals. The random orientation of biomolecules in solution does not affect their influence on circular polarization, but their homochirality ensures a macroscopic signature of molecular-level optical activity.
Given the ubiquity and preponderance of homochirality, a feature of every known living organism, it is widely held that it is likely to be generic to all biochemical life, even if different from terrestrial life, and hence may serve as an “agnostic” biosignature. Its origins are unknown but are plausibly a requirement for self-replication (Popa, 2004). Wald (1957) stated that “No other chemical characteristic is as distinctive of living organisms as is optical activity.”
In the UV, protein absorbance has a polarization sensitivity that depends on its conformation. The α-helix, β-sheets, and random coils each give rise to a different characteristic shape in the CD spectrum. The α-helix displays large positive CD at 193 nm and negative ellipticity bands at 208 nm and 222 nm. β-sheets have a positive band at 195 nm and a large negative feature near 218 nm. Random coils show a weak, broad positive CD band around 217 nm with a stronger negative band near 200 nm (e.g., Greenfield and Fasman, 1969; Jirgensons, 1973; Fasman, 1996; Dodero et al., 2011; see Fig. 1). The polarization signal arises when a peptide bond is in a regular, folded environment. The bond absorbs UV light in the range of 180–230 nm (far-UV), and the shape of the polarization spectrum can be used to extract conformational information about the protein backbone and the secondary structure of the protein. Electronic transitions of optically active chromophores give rise to the distinctive Cotton Effect, where optical activity couples to the spectral absorption feature. The main transitions are n→π* at 220 nm and π→π* at 190 nm, with a contribution from aromatic amino acid side chains (Woody, 1996).
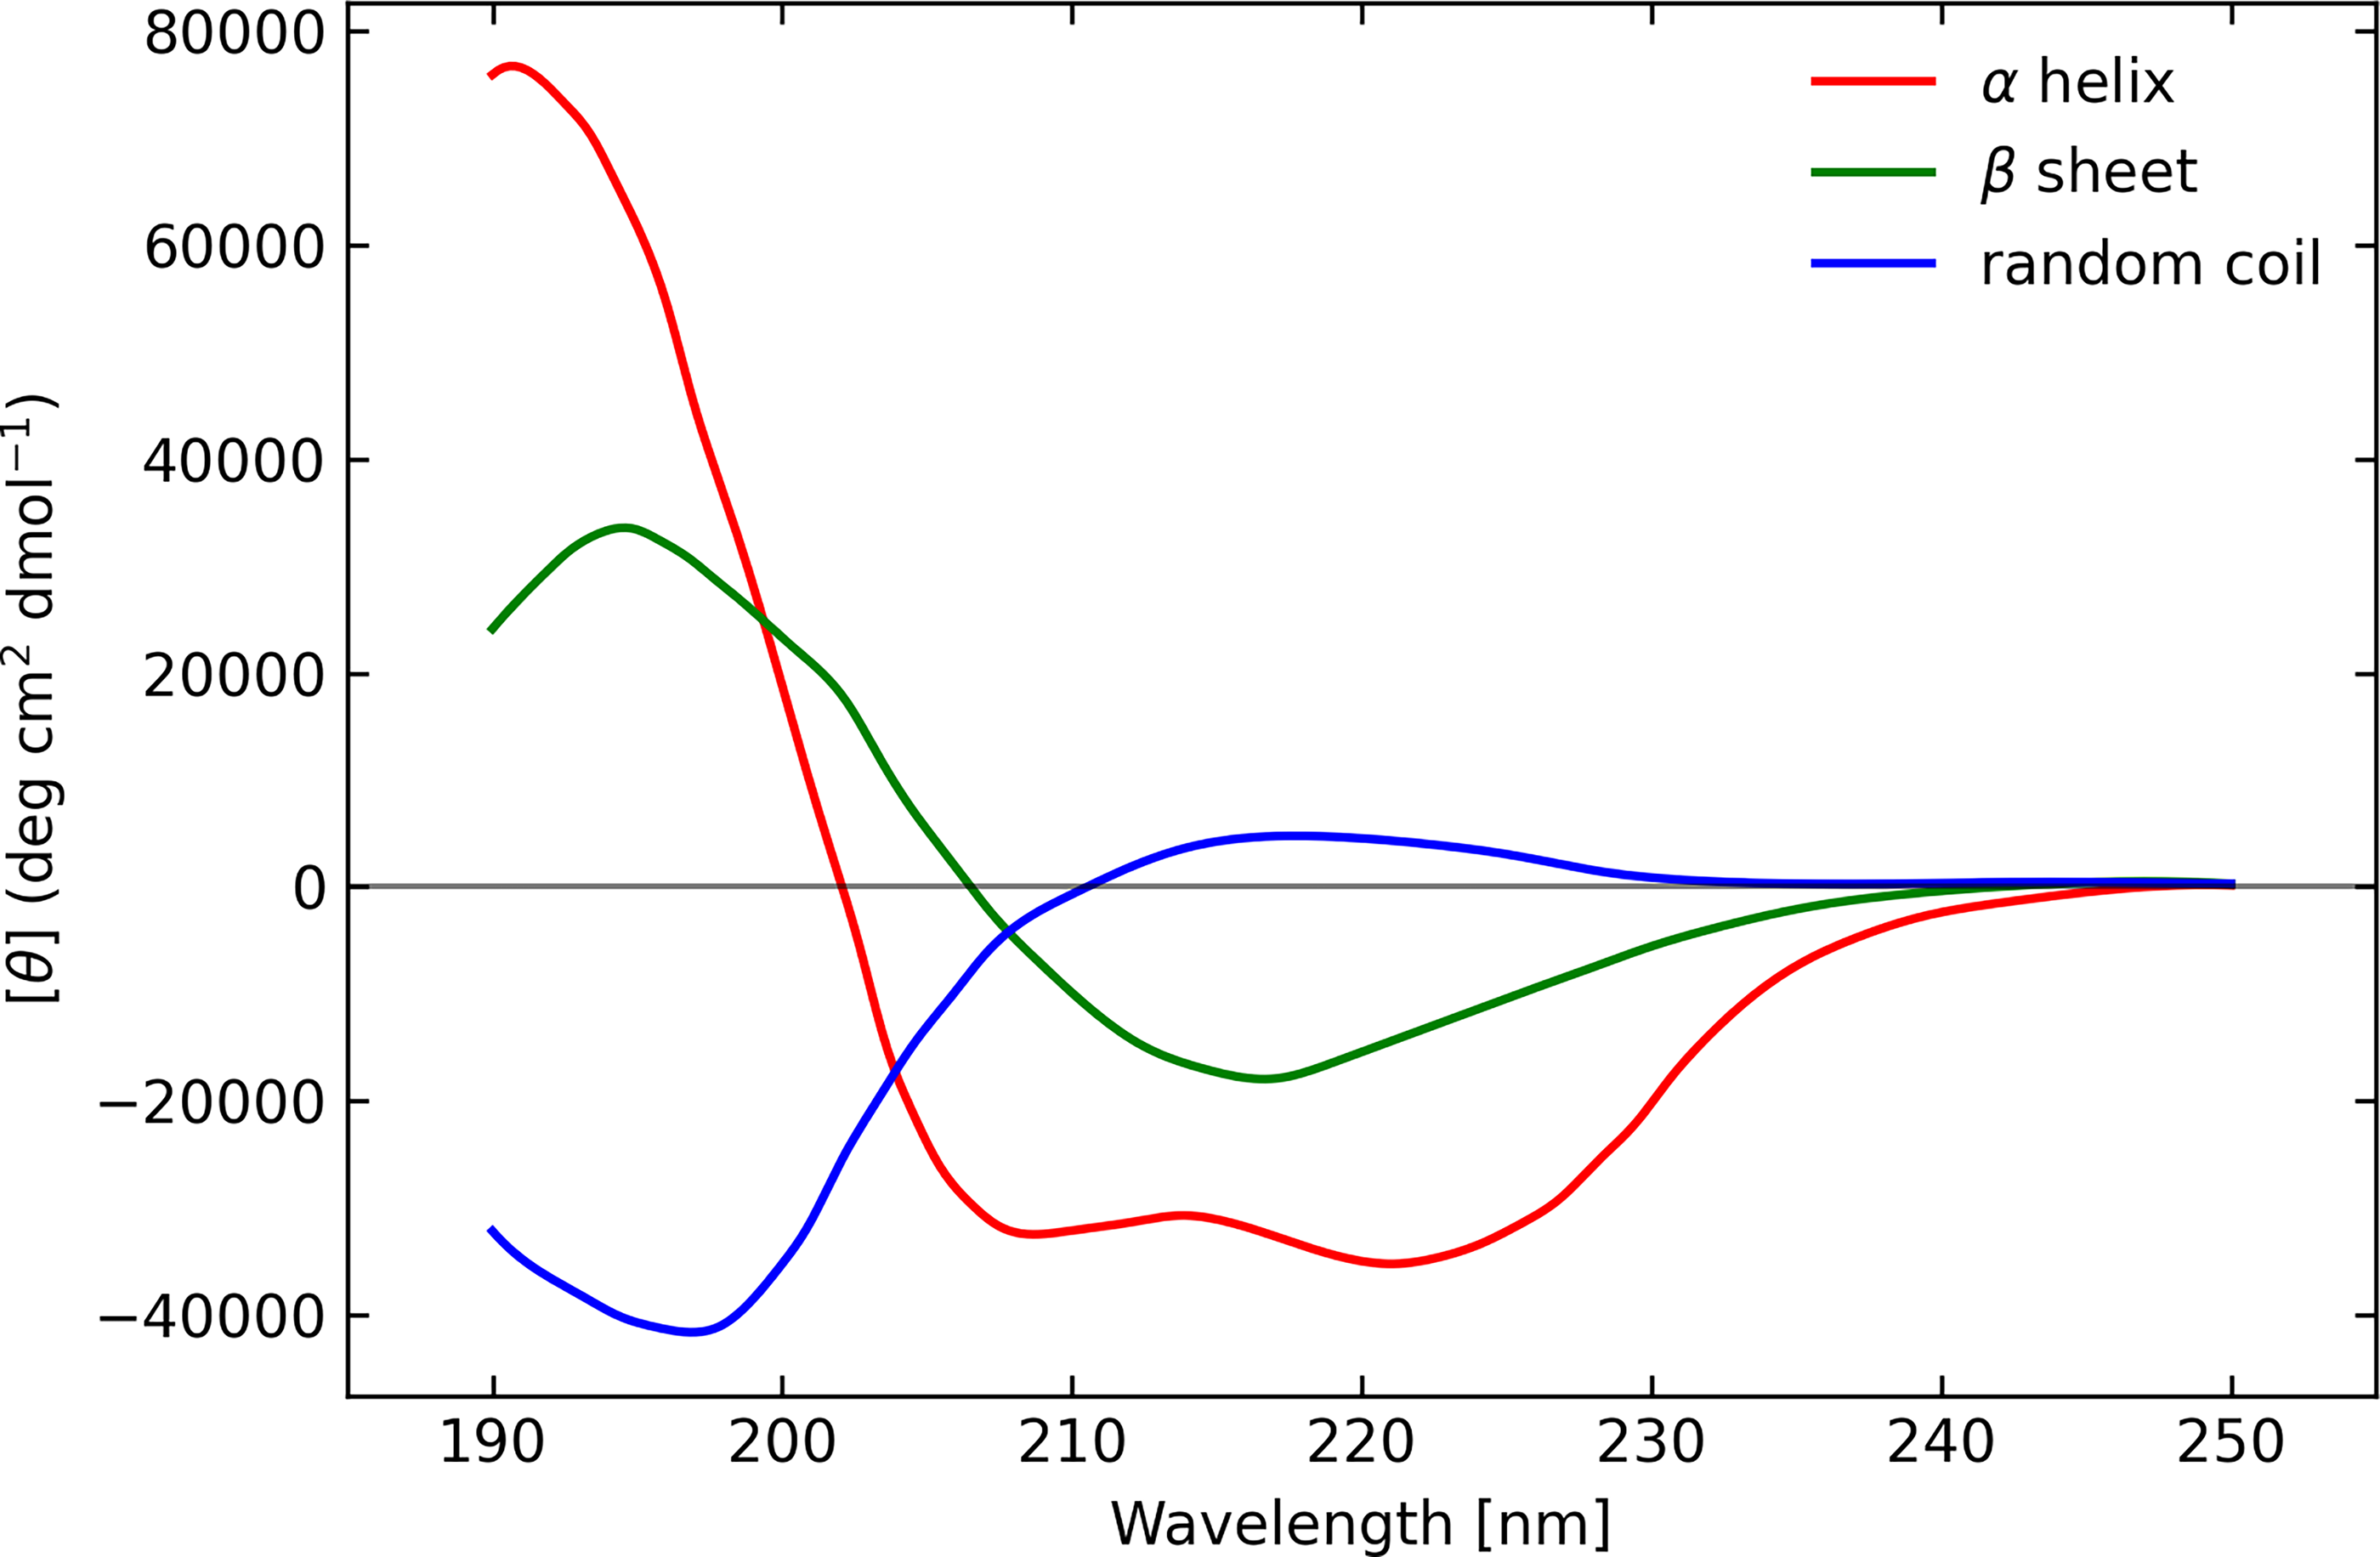
Far-UV circular dichroism spectra of poly-L-lysine-HCl in three different conformations measured by Greenfield and Fasman (Greenfield and Fasman, 1969). UV, ultraviolet.
The CD spectrum of proteins in the near-UV spectral region (250–350 nm) is also sensitive to certain aspects of tertiary structure (Jirgensons, 1973). At these wavelengths, the chromophores are aromatic amino acids, phenylalanine, tyrosine and tryptophan, and disulfide bonds. Hence, throughout the UV polarization spectrum, there is a wealth of information related to the fundamental, chiral molecular structure of biological material. Viewed as an empirical method for seeking evidence of chirality, we free ourselves, by measuring in the UV, of the restrictions imposed by photosynthesis and are potentially sensitive to any biomass. This could find application as a life detection indicator in situ or with remote sensing, within the ices and plumes of Europa and Enceladus, on Titan, in the clouds of Venus, and elsewhere in the solar system.
Here, we describe reflection and transmission experiments of mission-relevant chemoautotrophic microorganisms as plausible Europa-ocean-based life analogs. We further test the resilience of chiral biosignatures after exposure to a Europa-surface-like environment.
Microbial samples were cultivated at the University of Maryland School of Medicine and Institute of Marine and Environmental Technology following the protocols published by the DSMZ culture collection (Leibniz Institute, DSMZ-German Collection of Microorganisms and Cell Cultures GmbH, Braunschweig, Germany). Following growth and harvesting of the cells, far UV polarization spectra were obtained at the
The two primary microbial samples measured were the thermophilic anaerobic bacteria Archaeoglobus fulgidus and Carboxydothermus ferrireducens (Slobodkin et al., 2006). Archaeoglobus fulgidus (DSM 8774) is a hyperthermophilic archaeon isolated from oil field fluids from an oil production platform in the North Sea. Archaeoglobus fulgidus, the type species of the genus Archaeoglobus, is a prototype for sulfate reduction in the Archaea (Stetter, 1988; Beeder et al., 1994; Klenk, 1997). Carboxydothermus ferrireducens (DSM 11255) is a thermophilic filamentous iron-reducing microbe prone to formation of biofilms (Gavrilov et al., 2021). The strain grows under a 200 kPa overpressure of 80% hydrogen 20% CO2 at 85°C. The strain has a typical Gram-positive cell wall with a sulfur layer. The presence of many multiheme proteins in the C. ferrireducens genome and heme-containing extracellular filaments suggests a metabolic capability for extracellular electron translocation. When grown on ferrihydrite at 65°C, exoelectrogenesis is observed with the generation of a nanoparticulate mineral phase. Live cells are entrapped in biostructured magnetite, with rapid conversion of amorphous mineral ferrihydrite to micrometer-sized magnetite crystals (Gavrilov et al., 2021). Neither of these microbes survive prolonged exposure to oxygen, but they have been reported to form in biofilms that would enable prolonged persistence of the cells in harsh conditions.
We utilized a Jasco J-1500 CD spectrophotometer equipped with a DRCD-575 Diffuse Reflectance Accessory, which permitted measurements in reflection as well as transmission, and a precision Hinds Instruments dual photoelastic modulator (PEM) polarimeter designed to operate between 190 and 310 nm. The former modulates the radiation impinging on the sample between left and right circular polarization and measures the intensity with a polarization-insensitive detector, while the latter measures the polarization state of the radiation transmitted by a sample illuminated with unpolarized radiation. The two devices gave consistent results empirically (see Appendix); however, due to a higher signal-to-noise ratio, the CD spectrophotometer dominated our analysis, and here we present results exclusively from the Jasco instrument. CD measurements in some cases were converted to equivalent circular polarization degree using the formula v = [θ/(28648 mdeg)] where v is the degree of circular polarization (dimensionless) and θ is the CD. A 1 mdeg (1 mdeg = 1.745 × 10⁻⁵ rad) signal corresponds to v = 3.49 × 10⁻⁵. A formal equivalence is outlined in the appendix.
Figure 2 shows the Jasco reflectance accessory configurations. PMT1 is the photomultiplier tube used in normal transmittance CD measurements. The reflection accessory consists of a UV-grade Spectralon integrating sphere with three ports and a second photomultiplier tube (PMT2). The red arrows represent the light incident from the polarization state generator, the light scattered from the sample that is detected, and the light that enters the detector in use.
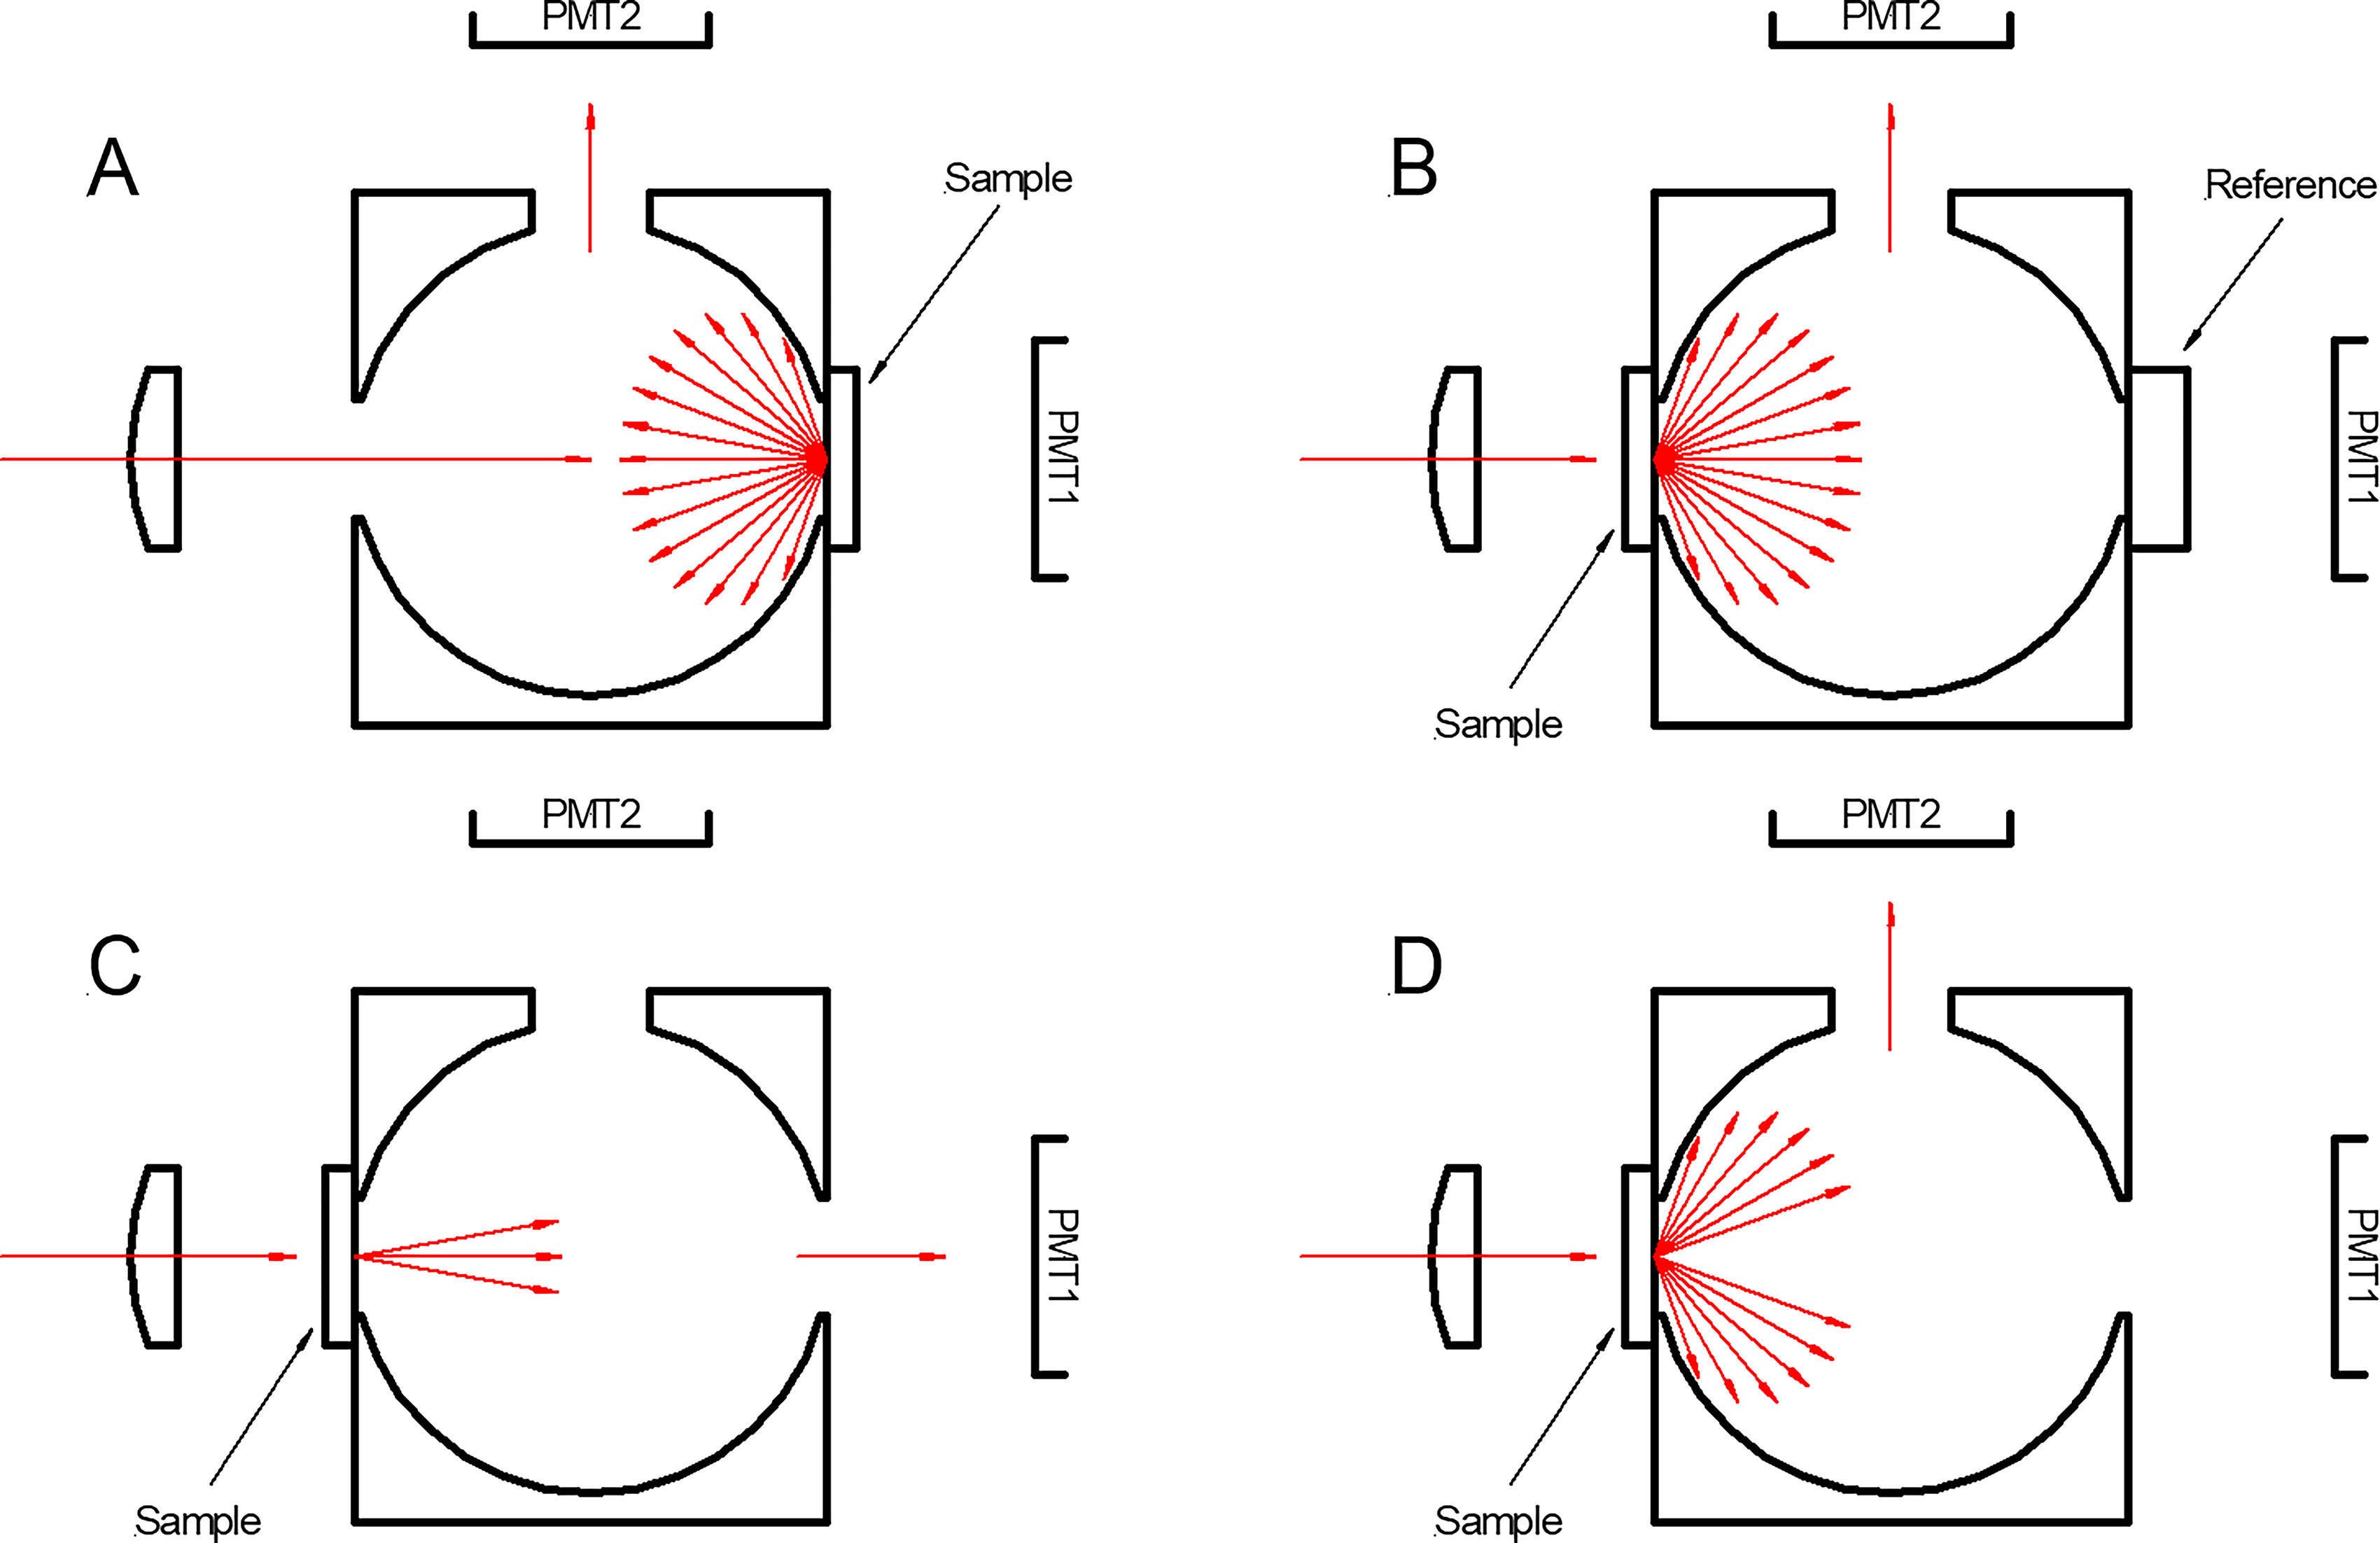
Four configurations of the DRCD accessory. DRCD, diffuse reflectance circular dichroism.
Configuration A is the normal configuration for diffuse reflectance CD (DRCD) measurements. Light is incident through the input port onto the sample, and the light diffusely scattered by the sample is collected by the integrating sphere and directed to PMT2. Modulations in the measured signal due to changes in the incident polarization indicate DRCD.
In configuration B, the sample is placed on the input port of the integrating sphere, and a Spectralon reference sample is placed on the usual sample port. This configuration effectively makes the integrating sphere a two-port sphere, redirecting all of the light (albeit with significant losses) transmitting through the sample onto PMT2. In the absence of significant scatter, measurements in this configuration should be equivalent to normal CD transmission measurements, albeit with lower signal-to-noise ratio due to the efficiency of the sphere. These measurements are referred to as diffuse transmittance CD (DTCD), with “RI” additionally denoting “regular included” light which passes directly through the sample.
Configuration C replicates the normal transmission operation of the CD spectrometer. It uses PMT1 and only collects the unscattered and weakly scattered radiation emitted from the sample. Finally, configuration D collects only the significantly scattered light transmitted through the sample. We refer to the measurements in configuration D also as DTCD but with the regular transmittance excluded: RE.
To summarize, configuration C is the primary transmission mode configuration, which reveals a direct view of the CD spectrum in transmission with minimally scattered light. Configuration A is the primary reflection mode configuration, while configurations B and D are transmission modes, which include diffusely scattered light either with (configuration B) or without (configuration D) the minimally scattered component. Configuration C is the most relevant approach for an in situ experiment, where samples would be incorporated into a chamber and light passed through the sample for analysis. Configuration A is intended to be representative of a remote sensing measurement where the sample is viewed from distance by surface reflection, or a measurement directly from the surface of a harvested sample.
The samples were measured three times in transmission and rotated to four different rotation angles for the reflection experiments.
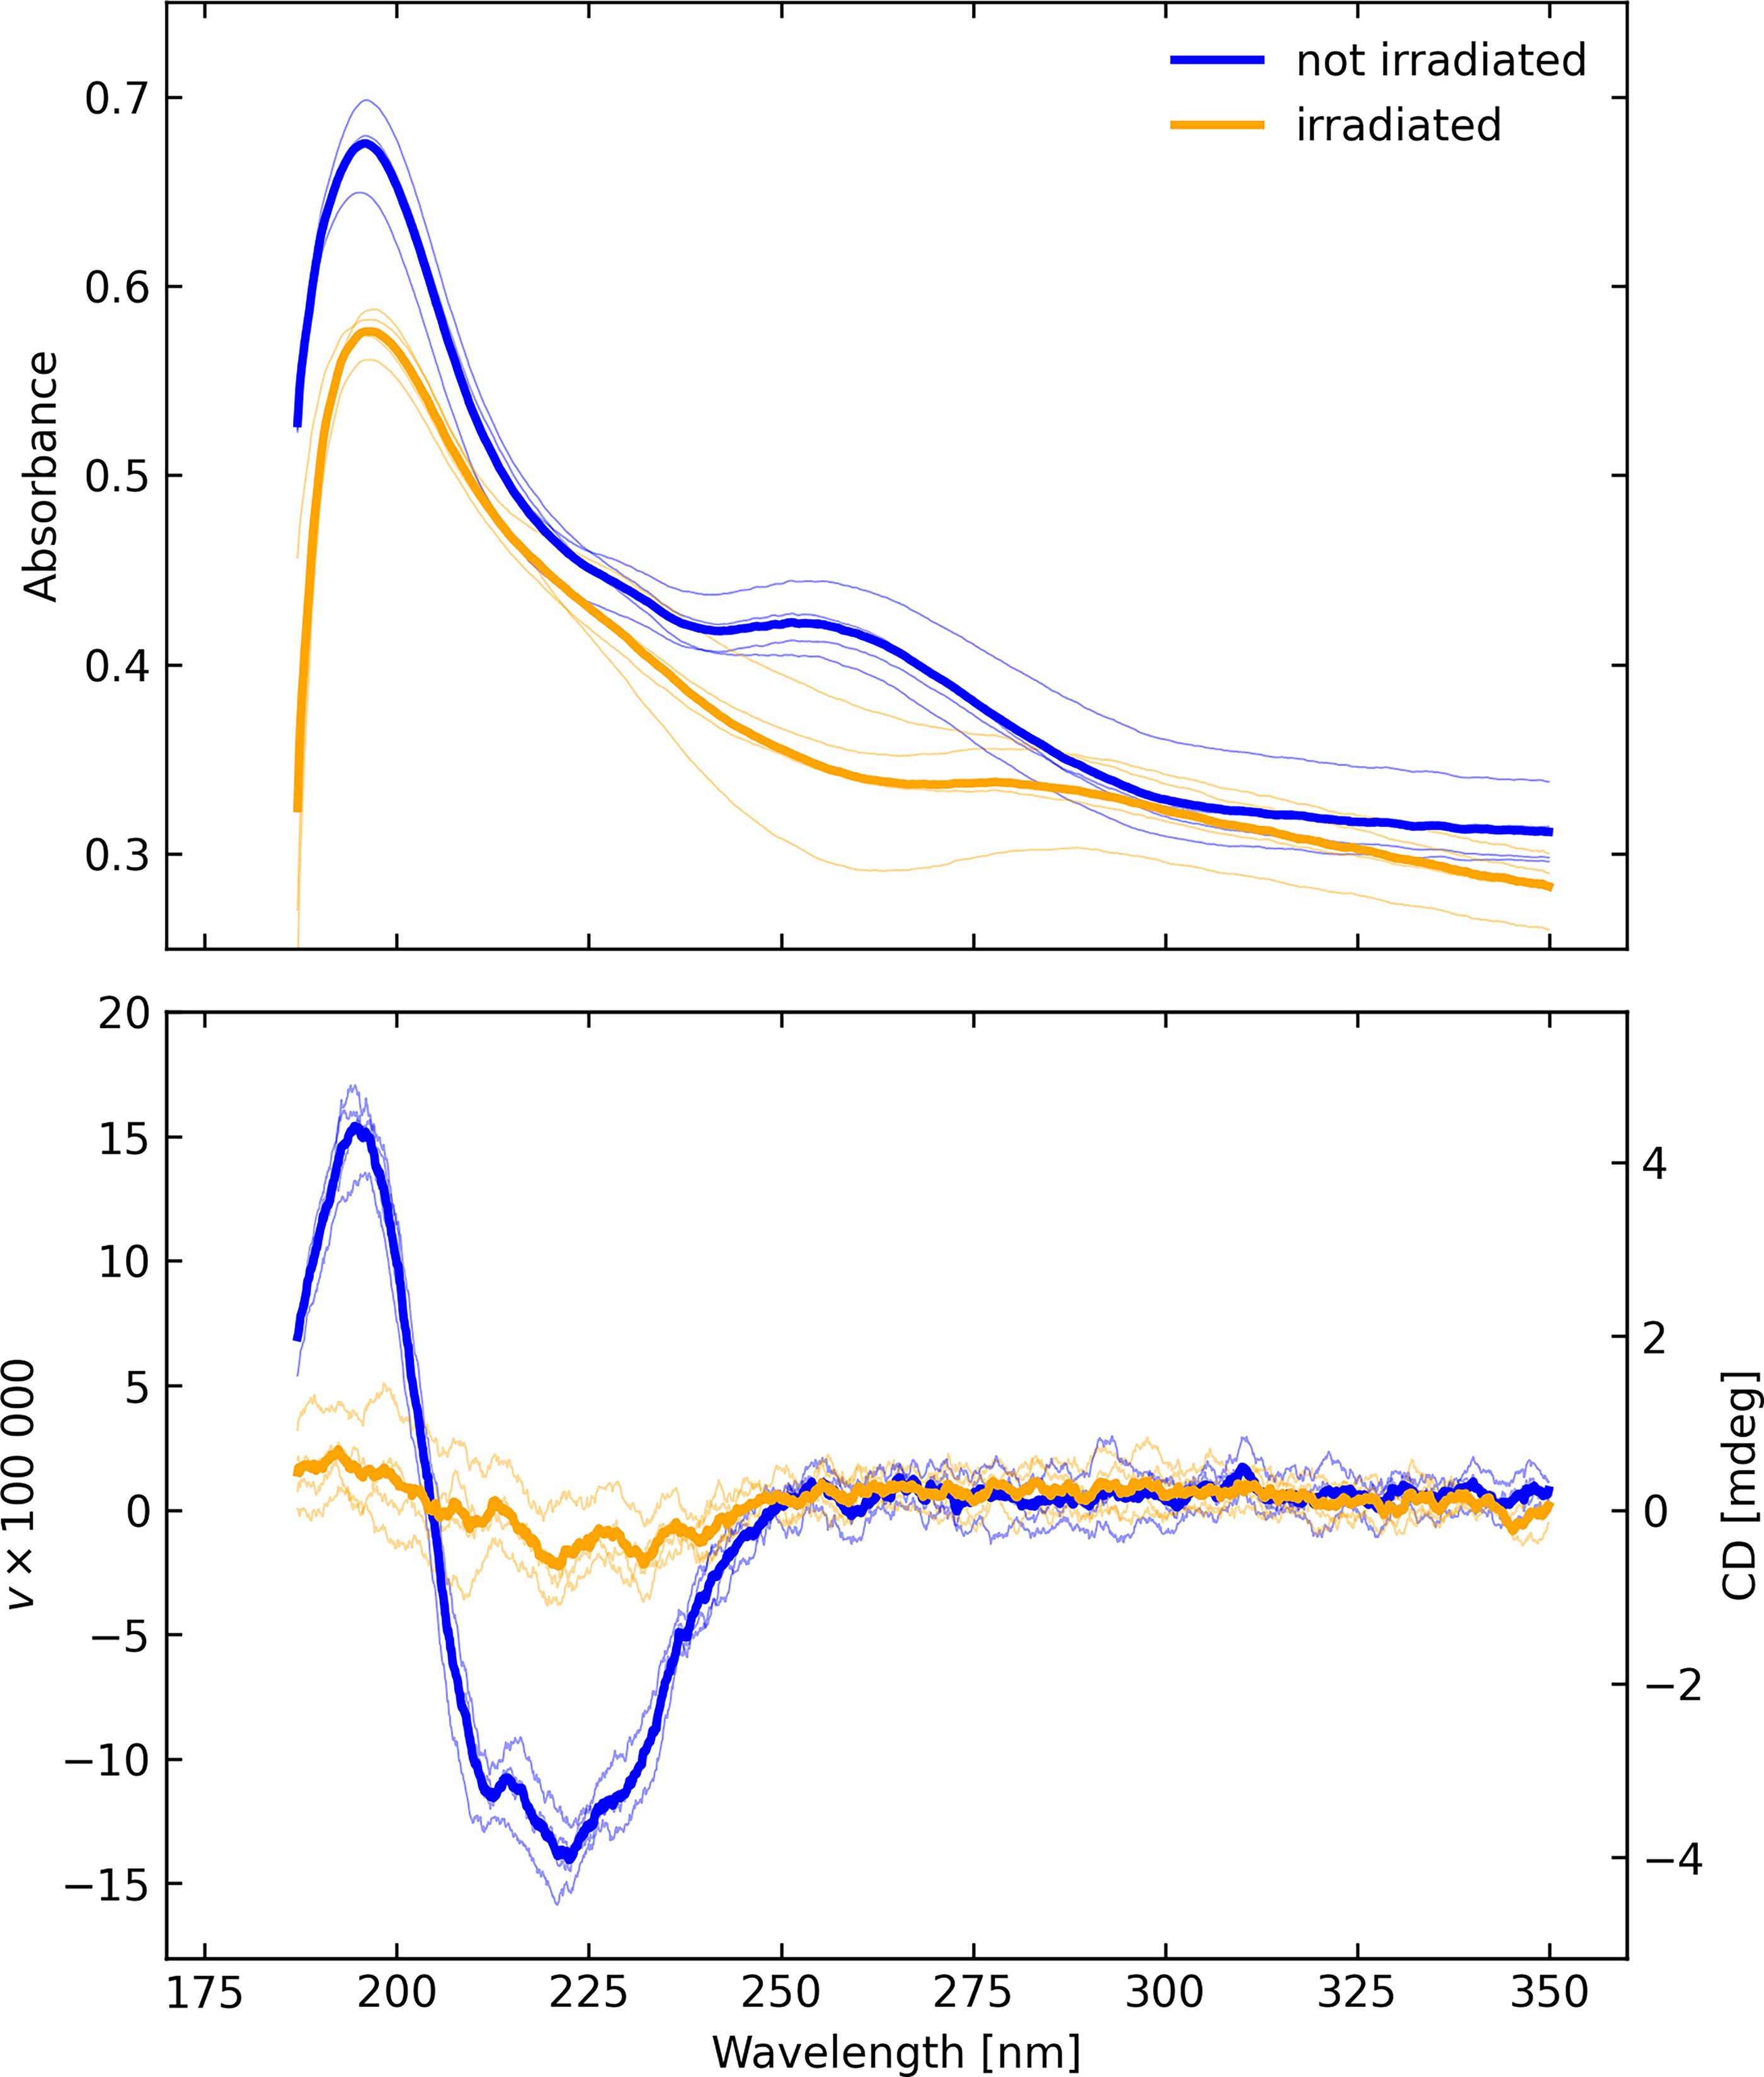
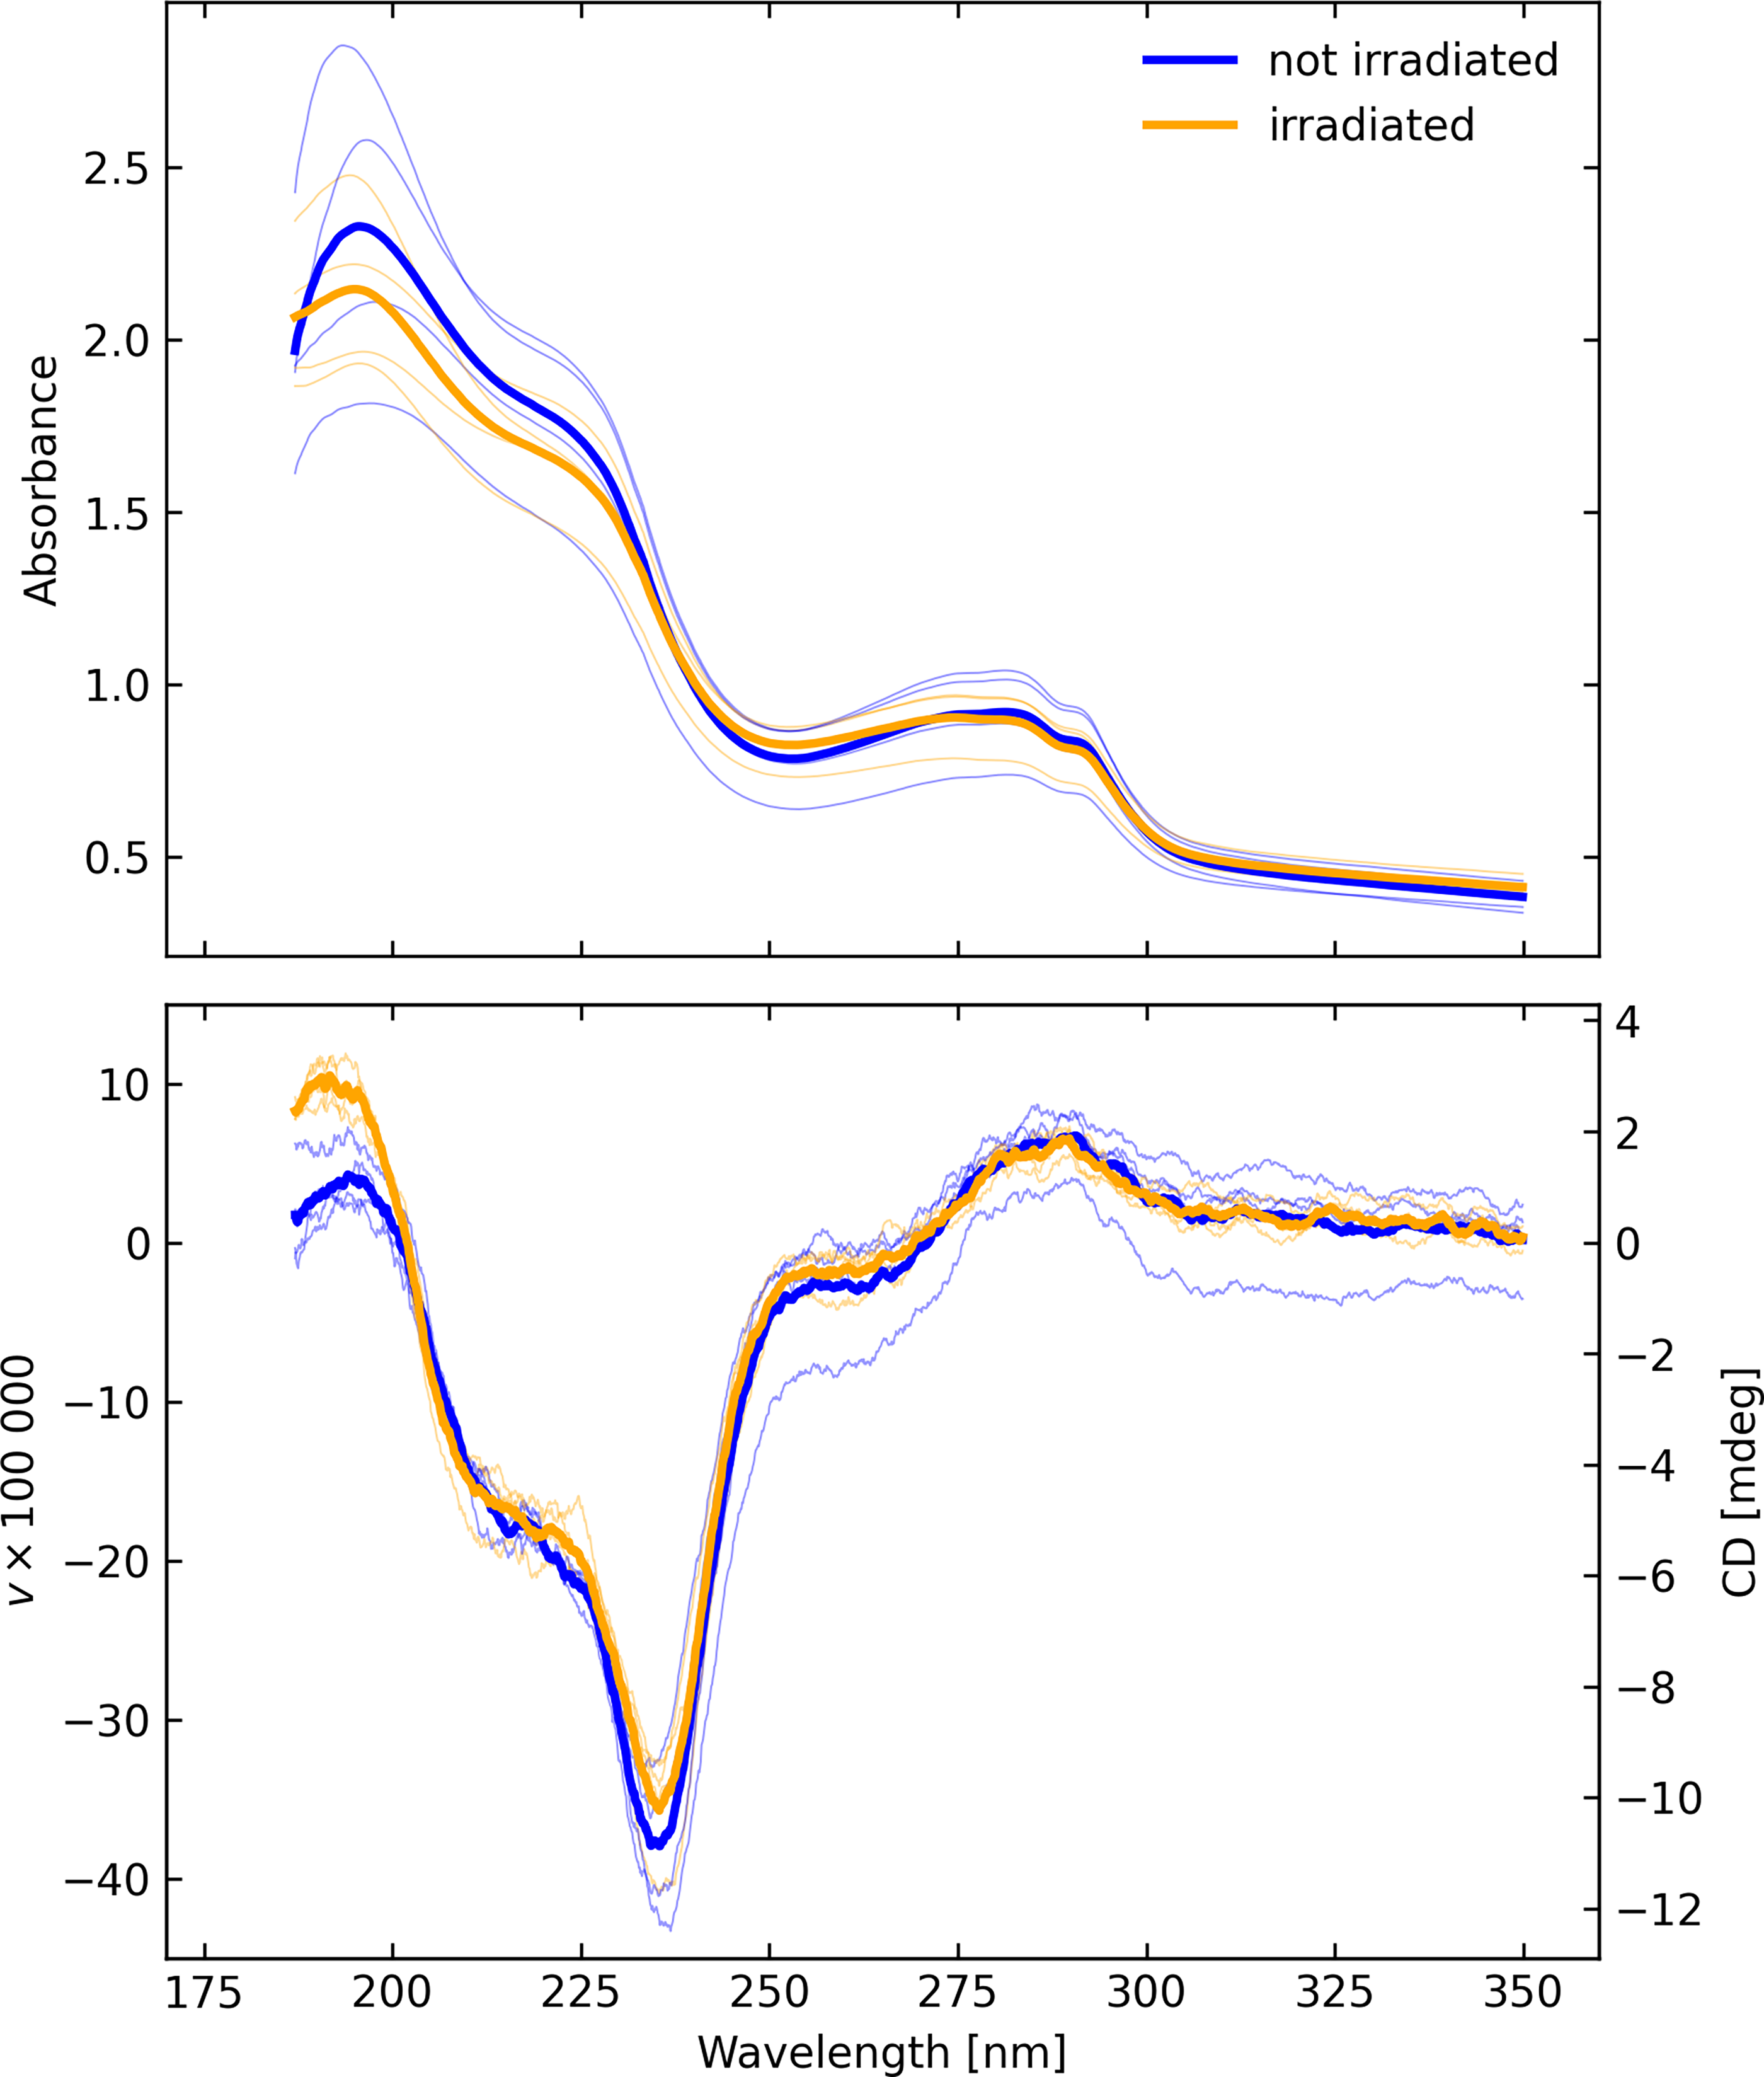
The (upper) absorbance and (lower) CD spectra of A. fulgidus on fused silica before and after irradiation in the Minos chamber, measured in configuration C. The thin curves represent individual scans with different sample rotations, while the thick curves represent averages of those scans.
Standard sample tests
Human serum albumin (HSA) and lysozyme (Lys) were measured on the Jasco J-1500 CD spectrophotometer with the DRCD-575 accessory. There were three dilutions for each (0.1, 0.05, and 0.025 mg/mL), and each were measured three times by using a 2 mm sample cell placed before the integrating sphere, with the Spectralon target at the exit port of the sphere (configuration B). The data were corrected by a factor 1.0479 to account for an empirical offset, which was determined from a 0.6 mg/mL (0.06% solution) of ammonium d-10-camphor sulfonate (ACS) with a 1 cm path length cell. That measurement yielded CD = 181.7 mdeg at 291 nm. The reference value for this wavelength, concentration, and path length is 190.4 mdeg ± 1.0 mdeg. Figure 4 shows the average of the three measurements (each being the average of three scans) for each concentration along with a Savitzky–Golay filtered curve. Figure 4 also shows these values converted to molar ellipticity demonstrating good linearity for wavelength >200 nm with concentration, especially for the HSA samples. At shorter wavelengths, optical depth is high, and nonlinear effects result in minor differences between spectra.
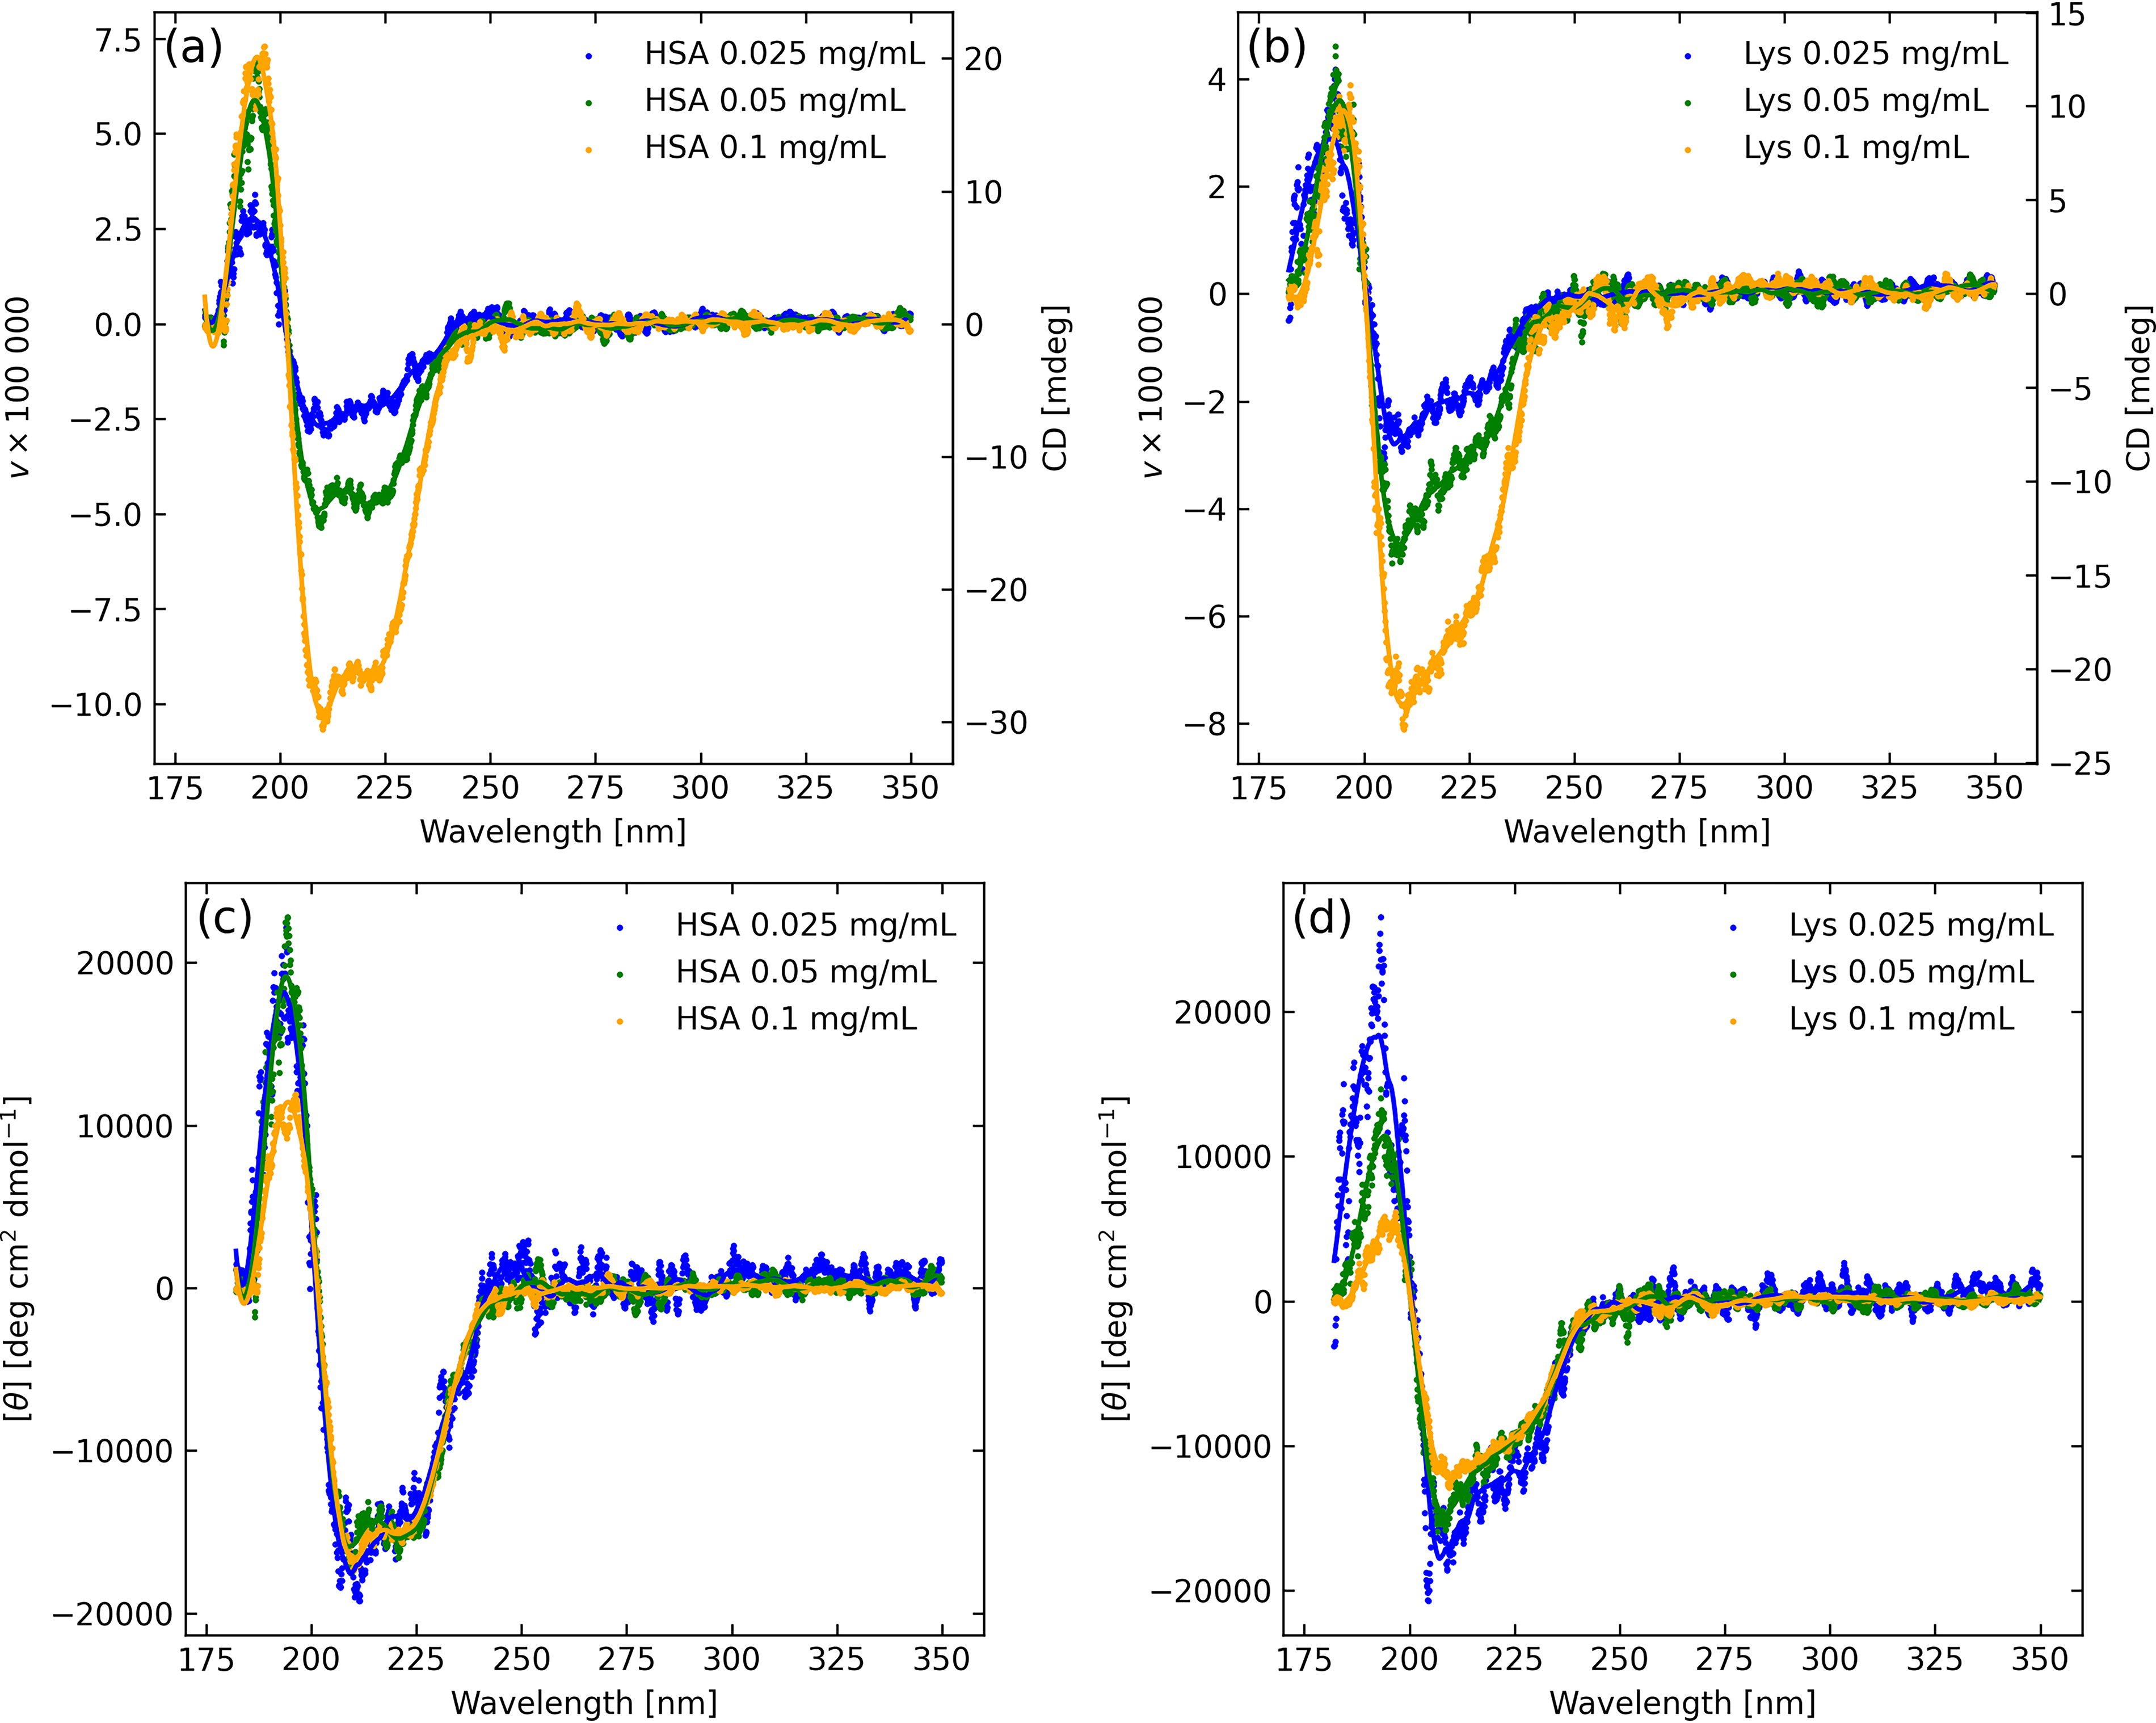
Circular polarization degree (v) of reference proteins, (left) HSA and (right) lysozyme, at different concentrations. Upper row as measured, lower row normalized by dilution and expressed in CD units. Symbols are used for the data and curves are Savitzky–Golay smoothed.
HSA is comprised of 67% α-helices, 10% turns, 23% random coils, and no β-sheets (Mishra and Heath, 2021), with the CD spectrum Figure 4 closely following expectation as given by Figure 1, while human Lys in water at 300 K consists of 44.5% α-helix, 8% β-sheet, and 24% turn conformations (Jafari and Mehrenjad, 2016), differences mostly evident in the region from 210 to 225 nm, and in the more muted α-helix CD profile of Lys.
Figure 5 shows averaged absorbance and polarization spectra of both microbial samples viewed in liquid suspension in transmission mode (configuration C). There is a strong absorption peak at 180–200 nm, and the chiral signatures of α-helix and β-sheet, with the strongest polarization signal in a broad trough between about 200 and 240 nm, with a wing continuing to 280 nm, which suggests that, in these largely intact, albeit deceased, microbial samples, the polarization signature derives primarily from protein secondary structures within the cells. Here, the cell volume density is high, 8 × 10⁸ cells mL−1 would be typical for a biofilm, though the column density governs the CD response, which would depend critically on the experimental setup for practical field application. The optimum signal-to-noise ratio occurs near absorbance of one, and that optimality is a fairly flat function. In these samples, A. fulgidus reaches an absorbance of 2 below 204 nm and <0.5 beyond 234 nm. The C. ferrireducens has absorbance >2 for wavelengths shorter than 192 nm and absorbance <0.5 for wavelengths longer than 250 nm. While we make no attempt to discern the detailed molecular composition of the microbes, given our purpose was to simply ascertain whether any chiral signatures were present, it is nevertheless apparent that the two species have different-shaped UV CD spectra.
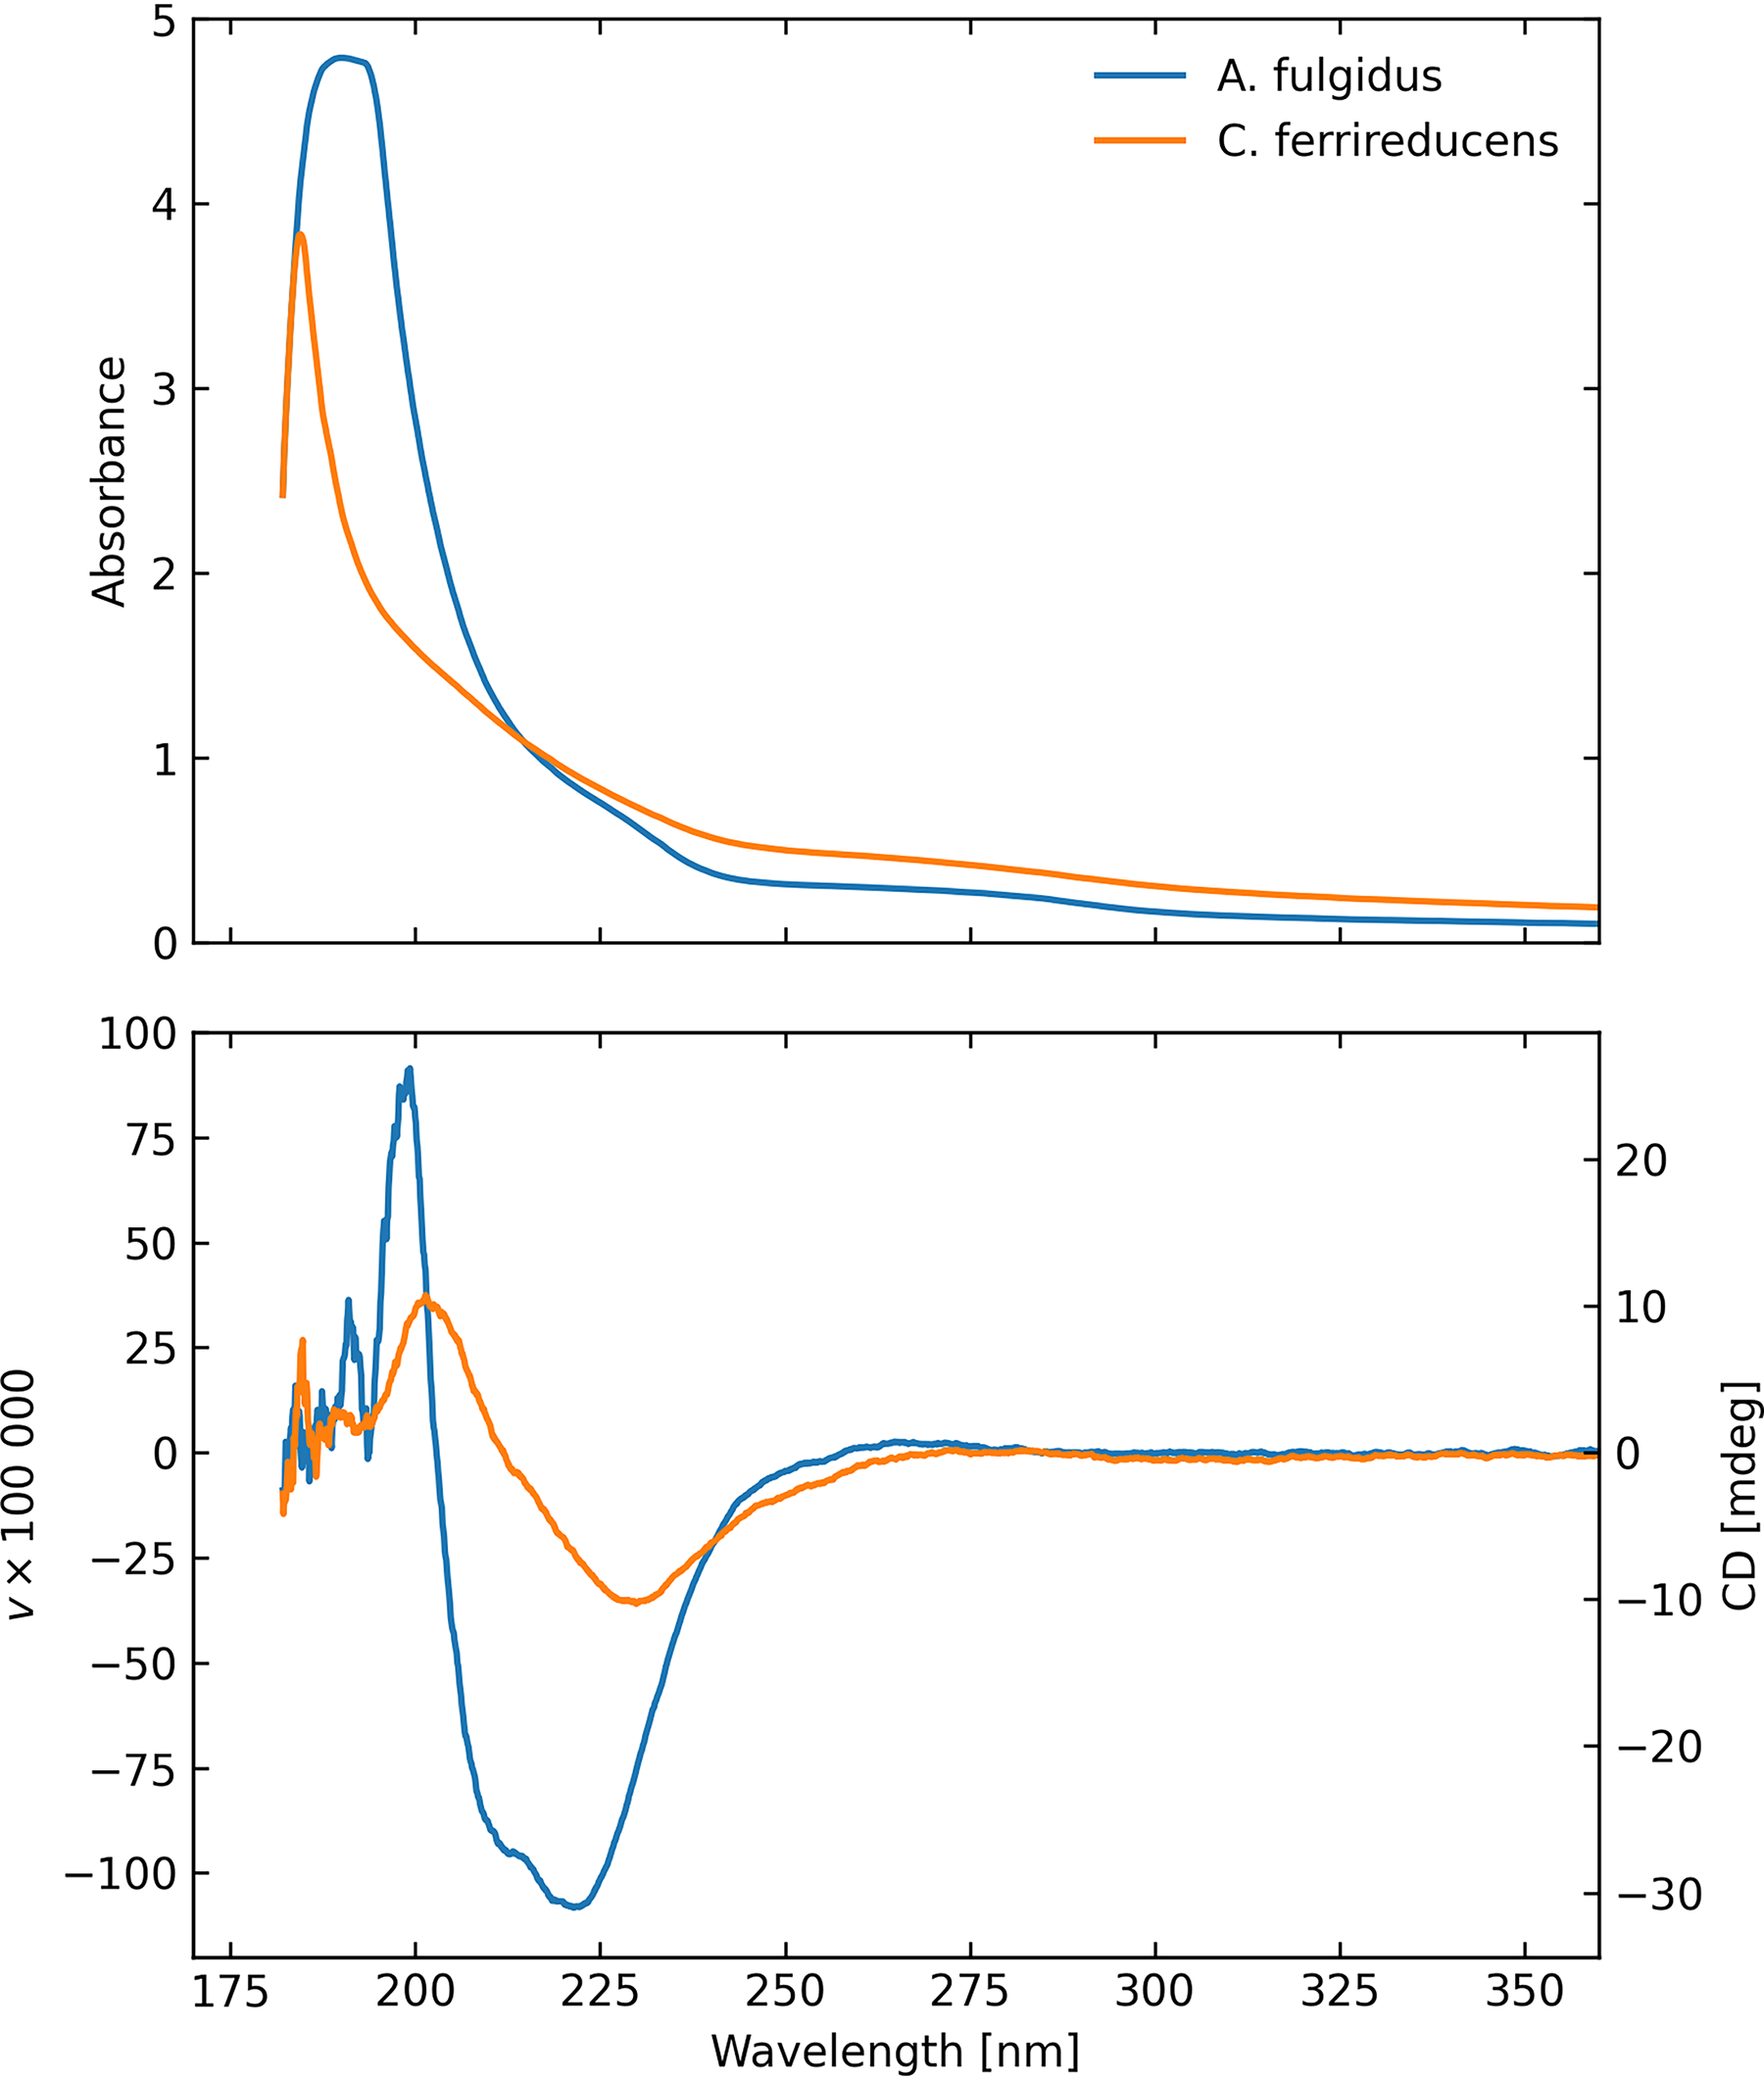
Absorbance (upper) and circular polarization (lower) transmission spectra of aqueous suspensions of the two primary microbial samples, showing strong chiral signatures.
Given the microbial samples were to be irradiated in the JPL Ocean Worlds Lab Minos chamber, which requires deposition onto a solid substrate, we measured the CD signature for microbial samples deposited onto transparent fused silica discs in a solid, dried state to enable a direct “before and after” (irradiation) comparison.
There is a relatively large dispersion in the solid transmission polarization spectra, given a wide range of optical thickness, age, roughness, and uniformity of the deposited samples, and the magnitude of the chiral signature in the solid state is roughly one-tenth that of the liquid suspension prior to deposition. We also measured the solid transmission in configuration C of Figure 1 and indirectly in a diffuse-transmission mode, configuration B, where, after passing through the sample, the incident light beams encounter a spectralon scattering surface before collection by the PMT located at the exit port of the integrating sphere. The overall signal in configuration B is typically somewhat reduced compared with that of configuration C.
Nevertheless, the qualitative shape is consistent between the liquid and solid measurements, when using both the regular transmission mode of the instrument (configuration C) and the diffuse transmittance arrangement (configuration B). Figure 6 shows examples of high-quality spectra of the two microbial samples, C. ferrireducens having the stronger signal in these examples. Note that we are dealing with highly heterogeneous microbial distributions in terms of thickness, age, and roughness of deposition, with cultures that are not expected to have survived exposure to the ambient oxygen-rich environment of the laboratory. Differences in amplitude and the detailed spectral character such as these are to be expected. Figure 7 illustrates the typical diversity of results for the selected configurations.
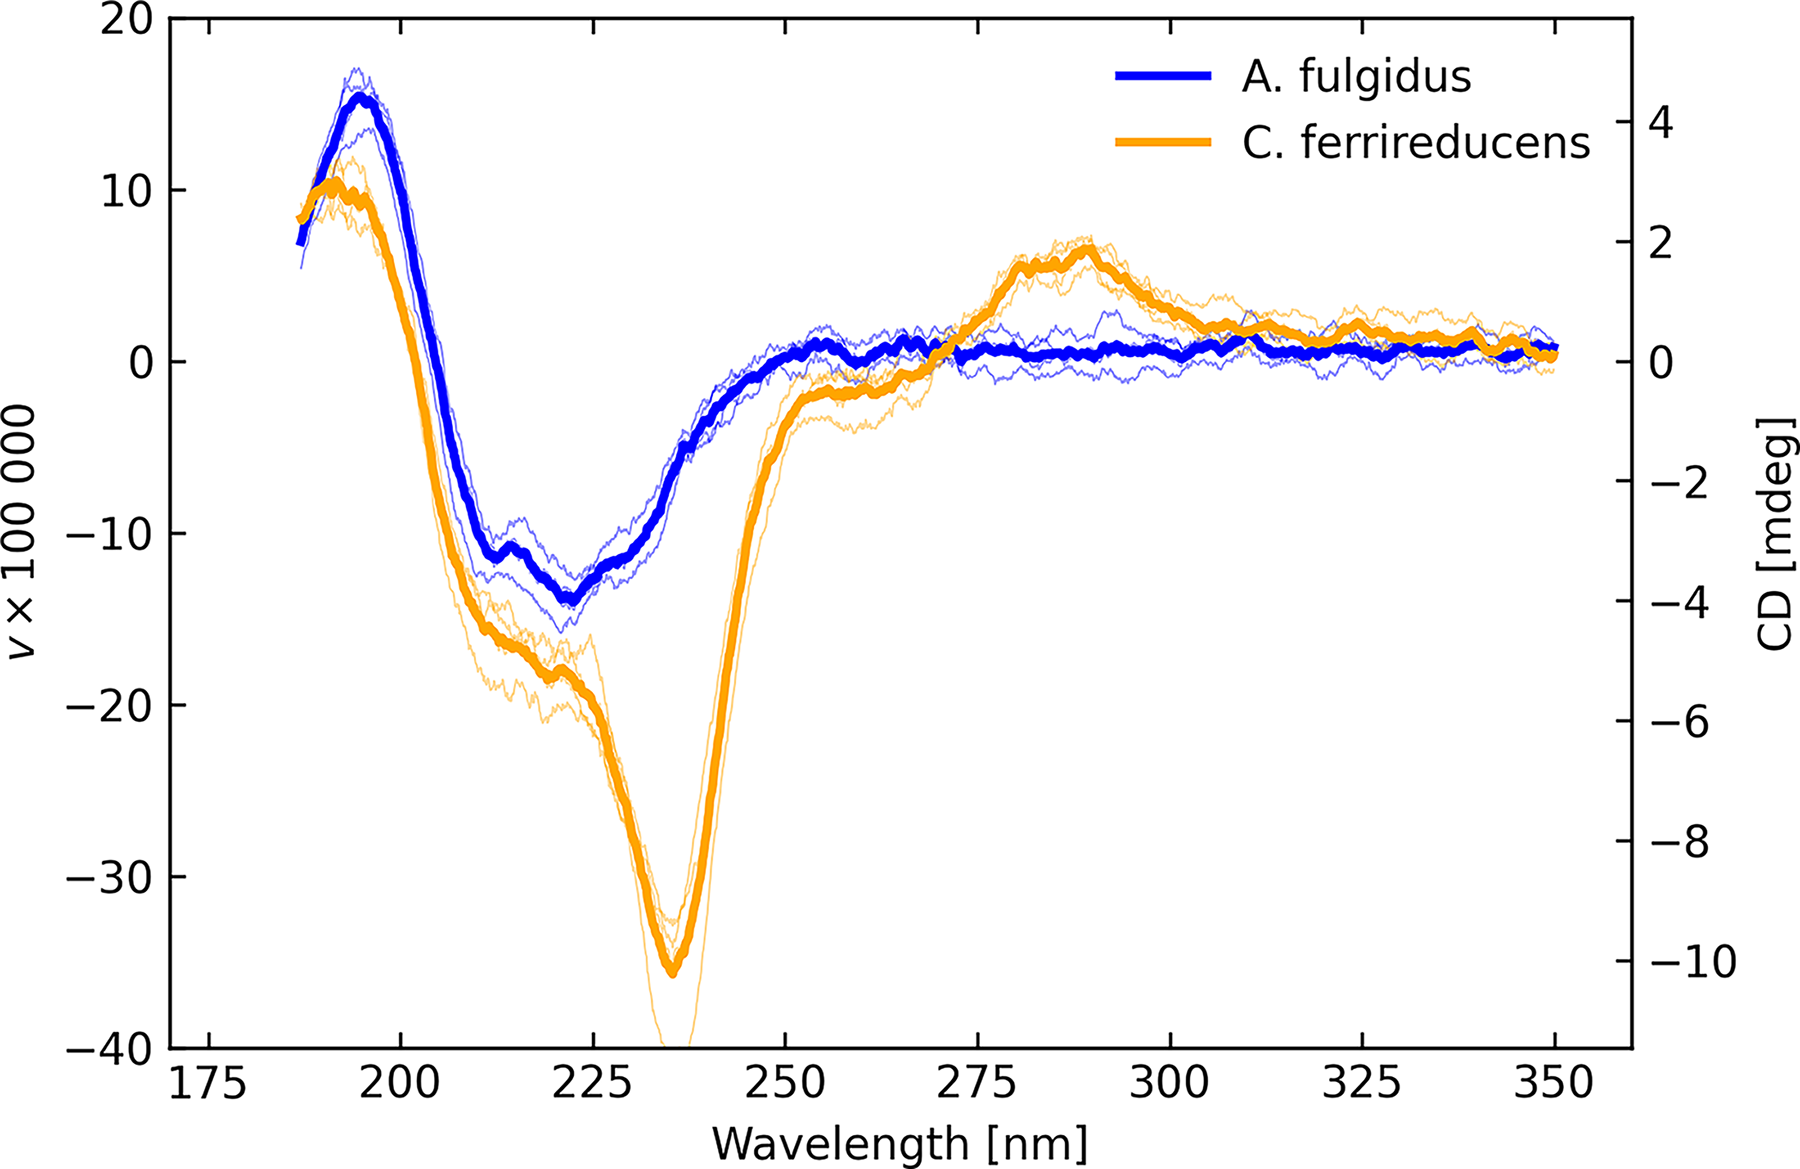
CD solid transmission measurements (configuration C) for high signal to noise scans for A. fulgidus (blue) and C. ferrireducens (orange), with individual scans as lightweight lines and averages as heavy lines.
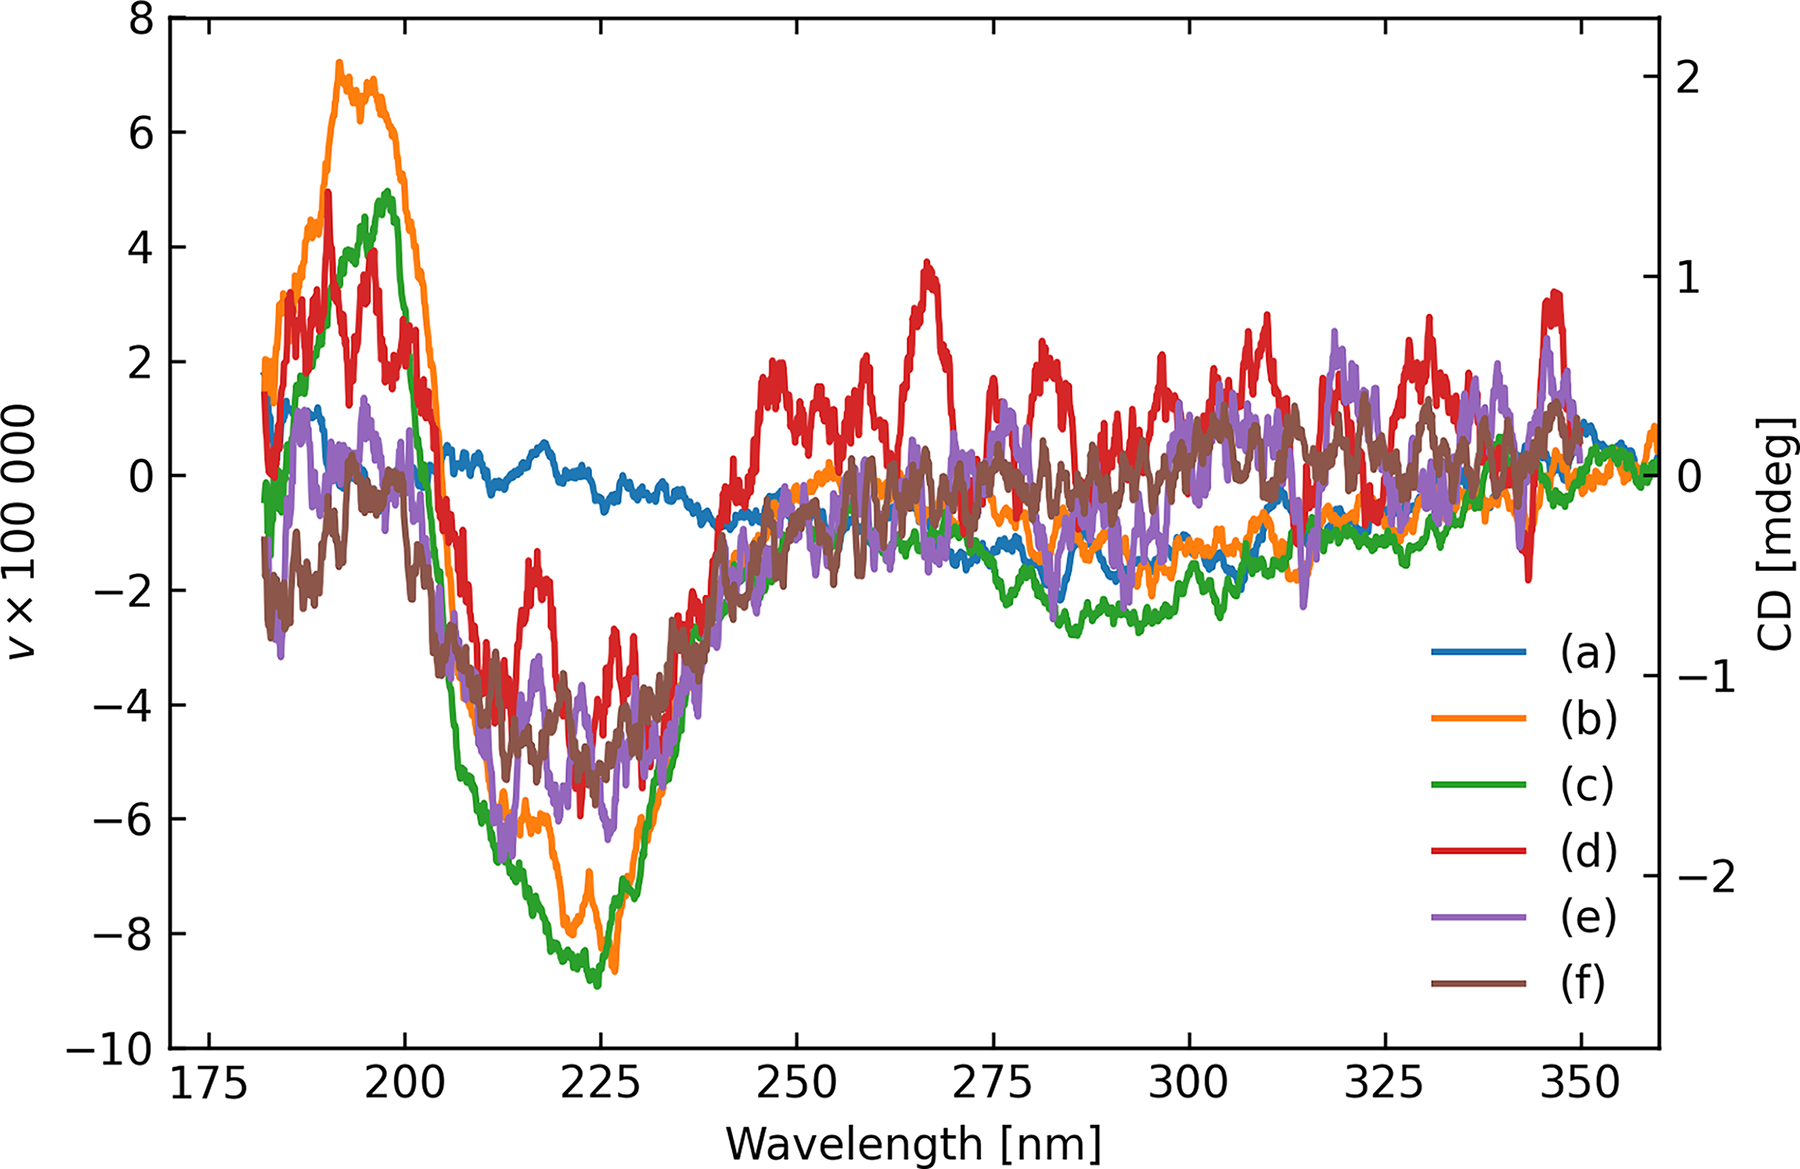
A typical diversity of scans for A. fulgidus on fused silica
Three distinct samples of A. fulgidus deposited onto gold disks were measured multiple times on four separate dates for a total of 14 measurements, and twice on fused silica on two different dates with two different samples, all using configuration A (“DRCD”) of Figure 2. The input beam impinges directly onto the sample, and its diffuse reflectance is captured at the exit port of the integrating sphere with its PMT. A control Spectralon sample was measured on two occasions and a blank gold disk likewise. One sample of C. ferrireducens deposited onto fused silica was measured four times. The plots of Figure 8 show the averages of these measurements. While there is a slow rise in DRCD for the blank gold disk, echoed almost exactly by the microbial sample deposited upon a similar gold disk, the gradual change with wavelength is of a different character to the chiral signatures. The Spectralon sample and microbial samples deposited onto fused silica show no such offset. It is thought that this offset is due to instrumental systematics when the signal is very small. For the samples on fused silica, the mean levels of circular polarization are
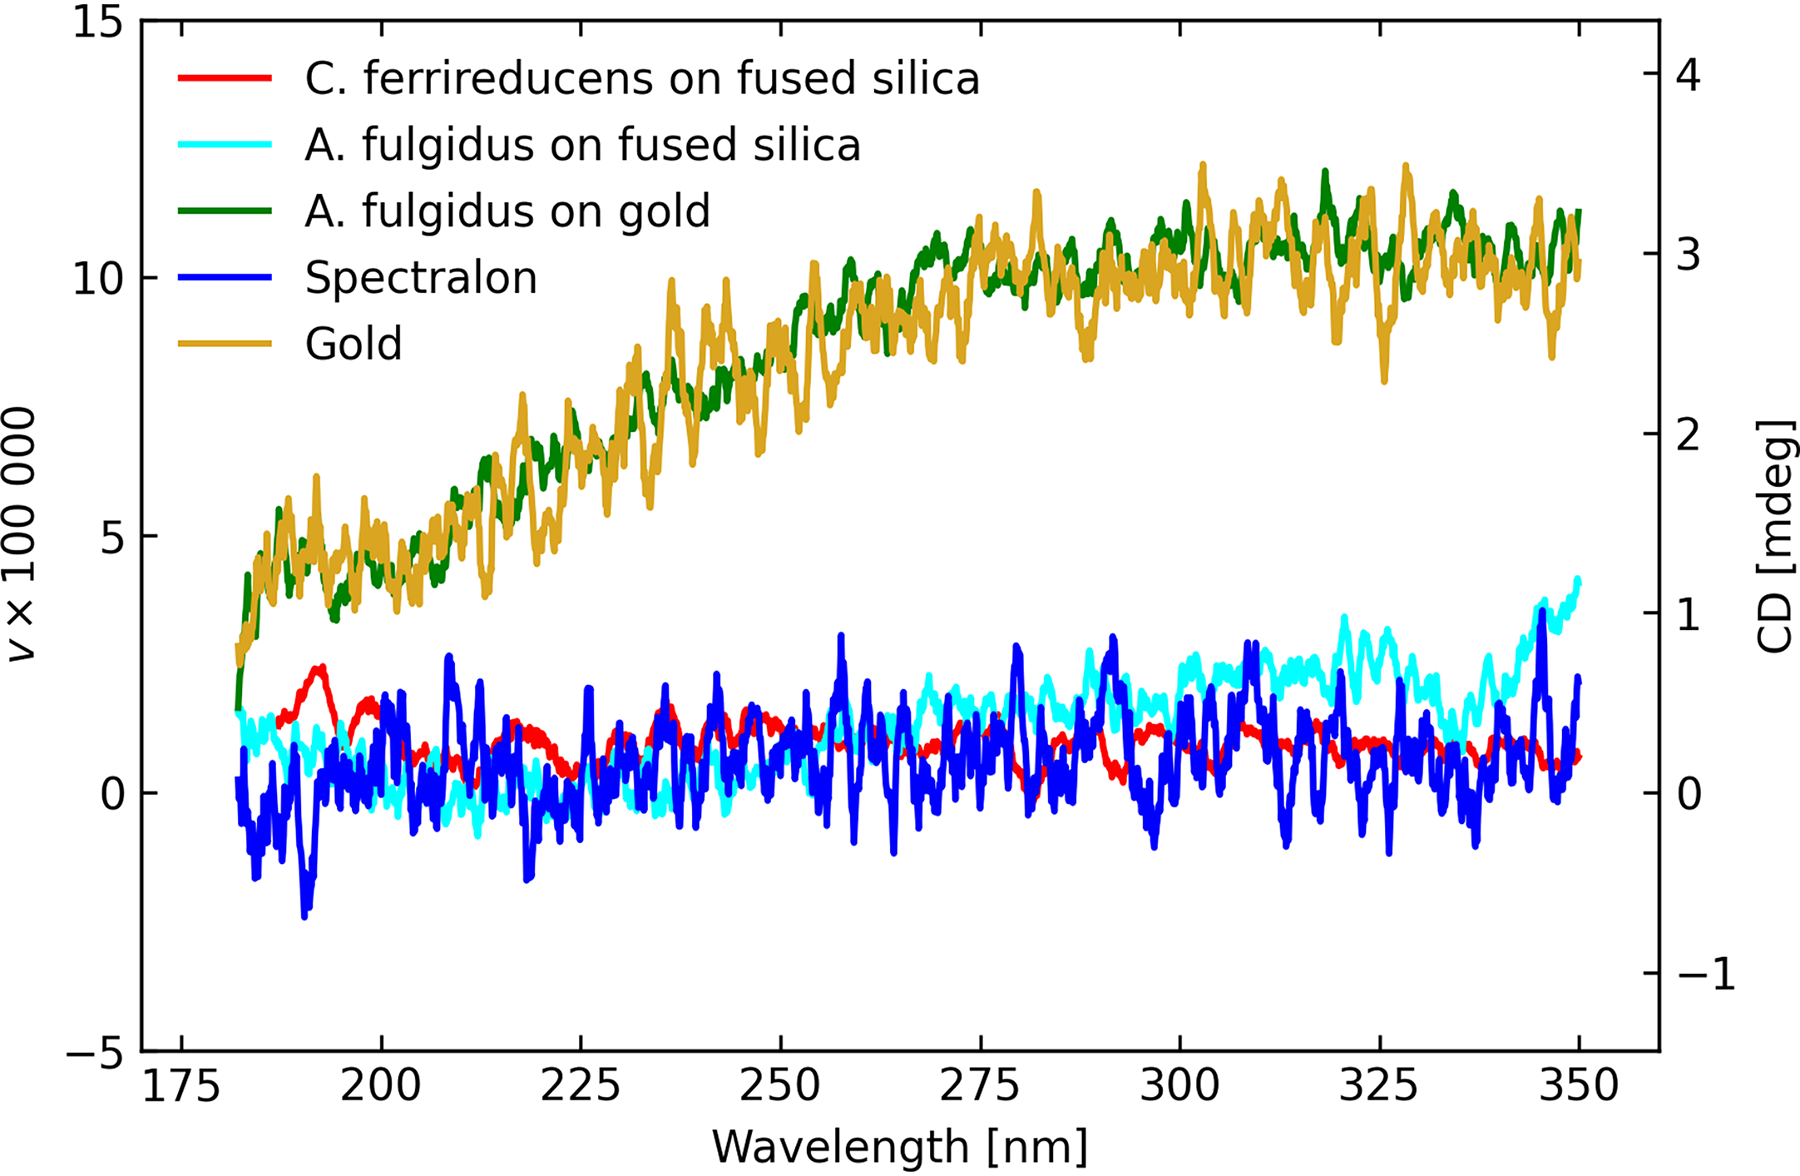
Average DRCD (diffuse reflection) experiment results, as labeled.
We performed DRCD measurements from a sample of powdered material obtained from the Murchison meteorite. The powdered material from the meteorite was loaded in a DRCD cell that had a fused silica window. Figure 9 shows the sample and the DRCD obtained from 180 to 350 nm. Although there is an offset in the DRCD signal of about 0.3 mdeg, the reflectance was very low, and since such a spectrally flat offset was observed for all samples that had low reflectance, this is presumed to be the result of a small amount of cross-talk in the instrument. We conclude that no measurable signal was obtained from the meteoritic sample, which is consistent with our expectations, given that (a) the chiral content of the meteorite is very small and, hence, serves its purpose as an abiotic control and (b) even the chiral samples were found to yield no significant surface reflection signal. We would, thus, not expect a signal from an achiral target.
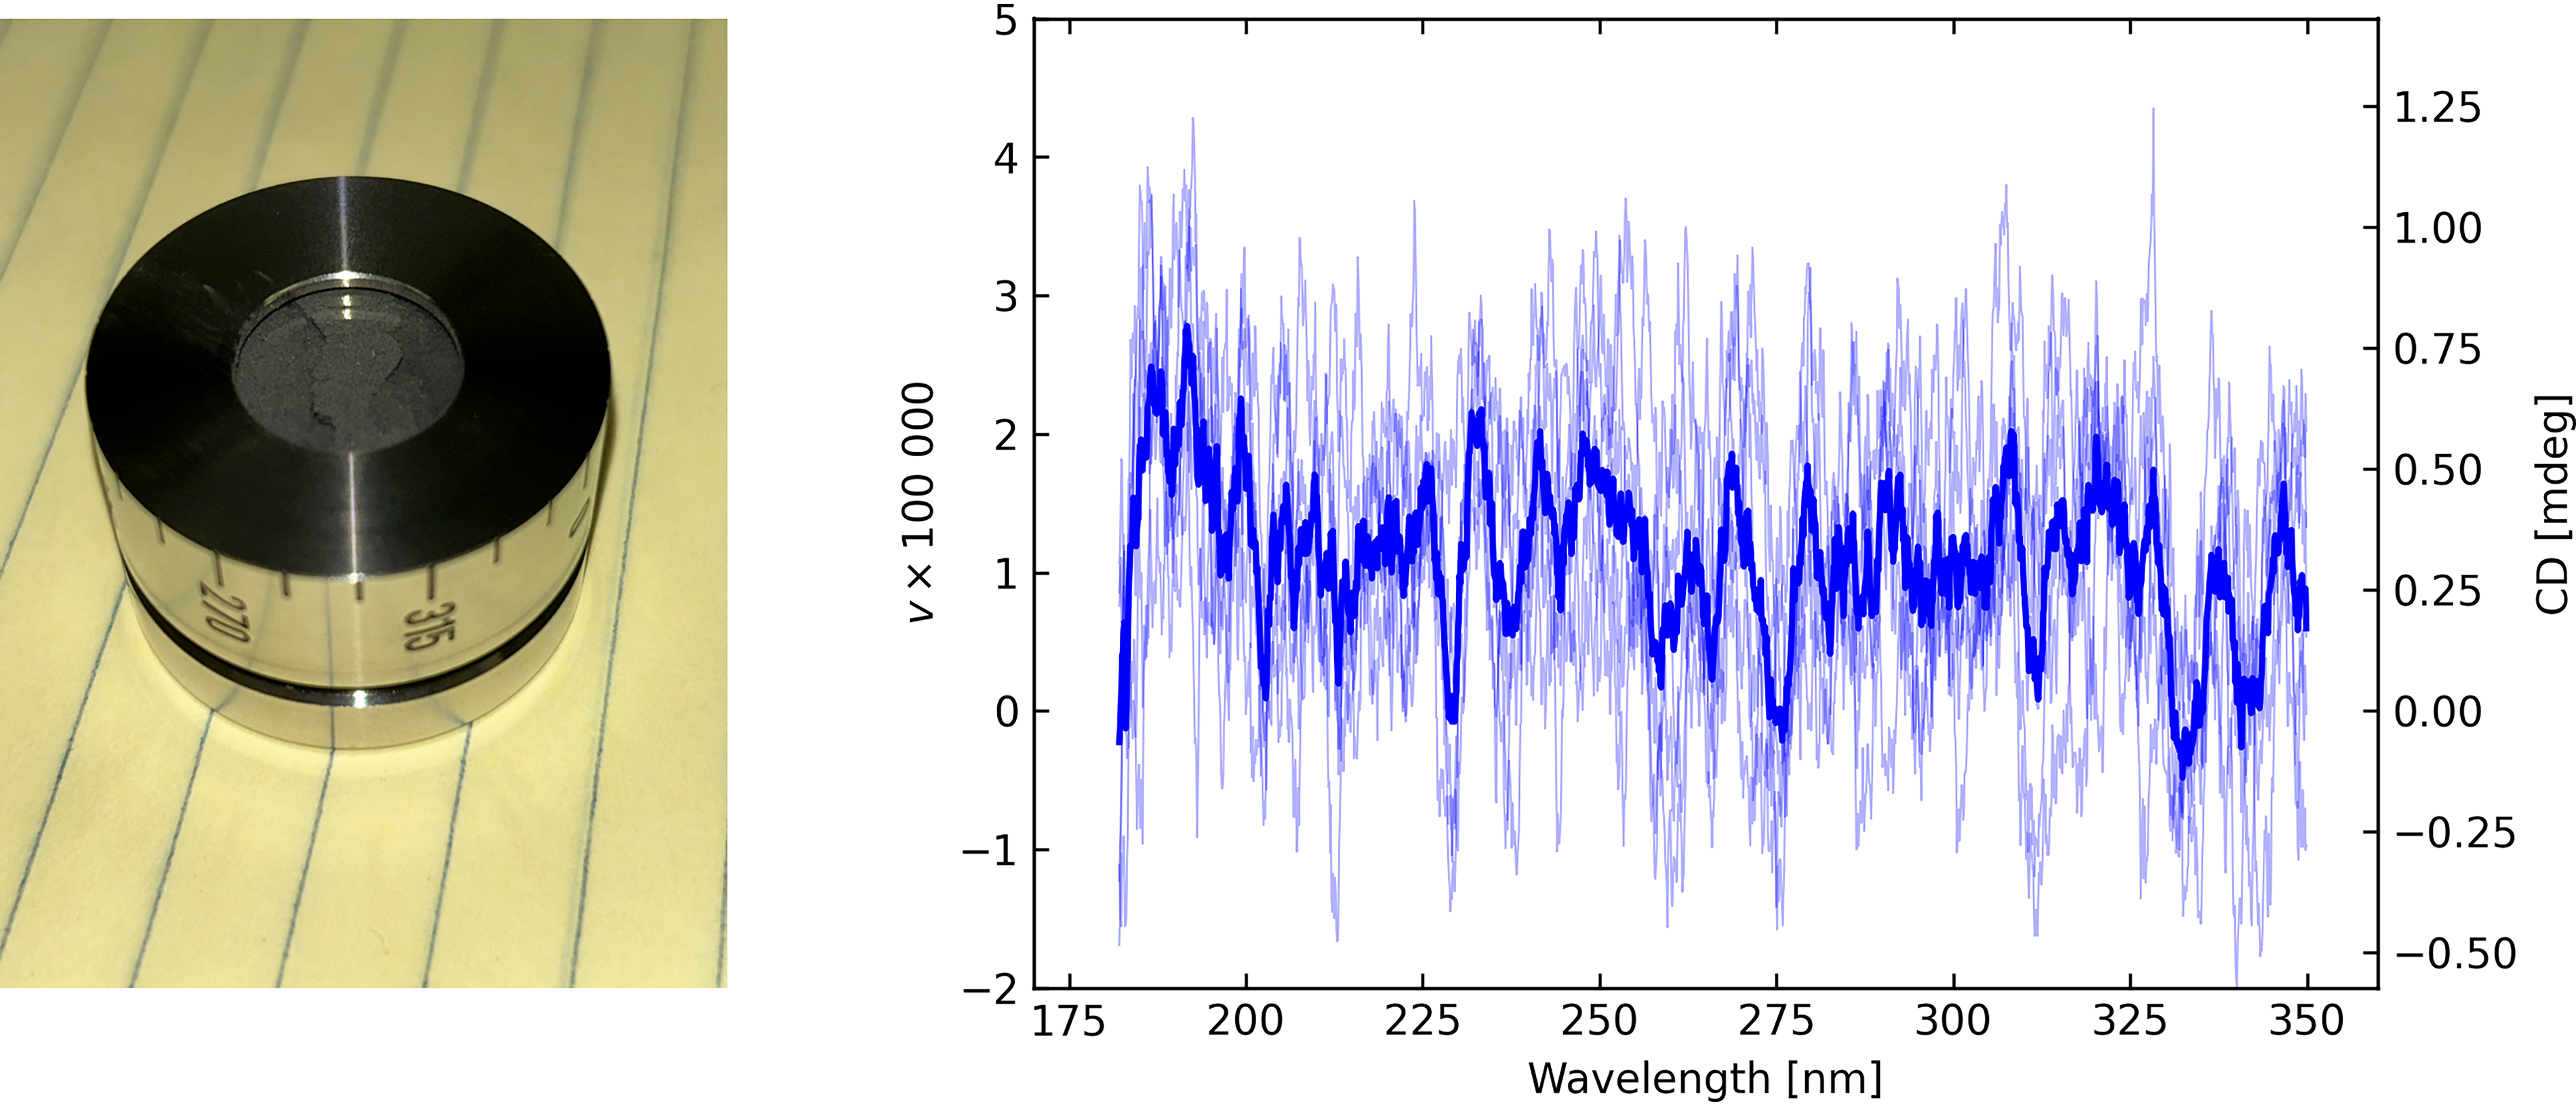
Sample of the Murchison meteorite loaded in DRCD cell with resulting CD spectrum, individual scans as lightweight lines with their average as the thick line.
We prepared thin films of the microbes on fused silica discs, which allowed mounting of samples into the Europa simulation Minos chamber at JPL. Following exposure in the chamber to an ultra-high vacuum (approximately 10−8 Torr), a 100 K cryostat temperature, and irradiation with 10 keV electrons at 500 nA cm−2 for 2 h, the microbial samples were returned to NIST for remeasurement of their circular polarization far UV spectra. Two hours of irradiation under these conditions in the chamber is equivalent to approximately 1 month on the europan surface in a region where the radiation is most intense, such as the equatorial region of the trailing or leading hemispheres.
The A. fulgidus sample shown in Figure 6 (measured 28 April 2023) on fused silica was delivered to JPL for processing in the Minos chamber (returned 7 July 2023) and remeasured in the subsequent days. The polarization signal after exposure to simulated europan conditions was reduced by approximately a factor 6, but the absorbance was reduced by only a relatively small amount, approximately 9% (Fig. 3). A small chiral signal, however, persisted, and the shape of the polarization spectrum remained essentially the same with the strength of the negative feature between 205 and 255 nm decreased by a factor of approximately 5.8. Note also the loss of absorbance at approximately 260 nm, the spectral region where RNA/DNA absorb most strongly or radiolysis of aromatic components of amino acids can occur.
To attempt to quantify the protein concentration of the untreated suspension (after elution from a thin layer) and the suspension recovered by elution of the chamber-treated silica disc, we used the two methods of protein assay described in Section 2. The protein assay measurement for the irradiated sample yielded a significant level of protein concentration at 9.37 mg/mL, similar to the preirradiation level. In other words, chamber irradiation produced an inconsistently high yield of protein after elution from the dried film, which was likely to be the result of radiation-induced modification or breakage of proteins in the chamber. This, however, confirms that there was still protein material present after irradiation.
We hypothesize that the CD changes were due to the destruction of fragile aromatic amino acids that, in turn, resulted in the loss of protein secondary structure, which contributed most to the CD signal, whereas more resilient amino acids involved in protein chemistry persisted.
The C. ferrireducens polarization signal was strong (Fig. 10), and following exposure in the Minos chamber with the same exposure, vacuum, temperature, and radiation dose as for A. fulgidus, the remeasured sample was essentially unaffected, within the natural dispersion of the measurements. Exposure to the ultra-high vacuum, cryogenic temperature, and intense radiation had little, if any, effect on the circular dichroism. This behavior is in sharp contrast to that observed with A. fulgidus.
The (upper) absorbance and (lower) CD spectra of C. ferrireducens on fused silica before and after irradiation in the Minos chamber, measured in configuration C. The thin curves represent individual scans with different sample rotations, while the thick curves represent averages of those scans.
We speculate that this apparent resilience to extreme hostile conditions is due primarily or in part to a geometrically thicker layer; the optical thickness was certainly much higher by approximately a factor 10. Its mean absorbance over the strong CD feature from 205 to 255 nm is approximately 1.4 compared with 0.4 for A. fulgidus. To obtain a metric estimate of the layer thickness, the fused silica disc with its layer of C. ferrireducens cells from a high-temperature, anaerobic culture, which had been exposed to the simulated europan conditions, was studied by using fluorescent microscopy. It is possible, though deemed less likely, that other factors could have influenced the absence of degradation after exposure to the hostile Europa-like environment such as shielding of the sample by frost or charge build-up.
After spectral analysis for circular polarization in the near and far UV wavelength range (Fig. 10), the cellular layer was visualized under a Leica SP8 confocal microscope (Fig. 11). Optical sectioning indicated that the deposited cell layer was 63–65 µm thick and a significant fraction of fragmented cellular debris was evident. It would seem plausible that the electron penetration depth for this microbial sample was not significant relative to the sample thickness, due to either the different physical thicknesses or potentially related compositional differences between the two microbes.
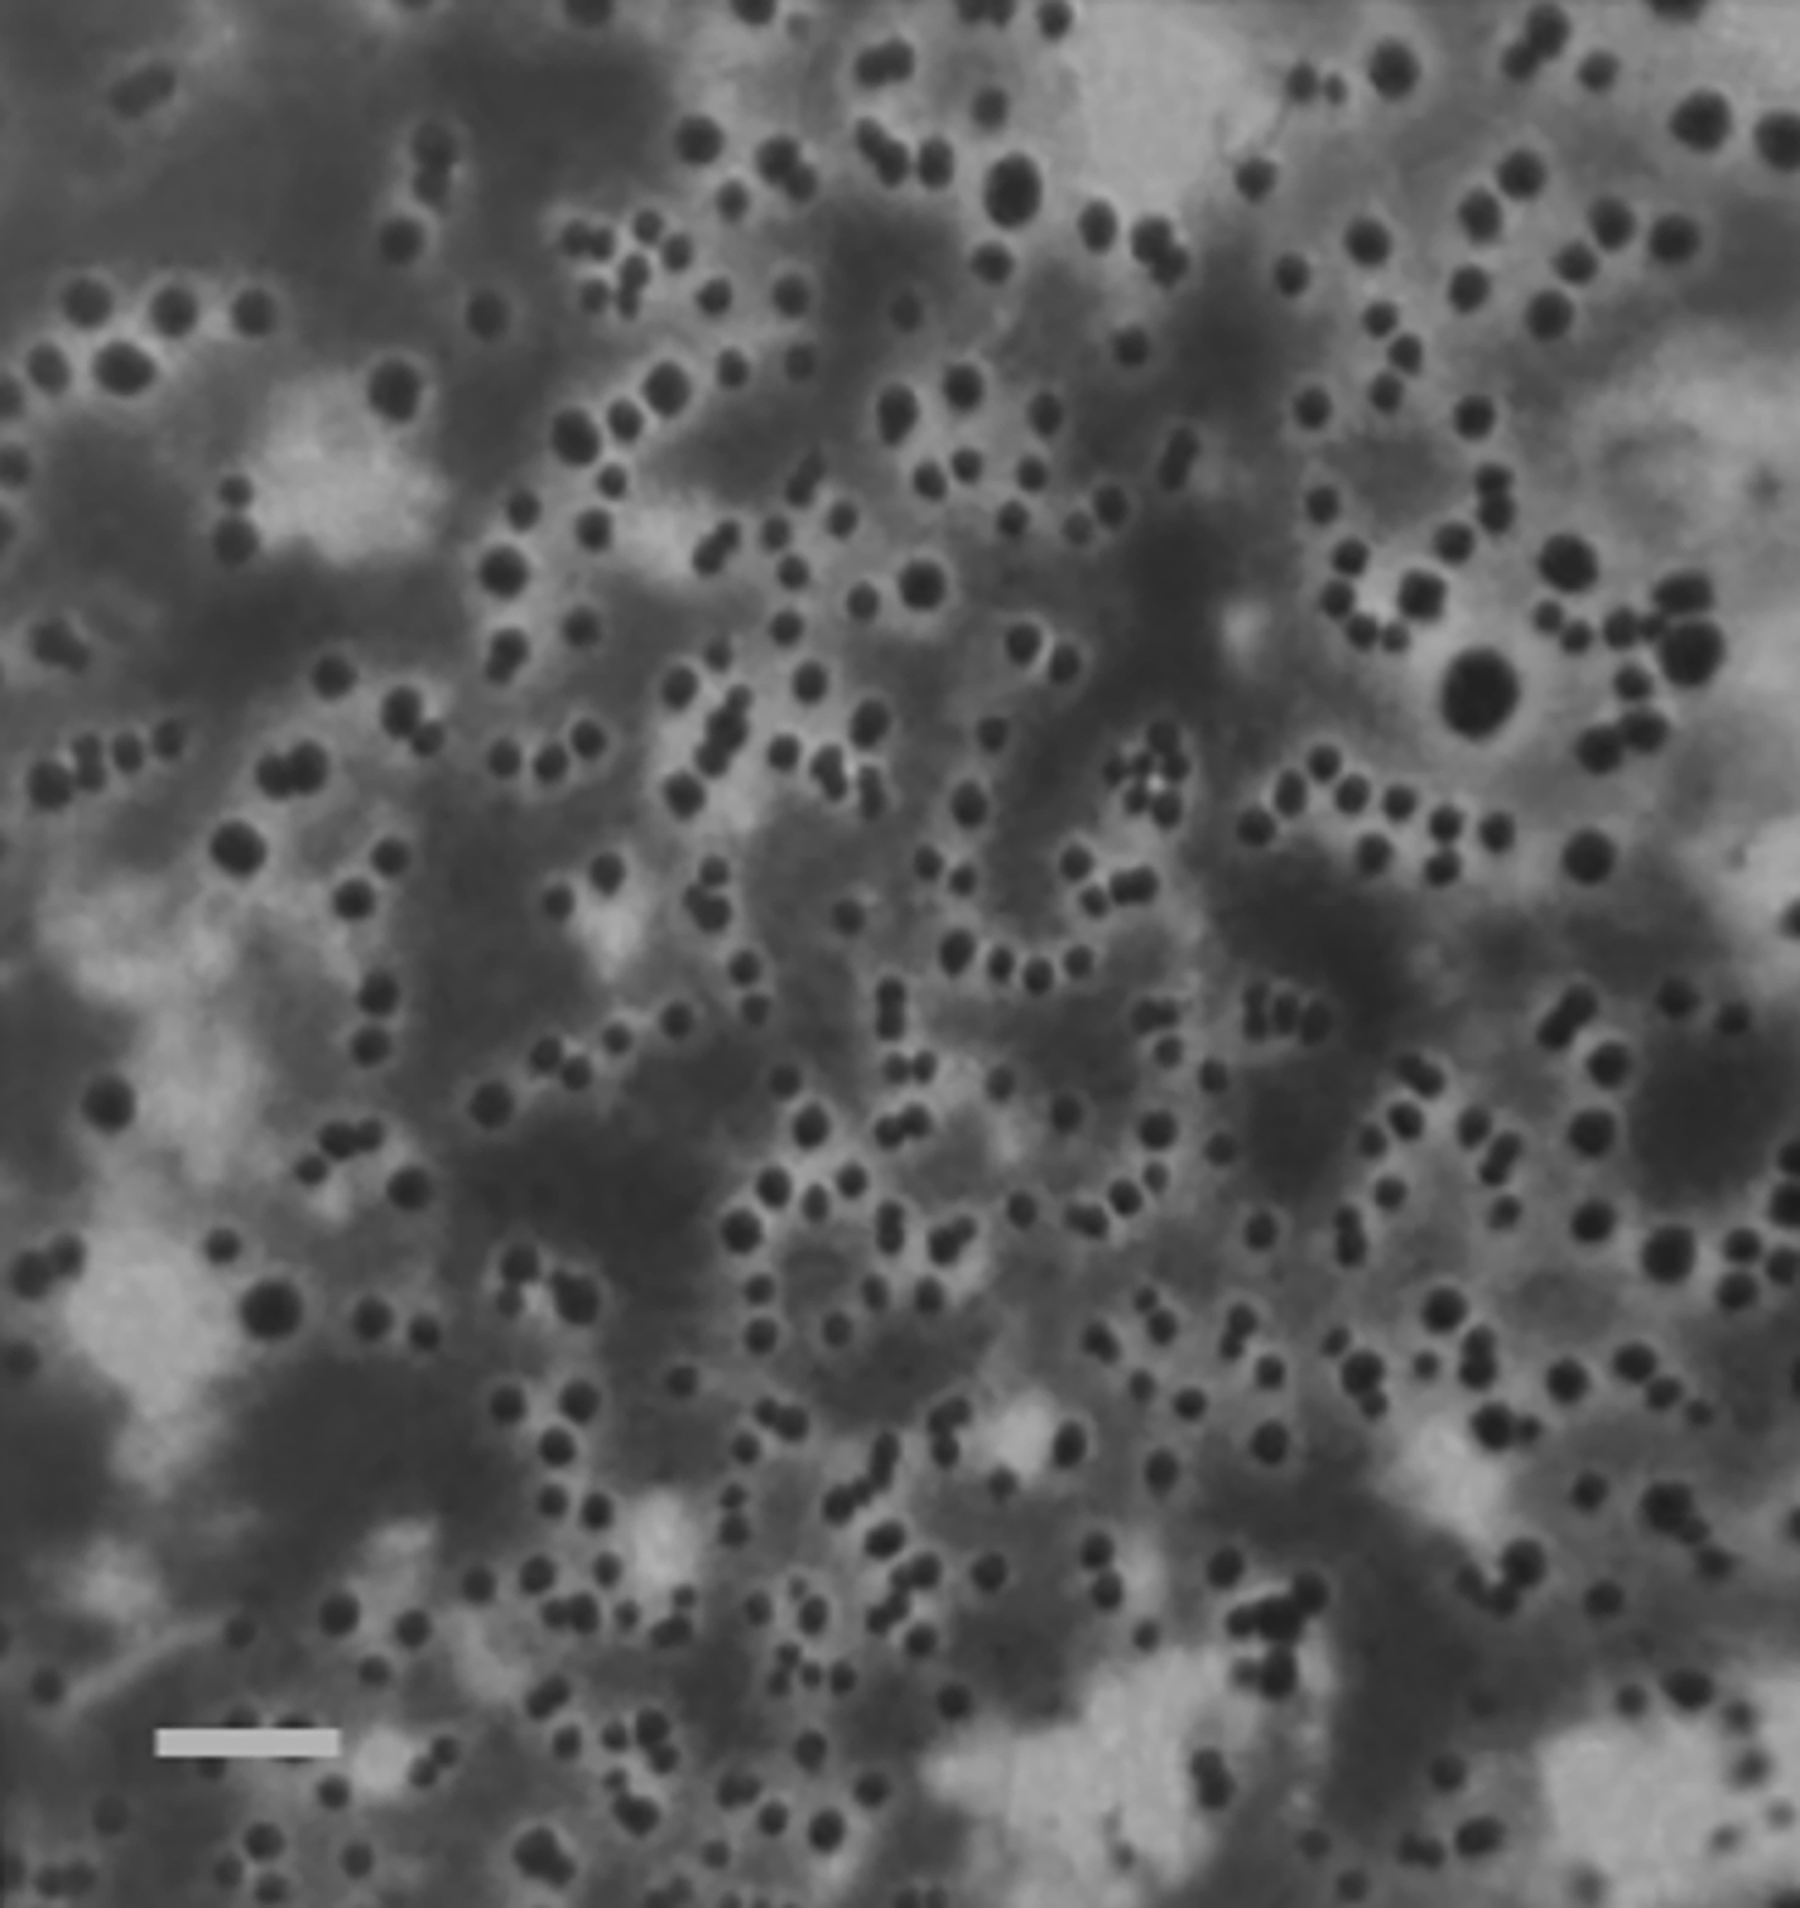
C. ferrireducens viewed under a Leica SP8 confocal fluorescence microscope. Bar represents 1 µm.
The results presented here are for only two select organisms under controlled laboratory conditions. Extrapolation to a variety of ocean world surface conditions, for example, variations in temperature, depth below the surface, radiation type, and specific compounds (Nordheim et al., 2018; Gerakines et al., 2012), will require coupled experiments and models. Critically, when considering the radiolytic processing of material on the surfaces of ocean worlds, the density of the material is a key determinant of the depth and extent of processing. Microbial cells have a density of ∼1.1 g cm−3 (Loferer-Krössbacher et al., 1998), but when desiccated, as might occur on the surface of an airless body, the density could increase significantly. Much of the available modeling work has been conducted for unit-density ice. To truly understand the persistence of CD after irradiation, models must account for such density differences along with other factors well beyond the scope of the current work.
With the 2017 Europa Lander SDT report (Hand et al., 2017), NASA established a “design reference” to quantify and compare the sensitivities of life detection instruments. The design reference material describes 0.2 µm diameter microbial cells at a concentration of 100 cells/mL, which is more dilute than microbial cells found in oligotrophic (nutrient-poor) ocean waters on Earth. A typical E. coli cell, which can be as small as 0.25 µm in diameter, contains about 2.3 × 10⁶ proteins per cell (Neidhardt, 1987). Using the Europa 100 cells/mL concentration and a sample volume of 5 mL, this equates to about 1.15 × 10⁹ proteins. Given a suitable in situ optical cell design, 100% of these proteins can be analyzed; for example, a microfluidics pore of 100 µm diameter and length 1 cm would yield a volume density of 1.5 × 10¹³ proteins/cm3; hence, if proteins are approximately 2 nm diameter, the column covering factor exceeds unity and is within 5% of the optimal absorbance A ≈ 0.9 for circular dichroism laboratory experiments. Since the polarization signature is closely related to the CD (Appendix), its amplitude will be comparable and potentially tractable for future Europa life searches.
It has also been conjectured that chains of peptide bonds in Enceladus’ plume deposits could yield an observable far UV signature (Winebrenner et al., 2023). A polarization measurement of such a spectroscopic feature could unequivocally identify a strong chiral excess, indicative of a biological origin. Plume deposits on Europa would likely also preserve chiral enantiomeric excesses given a stronger gravitational retention. On a more ambitious scale, the analog of a transmission experiment could be envisaged for back-lit configurations of the continuously active Enceladus plumes.
Species like A. fulgidus and C. ferrireducens with biomineralization potential are candidates for model microbes for deep ocean europan or martian geological scenarios. Our choice of these microbes for this study reflects a combination of chemosynthetic metabolic pathways that can be implied from existing planetary studies, which suggests that geothermal microbes could exist on Mars. In particular, serpentinization produces magnetite, hydroxide, and serpentine minerals, and liberates molecular hydrogen, a ubiquitous source of energy and electrons that can be readily utilized by a broad array of chemosynthetic organisms (Schulte et al., 2006). Bristow et al. (2015) suggested that enriched levels of magnetite in the Sheepbed mudstone at Yellowknife Bay, Gale crater, Mars, might be a preamble to the formation of clay minerals, which could lead to lithification. Thus, biogenesis of magnetite exhibited by C. ferrireducens could be relevant to the formation of more evolved strata of serpentinite minerals. Schwenzer et al. (2012) suggested that hydrothermal activity is a likely cause of the formation of clay minerals in a period in Mars’ history >3.7 Ga when conditions may have been wetter and warmer than today. These inferences support the notion that our choice of strains could lead to biomineralization via magnetite formation. Ruff et al. (2020) suggested that the sediments at Home Plate in the Columbia Hills of Gusev crater, Mars, are compatible with a model for generation of volcanic hydrothermal systems with both hot spring/geyser and fumarolic activity with S-rich materials, which could be host to a thermophilic sulfate reducer such as A. fulgidus.
Conclusions
With mission-relevant chemoautotrophic microbes, we have demonstrated distinctive UV chiral signatures when measured with transmission spectropolarimetry, as in a classical circular dichroism protein experiment. Polarization and spectral absorption features are strongly evident at wavelengths expected for protein secondary structures and other biochemicals, which comprise the internal constituents of the microbes.
When viewed in reflection, we obtained a null result: that is, deposited microbial samples did not yield a detectable chiral signature. This may have been due to surface scattering overwhelming the chiral signal, coupled to lower signal-to-noise, or the phase reversal of polarization on backward scattering (from the sample, not the substrate). This argues against the use of far UV spectropolarimetry as an effective remote sensing method for detection of microbial homochirality, except potentially for back-lit plumes as mentioned in the discussion.
Following exposure to Europa-like surface conditions within the JPL Ocean Worlds Lab Minos chamber, one microbe preserved a small chiral signature (A. fulgidus), while the other (C. ferrireducens) appeared unaffected and retained a large, strong signature. The latter is likely due to a geometrically and optically thicker sample, potentially related to their different compositions, which led to lower electron penetration depth relative to the sample thickness. We infer that the far UV chiral signatures of a relatively modest sample of microbial material can survive the hostile environment of Europa—cryogenic temperature, ultra-high vacuum, intense radiation—for a significant amount of time, which offers optimism for in situ measurements geared toward life detection that employ chirality as a biosignature.
Control measurements of the Murchison meteorite, which is known to contain a very small amount of chiral biochemical building blocks, exhibited only a null result, as expected. This, too, is encouraging in that, at least in this case, spurious chiral signatures did not arise from a biochemically “contaminated” abiotic mineral extraterrestrial sample.
The analysis presented herein indicates that, for a carefully developed transmission experiment, far UV circular dichroism signatures abound even for microbes that are badly degraded, nonviable, and under certain conditions, persist even following exposure to an exceedingly harsh Europa-like environment. Indeed, a previous study reported by Hand et al. (2009) also found that helical (chiral) biological signatures persisted for bacteria after irradiation in the JPL Ocean Worlds Lab simulator when studied in the mid-infrared spectral region.
Footnotes
Disclaimer
Certain commercial equipment, instruments, or materials are identified in this article to foster understanding. Such identification does not imply recommendation or endorsement by the SETI Institute, the
Author Disclosure Statement
No competing financial interests exist.
Funding Information
This work is supported by NASA ROSES exobiology award 19-EXO19-0054, 80NSSC20K1088. A portion of this research was carried out at the Jet Propulsion Laboratory, California Institute of Technology, under a contract with the National Aeronautics and Space Administration (80NM0018D0004).
Appendix
Associate Editor: Christopher P. McKay