



Abstract
While a large body of research exists regarding the role of industry money on roll-call voting in the U.S. Congress, there is surprisingly little scholarship pertaining to industry influence on state politics. This study fills this void in an analysis of campaign donations and voting during passage of Act 13 in Pennsylvania during 2011 and 2012. After collecting information about natural gas production in state legislative districts, we estimate a series of multivariate models aimed at uncovering whether campaign donations contributed to a more favorable policy outcome for industry. Our findings indicate that campaign donations played a small but systematic role in consideration of the controversial legislation, which represented one of the first and most important state-level regulatory reforms for the hydraulic fracturing industry.
Keywords
Introduction
On February 18, 2012, Pennsylvania Governor Tom Corbett (R: Republican) signed HB 1950, a piece of legislation decried by state environmentalists as “the most important environmental legislation of the last decade” and “a significant step in the wrong direction” (Pennsylvania League of Conservation Voters 2012, 2). The law, a major reform designed to regulate Pennsylvania’s booming natural gas industry, contained numerous controversial provisions. Among them were constraints on the legal authority of local communities to subject the hydraulic fracturing (“fracking”) industry to restrictive zoning ordinances, and the imposition of a 1% “impact fee” environmentalists considered too lenient. Reaction to the legislation was strident and partisan; a December 2011 letter to the editor of the Philadelphia Inquirer was typical in its assertion that “. . . in exchange for campaign donations, the Republicans have made their unfettered support for the gas-drilling industry crystal clear.” 1 In defense of his acceptance of campaign contributions from the natural gas industry, State Representative Bryan Ellis (R) insisted he was not influenced by campaign donations but conceded “. . . if you are asking if no one across the board is influenced that’s unrealistic. It’s unrealistic to say that nobody is influenced by money” (Yerace 2011).
Although assumptions about the corrupting influence of campaign donations are commonplace among journalists and ordinary citizens, the scholarly consensus has been much more tentative. In a review of scholarship investigating the relationship between campaign donations and roll-call voting in the U.S. Congress, Ansolabehere, de Figueiredo, and Snyder (2003) found only about one in four studies uncovered a relationship between campaign money and voting behavior. And of those that did find a relationship, many did not account for inferential threats arising from endogeneity or failed to account for constituency influence.
Scholars also offer competing accounts about the motivations of campaign donors. Some regard industry involvement in the political process as a form of narrowly self-interested rent-seeking (Welch 1974), while others view campaign contributions as a consumption-oriented form of political participation (Snyder 1992). Other evidence suggests campaign giving is primarily motivated by a desire to shape the ideological composition of legislatures (McKay 2010). Thus, scholars lack a consensus about why industry and interest groups give money to candidates, and how much their donations impact the political process.
With a few notable exceptions (Lewis 2013; Powell 2012), most scholarly attention to the role of campaign money on lawmaker behavior has focused on the U.S. Congress. In contrast, this study analyzes one piece of legislation enacted in a single state legislature, focusing on two core unresolved puzzles in the scholarly literature. First, were campaign contributions from the natural gas industry strategic? Second, did campaign contributions influence roll-call votes?
Study of a single case is necessarily limited in terms of the generalizability of its conclusions. However, for several reasons, HB 1950, or “Act 13” as it is known in Pennsylvania, represents an opportunity to analyze a crucial case (Eckstein 1975). Because Act 13 was considered under conditions uniquely favorable to manipulation by interest groups, it should be considered a “most likely” case for industry influence. Failure to find a relationship in an instance where one would be expected would raise doubts about the role of campaign donations in legislative roll-call voting more generally.
In this study, we assemble a unique dataset that includes numerous roll-call votes made by members of the Pennsylvania General Assembly, a record of campaign contributions to each member from the natural gas industry, and an objective measure of constituency interests. Using a variety of multivariate statistical analyses, our evidence shows that campaign donations were directed in an apparently strategic manner, toward leaders and members with local industry interests. We also conclude that campaign contributions were predictive of members’ roll-call votes.
The Hydraulic Fracturing Boom
Innovation in horizontal drilling practices over the past decade has increased the prevalence of fracking nationwide. 2 Pennsylvania is at the center of the natural gas development boom because it sits above a vast shale play known as the Marcellus Formation. As can be seen in Figure 1, the Marcellus Formation extends from West Virginia into eastern Ohio and western Pennsylvania, and north from there into upstate New York. In 2012, the Marcellus Formation accounted for nearly one quarter of the recoverable natural gas in the United States (U.S. Energy Information Administration 2014, 16). To illustrate the sudden arrival of the fracking industry in Pennsylvania, consider that in 2007, government data indicated that about 5,700 employees worked in the oil and gas industry. In 2012, oil and gas employees numbered nearly 21,000, a 259% increase. 3 In 2009, there was an estimated 3.8 billion cubic feet of recoverable shale gas. To be sure, this is a large amount of shale gas, but small relative to states such as Texas, with recoverable reserves more than seven times larger at that point. But by 2012, the estimated recoverable reserves in Pennsylvania were nearly nine times larger at 32.7 billion cubic feet. Only Texas was estimated to have larger amounts of shale gas, with 44.8 billion cubic feet—a shale gas reserve that, unlike Pennsylvania, appeared to be declining (U.S. Energy Information Administration 2014, 38). Thus, the boom in shale gas production occurred rapidly in the state, leaving regulators overwhelmed, according to a critical profile of Pennsylvania’s initial response to the fracking boom published in the New York Times (Urbina 2011).
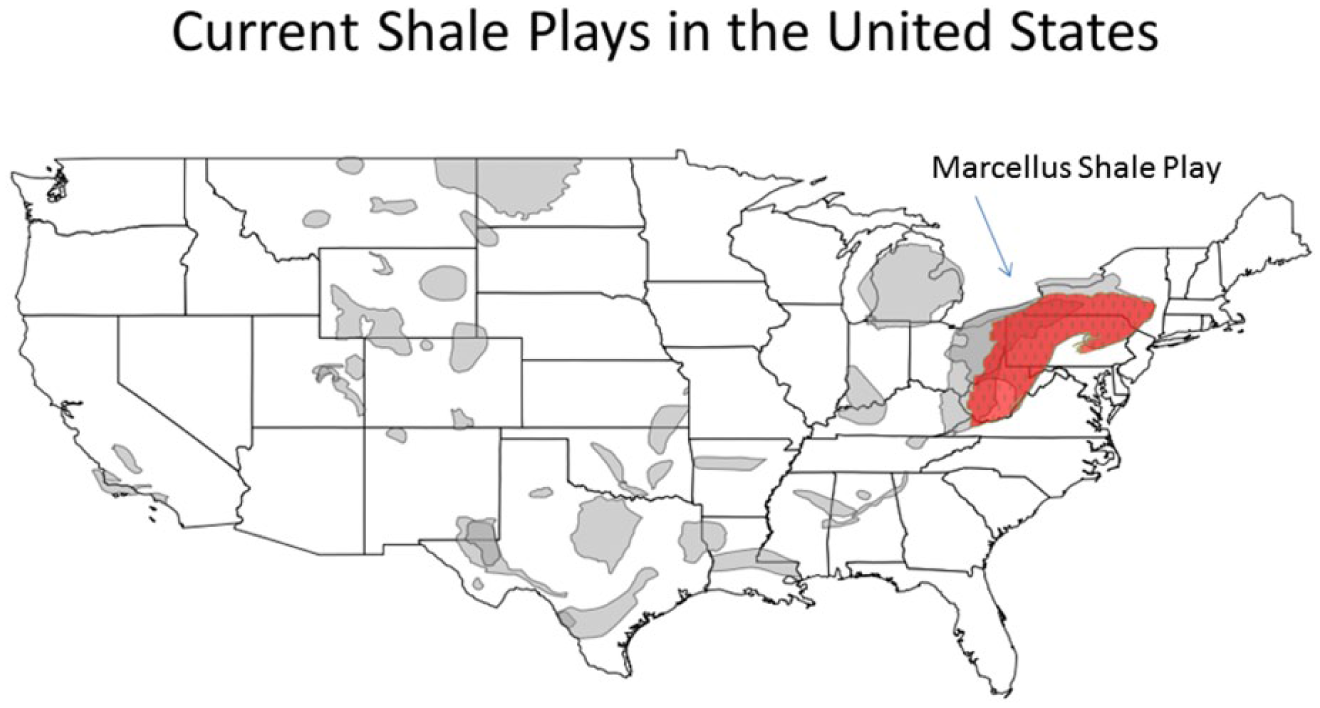
This map depicts locations of the major shale plays in the United States.
When the Pennsylvania General Assembly took up Act 13 in the late fall of 2011, controversies over the fracking industry had become well known in the state. In 2010, Pennsylvania’s gubernatorial race pitted an opponent of industry regulation (Republican Tom Corbett) against a candidate who supported extraction taxes and stronger regulation of natural gas development (Democrat Dan Onorato). 4 At the same time, all 203 seats of the Pennsylvania House of Representatives were up for reelection, along with 25 of the state’s 50 Senate seats. In part because of a large Republican electoral wave at the national level, and in part because of dissatisfaction with the outgoing administration of Governor Ed Rendell (D), Corbett won the election and gained Republican majorities in both chambers of the Pennsylvania General Assembly. Thus, Act 13 was considered by a governor and legislature predisposed to support a regulatory regime favorable to natural gas development. A key question being examined in this study is whether industry money—over and above influences such as party, ideology, and constituency—was an independent influence in members’ votes on the legislation.
Background and Expectations
The study of industry influence on legislator behavior has long been rooted in normative criticisms of the pluralist model of democracy offered by works such as Dahl (1961). The famous criticism of Schattschneider (1960) argues that industry influence on the political process biases outcomes toward organized, upper class interests. Such concerns have been touted by opponents of the natural gas industry, who bristled at exemptions from major environmental statutes such as the Safe Drinking Water Act following passage of the 2005 Energy Policy Act. In a special report designed to draw attention to the increased political activity of the natural gas industry, the advocacy organization Common Cause indicated that . . . the ability of the natural gas industry to tap vast new reserves through fracking is a good metaphor for its enhanced political clout in the post-Citizens United era, in which the industry and its backers can now spend unlimited amounts of money on electioneering, often in secret. (Browning and Kaplan 2012, 13)
As noted above, decades of research investigating campaign donations and subsequent pro-industry roll-call votes has produced limited evidence of a systematic positive relationship. In a survey of studies investigating such relationships through the early 2000s, Ansolabehere, de Figueiredo, and Snyder (2003, 116) determined the evidence that campaign contributions influence roll-call votes is “rather thin,” concluding that “. . . legislators’ votes depend almost entirely on their own beliefs and the preferences of their voters and their party.”
A recent task force report reinforced the academic conventional wisdom, noting that methodological challenges undermine scholars’ ability to find the influential relationships between industry groups and lawmakers so widely assumed to exist by journalists (Fortier and Malbin 2013). First, even in the few studies that find positive evidence of influential relationships, inferential threats from endogeneity undermine claims about the direction of the relationship. For instance, while many believe that interest groups give money to politicians because they expect favorable votes in return, it is equally plausible that campaign donations are given as a reward for favorable votes. Second, to isolate the influence of campaign donations on voting patterns and avoid criticisms that models are uncovering spurious relationships, it is necessary to control for the influence of party, ideology, and a legislator’s constituency. Precise estimates of constituency interests are somewhat rare (but see Durden, Shogren, and Silberman 1991; Stratmann 2002).
Scholars also disagree substantially about the mechanism by which industries can be expected to influence roll-call votes. An early and influential conception of industry participation regards campaign donations as “quid pro quo” investments, or disbursements of funds expressly allocated for the purchase of a regulatory environment more favorable to industries’ balance sheets (Welch 1974). A competing account finds industry influence rooted in the cultivation of long-term relationships, in which continuing campaign donations increase the likelihood that a member will support an industry in a variety of votes extending into the future (Snyder 1992). A third perspective conceives of campaign donations as a consumption-oriented activity, or a form of political participation driven by generic ideological motivations (Ansolabehere, de Figueiredo, and Snyder 2003). More recently, scholars have suggested that campaign giving is motivated by a desire to build an ideologically congruent legislature (McKay 2010). In essence, industries may have the sophistication to recognize that a legislature comprised of ideological fellow travelers will ultimately result in more industry-friendly policy making.
Although each of these motivational accounts has primarily served to explain the role of industry money in roll-call voting, scholarship has long observed that campaign money can influence legislators in subtler ways. Hall and Wayman (1990) focused on Congressional committees, arguing that interest group influence was more likely there. Their analysis showed that recipients of campaign money devoted more of their time—a scarce resource—to representing the interests of donors. Powell (2012, 2013) represents the most exhaustive attempt to understand the role of interest group money in state-level politics, and her research also suggests that contributions are likely to be influential in the less observable parts of legislating, such as determining whether a bill will be permitted a floor vote or inserting pro-industry phrases during the bill-writing process.
The Case of Act 13
Our review of the scholarly record suggests a tentative conclusion—the role of campaign money on legislative content is seen as a conditional phenomenon in which the contextual circumstances of the legislative chamber and policy content provide varying degrees of fertile ground for influence. As such, we argue that progress on the important questions central to this study is best advanced through consideration of individual case studies. An important initial task concerns case selection. Following the classic typology of Eckstein (1975), we sought a “most likely” case—one in which the contextual circumstances were unusually likely to promote an influential relationship between industry and lawmakers. Failure to find persuasive evidence that such a relationship exists would provide strong evidence against the underlying theoretical proposition: campaign contributions from industry influence the roll-call voting behavior of legislators. As noted above, many observers of the legislative process that led to the enactment of Act 13 saw the influence of the natural gas industry as decisive. For a variety of reasons, we argue that if campaign money does affect legislators’ behavior, the contextual circumstances of Act 13 warrant classification as a “most likely” crucial case.
First, several institutional features of the Pennsylvania General Assembly are likely to invite corruption. Powell (2012) identifies several important characteristics that influence the level of perceived corruption in state legislatures, including chamber size and term limits. Larger chambers are theorized to invite corruption because members have greater competition for campaign donations, and, thus, increased incentives to offer benefits in exchange for contributions. Pennsylvania’s lower chamber has 203 members, second in size only to New Hampshire (400), while only five states have larger upper houses than Pennsylvania. In addition, the Pennsylvania General Assembly also lacks term limits, an institutional feature of state legislatures that is thought to promote the cultivation of corrupt relationships between donors and ambitious legislators who intend to have a lengthy political career (Carey, Niemi, and Powell 2000).
More important is the state’s absence of campaign finance regulation: although corporations and unions are not permitted to donate money directly to candidates, individuals, parties, and Political Action Committees (PAC) are permitted to give unlimited funds. The absence of regulation is comparatively permissive, as only four states are considered to have more lenient campaign finance laws. 5 It is perhaps not surprising then that Powell (2012) finds both houses in Pennsylvania to be comparatively more corrupt, as the Pennsylvania House of Representatives was rated the seventh most corrupt lower house, and the Pennsylvania State Senate was ranked the 13th most corrupt upper chamber.
Quantitative assessments of Pennsylvania’s vulnerability to corruption are corroborated by state observers’ assessments. After consideration of Act 13, at least three members of the Pennsylvania General Assembly had been arrested for corruption charges, including former Speaker Bill DeWeese (D), Jane Orie (R), and LeAnna Washington (D).
6
In all, 15 members of the Pennsylvania General Assembly have been arrested on corruption charges since 2007, prompting observers to speculate about the sources of the state’s “culture of corruption” (Bumstead 2014). Concerns about improper relationships between Pennsylvania government and the natural gas industry prompted a nonprofit organization to decry the revolving door between government and the gas industry in Pennsylvania, where numerous top government officials and environmental regulators have either left their public jobs for careers in the oil and gas industry or come to government from the private sector. (Galbraith 2013, 2)
The report cited ties between the industry and State Senators Lisa Baker (R), Mary Jo White (R), and Anthony Williams (D).
Act 13 was contested under conditions of asymmetric potential influence. While the natural gas industry donated a substantial amount of money to state lawmakers in the months leading up to the vote, environmental organizations—the natural opponents of the bill—did not. Contributions from green organizations to members of the Pennsylvania General Assembly were virtually nonexistent in the years preceding consideration of Act 13. Thus, the argument of countervailing influence offered by proponents of pluralist theory—the notion that an interest group’s influence is balanced by influence from its opponents—is potentially absent in this case.
The case provides inferential leverage for additional reasons. First, the substance of the legislation was determined by a largely open amendment process. This is an important feature of the case because we have the opportunity to observe lawmaker behavior on roll-call votes involving all of the features of the bill that were considered controversial. Amendment A7675 would have repealed the hotly contentious provision of HB 1950 that prevented municipalities from restricting fracking operations in particular zones. Several amendments were considered that would have increased drillers’ fees above the proposed 1% impact fee. Moreover, other amendments were considered that would have limited drilling on public lands or required drillers to pay for road damage arising from well pad construction. Thus, unlike many controversial pieces of legislation where observable behavior by legislators is limited to procedural or final passage votes, HB 1950 was subject to highly visible amendments, and its ultimate form was determined by both the committees of jurisdiction (The House and Senate Environmental Resources and Energy Committees) and the full General Assembly. While we agree with scholars’ assertions that interest group influence occurs in less visible ways than roll calls, in this case, roll-call votes were unusually important in determining the content of the legislation. As such, the role of interest group money on roll calls was potentially strong in the case under consideration.
Second, and perhaps more important, the fracking boom in Pennsylvania was a recent phenomenon, such that members had relatively few prior opportunities to demonstrate their pro-industry credentials in the months and years leading up to consideration of HB 1950. In fact, one of the reasons why Act 13 was considered to be such a controversial law is that it amended state policies toward an industry that had not been addressed by major legislation for decades. This feature of the case reduces the likelihood that financial contributions from industry were a reward for an established record of voting favorably toward industry. It, therefore, offers an opportunity to analyze a case in which inferential threats from endogeneity are theoretically lessened.
To summarize, both academic and journalistic accounts point to Act 13 as a strong candidate for a “most likely” crucial case. In addition, the open manner in which the Act was considered gives us a comparatively unobstructed opportunity to observe lawmakers’ individual contributions to the substantive form of the resulting legislation. Finally, the contextual circumstances of the case, particularly the relatively recent arrival of shale gas production in Pennsylvania, renders traditional concerns about endogeneity—a causal process running from votes to campaign donations rather than the reverse—as less likely. For these reasons, we believe that the case of Act 13 offers valuable inferential insight into the role of campaign donations on legislative behavior.
Data and Measurement
In this section, we outline our measures of industry giving, constituency interests, and a host of necessary control variables. 7 Our initial goal is to develop a multivariate model of campaign giving, that is, to determine which member characteristics led the natural gas industry to donate funds. At the outset, it is important to recognize that individual corporations are forbidden by Pennsylvania law from giving money directly to political candidates. However, companies can create PACs to raise funds from individuals, and this money can be given directly to candidates. For this reason, identifying which contributions come from industry presents a challenge.
In their report “Deep Drilling, Deep Pockets,” Common Cause identified campaign donations from the natural gas industry nationwide between 2000 and 2012 (Browning and Kaplan 2012). Their data contain information about donations to national-level Congressional candidates and state-level gubernatorial and legislative candidates, including a vast amount of information about Pennsylvania. 8 All contributions of $100 or more from PACs of companies with a profit interest in Marcellus Shale, and donations made by executives of these companies, were identified and included in the dataset.
From these data, three measures were generated for each representative. First, we computed the sum of total industry donations received by candidates between January 1, 2009 and February 13, 2012. These dates were chosen for two reasons. First, shale gas production dramatically increased after 2008, changing the mutual relationships between lawmakers and industry. In addition, industry giving soared during this period. In 2008, industry donated about $541,000 to candidates, a figure largely comparable to annual giving in each of the previous nine years. But in 2009, that figure leaped to $1.1 million and reached nearly $1.6 million in 2010. In addition, lobbying expenditures grew suddenly from 2009 to 2010; in the fourth quarter of 2009, industry spent about $526,000, an amount that steadily increased to more than $1.8 million in the first quarter of 2012—when the bill reached final approval in both houses of the General Assembly and was signed into law by Governor Corbett. Second, we chose a time period that corresponded with a full legislative term, as the Pennsylvania legislature’s two-year sessions run from January through December of the subsequent year.
Two additional measures were created, representing partitions of the first measure. First, we created a measure of campaign donations to each member from the natural gas industry for the legislative session immediately preceding the session in which Act 13 was considered. This measure was inclusive of campaign donations received between January 1, 2009 and December 31, 2010. A final measure reports campaign donations received in a 14-month period: the 11 months prior to when Act 13 was first evaluated in the General Assembly, and the three months of deliberation that occurred following initial consideration of the bill. This measure captures campaign donations received between January 1, 2011 and February 13, 2012.
Table 1 presents summary statistics for campaign donations on the three-year composite measure described above. The table includes median donations from industry across the entire Assembly. It also reports median donations received by Democrats, Republicans, members of party leadership, and the committee of primary jurisdiction (in both chambers): the Environmental Resources and Energy Committee (EREC). A few patterns are evident. First, Republicans and party leaders received more money than Democrats and rank-and-file members. Second, most members received relatively small donations from industry; a small number of members accounted for the few large donations.
Donations from the Natural Gas Industry, by Chamber (Dollars).
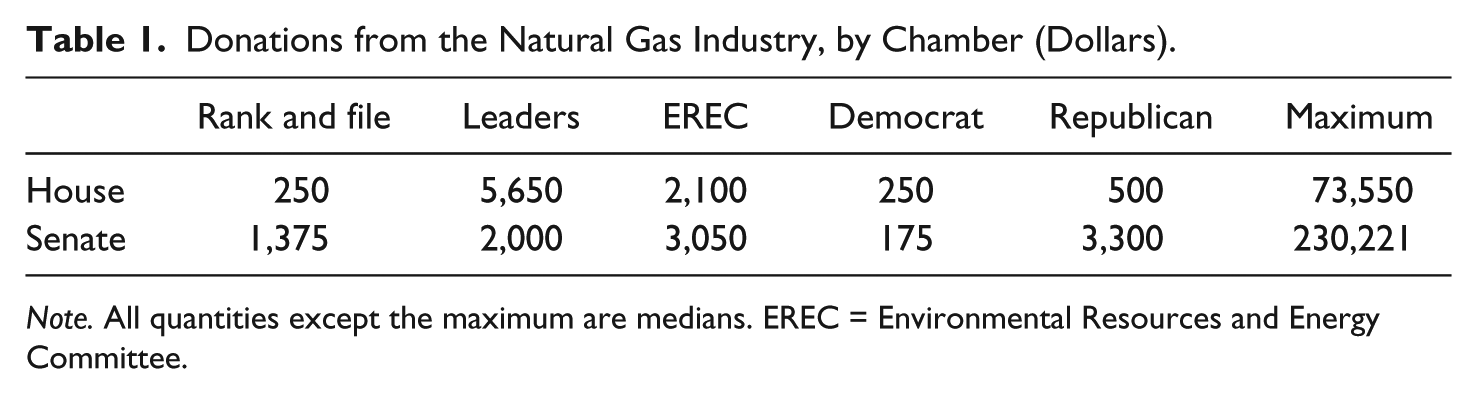
Note. All quantities except the maximum are medians. EREC = Environmental Resources and Energy Committee.
Meanwhile, members of the Pennsylvania General Assembly raised a minimal amount of money from environmental organizations. For the 2009 to 2010 cycle, these organizations donated just $12,870 to the entire legislature. 9 Only two of the 23 donations were in an amount greater than $1,000. Clearly, campaign dollars from environmental organizations were minuscule in comparison with the nearly $3 million spent by the natural gas industry during the same period. Campaign giving in this case was unambiguously asymmetric. For this reason, donations from the political movement most likely to pressure members to favor the environment when considering Act 13 were not included in the analysis.
Some members are inherently more successful at raising money than others, and we accounted for this characteristic by constructing two fundraising variables. First, to measure a member’s overall fundraising ability, we collected campaign receipts for each member of the Pennsylvania General Assembly from 2009 to 2012, and subtracted natural gas donations from this quantity. We then logged the resulting “nonindustry donations” variable. Second, we sought to measure the extent to which certain members are successful at obtaining funds from very conservative donors. To build this measure, we obtained data from the Database on Ideology, Money in Politics, and Elections, and relied upon the “CF Scores” for donors. We identified all donors with CF Scores 1 standard deviation (SD) more conservative than the mean, and summed donations received from these donors for each legislator. The resulting “conservative donor” score was then logged for analysis.
In this study, constituency interest is operationalized as the extent of natural gas development in a legislative district. Summary measures of district-level production are not available, but Pennsylvania’s Department of Environmental Protection archives well production data. The archive includes latitude and longitude information for each gas well, and also includes estimates of extracted gas for each location. 10 To develop a summary measure of gas production, we first determined the amount of gas produced by each well for the year 2011. We then summed well production data for all wells geo-located within the boundaries of each legislative district (House and Senate). 11
In Figure 2, we can see that virtually the entirety of gas production in Pennsylvania was located within the boundaries of the Marcellus Shale play in 2011. Wells were located across the western half of the state, but two clusters of wells are particularly evident: a large group in the southwestern part of the state, and another group in Bradford and Tioga counties in North Central Pennsylvania. Productive gas wells were located in districts represented by both Democrats and Republicans in the State House, although average production was higher in Republican districts. Mean production was 6.7 billion cubic feet in Republican House districts, compared with 3.4 billion cubic feet in Democratic districts. Of the 10 districts with the highest level of gas production, six were controlled by Democrats.
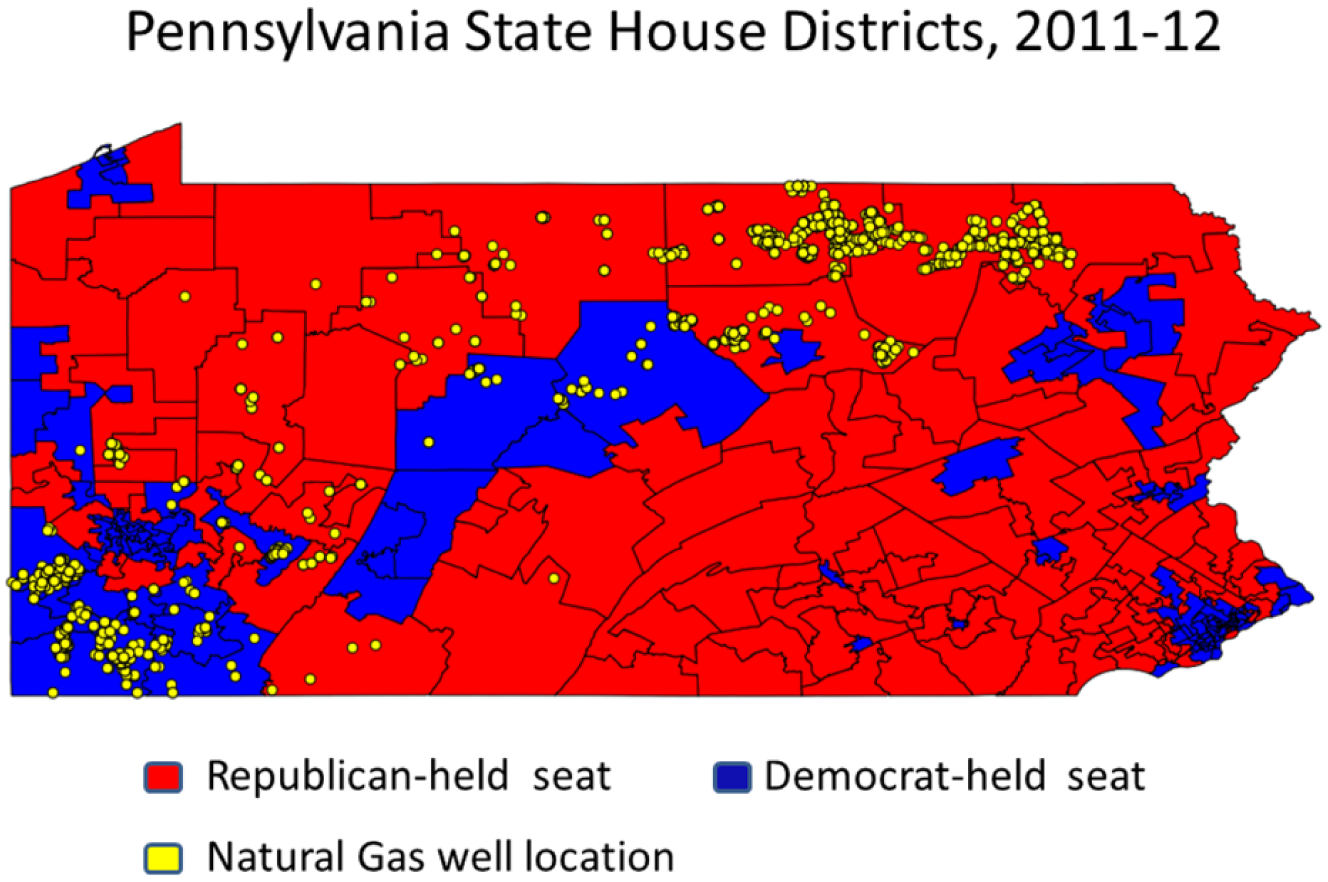
This map depicts the distribution of partisanship and natural gas locations for the Pennsylvania State House for 2009–10.
Figure 3 presents a similar map for the Pennsylvania State Senate. As was the case in the State House, in the Senate, wells were clustered in the Democrat-controlled southwest and the Republican-controlled region in the north-central part of the state. The mean Republican district had nearly double the gas production as the mean Democratic district. Of the 10 highest natural gas producing districts, three were Democratic. Thus, although there was a Republican tilt to the distribution of the natural gas industry in Pennsylvania prior to consideration of Act 13, constituency interests were a factor for both Democratic and Republican representatives.
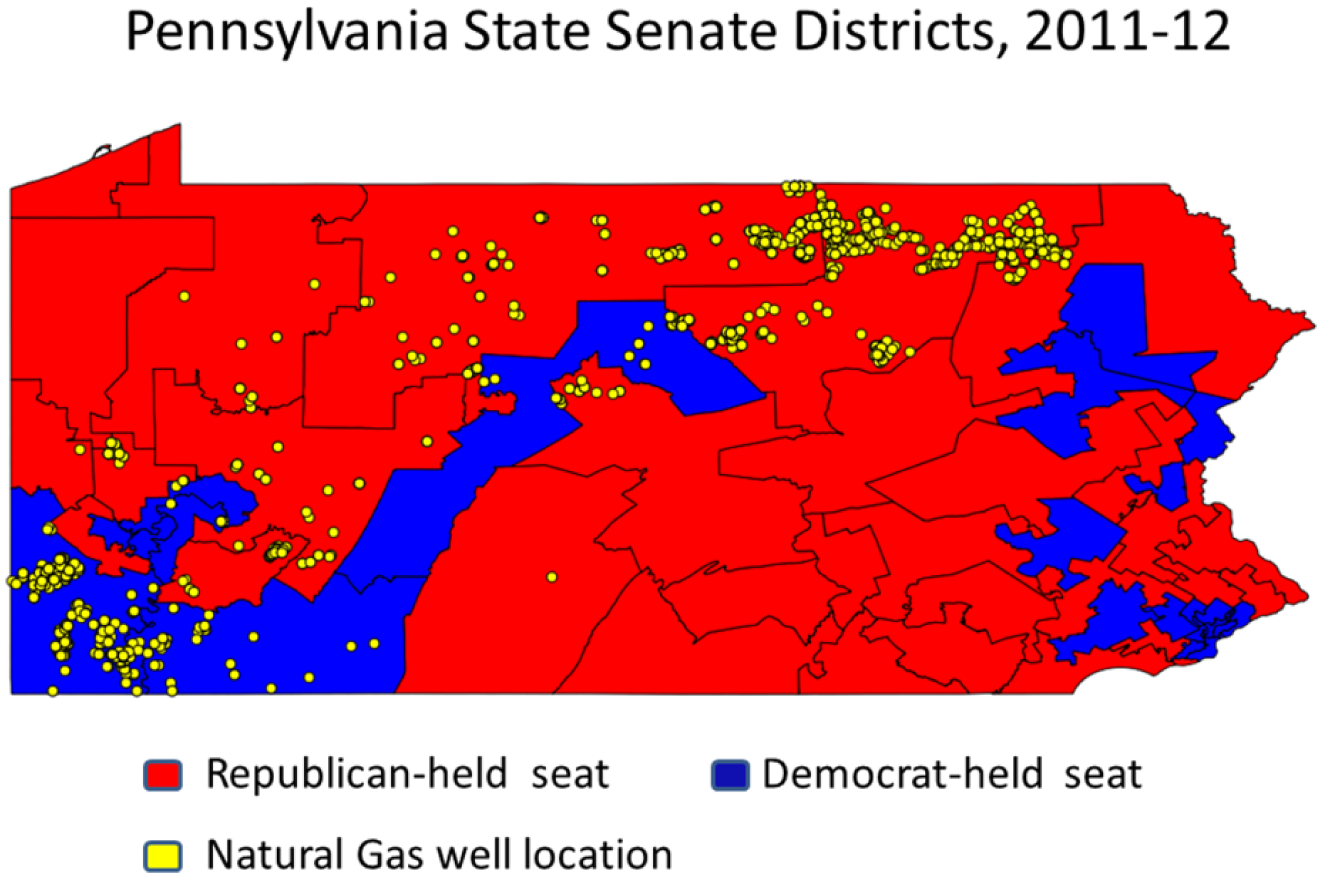
This map depicts the distribution of partisanship and natural gas locations for the Pennsylvania State Senate for 2009–10.
In developing a multivariate model, it is necessary to produce measures of both partisan district pressure and members’ personal ideological views. Both can be captured by measures rooted in prior roll-call voting behavior such as DW-Nominate, as such measures are best interpreted as induced preferences: some complex combination of members’ personal views and the portion of their behavior that comes from a desire to represent the ideological preferences of their home districts. Fortunately, such a measure has been produced by Shor and McCarty (2011), who developed measures of legislator ideology that can be applied across states. These National Political Awareness Test (NPAT) scores exist for the individual state legislators who participated in the enactment of Act 13, and are included in all models as ideological controls. 12 In a few instances, data were missing for individual lawmakers, so values were imputed for these members. 13
Additional measures were generated to capture important member attributes that should be included in multivariate models as controls. First, members likely obtain increased influence in the chamber when they have served for a longer period of time. Chamber influence is attractive to industry, which would like to gain powerful members as allies to advance their legislative agenda. To capture this characteristic of members, we generated a count variable that captures the number of years the member has served in the chamber. 14 Second, industries may be more likely to fund members who are electorally vulnerable, as these members may have additional motivation to promote their services in exchange for assistance in gaining reelection. To measure electoral vulnerability, we created a dummy variable for members who won less than 60% of the two-party vote in the prior election (2008 or 2010). We also created dummy variables capturing whether a member was a party leader or a member of the EREC, as support from these members likely offers greater return on an investment from strategically minded campaign contributors. Each of these variables has been implicated in prior research investigating interest groups’ motivation to provide campaign funds (Grier and Munger 1986, 1991, 1993).
As the dependent variable (campaign donations) is continuous, a multivariate model could be estimated by ordinary least squares (OLS). However, as large numbers of members received zero donations from the natural gas industry, this truncation of the dependent variable at zero is potentially problematic. Not all members who received zero donations are likely regarded equally by the industry; in fact, many would likely receive negative donations in the form of support for their opponents.
We hypothesize that the amount of campaign donations contains a latent “negative” space, but for all individuals whose donations fall into this region, we observe zero dollars in donations. In such a circumstance, a tobit model is appropriate (Tobin 1958). This model consists of two components: a probit model used to predict whether an observation is censored (e.g., whether a member received zero dollars), and a linear model predicting donations for members who received a nonzero amount. Thus, the parameters of a tobit equation are used to predict a partially unobserved, latent variable capturing the financial support for members by the natural gas industry rather than the simple quantity of campaign dollars received from the industry. The distinction is important, because slope coefficients and the model intercept estimated by OLS under certain conditions are inconsistent (Long 1997). 15
Analysis: Industry Group Donations
We present parameter estimates and model fit statistics for two tobit models in Table 2. The model reported in column 1 predicts 2009 to 2012 campaign donations in dollars, while the model reported in column 2 predicts logged campaign donations over this period.
Tobit Models Predicting Campaign Donations.
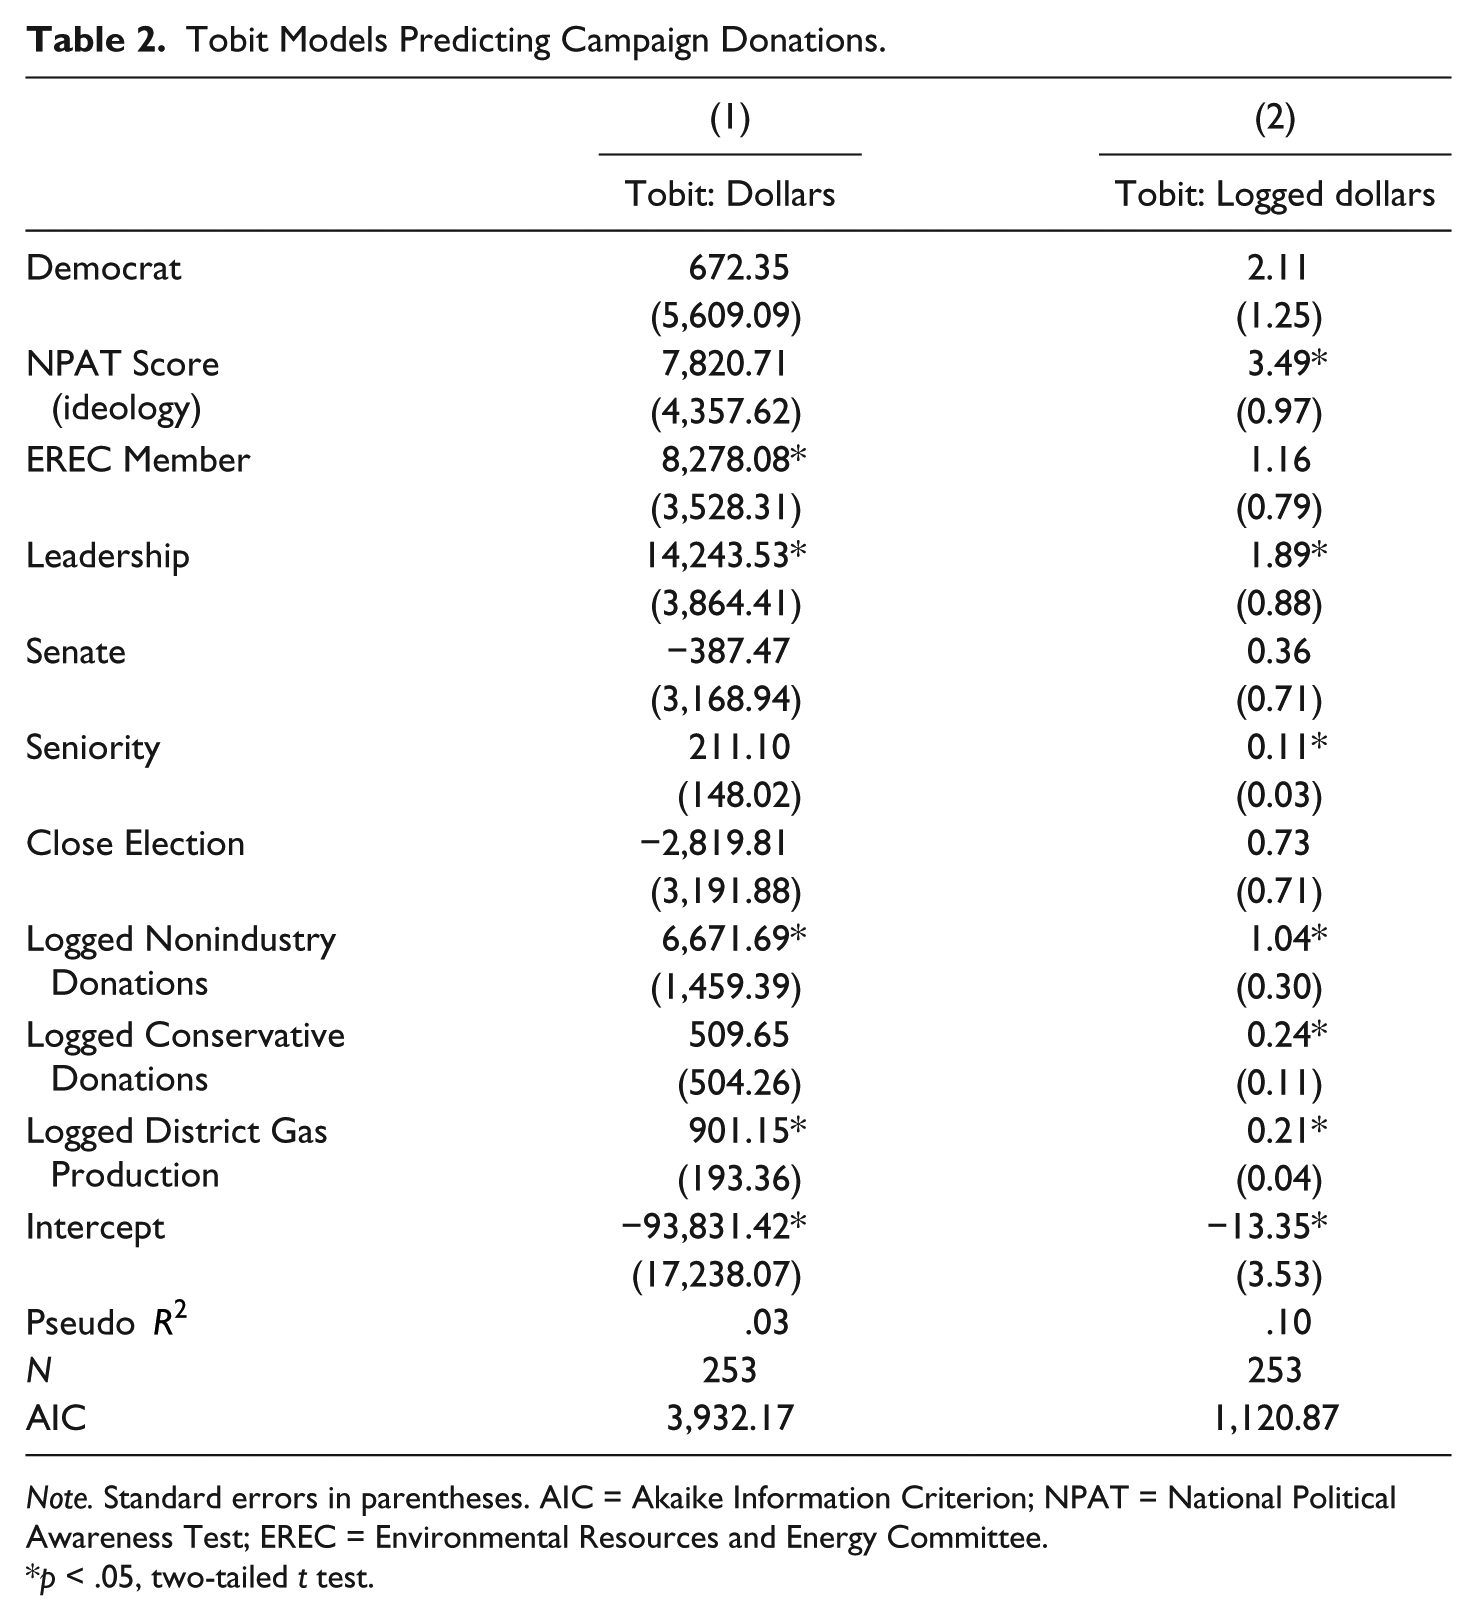
Note. Standard errors in parentheses. AIC = Akaike Information Criterion; NPAT = National Political Awareness Test; EREC = Environmental Resources and Energy Committee.
p < .05, two-tailed t test.
In Table 2, we can first see that, when other covariates are held constant, the party affiliation of members was not predictive of campaign donations. In columns 1 and 2, the coefficients for Democratic Party identification are not statistically different from zero, while the sign on the coefficient is negative in the first column and positive in the second. Thus, contrary to popular perceptions, our analysis does not indicate that industry favored Republican members on the basis of their party affiliation.
Meanwhile, the evidence suggests roll-call ideology was probably related to campaign donations. While the coefficient for NPAT scores falls just short of statistical significance in the model reported in column 1, the coefficient is positive and significant in the model predicting logged donations. The result reported in column 2 indicates that an increase in roll-call conservatism of 1 SD more than triples campaign donations.
Seniority, leadership status, and EREC membership appear to be related to campaign donations. While the coefficient for seniority is not statistically significant in column 1, the result reported in column 2 indicates that each additional year of seniority increases campaign donations by 41%. Leadership status was also highly predictive of campaign donations; the coefficient in column 1 indicates that service as a party leader is predictive of more than $14,000 in campaign donations, on average. Meanwhile, EREC membership was predictive of higher campaign donations in both models. The parameter estimate in column 1 indicates that, relative to nonmembers, EREC members gained more than $8,400 in campaign donations from the natural gas industry. Taken together, these results indicate that donations from industry were strongly channeled toward legislators whose roles offered greater potential leverage on policy outcomes. The result supports the findings reported in Grier and Munger (1991), and the magnitude of these effects demonstrates that a significant amount of industry donations during this period were strategic.
Both models provide persuasive evidence that constituency interests were predictive of increased campaign donations. The log-log relationship in column 2 of Table 2 indicates that a 20% increase in district gas production predicts a 48% increase in industry donations—or about $170 in additional campaign donations (according to column 1 of Table 2). To put it simply, industry donations were likely to be directed toward members representing districts with a substantial presence in the natural gas industry.
The models provide evidence that, holding all else equal, nonindustry donations were predictive of industry donations, suggesting that some industry contributions were to a degree driven by some of the same member characteristics that impact contributions more generally. Meanwhile, the tobit models do not uncover significant evidence that conservative contributions, Senate membership, or electoral closeness are predictive of campaign donations.
Taken together, the statistical results reported in Table 2 support the theoretical proposition that campaign donations were strategic. They were directed toward individuals with additional power to shape legislation, either via leadership status or membership in the committee of jurisdiction (the EREC). Donations were also directed toward members whose constituency had the most at stake in the outcome of potential legislation. Combined with the spike in industry lobbying expenditures noted above, the results are consistent with the proposition that industry attempted to support influential lawmakers. In the next section, we assess the question of influence: did campaign donations have any effect on lawmakers’ votes during consideration of Act 13?
Modeling Roll-Call Votes
Act 13 initially passed in the House on November 17, 2011 after a series of votes on amendments were held on November 15 and November 16. The bill was taken up by the Senate on December 14, when additional amendments were considered, and a revised version of Act 13 passed that chamber on the same day. The House entertained at least 23 substantive amendments to the bill on November 15 and 16, while the Senate voted on six additional amendments on December 14. A conference committee consisting of two House Republicans and two Senate Republicans was formed to resolve differences in the two chambers’ versions of the bill. The conference report was approved in the Senate on February 7, 2012 and in the House on February 8, 2012. It was signed into law by Governor Corbett on February 14.
The Pennsylvania League of Conservation Voters (PLCV), a state-level branch of the well-known nonpartisan environmental advocacy organization, identified the most substantively meaningful votes from this set of roll-call votes for each legislative chamber. In the House, this consisted of 10 amendments, initial and final passage votes, and approval of the conference report. In the Senate, the PLCV identified six amendments, the chamber final passage vote, and approval of the conference report. For each legislator, the PLCV identified the percent of the time members voted in favor of the environment (and contrary to the wishes of industry). To assess members’ voting behavior, we relied upon the PLCV’s support score. 16
In general, members’ voting patterns were highly partisan. In the House, Republicans ranged from 0% to 92% support, with a mean of 24%. Democrats ranged from 38% to 100%, with a mean of 93%. In the Senate, Republican scores were as low as 0% and as high as 50%, with a mean of 11%. Democrats ranged from 0% to 100%, with a mean of 86%. Despite the enormous difference between average scores between Democrats and Republicans, there was considerable intraparty variation in voting behavior. For instance, Senator John Wozniak (D-35), who represented a southwestern Pennsylvania district with a substantial stake in shale gas development, received a score of 0%. Meanwhile, several House and Senate Republicans accumulated PLCV ratings above 50% and voted against the final bill in February 2012.
To predict PLCV vote scores, we develop several multivariate models using different measures of the key independent variable, logged campaign donations. We estimate a model capturing campaign donations from the entire 2009 to 2012 period, and separate models to study the separate effect of industry donations during the 2009 to 2010 period, and industry donations in 2011 to 2012. Summary descriptions of this variable were reviewed above in Table 1.
We include our logged measure of constituency pressure in the model as a control variable, and expect a negative relationship with PLCV scores. A plausible alternative expectation is that Pennsylvanians who live in districts with a heavier concentration of natural gas development might be especially concerned about local water quality and have reasons to demand greater environmental protection. However, research into the effect of local pollution risks on support for environmental regulation has consistently failed to find “not in my backyard” or “NIMBY” effects (e.g., Michaud, Carlisle, and Smith 2008; Smith 2002). To the contrary, even major pollution events tend to activate latent local support for industry rather than demands for greater environmental protection (Bishop 2014).
In addition to the above controls, we include several of the covariates discussed above. Member party and induced ideology in the form of NPAT scores are included. We also include a dummy variable for members of the Senate, to account for that chamber’s slightly lower average PLCV scores.
The models reported in columns 1, 2, and 3 of Table 3 are estimated by OLS, as the dependent variable ranges from 0 to 100. In column 4, we estimate an instrumental variables (IV) regression (Two Stage Least Squares; TSLS), with the covariates included in Table 2 used as instruments. These additional variables include a leadership dummy variable, a dummy variable capturing membership of either the House or Senate EREC, a count of member seniority in years, and a dummy variable indicating whether the member’s most recent election was close. We also included our two generic fundraising ability variables—nonindustry contributions and contributions from conservative donors.
Models Predicting PLCV Scores.
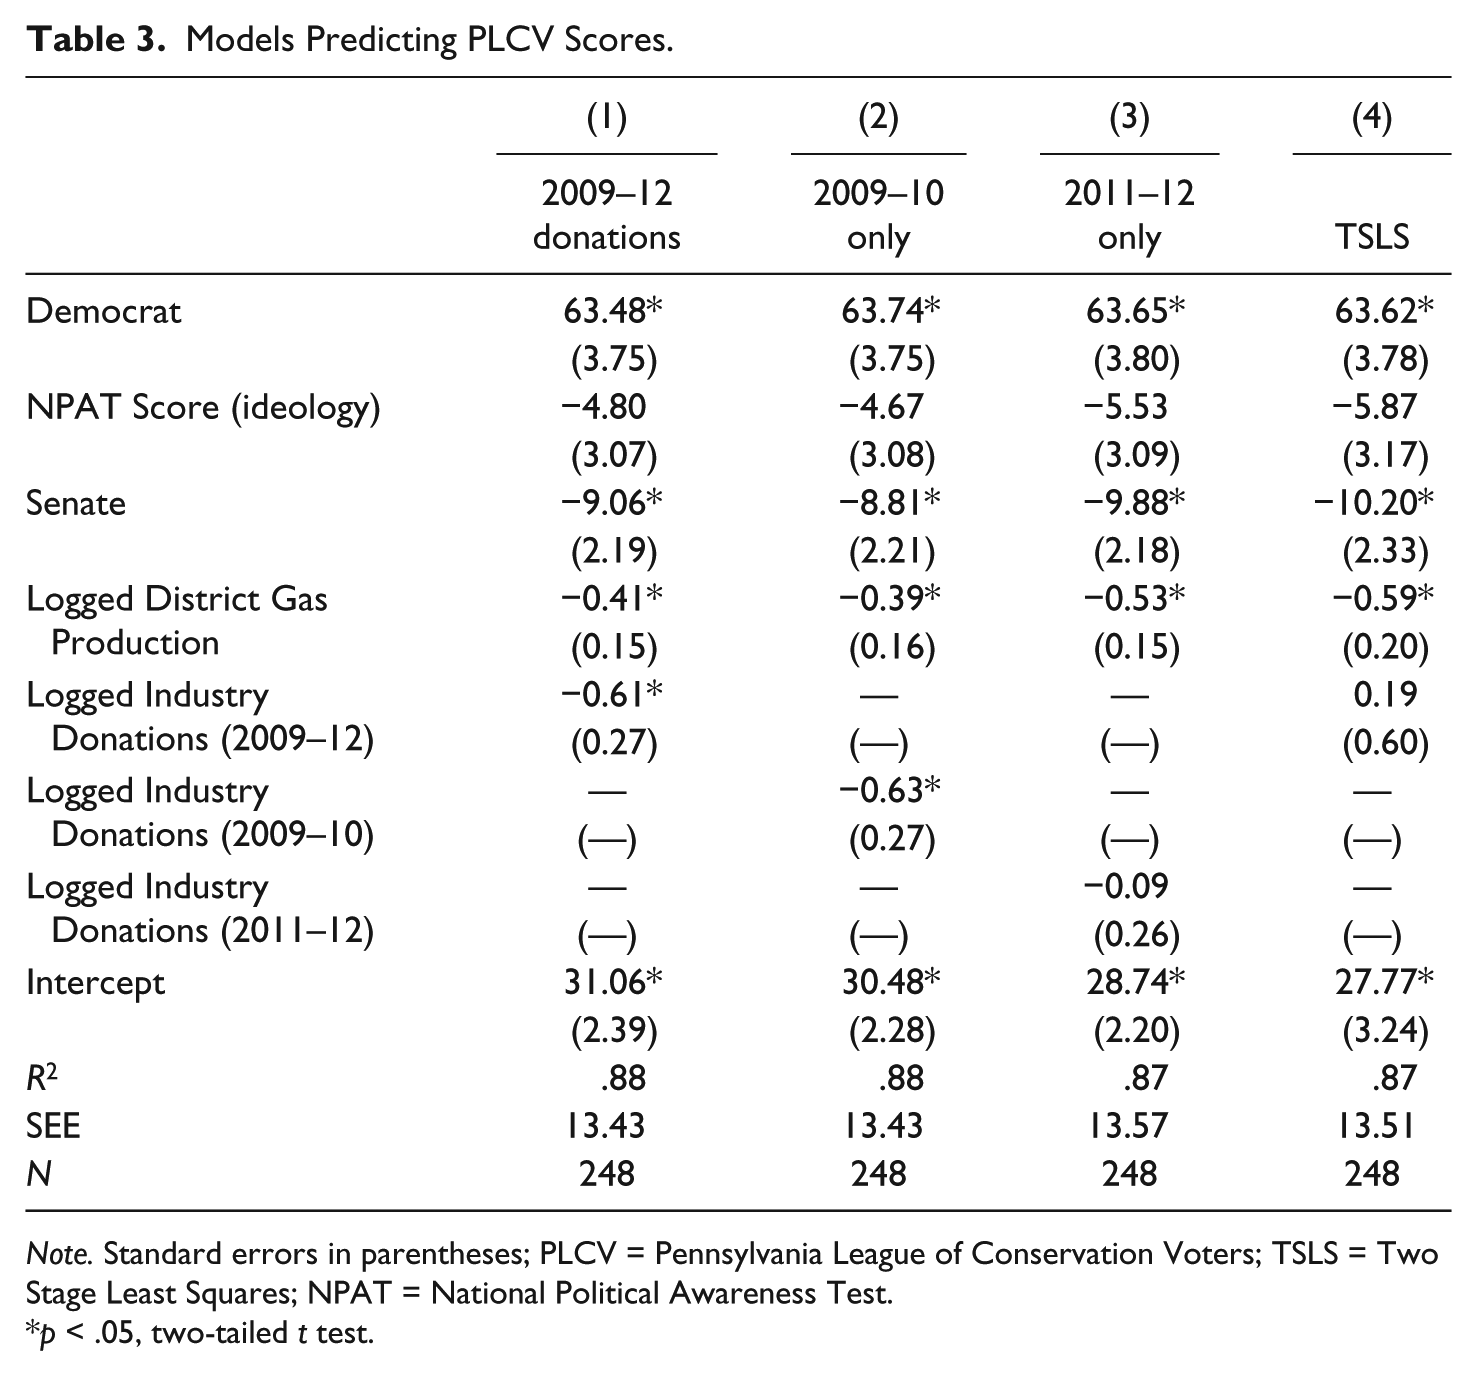
Note. Standard errors in parentheses; PLCV = Pennsylvania League of Conservation Voters; TSLS = Two Stage Least Squares; NPAT = National Political Awareness Test.
p < .05, two-tailed t test.
Analysis: Roll-Call Votes
Parameter estimates and model fit statistics for all four models are presented in Table 3. First, the model predicts the dependent variable fairly well, as the
Not surprisingly, standard political variables were predictive of voting patterns in the expected direction during consideration of Act 13. Holding other covariates constant, membership in the Democratic Party increased predicted PLCV scores by more than 63 points. This result reflects the partisan nature of the disagreement about Act 13 in the Pennsylvania General Assembly; with few exceptions, Republicans voted against the wishes of the PLCV, while Democrats were supportive. The coefficient on the member ideology variable is negative, as expected given that the scale reflects member conservatism, but the coefficient falls just short of conventional statistical significance. 17 The logged natural gas production variable is negative and statistically significant in the model reported in column 1 of Table 3. Because the variable is not in level form, the estimated relationship cannot be interpreted linearly. However, a 20% increase in district-level gas production is predictive of about a 7% decrease in members’ PLCV scores, according to the model. On the right panel of Figure 4, we present a marginal effects plot of the relationship between PLCV votes and district-level natural gas production. 18 As is evident from the figure, higher levels of gas production in a legislative district are predictive of a lower PLCV score.
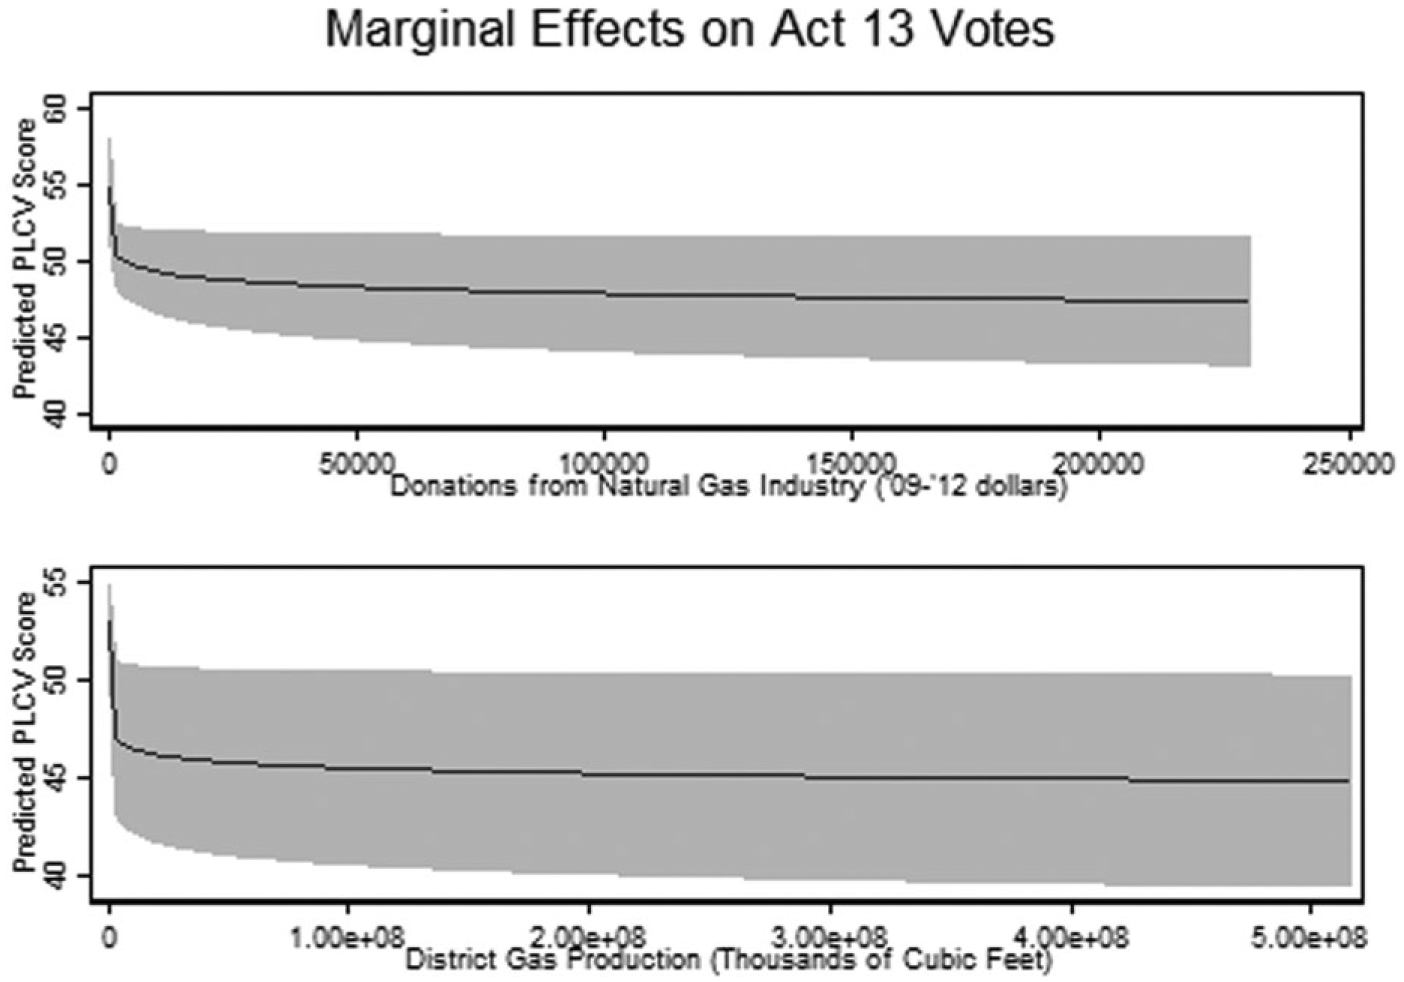
Predicted impact on PLCV score, estimated from the model reported in column 1 of Table 3.
The coefficient for the logged campaign donations variable is also negative and statistically significant. A 20% increase in donations from the natural gas industry is predicted to decrease PLCV scores by more than 11%. On the left panel of Figure 4, we present a marginal effects plot capturing the relationship between PLCV scores and logged campaign donations. Once again, we see a negatively sloped effect, suggesting that campaign donations were predictive of significantly lower PLCV scores.
It appears that the standard variables used to predict roll-call votes—party, ideology, and constituency—played an important role during consideration of Act 13. However, campaign contributions from the natural gas industry provide some additional predictive value, over and above the effects attributable to the other covariates. To explore the relationship further, we estimated two additional models in columns 2 and 3. The model in column 2 is identical to the model reported in column 1, except the campaign donations variable is limited to donations received prior to 2011. In column 3, we present a model that measures campaign donations from January 1, 2011 onward.
The magnitude and direction of the coefficients for party, ideology, and constituency in the models summarized in columns 2 and 3 are virtually identical to the model reported in column 1. However, the coefficient for logged campaign donations is negative and statistically significant in column 2, but small in magnitude and indistinguishable from zero in column 3. This indicates that campaign donations during 2009 to 2010 add predictive explanatory value for members’ voting patterns, while campaign donations after 2011 did not. To the extent that campaign donations influenced members’ votes, the evidence is inconsistent with a simple “quid pro quo” model of industry influence, in which members trade short-term favors in exchange for short-term financial support. The results, instead, support the notion that members’ behavior is more likely to be influenced by longer-term, slowly cultivated relationships with industry.
Many scholars recommend the use of an IV model under conditions of potential endogeneity between the dependent variable and a key independent variable. If an explanatory variable is correlated with the error term in a model estimated by OLS, parameter estimates are biased and inconsistent. For this reason, scholars are advised to estimate a TSLS model, which we present in column 4 of Table 3. As is evident from the estimates in this model, the negative effect from campaign donations (the potentially endogenous variable) is not statistically significant in this specification.
In this instance, we regard the IV approach as problematic. In addition to the qualitative arguments set forth above, statistical tests do not indicate that industry donations are endogenous. 19 In general, IV approaches such as TSLS are invalid under two key conditions. First, if the instruments used in the first stage of the equation are correlated with the error term of the second equation, parameter estimates are inconsistent. In the present case, this threat to inference is of lesser concern, as the exogenous instruments are unrelated to PLCV scores. 20 A second potential problem with IV approaches is that if there is a small correlation between the instruments and the variable of hypothetical endogenous concern (campaign donations), then the instruments are weak. In such a circumstance, the IV approach is biased and inefficient.
Consider the specification of the IV model estimated in column 4 of Table 3:

Here, the π parameter is instrumented by a first stage equation that includes each of the right-hand side covariates and the above-described instruments. Murray (2006) reports that, in finite samples, π is biased under the following conditions:

In this equation, l represents the number of instruments used in the first stage equation (here
Standard tests for weak instruments include examination of the partial
For these reasons, in the present study, the TSLS estimator is clearly biased and inefficient. Meanwhile, the OLS estimator is biased if prior votes are predictive of campaign donations. Here, we argue that this possibility is less likely than in prior analyses of this sort conducted to study Congress because of the nature of the case: a sudden increase in natural gas extraction made possible by technological advances of horizontal drilling and the discovery of large stores of shale gas beneath the Pennsylvania soil. Moreover, standard statistical tests do not support the assertion that campaign contributions from industry are endogenous. For these reasons, we prefer the OLS estimator on the basis of its superior efficiency relative to the most commonly used IV estimator. However, estimates for the TSLS model are nonetheless included in Table 3 for comparison.
Discussion and Conclusion
This study contributed to a large body of scholarly research analyzing the role of campaign money on legislative roll-call voting. We have two broad conclusions. First, campaign donations were shown to have a strong strategic element, as funds were largely directed toward members with either leverage over potential legislation or a constituency-based stake in the industry. Second, we found that party and constituency exerted a powerful influence on members’ roll-call voting behavior, while campaign donations contributed additional explanatory value.
The research presented here is unusual in its focus on the role of campaign money in state politics. Previous research has explored similar research questions using comparable methodology, but the focus has typically been on national politics. Our analysis fills a void in systematic research on this topic at the state level, and demonstrates that many of the processes studied at the national level are also present in state politics. For instance, the dominance of parties at the national level is also evident here, as our models showed that the simple fact of party identification is responsible for a predicted 63% difference in members’ voting behavior. As partisan politics continues to polarize at the national level, it is likely that state-level parties will increasingly resemble their national variants.
Our primary contribution in this study is tied to the unique circumstances of the case. The process by which Act 13 was constructed was open, as all of the controversial aspects of the legislation were addressed by amendments. This feature of the legislation allows us to directly observe which lawmakers supported each provision of the bill. More important, we consider Act 13 to be a “most likely” crucial case in that the contextual circumstances of the bill made industry influence unusually likely. The natural gas industry had an opportunity for asymmetric influence, as environmental organizations did virtually nothing to offset the industry’s financial contributions. Moreover, the institutional features and campaign finance laws pertaining to the Pennsylvania General Assembly created a legislative context ripe for industry influence. In short, if campaign money affects voting behavior among legislators, a case such as Act 13 is where we should expect to find it.
In our analysis, we concluded that campaign contributions and pro-industry votes were related to one another. Statistical evidence and the circumstances of the case suggest that the relationship is not endogenous. However, it is important to recognize that even if our analysis has persuasively dismissed inferential threats from endogeneity, we stress that our findings are correlational. While our evidence supports the hypothesis that financial contributions influenced legislators, readers should use caution when interpreting our findings as causal.
It is perhaps not surprising that we found evidence of influence on legislative content from financial contributions in a “most likely” circumstance. Had we found no relationship between money and the substance of legislation, it would have provided persuasive evidence for the theoretical view that financial contributions play a minimal role in our legislative processes—a stronger conclusion than the current academic conventional wisdom on the subject. Nonetheless, our findings are important, even if they reinforce the unsettled scholarly record on a controversial topic. While our results are tentative, they indicate that worries about the influence of campaign money on policy making that inspire widespread hand-wringing among good-government advocates should not be summarily dismissed by scholars.
Concerns about the influence of industry money on American policy making are legion, particularly in the case of hydraulic fracturing. In the sequel to his widely discussed film Gas Land, a film inspired by battles between the natural gas industry and environmentalists in Pennsylvania, filmmaker Josh Fox sarcastically described the mixture of money and policy making in Washington this way: “I felt like I could see it: A horizontal well bore down into the Earth, snaking underneath the Congress, shooting money up through the chamber with such high pressure that it blew the top off of our democracy.”
The debate over Act 13 in Pennsylvania inspired similar reactions, leading organizations such as Common Cause and the PLCV to engage in an unusual degree of advocacy against the lawmakers responsible for enacting it. Their actions may have had an effect: in October 2012, Governor Corbett had the fourth-lowest approval rating among governors nationwide at 40%, while the Pennsylvania General Assembly had a lower approval rating than state legislative bodies in all but three states. 21 Yet, Democrats made only modest gains in a subsequent election that offered coattails from a Democratic president who performed well in the state, and failed to reclaim either of the state’s legislative chambers. Although Corbett was the only incumbent Republican governor nationwide to lose two years later, during the same election, Republicans gained a majority in both houses of the General Assembly. Thus, to the extent Act 13 represented a giveaway to industry against the wishes of the public, Pennsylvania Republicans did not appear to be meaningfully punished for enacting the reform.
Footnotes
Appendix
Cragg’s “Double Hurdle” Models Predicting Campaign Donations.
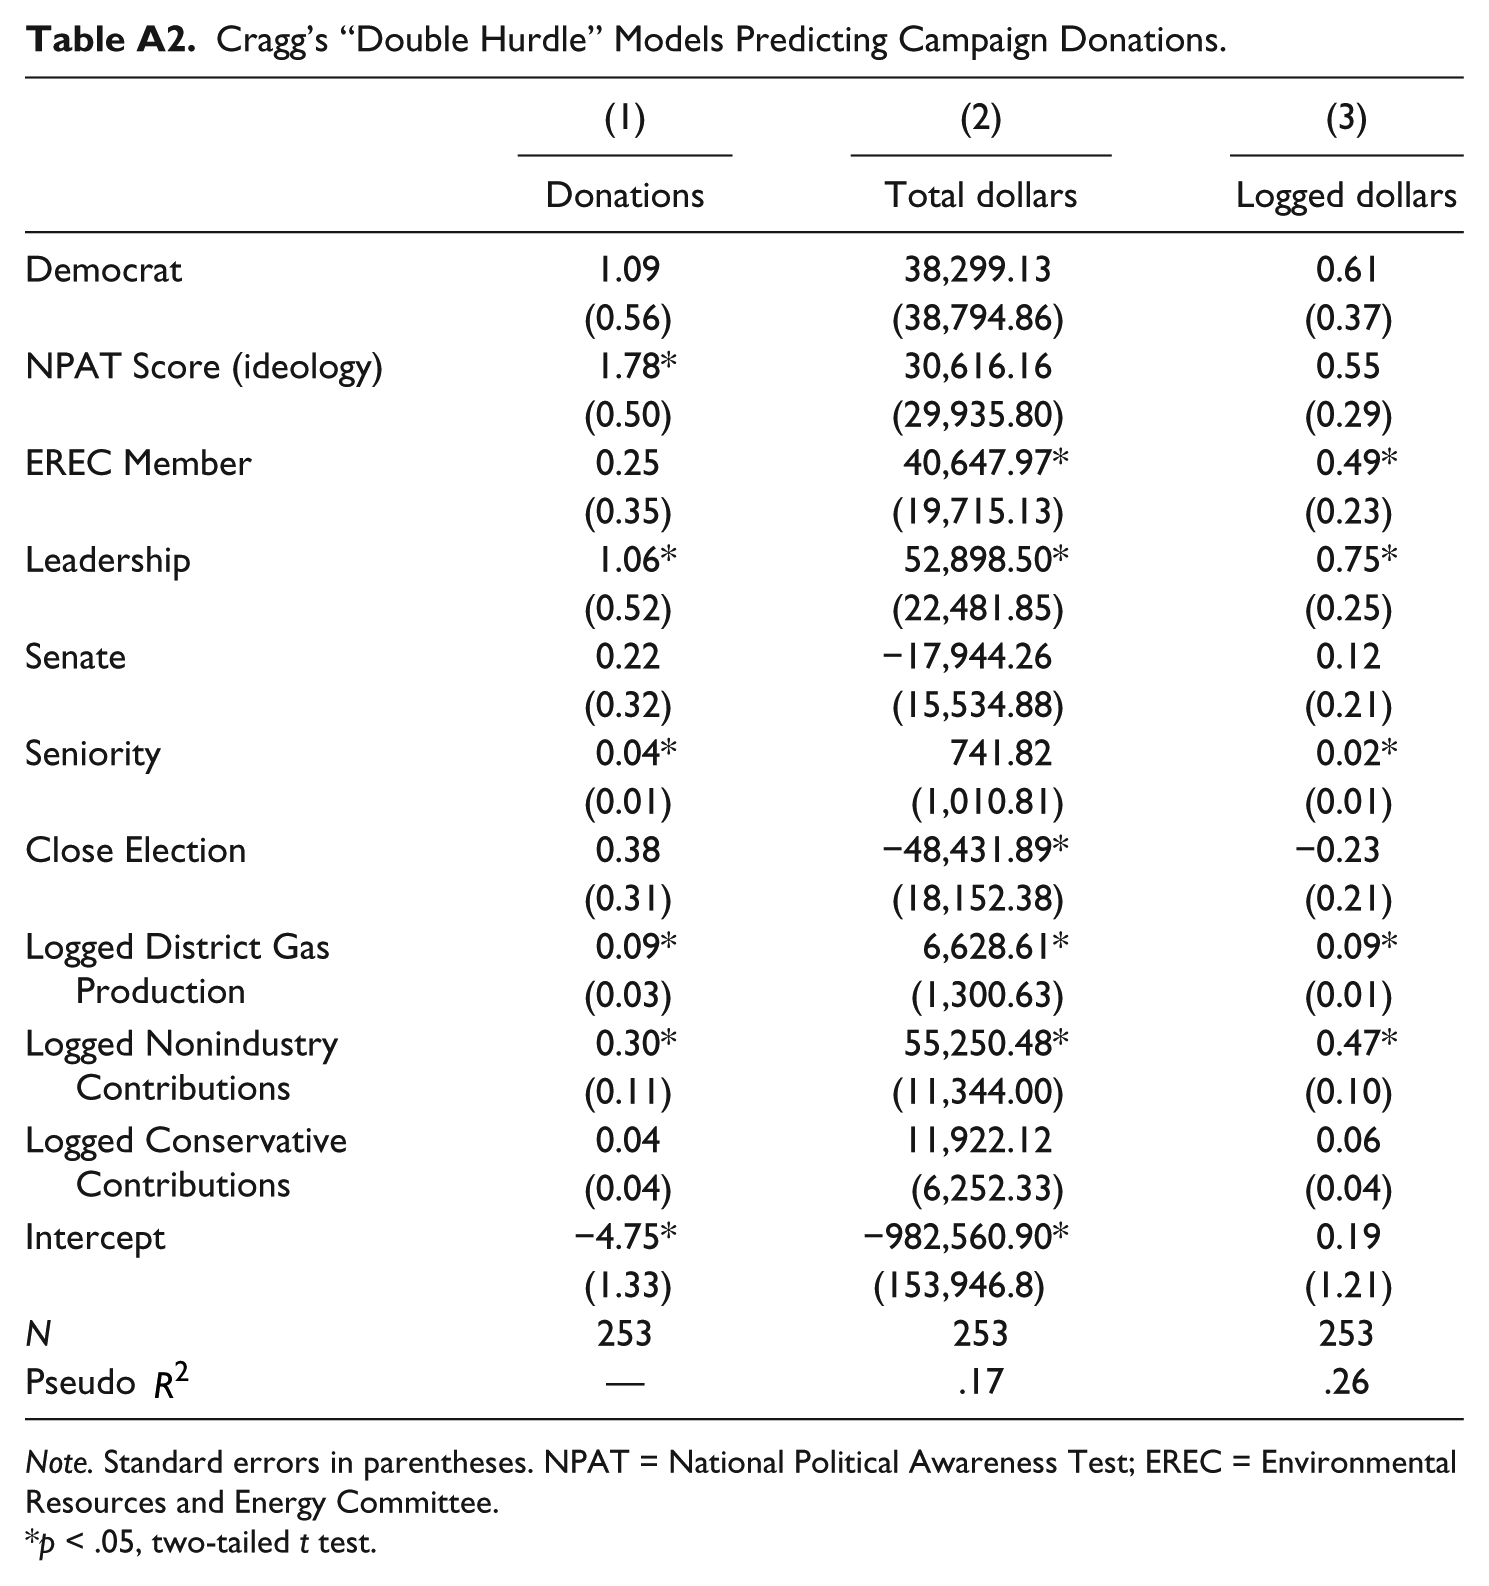
| (1) |
(2) |
(3) |
|
|---|---|---|---|
| Donations | Total dollars | Logged dollars | |
| Democrat | 1.09 | 38,299.13 | 0.61 |
| (0.56) | (38,794.86) | (0.37) | |
| NPAT Score (ideology) | 1.78* | 30,616.16 | 0.55 |
| (0.50) | (29,935.80) | (0.29) | |
| EREC Member | 0.25 | 40,647.97* | 0.49* |
| (0.35) | (19,715.13) | (0.23) | |
| Leadership | 1.06* | 52,898.50* | 0.75* |
| (0.52) | (22,481.85) | (0.25) | |
| Senate | 0.22 | −17,944.26 | 0.12 |
| (0.32) | (15,534.88) | (0.21) | |
| Seniority | 0.04* | 741.82 | 0.02* |
| (0.01) | (1,010.81) | (0.01) | |
| Close Election | 0.38 | −48,431.89* | −0.23 |
| (0.31) | (18,152.38) | (0.21) | |
| Logged District Gas Production | 0.09* | 6,628.61* | 0.09* |
| (0.03) | (1,300.63) | (0.01) | |
| Logged Nonindustry Contributions | 0.30* | 55,250.48* | 0.47* |
| (0.11) | (11,344.00) | (0.10) | |
| Logged Conservative Contributions | 0.04 | 11,922.12 | 0.06 |
| (0.04) | (6,252.33) | (0.04) | |
| Intercept | −4.75* | −982,560.90* | 0.19 |
| (1.33) | (153,946.8) | (1.21) | |
| N | 253 | 253 | 253 |
| Pseudo | — | .17 | .26 |
Note. Standard errors in parentheses. NPAT = National Political Awareness Test; EREC = Environmental Resources and Energy Committee.
p < .05, two-tailed t test.
Declaration of Conflicting Interests
The author(s) declared no potential conflicts of interest with respect to the research, authorship, and/or publication of this article.
Funding
The author(s) received no financial support for the research, authorship, and/or publication of this article.