
Abstract
During every election cycle, election administrators validate voter registration applications submitted at different times and through various sources, with a notable peak in the demand for voter registration as Election Day approaches. The process of registering to vote, however, is error-prone and may depend on the voter’s capacity to fill a form correctly, or the election administrator’s capacity to successfully process applications as the voter registration window closes. Such errors can limit a prospective, and eligible, voter’s ability to cast a valid ballot. This study assesses the impact of time and registration source on the rates of rejected voter registration applications by analyzing monthly county-level voter registration reports during the 2012 election cycle in Florida. I find that there is a dynamic relationship between administrative and seasonal factors at the county level, which condition the rates of rejected voter registrations as the registration deadline approaches. These findings suggest complications in not only the process of registering to vote that may stem from differences in voter engagement but also the variation in administrative oversight throughout the election cycle.
The relationship between submitting a voter registration application and becoming a registered voter constitutes an understudied topic in the field of election administration, but one that has important implications for a voter’s capacity to cast a ballot on Election Day. Although newly registered voters enter the voter rolls on a daily basis every election year, many others do not, and there is little insight as to what determines whether voter registration applications are successfully processed. At a first glance, voter registration applications submitted by voters whose eligibility is not verified will be rejected as invalid. However, errors in the voter registration process may also result in rejecting an application submitted by an eligible prospective voter. The rates of voter registration rejections, therefore, raise several questions for the administration of elections, particularly insofar as ensuring that eligible-to-vote Americans have access to the electoral process.
Applying to register to vote involves the possibility that one’s voter registration application may be rejected. Aside from not meeting the voter eligibility criteria, such as American citizenship or state residency, among others, voter registration applications submitted by prospective voters may be rejected as a result of administrative errors during the process of verifying voter eligibility. An illegible address or missing information for instance, may make it difficult for local election officials (LEOs) to notify voters about the status of their application. In this case, prospective voters may face difficulties in casting their vote before or on Election Day. Although voters have the opportunity to vote provisionally, per the Help America Vote Act (HAVA) requirements, their ballots will most likely be rejected if their voter registration eligibility is not verified.
Existing work on the administration of elections has only scratched the surface of the dynamics behind rejecting voter registration applications. Scholars document the notable fluctuation in voter registration rejection rates from one election year to another, with localities reporting low rejection rates in one year, and high in the next, or vice versa (Pew Center on the States 2013). Most of the data are drawn from the Election Assistance Commission’s (EAC) biannual Election Administration and Voting surveys (EAVS), which offer an initial look at aggregate-level patterns across the states. Statewide patterns, while helpful, do not explain much of the variation that takes place at the substate level (Ansolabehere and Hersh 2014; Shaw and Hutchings 2013). In a highly decentralized structure of election administration (Hasen 2005), such variation is key in understanding state and local factors that influence the administration of voter registration.
Since the adoption of the National Voter Registration Act (NVRA) of 1993, states have modernized voter registration by adopting reforms that have profoundly impacted the administration of elections. Eligible voters have several options to register to vote, and in many states, voters can register to vote at the same time they turn out to cast a ballot (Burden et al. 2014). Regardless of the timing of a voter registration application, LEOs are responsible for processing all applications and determining whether they are valid or not. Although a few states offer Same Day/Election Day Registration, most states require that voters register to vote several days prior to the General Election. This adds another layer of administrative complexity when processing voter registration applications especially closer to the voter registration deadline, which is often the time when voter interest in the election heightens.
The role of LEOs in the administration of elections has been extensively addressed in the literature, mainly due to the discretion they enjoy when interpreting and implementing rules (Lipsky 1980). Despite concerns that election officials may be administering rules under a partisan lens (Hale and Slaton 2008; Hasen 2005; Kimball, Kropf, and Battles 2006; Kropf, Vercellotti, and Kimball 2012), their interaction with all the agencies that offer voter registration, such as the Department of Motor Vehicles (DMV), is largely overlooked. The main responsibility of election officials is, broadly speaking, to ensure a smooth election process starting with voter registration. This condition does not apply to these agencies, which are additionally required per federal and state election laws to offer the option of voter registration. Election administrators often actively aim “to share information and generate solutions to election issues” with the several actors involved in the election process (Hale and Slaton 2008, 842), yet our knowledge is limited with regard to the impact of these agencies, which play an integral role in the voter registration process, on the capacity of LEOs to successfully process voter registration applications.
This study constitutes a first step in assessing the driving factors behind the variation in voter registration rejection rates at the local level, by focusing on the state of Florida. I argue that the successful processing of voter registration applications is conditioned not only by the state’s institutional context, namely, the voter registration deadline, but also the non-uniform activity of voter registration agencies throughout the election cycle. I draw on monthly voter registration reports submitted to Florida’s Secretary of State by election administrators across 67 counties during the 2012 presidential election cycle. A single-state research design is appropriate to address this research question, as it allows for a more substantive assessment of administrative, institutional, and electoral dynamics at the local jurisdiction level (Burden et al. 2012; Herron and Smith 2013; Merivaki and Smith 2016).
The Process of Registering to Vote in the United States
With the exception of North Dakota, all states require prospective voters to register to vote in order to participate in elections and cast a regular ballot. The minimum voter eligibility standards placed by the federal government involve U.S. citizenship and voting age, while states regulate voter eligibility criteria, such as legal residency within a particular jurisdiction, as well as mental incapacitation and felony conviction. Prospective voters are required to register to vote by their state’s voter registration deadline, which ranges from 30 days prior to a General Election up to Election Day, to be eligible to cast a regular ballot. 1
Although voter registration is in itself an additional step to participation in the electoral process, Americans today have more options to register to vote than they had 20 years ago, and many can do so from the convenience of their own home. As mandated by the NVRA of 1993, states offer voter registration in local motor vehicle offices (motor voter applications), as well as in public and government agencies. Eligible voters are also able to register to vote in person, and by mail. Registration drives, although not explicitly mentioned in the Act, were incorporated into the legislation, which allowed advocacy groups to conduct registration drives with limited regulation from state and local election administrators (Hanmer 2009; Piven, Minnite, and Groarke 2009).
Prospective voters are required to complete a voter registration application, which must be transmitted to the LEO’s office no later than 10 days after submission, to be verified as valid. Voter registration applications are submitted in different ways depending on how prospective voters choose, or where they are offered, to register to vote. When applicants register to vote at local motor vehicle offices for instance, the application is transmitted, in paper form or electronically, by that office to the LEO. Alternatively, the voter may fill an application on her own, and either submit it in person, or mail it to the local elections office within the state-required voter registration deadline. Several Americans register to vote via registration drives, which are required to submit voter registration applications on behalf of the prospective voters to the local elections office.
Voter registration applications, regardless of the source, are verified for completion and the voter’s eligibility, based on state-required criteria, which often vary. As long as they reach the local election administrators’ office, all applications will be processed as valid or invalid. Voters whose applications are processed as valid will be able to cast a regular ballot on Election Day, while voters whose applications are processed as invalid or incomplete will be offered a provisional ballot as HAVA mandates, which will be rejected. The voter’s ability to cast a regular ballot on Election Day, therefore, is directly connected to the success of the voter registration application process, as well as the verification process.
Local Variation in Successfully Processing Voter Registrations
The adoption of the NVRA expanded access to voter registration in local motor vehicle offices, public and state agencies, as well as “set the first ever national standards for mail-in voter registration.” 2 Due to the notable variation in rules and procedures across the states in regard to election laws however, the federal law created several challenges with respect to implementation and the capacity of the states to uniformly comply with several of the Act’s requirements (Electionline.org. 2006; Hess and Novakowski 2008; Tokaji 2008; Election Assistance Commission 2013).
Challenges also stemmed from the lack of clarity in verifying voter registration applications, a task that predominately takes place at the local level. The NVRA does not provide guidance with respect to processing voter registration applications, other than the requirements that the forms are “valid,” received “not later than the lesser of 30 days, or the period provided by State Law,” that states “conduct a general program that makes reasonable effort to remove the names of ineligible voters from the official lists of eligible voters,” and that they “shall not remove the name of a registrant for the official list of eligible voters in elections for federal office on the ground that the registrant has changed residence.” 3 States, therefore, have established their own interpretations of what constitutes a “valid” application, as well as the processing criteria of prospective voter registration applicants. In the case of Florida, voter registration applications are processed based on completion and verification of information that confirms the applicant’s eligibility, particularly “the driver license number, the Florida identification card number, or the last four digits of the social security number provided by the applicant.” “Valid” applications are those that include all the information requested on the voter registration form, after verification from Florida’s Department of State. 4
In principle, the success rates of voter registration applications depend on whether the prospective voter meets certain eligibility criteria; if not, then the voter registration application will be rejected as invalid. 5 In effect, voter registration applications submitted by non-citizens, felons, or even voters who do not reside in the state, will be automatically rejected. In addition, eligible voters have to satisfy certain standards in the application process so that their voter registration can be successfully processed. Aside from being eligible to register to vote, the voter’s capacity to vote in the upcoming election also depends on whether she registered to vote within the designated voter registration deadline. If an application is received within that window and satisfies all eligibility standards, therefore, the applicant will be added in the voter rolls and should have no trouble casting a regular ballot on Election Day.
Conducting elections in the United States includes the daily processing of voter registration applications by local election administrators. Given the notable variation in administrative procedures and practices across local jurisdictions, LEOs are often scrutinized for the discretion they exercise in implementing election rules (Burden et al. 2012; Kimball, Kropf, and Battles 2006; Merivaki and Smith 2016). Research on the administration of provisional voting for instance suggests that LEOs administer rules with a partisan lens, possibly due to their willingness to benefit candidates of the same party (Kimball, Kropf, and Battles 2006). Researchers note, however, that election officials are overburdened due to time constraints, insufficient budget, and limited human resources, all of which can impact their capacity to properly train their staff and prepare them for elections (Bowser, Frederick, and Underhill 2012).
Considering that voter mobilization efforts from political campaigns and advocacy groups surge as Election Day approaches, there are reasons to expect a disproportionate increase in voter registration applications within a short period of time, and especially very close to the voter registration closing date. LEOs’ control in regulating the flow of voter registration applications is limited, or rather nonexistent. Incomplete voter registration applications submitted very close to, or on the day of the voter registration deadline pose an additional problem for LEOs, because they are left with literally no window to contact the voters and notify them of their incomplete application status. With a very narrow time frame to process voter registration applications, especially those with incomplete information, the administrative burden increases and the chances that an eligible voter will successfully enter the voter rolls decrease. As a result, these voters, if otherwise eligible to vote, will not be able to cast a regular ballot on Election Day, but rather an invalid provisional ballot. 6
Voter Registration Timing Hypothesis
As the voter registration deadline approaches, the overall rates of rejected voter registration applications are expected to increase.
The impact of the nonuniform activity of agencies, as well as their interaction with LEOs on the validity rates of voter registration applications has not been adequately addressed in the election administration literature. Per NVRA guidelines, complete applications are transmitted to LEOs for processing; yet, as mentioned before, a uniform definition of completeness does not exist. If there are issues in how the voter registration form is designed, then there should be a certain level of error that would impact prospective voters irrespective of the method. Whereas LEOs are responsible for processing voter registration applications regardless of the submission source, they have no control on the prospective voter’s preferred method of voter registration. In 2012, for example, 24% of Americans reported that they registered to vote at their local DMV, while only 1.2% reported registering in public assistance agencies (Mortellaro and Kanter Cohen 2014). This difference could be explained in terms of increased exposure to motor vehicle offices compared with public assistance agencies, given that Americans visit their local DMVs to get their driver license or their identification.
Recent studies suggest that LEOs face challenges in encouraging public assistance offices to offer voter registration (Hess, Hanmer, and Nickerson 2016), which also appears to be the case with DMV offices across many states (Naifeh 2015). Due to the challenges in actively regulating the implementation of voter registration at different state and public agencies, as well as local motor vehicle offices, advocacy groups and LEOs often encourage prospective voters to register to vote by mail. Mail voter registration applications are among the most common methods of voter registration. In effect, 13.1% of Americans reported that they registered to vote by mail in 2012 (Mortellaro and Kanter Cohen 2014). One of the benefits of mail applications is that prospective voters will include a valid mailing address, which allows LEOs to contact voters in case any required information is missing. Election officials confirm that a missing, invalid, or incomplete mailing address constitutes the biggest challenge when voter registration applications are processed and increases the chances that the prospective voter will not be successfully processed. When filling a mail application, voters are expected to have the time to look it over, fill it correctly, and mail it, or submit it in person to their local elections office. 7 Conversely, if a voter is offered to register to vote on her way out of a shopping mall, it is likely that her voter registration application will be filled in a rush and could be rejected because of typographical errors or missing information.
State and local election administrators are not oblivious to the potential for errors in the process of registering to vote. The fact that an increasing number of states have invested in modernizing voter registration by adopting Online Voter Registration (OVR), which arguably minimizes errors in submitting and processing voter registration applications, suggests that some methods of voter registration may be more cumbersome and error-prone than others, and may thus be associated with higher rejection rates than others.
Due to the variation in the manner with which a prospective voter completes and submits a voter registration application, it is expected that some sources of voter registration are more likely to produce invalid applications than others. Processing applications submitted through state and public agencies should increase the rates of voter registration rejections in a given month, all else equal, because state and public agencies are notorious for not implementing voter registration provisions (Hess, Hanmer, and Nickerson 2016; Hess and Novakowski 2008; Tokaji 2008). They should be the least efficient method of voter registration in terms of submitting valid applications.
Applications in State Agencies Hypothesis
As the rates of voter registration applications submitted in state agencies increase, the overall rates of rejected voter registration applications are expected to increase.
Applications in Public Agencies Hypothesis
As the rates of voter registration applications submitted in public agencies increase, the overall rates of rejected voter registration applications are expected to increase.
Alternatively, the least error-prone voter registration methods are expected to be motor voter and mail applications, as well as applications submitted in person to the LEOs’ offices. DMV applications are arguably the most efficient in producing valid applications, because the applicant’s information, including the mailing address, is required to issue a driver’s license. Insofar as data accuracy and timeliness of processing are concerned, therefore, voter registration applications submitted through the DMV are expected to be associated with low overall rejected voter registration rates. Mail applications are expected to reduce the rates of rejected voter registrations, because the application is completed by the individual voter, who theoretically has time to look over the form carefully and fill it out, and thus minimize potential errors.
Mail Applications Hypothesis
As the rates of registration applications submitted by mail increase, the overall rates of rejected voter registration applications are expected to decrease.
Motor Voter Applications Hypothesis
As the rates of voter registration applications submitted in local motor vehicle offices increase, the overall rates of rejected voter registration applications are expected to decrease.
In-Person Applications Hypothesis
As the rates of voter registration applications submitted in person increase, the overall rates of rejected voter registration applications are expected to decrease.
Processing voter registration applications filled via registration drives constitutes one of the most challenging tasks for LEOs, because often they are missing required voter information, such as a valid mailing address, a date of birth, or the voter’s full name. What is more, voter registration drives mobilize very close to Election Day, and they account for a notable increase in voter registration applications as the states’ voter registration deadline approaches (Mortellaro and Kanter Cohen 2014). In the context of Florida, strict regulations on registration drives in 2011 resulted in tighter deadlines for the submission of voter registration applications to local elections offices. 8 The heightened activity of registration drives, combined with controversies about groups submitting applications that are questionable with regard to their validity necessitates that LEOs monitor their activity more closely, especially as the volume of voter registration applications increases (Herron and Smith 2013; Kasdan 2012).
Registration Drives Hypothesis
As the rates of registration applications submitted via registration drives increase, the overall rates of rejected voter registration applications are expected to increase.
An alternative explanation for the variation in voter registration rejections has to do with location. In rural areas, eligible to vote Americans may prefer registering to vote by mail rather than visiting their local elections office in person. Existing research suggests that more densely populated jurisdictions face more challenges in catering to the electorate’s needs in terms of running elections, because “they receive a disproportionate share of campaign-related activity in national and statewide elections” (Kimball and Baybeck 2013, 134). In these jurisdictions, the interest to mobilize the electorate is higher than in smaller jurisdictions, which results in more active efforts to register to vote, particularly from voter registration drives. In densely populated areas, the administrative burden of processing voter registrations should increase especially when the voter registration deadline approaches, thus increasing the likelihood of errors.
Population Density Hypothesis
As population density increases, the overall rates of rejected voter registration applications are expected to increase.
Research Design, Data, and Methods
To assess the impact of voter registration timing and the various voter registration methods on the rates of rejected applications across Florida’s 67 counties across time, I collected monthly voter registration reports submitted to Florida’s Division of Elections (DOE) by the 67 County Supervisors of Elections (SOEs) between January and December 2012. The Florida DOE provides monthly estimates of the total number of voter registration applications submitted at local motor vehicle offices, by mail, in person, via registration drives, and at public and state agencies, as well as the total number of valid and removed voter registrations. 9 Analyzing monthly voter registration statistics is methodologically advantageous because it allows for a closer look at the dynamics of voter registration during the final weeks before the General Election, which cannot be observed by an aggregate analysis of the EAC’s biannual voter registration statistics (Election Assistance Commission 2013). I focus on one state, namely Florida, to appropriately assess the effects of time in processing voter registration applications by controlling for any institutional variation. Scholars emphasize the advantages of single-state designs to focus on more contextual factors that would otherwise be unobserved (Alvarez, Atkeson, and Hall 2013; Hanmer 2009; Nicholson-Crotty and Meier 2002).
The dependent variable is measured as the percent of rejected voter registrations from the total of all new applications received at the county level in a given month. 10 In Florida, eligible-to-vote citizens may register to vote at their local DMV, by mail, at public and state agencies, in person at their county SOEs’ office, or via registration drives. The key independent variables include the rates of submitted voter registration applications through the DMV, by mail, in person, via registration drives, and in public and state agencies as a percentage of the total number of new applications received in the county per month. 11
The state of Florida requires that voters are registered 29 days before the General Election. For the 2012 Presidential election, the deadline to register to vote was October 9, 2012. 12 An initial look at the overall voter registration submission rates from January to December 2012, it is clear that voter registration application submissions varied, with the highest influx of applications being submitted closer to the October deadline. Between August and September, for instance, there was an increase of approximately 60,000 more voter registration applications submitted, a 36.5% increase. As Figure 1 shows, Floridians registered to vote not only at different rates over time but also through various sources. The most notable patterns in 2012 involved the increase in voter registration applications submitted in person in March (22,790), and between September and October, as well as applications submitted through registration drives in April, and between August and September; registration drives accounted for a total of 20,109 voter registration forms submitted statewide in September 2012, an increase of 44.6% from August 2012. 13 Mail voter registration applications also increased between August and September by a total of 26,737, or 54%. Applications submitted by mail gradually increased in June, and reached their peak between September and October, totaling 60,729, or 32% of all voter registration applications submitted in October. 14

Percentage of voter registration application submissions in Florida in 2012.
Most counties follow the statewide pattern with applications submitted through local motor vehicle offices dominating the process of voter registration, although this changes as the voter registration deadline approaches. Whereas registering to vote in person and by mail is very popular in Florida, registration drives are particularly active in assisting eligible Floridians to register to vote during the final weeks before the state’s closing book date. The overall decrease in voter registration applications submitted at local DMVs in September and October, therefore, appears to be substituted by an increase in voter registration submissions by mail, in person, as well as registration drives.
A closer look at individual counties, however, uncovers interesting patterns with respect to the timing and activity of the various voter registration methods. As Figure 2 shows, approximately 65% of all voter registration applications in March were submitted in person in Miami-Dade County, with a notable drop in May, and a gradual increase between June and October. Voter registration submissions by registration drives, as well as mail applications increased between July, September (38.5% in mail applications), and October (38% in submissions via registration drives). This is expected as Miami-Dade County is densely populated, and several groups use both methods of registration to mobilize eligible Americans to register to vote once voter interest in the Presidential election peaks.
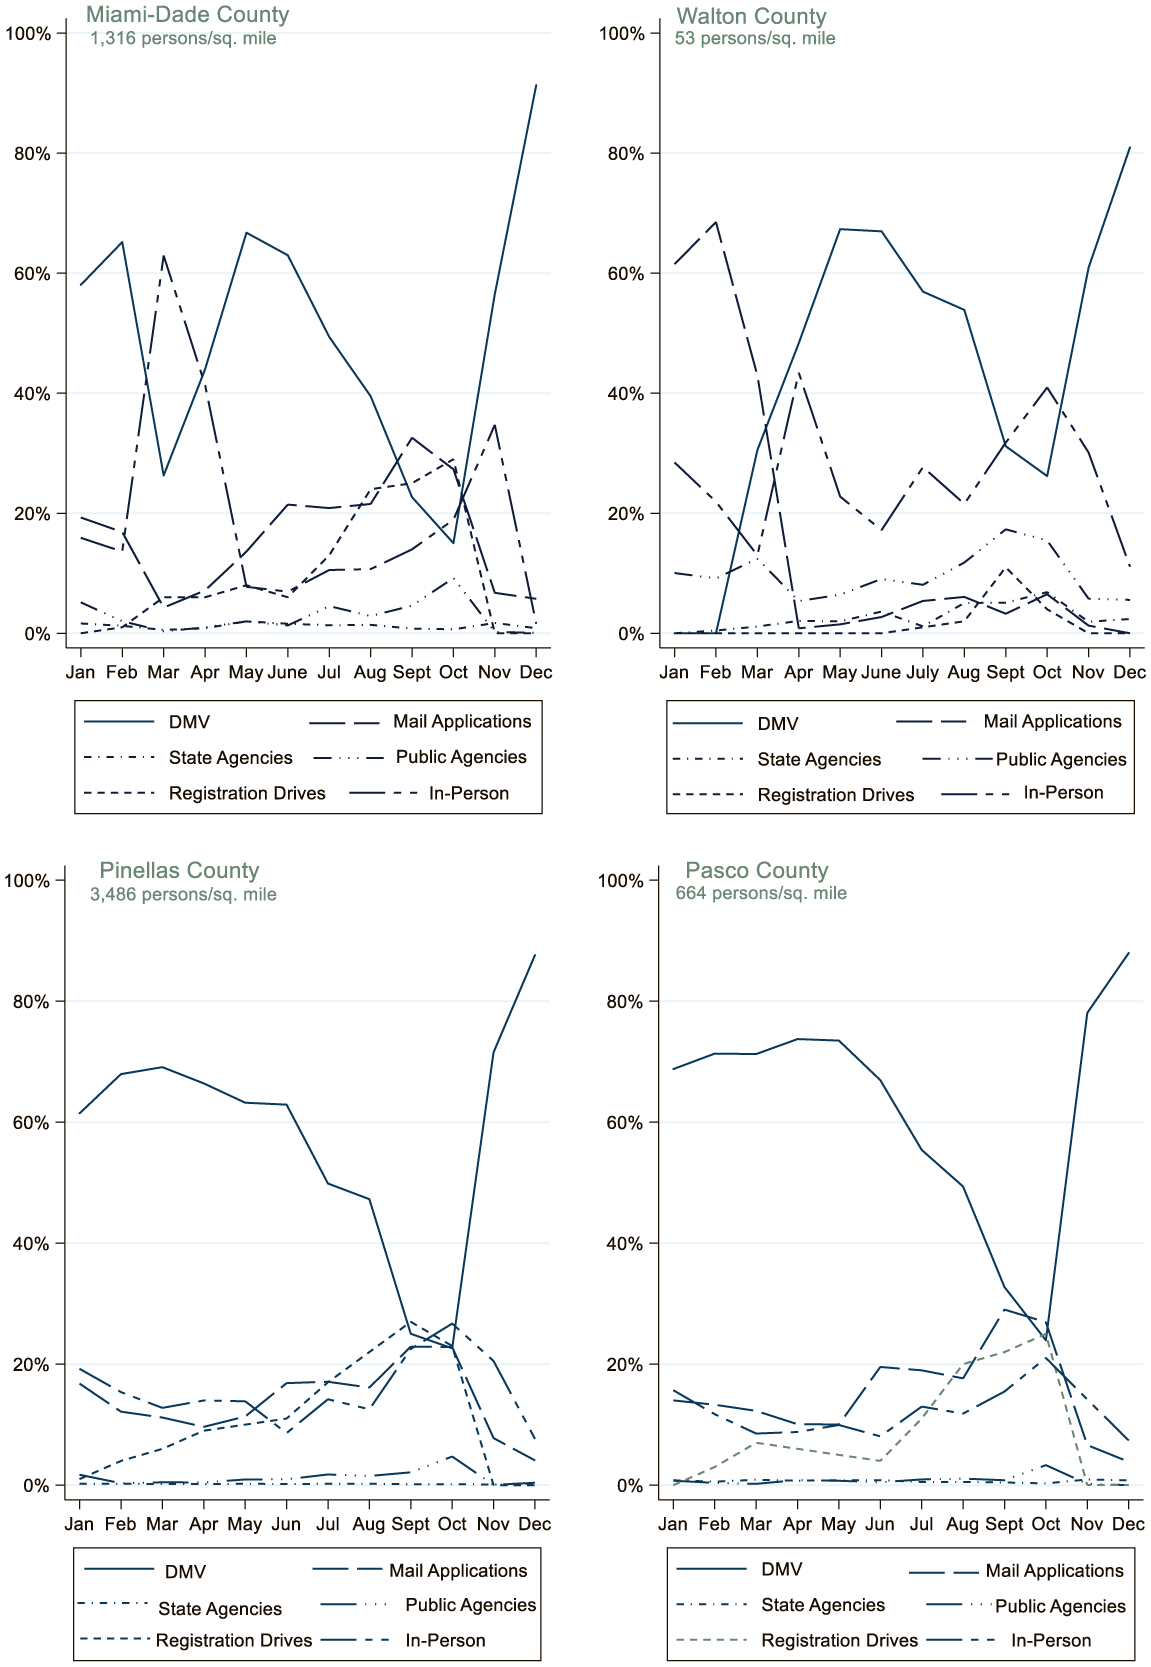
Percentage of voter registration application submissions in Miami-Dade, Walton, Pinellas, and Pasco counties in 2012.
Conversely, Walton County constituted an outlier among rural counties, with voter registration applications overwhelmingly submitted by mail in January (60%), February (68%), and March (42%). Motor voter applications also followed a different pattern in Walton County in January and February, with less than 1% of all voter registration applications submitted through local motor vehicle offices. This might be explained in terms of exposure to such agencies; Walton County residents may prefer to register to vote by mail, as the high submission rates demonstrate. However, in-person applications were also higher than DMV applications in January (28%) and February (21%) and fluctuated throughout the election cycle. This suggests that there is a more complex relationship between a county’s population density and the voters’ preferred method of registration, but it may also uncover some potential compliance issues at the DMV in that particular county.
Registration drives in Walton County only peaked in September, very close to Florida’s voter registration deadline, yet did not account for more than 11% of all submitted applications. Contrasting this finding with Miami-Dade County, it is indicative of how registration drives mobilize depending on their target electorate. For instance, there is evidence that registration drives usually mobilize in areas with underrepresented electorates, such as ethnic, racial, and language minorities (Herron and Smith 2013; Montellaro and Kanter Cohen 2014). The mobilization of registration drives in specific areas could thus potentially explain the high rates of voter registration applications submitted through 3PVROs, especially closer to Election Day.
As the NVRA mandates, however, states and localities should aim to register voters as “actively” as possible, irrespective of the size of the registered electorate. Whereas the Miami-Dade and Walton Counties comparison suggests that the activity of registration drives may depend on the jurisdiction’s population density, the comparison of Pinellas County, Florida’s most densely populated county (3,486 persons per square mile), and Pasco county, which has a population density of 664 persons per square mile, contradicts this claim. In both Pinellas and Pasco Counties, mail applications, as well as in-person applications and applications submitted via registration drives started to increase between June and October. In the month of September, 29% of all voter registration applications were submitted by mail in Pasco County compared with 22% via registration drives, whereas in Pinellas County, 23% of all applications were submitted by mail, compared with 27% submitted via registration drives. 15
In the context of Florida politics, the activity of registration drives is of particular significance, after efforts by the state legislature in 2011 to restrict groups who were conducting voter registration activities because of concerns over alleged fraud. 16 In 2012, the Florida state legislature enacted a law that restricted the activity of voter registration drives, or 3PVROs, and research confirmed that groups halted their grassroots voter registration activities to avoid penalties for not meeting the law’s requirements (Herron and Smith 2013). Notwithstanding the administrative limitations for voter registration drives as a result of state legislative intervention, Florida’s voter registration application rates submitted through other means (DMV, mail, state and public agencies, and in-person) should not have been dramatically affected. However, even if the activity of registration drives decreased in 2012 compared with previous election years, in terms of the number of voter registration applications submitted, the data show that they in fact mobilized, and accounted for an increase of 44.6% in voter registration applications from August to September 2012, prior to the October 9 voter registration deadline (Figure 1).
Regarding invalid, or rejected, voter registration applications, the average rejection rate in Florida between January and December 2012 was approximately 11%, with a temporary spike of 24% in April (Figure 3). Interestingly, rejection rates dramatically drop in October and increase again between November and December of 2012. This might be because prospective voters only had nine days in October to register to vote to participate in the November election, but the available data capture voter registrations processed during the whole month of October. Despite the overall low voter registration rejection rates across Florida, the variation across the counties was significant across time. In Duval County, for example, 56% of voter registration applications were rejected in March 2012, with Baker County coming second in rejected voter registration forms in May (54.5%). Putnam County had the highest rejection rates across all 67 counties in September 2012, at approximately 30%.
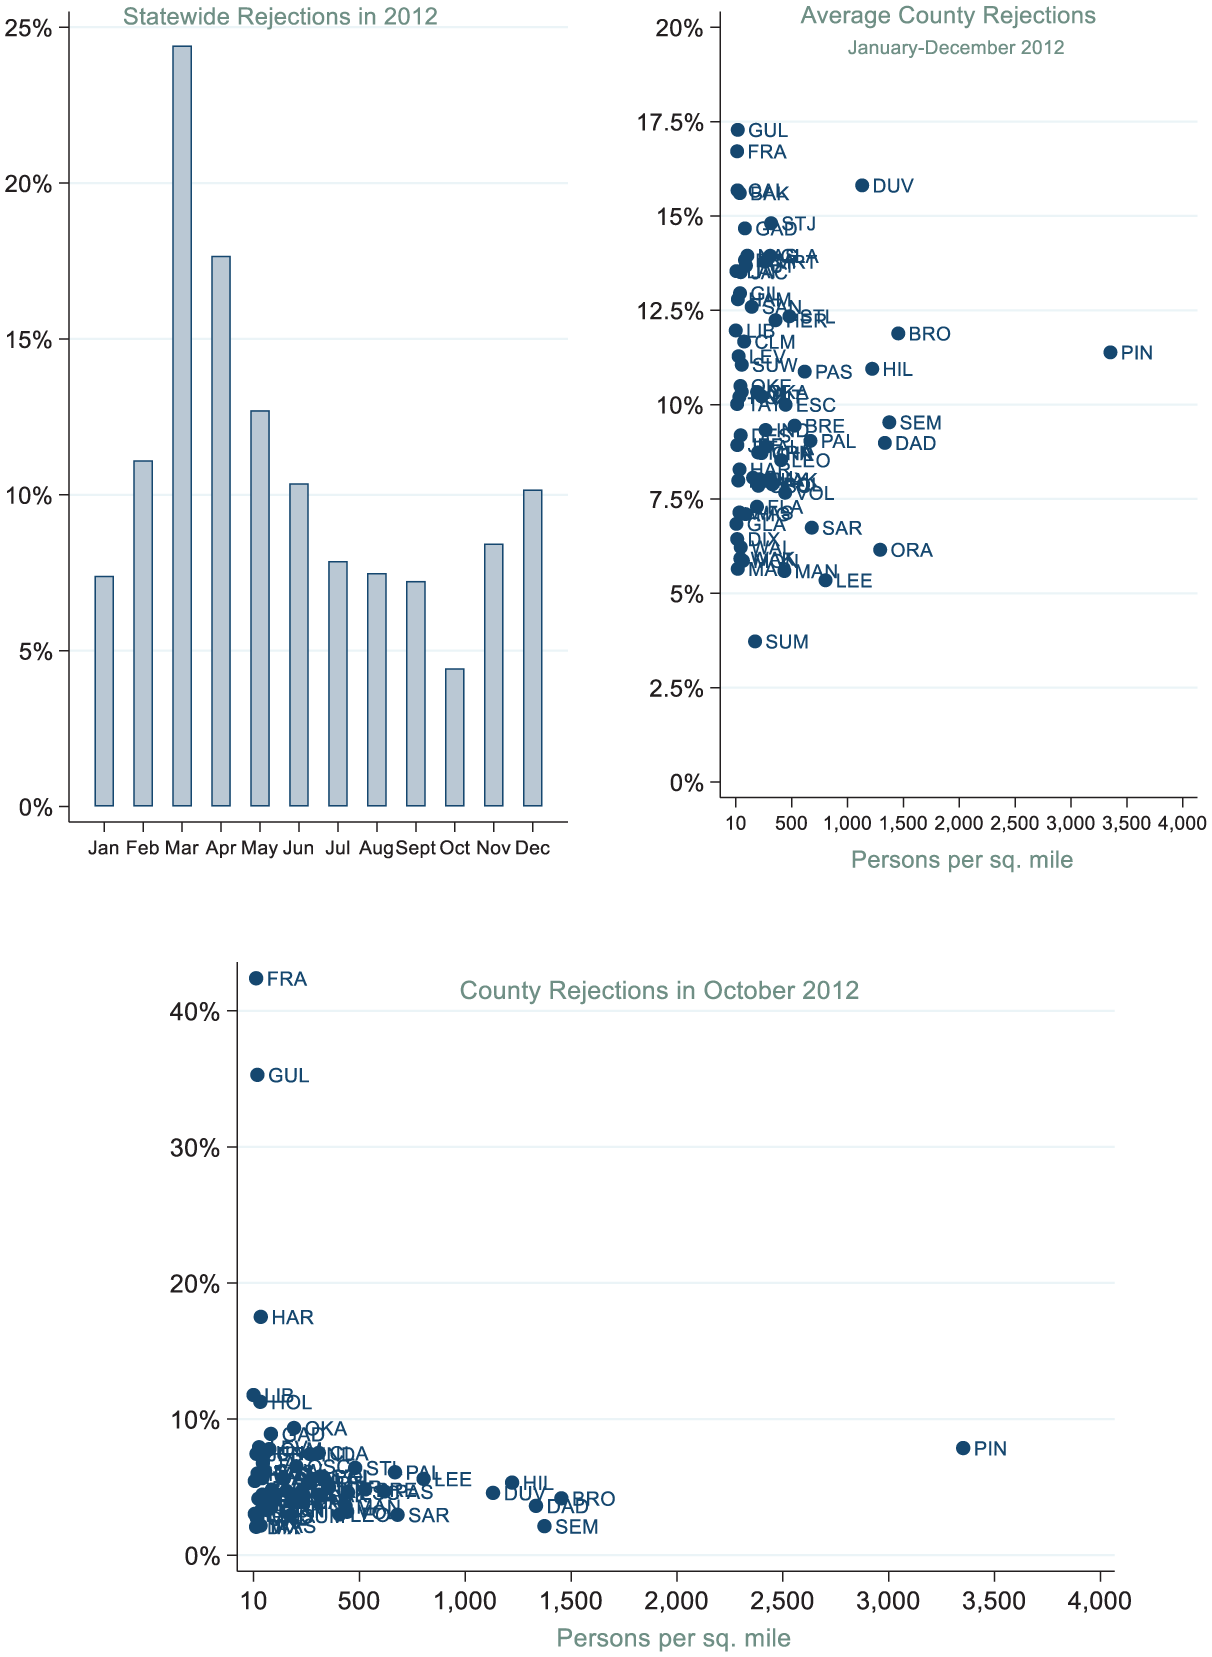
Rejected voter registrations rates in Florida in 2012.
Figure 3 presents an interesting pattern with respect to population density and overall voter registration rejections. At first glance, it is not clear whether densely populated counties might have higher rates of rejected voter registrations. Gulf and Franklin counties are outliers compared with the rest of the Florida counties, rejecting 17.3% and about 17% of all voter registration applications submitted in their jurisdictions between January and December 2012. Madison County, however, which is almost identical to Gulf in population density (28 persons per square mile), rejected approximately 6% of all voter registrations submitted in 2012. Among the densely populated counties, such as Duval, Miami-Dade, Orange, and Broward Counties, the average rejection rates also varied, with Duval County rejecting on average 15% of all voter registration applications submitted in 2012, compared with an average of 6.1% of rejections in Orange County.
The lowest overall voter registration rejection rates appeared in October of 2012 (3%), yet counties varied dramatically in how many voter registrations they rejected that month. Franklin County had low voter registration rejection rates between January and December of 2012 apart from the month of October, which suggests a possible increase in administrative burden in rural jurisdictions resulting from the influx of voter registrations very close to the voter registration deadline. In effect, between September and October, there was a 62% increase in voter registrations in Franklin County. On the contrary, Holmes County reported rejecting about 12% of all submitted voter registration applications in October and had a 44% increase in voter registrations submitted between September and October. These patterns indicate administrative issues in processing voter registration applications when the volume of voter registration applications dramatically increases in a short period of time.
The most persistent pattern when comparing voter registration submission rates across Florida’s 67 counties is that the voter registration load shifts over time, and notably increases as the voter registration deadline for the 2012 General Election approaches. To assess the effects of timing and method of voter registration on the county’s overall voter registration rejections, I employ a time-series feasible generalized least squares regression model (FGLS) with robust standard errors, clustered by county, to account for within-cluster correlation or heteroskedasticity (Model 1). FGLS models correct for the presence of autocorrelation within panels and for cross-sectional heteroskedasticity and autocorrelation across panels by essentially weighting the squared residuals. 17 Because there are reasons to expect that the administrative load for processing voter registrations increases closer to the October deadline, I estimate a second FGLS model with time-fixed effects, clustered by county, using the month of September as the baseline month (Model 2). Although Florida’s voter registration deadline, as mentioned before, was on October 9, 2012, most of the voter registration activity is captured in September. Any seasonal effects, therefore, will be visible when compared with September. Finally, to account for any unobserved heterogeneity between counties, I estimate a third FGLS model with time- and county-fixed effects, using Pinellas County as the baseline county (Model 3).
To gauge any potential administrative discretion, I control for the partisanship of the County SOEs. In the literature on casting and accepting provisional ballots, which are essentially the failsafe option for voters whose voter registration status is not verified, it is argued that local election administrators often use their discretion when deeming if a potential voter is eligible to cast a regular ballot (Kimball, Kropf, and Battles 2006). 18 Finally, I control for county population density, by including the number of persons per square mile. 19
Findings
The findings confirm that there is a relationship between the method of voter registration and county voter registration rejection rates of all voter registration applications submitted between January and December 2012. According to the time-series baseline model (Figure 4), neither motor voter registration applications nor in-person applications had any impact on the county’s overall voter registration rejection rates, which is counter to my original hypothesis. 20 This is an interesting null finding, especially since applications submitted at local DMVs in Florida are electronically transmitted to the county SOEs offices. 21 My hypothesis regarding voter registrations submitted by mail is confirmed. For a 10% increase in mail applications, the county’s overall rejection rates decrease by about 1.9%, ceteris paribus. Although the impact appears to be small in magnitude, it is a significant finding, and indicates that mail voter registration applications may leave little room for error compared with other methods of registration. Counter to my original hypotheses about the relationship between applications submitted via voter registration drives and voter registration rejections, I find that for a 10% increase in applications submitted through 3PVROs in Florida between January and December 2012, the county overall voter registration rejection rates decreased by about 1%, all else equal. Although small in magnitude, this finding might counter claims that applications submitted via registration drives are more prone to errors than other methods of voter registration. 22
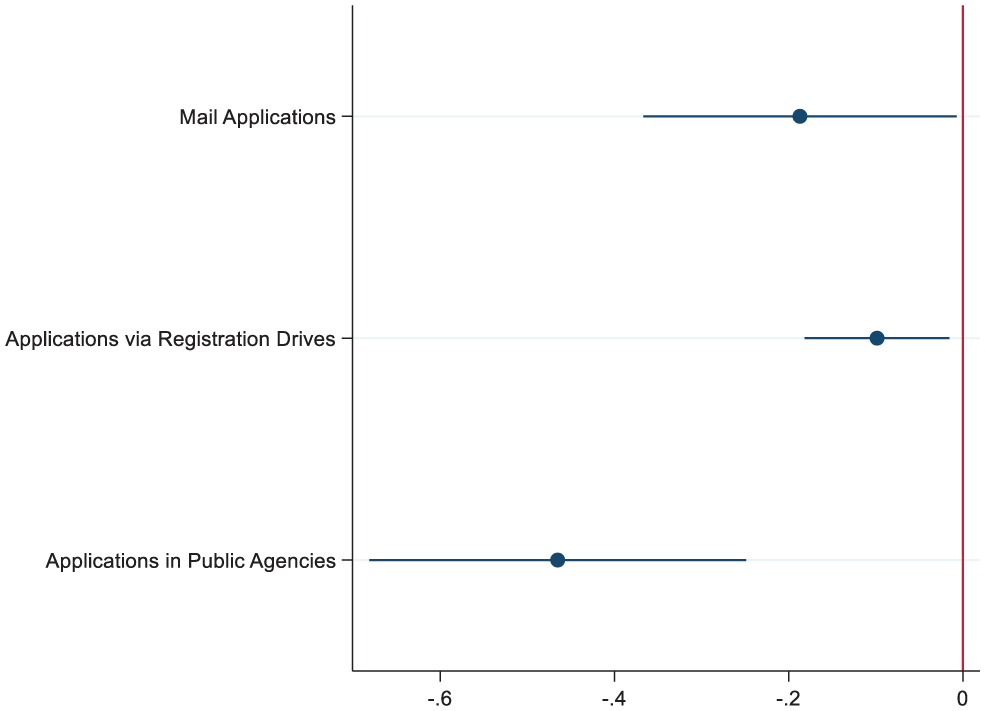
Impact of voter registration methods on voter registration rejections in Florida in 2012.
Voter registration applications submitted through public agencies, such as public libraries and Armed Recruitment Offices, were also found to decrease the county overall rates of rejected applications. A 10% increase in voter registration applications submitted in public agencies decreased voter registration rejections by about 4.6%, ceteris paribus. This is counter to my original hypothesis that registering to vote in state agencies, such as public assistance offices, as well as public agencies involves the same risk of errors in the process of voter registration. The fact that applications submitted through state agencies has no impact on voter registration rejections suggests that there are more contextual differences between these types of agencies; despite that fewer voters register to vote in public and state agencies compared with local DMVs or by mail, it is possible that there are systematic differences in which type of voters choose, or are offered the option to register to vote in a public assistance agency rather than a public library.
I do not find evidence that the partisanship of the County Supervisor affects the county’s voter registration rejection rates in 2012 in the baseline model. This is counter to extant research that finds evidence of partisanship in administering elections (Kimball, Kropf, and Battles 2006). Finally, population density is not found to increase the county’s overall rejection rates between January and December 2012, which seems to be consistent with the absence of a notable pattern between population density and average rejection rates (Figure 3).
The time-fixed effects model (Figure 5) depicts a slightly different picture with respect to the impact of seasonal and administrative factors on overall voter registration rejections. Although the null findings for motor voter and in-person applications, as well as applications in state agencies remain, mail applications and applications via registration drives are no longer statistically significant, once controlling for time during the 2012 election cycle. Interestingly, the statistical significance and magnitude of public agencies carries over in this model. For a 10% increase in applications submitted in public libraries and armed forces recruiting agencies, the county overall voter registration rejection rates decrease by 3%, ceteris paribus. Once controlling for time, population density is found to increase voter registration rejection rates, but in a negligible manner. Moving from an average county of 340 people per square mile to one of 440 people per square mile yields a .07% increase in rejected voter registrations. This finding appears to support the expectation that larger jurisdictions pose challenges for local election administrators because they are required to service more constituents than in smaller jurisdictions.
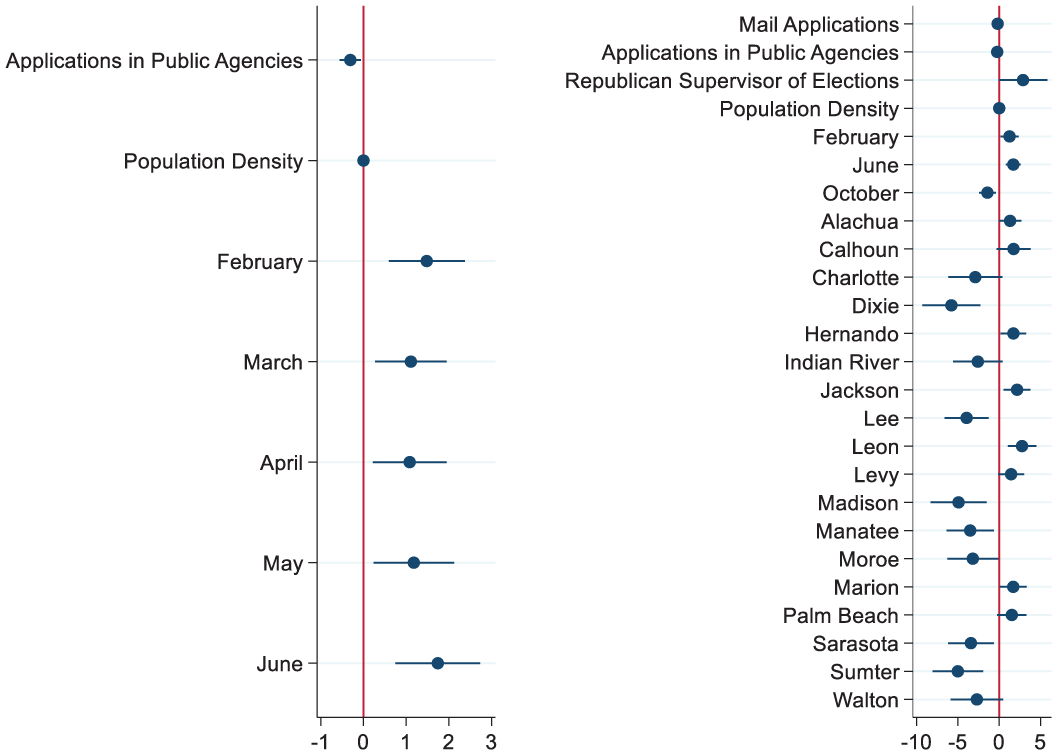
Seasonal and administrative impact on rates of voter registration rejections in Florida in 2012.
Contrary to my expectations about the closeness of the voter registration deadline and its impact on the county voter registration rejection rates, I find that voter registration rejection rates in 2012 increased as close as three months before Florida’s voter registration closing date. Compared to September, June increased the rates of rejected applications by 1.7%, all else equal. February and March also increased voter registration rejections by 1.5% and 1.1%, respectively, ceteris paribus. As Florida held its presidential primaries in January 31, attributing this increase in rejected applications to the primary election deadline is not appropriate. It appears that there are different dynamics driving voter registration rejections at different points during an election cycle. It is possible that an increase in the rates of rejected voter registrations reflects an increase in outreach from advocacy groups or governmental agencies. According to many Florida County SOEs for instance, the month of April is reserved for voter outreach in local high schools, with the goal to pre-register eligible high-school students. Among all the voter registration applications submitted during that month, therefore, Florida County elections officials confirm that errors often arise from processing applications completed in local high schools and submitted to the county elections offices. This is consistent with the positive and statistically significant impact of April on the overall voter registration rejection rates.
In the absence of individual-level data across all 67 Florida counties, it is not possible to systematically assess whether youth pre-registrations are driving these patterns at the county level. What is more, the state of Florida prohibits the disclosure of method of voter registration for individual voters, which poses further challenges in determining the exact impact of voter registration method at a specific point in time on verifying voter registration applications. 23 Insofar as seasonal effects are present, however, a Wald test for the equality of the month coefficients confirms that they are different, and thus offers more evidence in support of the non-uniform impact of time on the successful processing of voter registration applications.
Individual-level data could potentially shed light into these seasonal patterns found in Model 2, such as that voter registration rates are higher at least three months prior to the October voter registration deadline. Prospective voters who submit voter registration applications months in advance may be more likely to make errors when registering to vote. At the same time, however, County SOEs have more time to reach voters whose applications contain errors and offer them the opportunity to correct them. As the time-fixed effects model suggests, the time of voter registration has a positive impact on a county’s overall rates of rejected voter registrations, but not in the hypothesized direction. Compared to September, for instance, October is no more or less associated with voter registration rejections, which appears to counter the expectation that that the flow of voter registrations so close to the voter registration deadline may have increased the burden of county election administrators. Given that at this point in the election cycle voters are mobilized and interested in elections, it is possible that they will be less likely to make errors when registering to vote close to the voter registration deadline.
A look at Pinellas County confirms that voters who registered to vote between October 1 and 9, 2012, had better chances of successfully registering to vote compared with other months. For instance, from the 7,956 voter registration applications submitted in the whole month of October, Pinellas County reported that 7,522, or about 95%, were submitted October 1 and 9. 24 From all voter registration applicants who submitted voter registrations within that period, only 533, or 7%, had their voter registrations rejected due to missing information or because the applicant was not eligible to vote (non-citizen or known felon), while the remaining 93% had their voter registration applications processed as valid. That said, 60% (320) of these applicants whose voter registrations were rejected had missing or invalid information on their voter registration form, from the last four digits of their Social Security Number, residential address, or birthdate. 25 In addition, 58% of applicants had their voter registrations rejected due to similar problems in September and July, compared with 60% in August. These applicants were not able to verify or update the missing information, and as a result would not have been able to submit a regular ballot in 2012 in Pinellas County. Although the data do not allow for inferences based on method of voter registration, they strongly suggest that eligible voters do make mistakes when registering to vote closer to the voter registration deadline and face significant challenges in casting a vote, even though they constituted a small minority of all new registered voters, at least in Pinellas County.
The example of Pinellas County demonstrates how seasonal and administrative factors condition the successful processing of voter registration applications particularly during the last weeks of the General Election, although it may not be representative of all 67 counties in Florida. However, it suggests the existence of differences at the county level which are not captured by the time-series and time-fixed effects models. In Model 3, I plot the statistically significant coefficients from the time- and county-fixed effects model. Holding everything else constant, the findings confirm my hypothesis that voter registrations submitted by mail decrease voter registration rejections. More specifically, a 10% increase in mail applications decreases the county’s overall rejections by 1.8%. The fact that this finding is statistically significant once controlling for time and local effects strongly suggests that as a method of registration, registering to vote by mail may be less error-prone than others. The most consistent finding that carries over all models is that applications submitted in public agencies decrease the rates of rejected applications, by about 2.4% for every 10% increase in such applications. In-person applications, as well as motor voter applications and applications submitted via registration drives were not statistically significant once controlling for seasonal and local variation.
Interestingly, I find that in counties with Republican SOEs, the rates of rejected voter registrations increase by approximately 3%, all else equal, although the relationship is not very strong (p = .057). The lack of consistency in administrative impact suggests that there are more contextual factors influencing the administration of elections, which are not captured solely by the LEO’s partisanship and are consistent with the suggestion that voter registration applications may be received “spoiled” by LEOs and therefore they have no option but to reject them as invalid or incomplete. Finally, in consistence with the baseline model, population density is not statistically significant, which further points to potential administrative challenges with processing voter registrations that may not be related to the density of the prospective electorate.
Regarding seasonal effects, I find evidence that the voter registration rejections decrease in October compared with September (1.4%), ceteris paribus. This finding supports my hypothesis about verifying voter registrations within a smaller window of time and is consistent with the data presented from Pinellas County. However, the same does not hold for August and July. In contrast, February and July increased the rates of rejected voter registrations by 1.2%, ceteris paribus. A Wald test confirms that the difference among the time coefficients are statistically significant, which further points to the existence of time-contextual factors that condition the processing of voter registration applications, when everything else is held constant.
The county-fixed effects model shows that some counties are associated with higher voter registration rejections than others, holding all else equal. Compared with Pinellas County, the rates of rejected applications increased in Alachua, Hernando, Jackson, Levy, Marion, and Palm Beach Counties by no more than 1.7%, except for Leon County, where voter registration rejections increased by 2.7%. Conversely, Charlotte, Dixie, Indian River, Lee, Madison, Manatee, Sarasota, Sumter, and Walton Counties were associated with lower voter registration rates, when holding all other factors constant. In effect, in Sumter and Madison Counties voter registration rejections decreased by 5%, ceteris paribus. This variation in local effects confirms that regardless of the timing of voter registration submissions and method of voter registration, there exist additional local administrative factors that may impact the processing of voter registration applications. 26
Discussion
The findings strongly suggest the existence of seasonal and administrative effects and the disproportionate impact on the capacity of Florida LEOs to successfully process voter registration applications at different times during an election cycle. Given that the influx of voter registration applications peaks during the last weeks prior to the voter registration deadline, and so do the rates of rejected voter registrations, it appears that voter registration rejections stem from administrative challenges in processing applications in short time intervals. However, due to the fact the rates of rejected voter registrations also increase as early as eight months prior to the voter registration closing book date may have to do with the voters’ capacity to avoid errors when completing voter registration forms. This is an important point, which necessitates further research on the design of voter registration forms to comprehend the most common errors made by prospective voters. As the evidence from Pinellas County suggest, even though most voters submitted complete and valid voter registration applications between October 1 and 9, 2012, many of those who did not were eligible citizens who essentially did not have the time to correct any missing information, and therefore would not have been able to cast a valid vote in the 2012 Presidential Election. To adequately explore these individual-level dynamics across several jurisdictions, future research should aim to investigate any systematic differences between voters who attempt to register to vote early in the election cycle, or very close to the voter registration deadline.
Concerns about the questionable validity of voter registration applications are used to justify state reforms that regulate the administration of voter registration. An example of this behavior is Florida’s 2011 HB 1355, which imposed onerous restrictions to 3PVROs, and severely undermined their ground operations during the 2012 Presidential election (Herron and Smith 2013). Scholars caution against the arguably politically charged restrictions on registration drives, especially in the absence of systematic voter fraud (Joyce 2009). Despite the fact that advocacy groups often make headlines for encouraging eligible voters, but also dead animals, to register to vote, there is little systematic evidence thus far to suggest that registration drives produce more invalid voter registrations than DMV applications (Caputo 2016).
The process of submitting and verifying a voter registration application has important implications insofar as evaluating the impact of the voter registration infrastructure on the administration of voter registration among all voter registration sources. The variation in how and when Americans register to vote, in combination with a localized network of election administration requires a more detailed examination of the dynamics between the administration of voter registration and the processing of voter registration applications. This is especially significant once taking the context of time into consideration. Prospective voters attempt to register to vote every day, through different methods, depending on where they are located, while their application form is processed by the LEO, and confirmed by the state election official for validity. Throughout this process, some individuals are denied access to the electoral process, for reasons unknown.
During the last decade, many states have taken a step further from the NVRA and adopted reforms that modernized the process of voter registration by increasing access and minimizing administrative errors. Despite evidence in support of existing problems with state compliance of key NVRA provisions (Electionline.org. 2006; LeRoux 2011; Tokaji 2008), states have overall managed to provide voter registration applications more liberally. However, it is unknown whether increased access is translated into successful voter registration. As the Florida example shows, the rates of voter registration rejections increased as the voter registration deadline for the General Election approached, despite the overall increase in the valid voter registrations during that period.
OVR promises 100% voter registration success, and minimal administrative costs. Although it is a very popular reform and adopted by more than 35 states and the District of Columbia, it does not replace the available methods of voter registration. If registering to vote online increases the likelihood that one’s voter registration application will be successfully processed in comparison to registering to vote in person or through state and public agencies, then it follows that eligible voters do not have equal access to voter registration because of the fact that one method increases the risk of producing invalid applications.
At the same time, the key to successful voter registration lies in ensuring that voters fill out the form correctly and include their contact information. As the 2012 Florida data demonstrate, there is significant variation in voter registration rejection rates at the county level, depending on the nonuniform activity of the available voter registration agencies and groups. In that respect, successful voter registration is not necessarily dependent on the liberalization of voter registration, but on the manner with which voters complete these forms, as well as how voter registration applications are processed. LEOs could encourage prospective voters to register to vote by mail, especially since there is evidence suggesting that mail applications are associated with lower overall registration rejection rates.
This study should also serve as a first step in clarifying that “high” voter registration rejection rates is a relative term, which requires a closer look at the relationship between voter registration sources, local election administration, and the validity of voter registration applications. If, for example, research finds that voter registration applications submitted by 3PVROs are rejected at higher rates than other methods, then it is possible that regulating (but not necessarily restricting) registration drives can lead to fewer voter registration errors. If, on the contrary, findings show that other methods, such as the DMV in August 2012 in Florida, submit voter registration applications that are rejected in high numbers, then state legislators need to address how voter registration is administered at motor vehicle offices prior to implementing OVR. Researchers should consider addressing these questions in different states with similar institutional frameworks, given the legal restrictions that Florida poses in regard to collecting data on the applicant’s method of voter registration.
It is also important to interrogate closely the reasons why voter registration applications are rejected, and whether localities and states implement uniform rules when determining voters’ eligibility. There is still little that we know when it comes to providing a failsafe to eligible Americans who submit voter registration applications, which at minimum indicates a willingness to cast a ballot on Election Day. Researchers highlight the issues that voters experience on Election Day when they attempt to cast a ballot, many of which result from voter registration problems. At the same time, it is important for researchers to assess how many of the new voter registration applicants are rejected as ineligible and how states and localities define “ineligibility.” Non-American citizenship, for instance, immediately disqualifies an applicant from registering to vote. Aside from citizenship, it is not clear which eligibility criteria LEOs in other states utilize to process a voter registration. Taking a step back therefore, and understanding what is taking place before Election Day that may be deterring voters from successfully entering the voter rolls will inform researchers, practitioners, as well as election officials of the problem areas that consistently impact the accessibility of the electoral process.
Footnotes
Appendix
Rates of rejected voter registration applications in Florida, January to December 2012.
| 2012 Election cycle (January-December) | Model 1 |
Model 2 |
Model 3 |
|---|---|---|---|
|
|
|||
| Motor voter | −0.063 (0.058) |
−0.055 (0.061) |
−0.047 (0.039) |
| −0.187**
(0.090) |
−0.147 (0.097) |
−0.182***
(0.043) |
|
| Registration drives | −0.099**
(0.042) |
−0.065 (0.044) |
−0.024 (0.066) |
| State agencies | −0.121 (0.136) |
−0.149 (0.151) |
−0.147 (0.146) |
| Public agencies | −0.465***
(0.108) |
−0.308**
(0.125) |
−0.239**
(0.107) |
| In-person | −0.076 (0.062) |
−0.043 (0.066) |
0.044 (0.044) |
|
|
|||
| Republican County Supervisor of elections | 0.504 (0.308) |
0.488 (0.305) |
2.881*
(1.509) |
|
|
|||
| Persons per mile2 | 0.001 (0.0003) |
0.001**
(0.000) |
0.000 (0.001) |
|
|
|||
| January | — | 0.095 (0.479) |
−0.231 (0.495) |
| February | — | 1.481***
(0.446) |
1.254**
(0.556) |
| March | — | 1.109***
(0.418) |
0.722 (0.530) |
| April | — | 1.082**
(0.432) |
0.538 (0.527) |
| May | — | 1.179**
(0.471) |
0.721 (0.549) |
| June | — | 1.740***
(.497) |
1.708***
(.453) |
| August | — | 0.458 (0.503) |
0.179 (0.418) |
| July | — | 0.437 (0.586) |
0.157 (0.471) |
| October | — | −0.455 (0.603) |
−1.426***
(0.514) |
| November | — | −0.045 (0.470) |
−0.561 (0.497) |
| December | — | 0.083 (0.396) |
−0.238 (0.632) |
|
|
|||
| Alachua | — | — | 1.312*
(0.688) |
| Baker | — | — | −1.994 (1.568) |
| Bay | — | — | −2.183 (1.523) |
| Bradford | — | — | 1.463 (0.905) |
| Brevard | — | — | −1.057 (1.45) |
| Broward | — | — | 0.832 (1.015) |
| Calhoun | — | — | 1.741*
(1.044) |
| Charlotte | — | — | −2.897*
(1.664) |
| Citrus | — | — | −1.132 (1.528) |
| Clay | — | — | 1.160 (1.414) |
| Collier | — | — | −2.154 (1.559) |
| Columbia | — | — | −1.661 (1.917) |
| Miami-Dade | — | — | 4.449 (2.735) |
| Desoto | — | — | −0.008 (0.857) |
| Dixie | — | — | −5.790***
(1.788) |
| Duval | — | — | −0.170 (1.269) |
| Escambia | — | — | −0.398 (1.457) |
| Flagler | — | — | 0.249 (0.725) |
| Franklin | — | — | 0.608 (1.704) |
| Gadsden | — | — | 1.058 (1.060) |
| Gilchrist | — | — | −2.225 (1.659) |
| Glades | — | — | 0.643 (0.854) |
| Gulf | — | — | −0.467 (2.013) |
| Hamilton | — | — | 0.673 (1.310) |
| Hardee | — | — | −1.532 (0.993) |
| Hendry | — | — | −0.485 (0.867) |
| Hernando | — | — | 1.716**
(0.788) |
| Highlands | — | — | −194 (0.733) |
| Hillsborough | — | — | 1.899 (1.566) |
| Holmes | — | — | 0.560 (0.969) |
| Indian River | — | — | −2.588*
(1.525) |
| Jackson | — | — | 2.165***
(0.823) |
| Jefferson | — | — | 0.142 (1.027) |
| Lafayette | — | — | −2.573 (1.974) |
| Lake | — | — | 1.117 (0.857) |
| Lee | — | — | −3.947***
(1.358) |
| Leon | — | — | 2.760***
(0.880) |
| Levy | — | — | 1.439*
(0.799) |
| Liberty | — | — | 0.380 (1.314) |
| Madison | — | — | −4.92***
(1.727) |
| Manatee |
— |
— |
–3.506*** (1.461) |
| Monroe | — | — | −3.196**
(1.569) |
| Marion | — | — | 1.699**
(0.819) |
| Martin | — | — | −1.143 (1.656) |
| Nassau | — | — | −0.189 (1.627) |
| Okaloosa | — | — | −1.008 (1.485) |
| Okeechobee | — | — | −.751 (1.22) |
| Orange | — | — | .832 (1.352) |
| Osceola | — | — | −144 (0.791) |
| Palm Beach | — | — | 1.528*
(.903) |
| Pasco | — | — | 0.043 (1.453) |
| Polk | — | — | 0.144 (0.938) |
| Putnam | — | — | −1.358 (1.712) |
| Santa Rosa | — | — | 0.240 (1.523) |
| Sarasota | — | — | −3.424**
(1.412) |
| Seminole | — | — | −0.222 (1.202) |
| St. Johns | — | — | 1.451 (1.543) |
| St. Lucie | — | — | 1.002 (0.837) |
| Sumter | — | — | −5.004***
(1.553) |
| Suwannee | — | — | 1.132 (0.870) |
| Taylor | — | — | −0.254 (1.054) |
| Union | — | — | −0.816 (1.394) |
| Volusia | — | — | −1.132 (1.493) |
| Wakulla | — | — | −0.598 (0.830) |
| Walton | — | — | −2.704*
(1.617) |
| Washington | — | — | −1.161 (1.011) |
| Weight | 17.992***
(6.211) |
14.383**
(6.558) |
11.558***
(4.255) |
| R 2 | .761 | .774 | .8411 |
| N | 801 | ||
Note. Feasible generalized least squared regressions, with robust SEs in parentheses. Regression diagnostics for multicollinearity were run for all models. The VIF indicator was within the acceptable tolerance value range. See Kennedy (2008) for more information on the relationship between weighted predictors and multicollinearity. VAF = variance inflation factors.
p = .10. **p = .05. ***p = .01.
Declaration of Conflicting Interests
The author(s) declared no potential conflicts of interest with respect to the research, authorship, and/or publication of this article.
Funding
The author(s) received no financial support for the research, authorship, and/or publication of this article.