
Abstract
Recent studies have questioned the familiar characterization of Congress as unidimensional. We argue that agenda control, orchestrated through the House Rules Committee and other techniques, can make multidimensional congresses appear more unidimensional. We evaluate this argument by examining the relationship between measures of unidimensionality and various measures of party control for the House of Representatives from 1875 to 1997, at both the roll-call level and congress level. Our findings contribute to an expanding literature explaining why a single dimension could explain most of the variance in voting data, even if latent ideology is multidimensional.
Keywords
Introduction
Rep. Joseph Pitts (R-PA) introduced the Helping Sick Americans Now Act (H.R. 1549) on April 15, 2013. The bill sought to reallocate nearly four billion dollars of the Affordable Care Act to a program favored by many Republicans. House Republican leaders wanted the reallocation as part of broader effort to “rebrand’’ their party and to spotlight a different approach to the Affordable Care Act (Drucker, 2013; Weisman, 2013).
Despite near unanimity among Republicans for a restrictive rule which allowed only two amendments, it was clear the bill lacked broad support among majority party Republicans. Two prominent conservative groups, the Club for Growth and Heritage Action, came out against the proposal. Press accounts suggested that a final passage vote on the bill would expose deep divisions within the Republican Party. Faced with this possibility, Republican leaders pulled H.R. 1549 from consideration (Ethridge, 2013).
One month after removing Pitts’ proposal from the agenda, Rep. Michele Bachmann (R-MN) proposed on outright repeal of the Affordable Care Act (H.R. 45). The measure was considered under a closed rule which prevented any amendments. It passed 229-195 in the House, with two Democrats joining all Republicans in support. 1
The episode illustrates how the House majority party’s capacity to control the agenda can potentially alter the number of policy dimensions observed in Congress. Specifically, House leaders used their control over the chamber’s rules to block a bill from consideration they knew would expose divisions within their party. In its place, they pushed for a bill they knew would present a united Republican party to the electorate. In addition, they used the Rules Committee to block any divisive amendments from receiving votes on the floor. This affected the content of the roll call record and any subsequent research scholars might derive from that record.
In this article, we examine the potential relationship between partisan agenda control and observed dimensionality in Congress using a threefold approach. First, we use a hypothetical example to show how agenda control can alter the roll call record and theoretically reduce the number of dimensions detected by standard scaling techniques. Second, we look for empirical evidence that agenda control affects dimensionality in a roll-call level regression. Using a data set of all recorded roll call votes in the House of Representatives from 1875 to 1997, we find that the absolute angle of a cut line 2 is larger for votes on special rules and amendments during eras where the majority party enjoyed stronger control of the Rules Committee. This suggests that strong parties may have artificially increased the angle of the cut lines, which in turn reduces the number of dimensions detected by scaling techniques. Finally, we examine the relationship between measures of a second dimension and majority party cohesion in separate, congress-level regressions. The final set of regressions suggests that greater cohesiveness among the majority party suppresses the measurement of a second dimension. Perhaps attempts to keep a coalition united plays a similar role in other deliberative bodies as well.
Literature
The primary goal for many political scientists is to accurately describe the conditions and factors that facilitate policy change. That debate was substantially altered by the introduction of Poole and Rosenthal’s NOMINATE procedure (Poole & Rosenthal, 1985, 1991, 1997, 2007). NOMINATE estimates the location of ideal points and cut planes in a policy space with a pre-specified number of dimensions. 3 The appropriate number of dimensions is determined by several techniques, including the classic “left-elbow’’ test of the eigenvalues from the double-centered, legislator agreement score matrix, and the aggregate proportional reduction of error (APRE) for each additional dimension. 4 Such measures indicate the amount of variation explained by each dimension and the errors reduced by each dimension, respectively. Bayesians use similar techniques (Clinton, Jackman, & Rivers, 2004). Because one can always improve the fit of the ideal points by increasing the number of dimensions, much like R2 increases with each additional variable in a regression, there is no statistical test for the appropriate number of dimensions. Instead, the typical rule of thumb is to look for a left elbow in a scree plot of the eigenvalues, or to see if the increase in the APRE from an additional dimension appears large. Poole and Rosenthal use both techniques and conclude that throughout congressional history “one dimension captures most of the spatial information while a second dimension makes a marginal but important addition to the model’’ (Poole & Rosenthal, 1991, p. 230). They further claim that their unidimensionality finding is particularly pronounced in the modern era.
While their analysis had its critics, 5 political scientists and other observers of Congress often assume American politics is unidimensional and use Poole and Rosenthal’s first dimensional NOMINATE scores for their studies. For example, Krehbiel (1998) employs the scores to demonstrate the importance of institutional decision-rules in Congress, like the veto override and filibuster pivots. Cox and McCubbins (2005) utilize the scores to show that the majority party plays a primal role in dictating policy output in the House. And a single dimension has been used to test theories of presidential veto-bargaining (Cameron, 2000), to calculate the ideology of lower court judges (Epstein, Martin, Segal, & Westerland, 2007), and to evaluate theories of bureaucratic decision making (Bertelli & Grose, 2009). In short, for many scholars, a single dimension of ideal points serves as a proxy for the ideology of political actors.
Despite the wide spread use of a single dimension, recent work questions the unidimensionality result. Crespin and Rohde (2010) evaluate roll call votes on all 13 annual appropriation bills from 1987 to 2003. After applying NOMINATE to each group of issues, they report that several of the issue areas are multidimensional and that a single member does not vote in a consistent unidimensional pattern across the issue areas. This finding is consistent with earlier work by Hurwitz, Moiles, and Rohde (2001), which found evidence of multidimensional voting on agriculture appropriations bills in the 104th Congress (1995-1997).
In his 2007 book, Smith argues that a substantial portion of “key votes,” such as those on amendments and rules, take place along a different dimension than that of the same bill’s ultimate final passage vote. 6 Building from this finding, Roberts, Smith, and Haptonstahl (2008) apply optimal classification to roll call votes from 1955 to 1994. They find signs of higher dimensionality at the individual bill level and argue that such distinctions are reduced when voting is aggregated to the level of an entire Congress. Much like Crespin and Rohde (2010), the authors argue that scholars should not conclude that Congress is latently unidimensional.
Aldrich, Montgomery, and Sparks (2010) provide a different explanation for the low dimensionality of Congress. Using simulations, they show that greater ideological divisions between the two parties in a multidimensional space can reduce the estimated number of dimensions. Although they provide no empirical evidence of the conjectures they simulate, their theoretical argument complements the argument made here.
We build on this literature by offering an additional explanation for the apparent unidimensionality of Congress. Specifically, we argue that observed dimensionality can be altered by the majority party’s power of agenda control (Cox & McCubbins, 2005; Finocchiaro & Rohde, 2008). By preventing bills or amendments that would divide the majority party from reaching the floor (commonly referred to as “negative agenda control’’), parties have the power to reduce observed dimensionality. Similarly, by using their positive agenda-setting powers to select bills they know will unite their party on the floor, like the health care example, parties can reduce observed dimensionality as well.
This party-based argument builds on work by Jenkins (1999, 2000) and Lee (2004, 2009). Jenkins (1999, 2000) suggests that strong parties played a role in explaining why members serving in the party-controlled United States House had more stable and predictable voting patterns than those same individuals serving in the party-less Confederate House. Lee (2004, 2009) argues that unidimensional voting could be caused by “party team cooperation,’’ and not ideology. We extend these studies by identifying the Rules Committee as one of the key mechanisms by which parties influence voting patterns. We evaluate our conjecture empirically. The next section outlines our theory in greater detail.
Theory
Our theory of agenda control is analogous to a teacher trying to evaluate learning among his/her students. If the teacher does not ask questions which differentiate D and F students, he/she will not observe differences in their learning and will likely categorize them as the same. Similarly, if members of Congress are not asked questions which differentiate their positions on higher dimensions, then differences between members on those dimensions will not be observed. The health care example may illustrate such a case. Members of Congress were not asked a question raised by Pitts that would divide the majority party. Instead, the Speaker and the Rules Committee allowed another question raised by Bachmann to be asked. Bachmann’s question kept the majority party together and did not allow for differences in the majority party to be observed. In such cases, empirical techniques which determine dimensionality may indicate that one dimension is appropriate even if more dimensions are latent. In this sense, roll call voting is equivalent to asking questions. If questions that vary along a second, or higher, dimension are not asked, then the only variation observed will be along dimensions where questions are asked.
We argue that leaders of the majority party will use the Rules Committee and the power of scheduling to keep votes that divide their party off the floor and out of the roll call record. Cox and McCubbins (2005) write, “Cartel members expect those appointed to agenda setting offices to always obey ‘the first commandment of party leadership’—Thou shalt not aid bills that will split thy party’’ (p. 24, emphasis in original). Dennis Hastert (R-IL), the longest serving Republican Speaker of the House, practiced this motto. He said, “The job of Speaker is not to expedite legislation that runs counter to the majority of his majority . . . . On each piece of legislation, I actively seek to bring our party together. I do not feel comfortable scheduling any controversial legislation unless we know we have the votes on our side first.” 7
As previously discussed, the Speaker uses his control over the Rules Committee to block divisive votes from the floor. In the modern era, nearly all bills that pass the House do so under a special rule issued by the Rules Committee. These rules allow bills that unite the majority party to bypass bills that might divide the party on the House calendar, while also restricting amendments and setting the terms for the debate. Generally, political scientists have classified special rules in one of three forms: Closed rules, which bar any amendments from consideration; modified or structured rules, which specify which amendments can be offered—and by whom; and open rules, which allow any germane amendment. In the case of a modified rule, amendments must be presented to the Rules Committee ahead of time in order to be considered. This allows the majority an additional filtering mechanism over votes. 8
Party leaders have numerous mechanisms for determining whether a bill or amendment will lead to a party split on the floor. First, almost all bills considered on the floor are first approved by a committee. The committee stage includes committee and subcommittee votes, hearings and testimony, and a lengthy mark-up process. This serves as a good barometer for intra-party conflict. Second, the Rules Committee can hold hearings and debate the content of a rule prior to reporting it. The full chamber will then briefly debate the rule before taking as many as two votes on it. Third, the party can use its team of whips to get vote counts on important issues.
The health care example, cited in the introduction, is a more rare case where latent intraparty conflict does not manifest itself during the consideration of the bill in the committee or rules stage. However, as the case demonstrates, there are other mechanisms, such as the majority’s whipping system, which party leaders can use to assess potential party pitfalls. Indeed, press accounts of the health care saga suggest that leaders were well aware of the potential tally of votes on the Pitts proposal, which is why they did not allow a floor vote on it. 9
This control over the Rules Committee has varied across history. The adoption of Reed’s Rules in the 51st Congress (1889-1891) increased the procedural authority of the Rules Committee and the power of the Speaker, who chairs the Rules Committee (see Binder, 1997; Jenkins & Stewart, 2013; Schickler, 2001). In 1910, moderate Republicans joined minority party Democrats in revolt against Speaker Joe Cannon (Binder, 1997). The revolt effectively ended the Era of Speaker Hegemony by decentralizing some of the powers the Speaker acquired after the passage of Reed’s Rules (Cooper & Brady, 1981). It also removed the Speaker from the Rules Committee and restricted his power to appoint committee chairs. During the reforms of the 1970s, the Speaker and majority party leaders reasserted their control over the committee (Rohde, 1991).
In the Senate, the majority leader’s right of first recognition might have a similar effect. Although this power is much weaker, the right of first recognition allows a majority leader to propose legislation that keeps his/her party unified in place of versions that might divide his/her party. In recent years, first recognition has also been used to “fill the tree” and preclude divisive floor amendments (Den Hartog & Monroe, 2011). 10
A Simulated Example
We argue that majority party leaders could unintentionally reduce the number of dimensions detected by scaling techniques if they censor bills that divide the majority party. For our purposes, it does not matter whether party leaders are motivated by fiduciary responsibilities (i.e., they promote votes that unify the party because rank and file members expect them to do so) or because they believe it will bring policy closer to their ideal points. All leaders have to do is practice the motto of unification and prevent roll calls that divide the majority party or promote roll calls that keep the party together. If leaders are sufficiently committed to this goal, and sufficiently successful at it, then they will unintentionally reduce the number of dimensions detected by standard methods of ideal point estimation. 11
Of course the degree to which agenda control dampens observed dimensionality depends on several factors, including (1) how unified the majority party must be on a bill in order for its leaders to allow a vote on it (adding the vote to the roll call record) and (2) what percentage of the bills must be unified according to the majority party. If some bills are less visible than others, then majority party leaders may not bother censoring them. We will vary both parameters in the later half of this section.
To demonstrate how this type of agenda control can reduce the number of estimated dimensions, consider an example simulated in three steps. In the first step, we fix the location of a set of latent ideal points in two dimensional space. In the second step, we generate hypothetical motions for these legislators to consider. All of our treatments are in the second step. In the third step, we estimate spatial positions using the roll call matrix generated by the latent ideal points voting on the hypothetical motions. We consider two groups in the second step: (1) a control group that includes all possible motions with no agenda control filtering and (2) a treatment group that filters motions in a way that mimics the effects of agenda control. We expect votes filtered by agenda control to show more evidence of a single dimension than votes without such filtering. The difference occurs despite the fact that our control and treatment groups begin with the same set of two-dimensional ideal points.
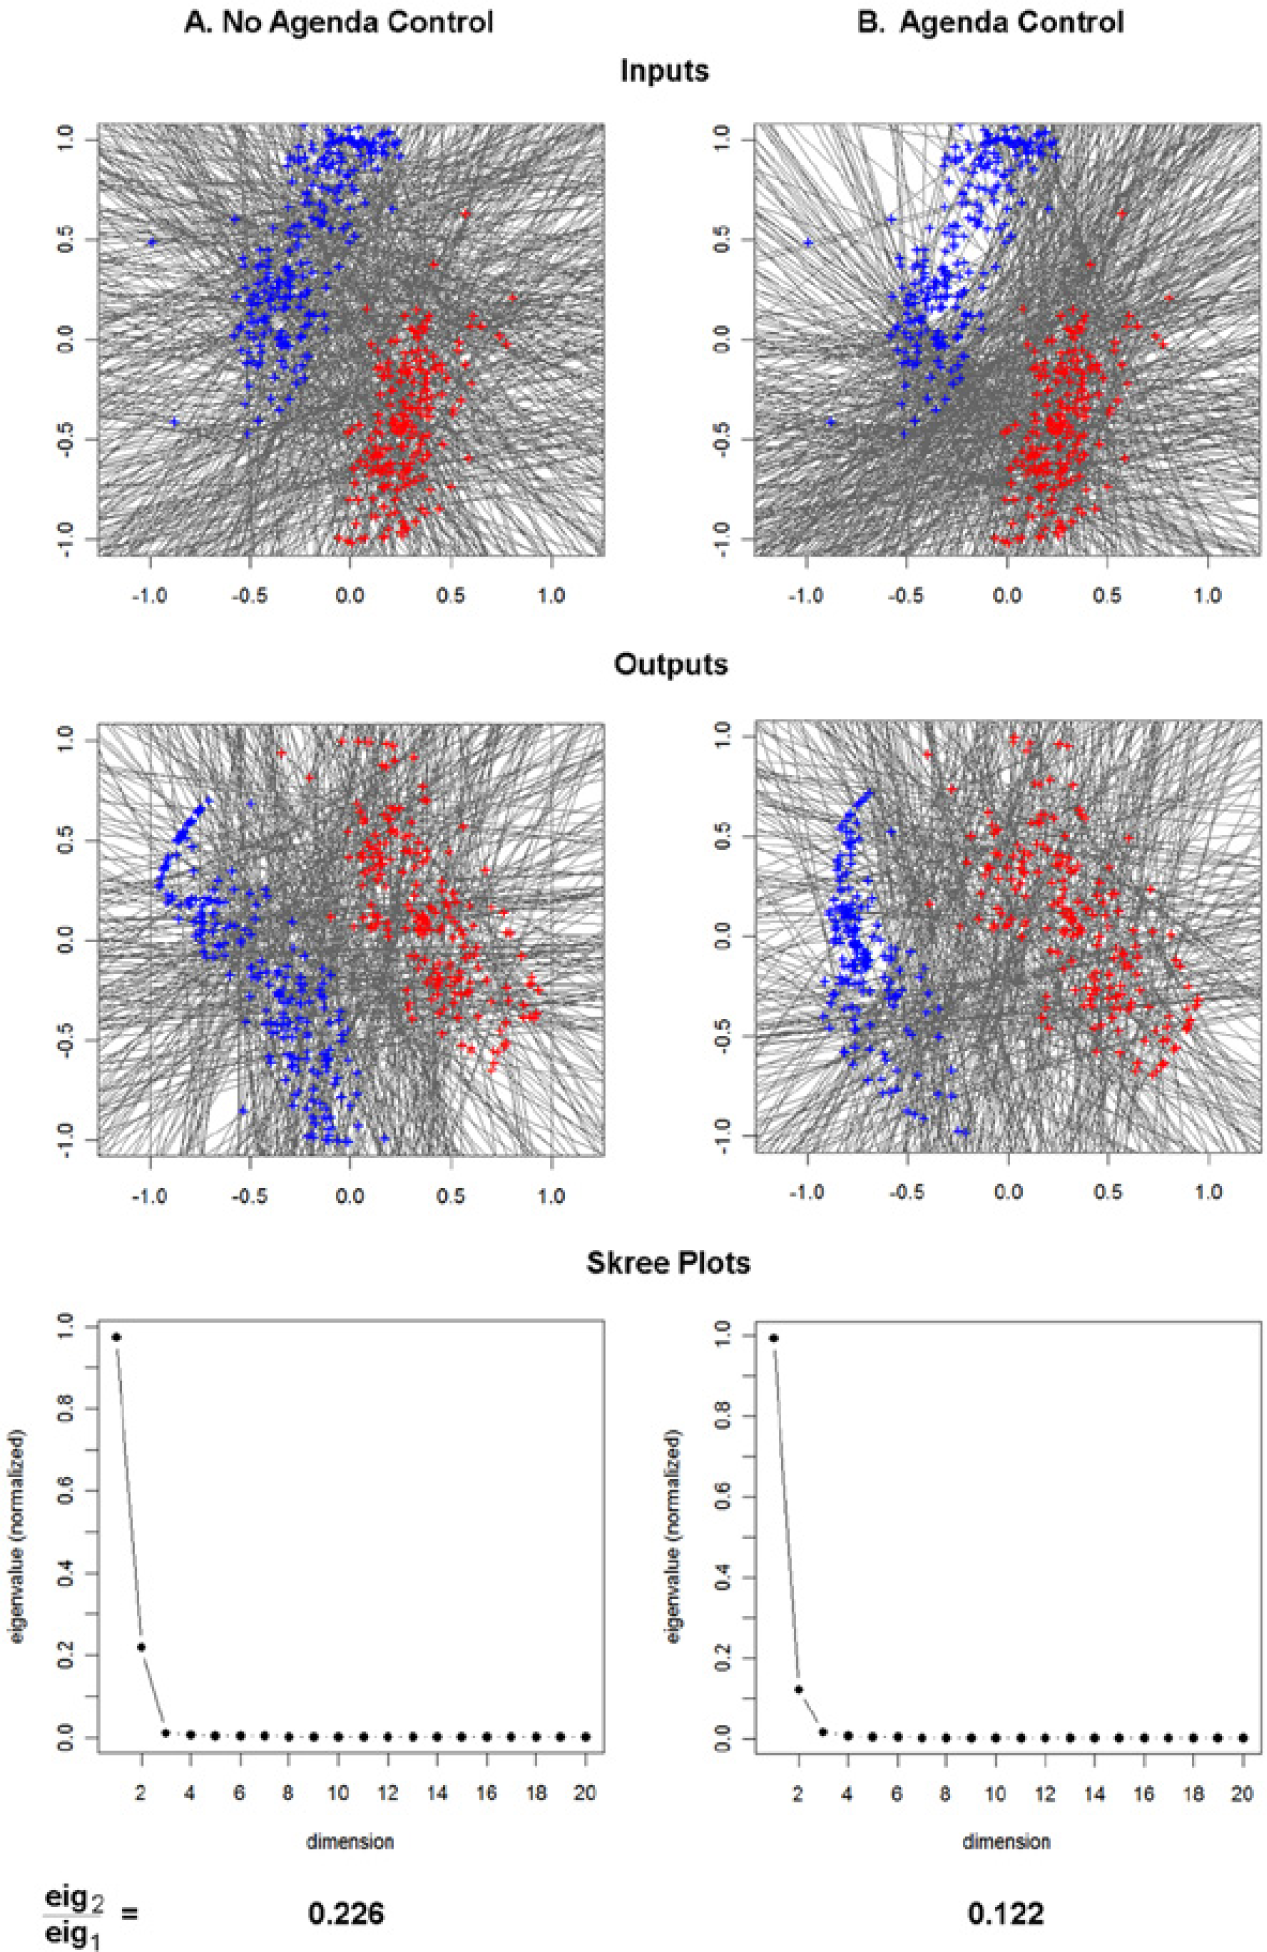
To make the latent ideal points seem more realistic, we use estimates for the 85th Congress as our latent ideal points (1957-1959). Poole and Rosenthal (1997) identify the 85th Congress as a Congress with a clear second dimension related to civil rights. We will assume that the ideal points estimated for this Congress are the “true’’ ideological positions of the members of our synthetic House. We do not assume they represent the true positions of those members empirically. The ideal points are depicted in the top two frames of Figure 1. Blue cross hairs indicate members of the majority party (Democrats) on the left, and red cross hairs indicate members of the minority party (Republicans) on the right. 12
An example of negative agenda control and dimensionality.
To generate measures upon which our legislators will vote, we randomly draw 30,000 cut lines from a uniform distribution and store them in a list to be used across treatment conditions. 13 To simulate voting with no agenda control, the House votes on the first 500 cut lines that also have enough dissent for the roll call to be included by W-NOMINATE (by default, W-NOMINATE requires 2.5% of the legislators to dissent). 14 This explains why there are no cut lines on the outer edges of either frame. The cut lines for the no agenda control example are displayed in the top-left frame of Figure 1. The ones with agenda control are depicted in the top-right frame.
For our agenda control treatment, the hypothetical House votes on 500 cut lines sequentially read the same list, but in this case a cut line must meet an additional condition to be included in the analysis—the majority party must be at least 80% unified on at least 90% of the roll call votes. This is displayed on the top-right panel of Figure 1. There is a low density of cut lines around the majority party under agenda control, because this treatment filters out many of the cut lines that would split the majority party.
We then use the ideal points and cut lines appearing in the top two frames of Figure 1 as inputs for our two treatments. We use a script, written by the authors in C, that allows each member to vote on the 500 roll calls separately and creates an N × R roll call matrix for each treatment. 15 We then apply W-NOMINATE to each matrix and produce the estimated ideal points and cut lines appearing in the middle frames of Figure 1.
A couple of observations are worth noting. First, there are visual differences between the input (first row) and output (second row) in both columns. Compared to the input, the estimated ideal points are rotated counter-clockwise. Rotations are expected, so this should not be a concern. Also, ideal points for the minority party are more spread out in the output than they are in the input, while ideal points for the majority party are more narrowly distributed in the output than in the input. Both effects are exacerbated with agenda control. Moreover, the estimated cut lines in the middle-right frame are not bunched up in the space between the two parties like the latent cut lines in the frame above, suggesting that majority party filtering may not be easy to see by the naked eye.
Second, the treatment creates noticeable differences in the angle of the estimated cut lines. Without agenda control, the average absolute angle of the cut line is 51.14 degrees (with a standard deviation of 28.09 degrees). With agenda control, the average absolute angle is 54.29 degrees (with a standard deviation of 25.70 degrees). The difference of the two means is significant at the .05 level. In this example, agenda control increases the angle of the estimated cut line, because keeping the majority party unified and requiring at least 12 votes on both sides of an issue implies that many of the permissible votes, albeit not all, will separate the two parties. That makes a large portion of the latent cut lines parallel to each other. Because that set of cut lines is large, it explains a considerable proportion of the variation and largely determines the content of the primary dimension. This holds true regardless of the direction in which the parties vary. 16 Hence, measures of dimensionality are more likely to show stronger indications of a single dimension when cut lines are filtered.
Third, consistent with this argument, the plots of the normalized eigenvalues of the double centered agreement score matrix beneath each graph indicate that two dimensions “may’’ be appropriate for the example with no agenda control, while one dimension is appropriate for the example with agenda control. In the former case, the normalized eigenvalue of the second dimension is roughly 0.22. Under the agenda control condition, it falls to roughly 0.12. Since both cases have either one or two dimensions, the difference can be summarized by the ratio of the second eigenvalue to the first, as shown under each of the scree plots. A smaller ratio indicates greater tendency toward unidimensionality than a larger ratio.
To put these numbers in context, compare them to the smallest and largest ratios of eigenvalues in our data set (described in the next section). For the 85th House (1957-1959), a potentially two dimensional House, the ratio of the second eigenvalue to the first is 0.48. For the 104th House (1995-1997), widely believed to be a unidimensional House, the ratio is 0.05. This represents an 89% decrease between the extremes of our data. With no agenda control, the ratio of the second eigenvalue to the first is 0.23. With agenda control the ratio is 0.12 (a 48% decrease). Although the decrease in the ratio is not as large as the decrease between the extremes of our data, it is substantial.
Keep in mind that the only difference between the two cases is that some of the cut lines (i.e., roll call votes) are subject to agenda control under the second treatment. Hence, agenda control “can’’ affect the average angle of the estimated cut lines as well as the estimated number of dimensions. Researchers may fail to see potential coalitions in the data that would be observable if different questions were asked.
Various Degrees of Agenda Control
To get a rough idea about the degree to which increments in the level of agenda control might affect the estimated number of dimensions for a Congress, we extended the analysis to different levels of majority party cohesion on different proportions of roll call votes (see Figure 2). Each frame of Figure 2 depicts ideal points from the 85th House and cut lines randomly drawn under the conditions specified by the rows and columns in the margins of the figure.

Varying degrees of agenda control and dimensionality.
The rows vary by the percentage of roll calls controlled by the majority party and the columns vary by the percentage of the majority party members that must agree for the roll call to be considered “controlled.’’ We call the latter majority cohesion. For example, the case in row 50% and column 60% is one where the majority party must remain at least 60% unified on at least 50% of the roll call votes. The cut lines from each of these frames are then used as inputs along with the latent ideal points to create a roll call matrix. Ideal points and eigenvalues are then estimated from the roll call matrix using W-NOMINATE (as before). Figure 2 depicts the latent ideal points and cut lines used as inputs. Two of these frames have been shown previously. The bottom-middle (90%, 80%) frame of Figure 2 is identical to the top-right frame of Figure 1, and the top-left frame of Figure 2 (50%, 60%) is very similar to the top-left frame of Figure 1.
Underneath each of the frames is the ratio of the second eigenvalue to the first. Again, this ratio indicates the tendency to describe the House as having either one or two dimensions with smaller values indicating greater signs of unidimensionality. As the figure clearly shows, increasing the cohesiveness of the majority party decreases the ratio of the second eigenvalue to the first, everything else equal. That means a researcher is more likely to conclude that the House is unidimensional, even though the latent ideal points are two dimensional. As the proportion of filtered roll calls increases from only 50% of the roll calls to 90% of the roll calls, signs of unidimensionality become stronger. Taken together, this shows that parties can increase the unidimensionality of voting through agenda control, at least “theoretically.”
At first glance, it may seem unlikely that a majority party could keep itself as unified as it is in this figure. However, this is not the case. At the minimum, at least 50% of the majority party has to be united on any roll call. That’s why the top-left frame in Figure 2 is almost identical to the no agenda control condition in top-left frame of Figure 1. Moreover, for the observed congresses in our empirical study, the average percentage of the majority party in agreement on any roll call is 85.3%. That’s comparable to the bottom middle frame of Figure 2 and the agenda control treatment in Figure 1. Meaning, the hypothetical case we have been describing throughout this section may not be that hypothetical. Furthermore, more than a fifth of the roll calls during this period have at least 99% of the majority party in agreement (i.e., at least 99% majority coherence). Hence, some of the stronger conditions depicted in Figure 2 may not be entirely far-fetched.
Empirical Analysis
The preceding section suggests that, theoretically, agenda control can have an important role in determining the number of observed dimensions. To test this conjecture empirically, we create two specifications. The first uses roll calls as the units of analysis to determine whether the angle of the cut lines are related to partisanship and majority party cohesion. The second uses individual congresses as the unit of analysis to determine whether evidence of a second dimension is related to majority cohesion. Our data ranges from the 44th House to the 104th House (1875-1997). Poole and Rosenthal (1997) estimate either one or two dimensions for each House during this period.
Roll-Call Level Analysis
All else equal, strong majority parties—through the use of special rules and controls over the amendment process—should be able to keep votes that divide the majority party off the agenda and increase the estimated slopes of the cut lines with respect to the major axis of rotation. Increasing the slopes of the estimated cut lines reduces the variance observed in the second dimension even though it does not eliminate the variance altogether. 17
We evaluate this argument using the 21,899 cut lines estimated between 1875 and 1997 for all U.S. Houses and the following specification:

The dependent variable, angle, is the absolute angle of each cut line estimated by Carroll et al. (2009) using DW-NOMINATE. 18 These values range from 0 to 90 degrees exclusive, with larger numbers indicating steeper slopes.
The first independent variable, partisan era, is a dummy variable for eras where the Speaker and majority party leaders exercised tight control over the Rules Committee. This coding scheme largely follows work done by Galloway (1976), Cox and McCubbins (2002), and Finocchiaro and Rohde (2008), though the coding is our own. Table 1 provides a complete list of these codes. Because a strong party era should increase the average absolute angle of an estimated cut line, we expect β1 > 0.
Eras of Majority Party Dominance on the Rules Committee, 1875-1997.
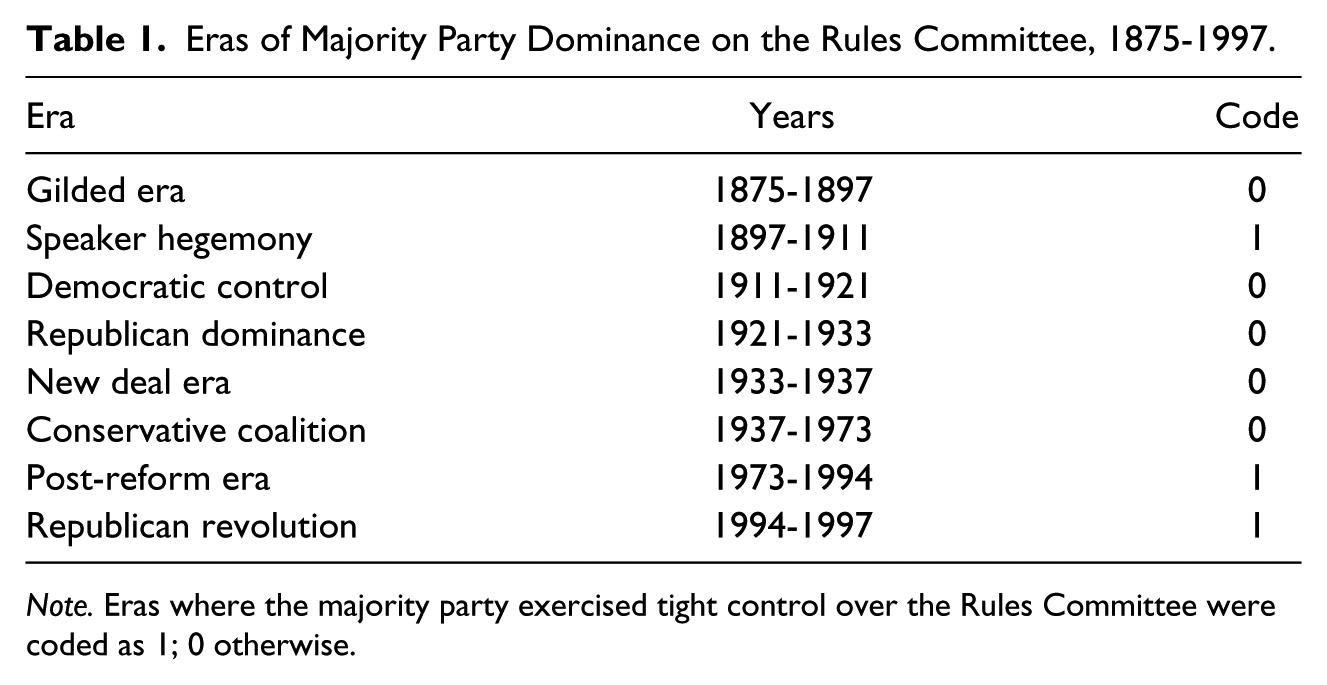
Note. Eras where the majority party exercised tight control over the Rules Committee were coded as 1; 0 otherwise.
Our second independent variable, special rule, is a dummy variable for whether the roll call was a vote on a special rule. 19 Values used in this variable were originally coded by Rohde (1991) and extended to earlier years by Lawrence, Maltzman, and Smith (2006). Crespin (2010) argues that parties control special rules even if they don’t control the substantive votes considered under those rules. Hence, we expect β2 > 0.
Our third independent variable, amendment, is a dummy variable indicating whether the roll call was any type of amendment, 20 compiled from Rohde (1991) and Lawrence et al. (2006). Because amendments provide an opportunity for members of the floor to affect the outcome, they indicate cases where party leaders are not controlling the vote, which should lead to less vertical cut lines on the margin. Hence, we expect β3 < 0.
Our fourth and fifth independent variables are two interaction terms which indicate whether the marginal effects of special rules and amendments were more dramatic during partisan eras compared to non-partisan eras. Presumably, special rules (and amendments) would be more vertical during partisan eras, indicating that partisanship can make special rules (and amendments) even more vertical. Because partisan era and special rules are both dummy variables, β2 by itself represents the marginal effect of a special rule in a non-partisan era. The marginal effect of special rules in a partisan era is indicated by β2 + β4. If special rules have a positive relationship with cut line angles in a non-partisan era, and an even steeper relationship in a partisan era, then we would expect β2 + β4 > β2 > 0.
Our sixth independent variable, majority cohesion, measures the percent of the majority party in agreement on a roll call. Although we have no way of knowing whether the majority party filtered a particular roll call, we do know the percentage of the majority party in agreement on a particular roll call. Majority cohesion does not require more than half of each party to be on the opposite sides of a roll call, as in a traditional party unity vote. Instead, it simply measures the percentage of the majority party members who agree on a roll call, among those who attend. 21 We argue that high levels of majority party cohesion should lead to more vertical cut lines for the roll call. The causality does not go the other way around. 22 Therefore we expect β6 > 0.
Our remaining independent variables are a series of controls. Divided government is a dummy variable equal to 1 if either the Senate or the President comes from a different party than the House; 0 otherwise. During periods of divided government, the majority party is often politically forced to consider legislation on the chamber floor that is supported by the branch controlled by the opposing party. These measures are more likely to split the majority party than bills considered during unified control. For this reason, we expect β7 < 0.
Civil rights is a dummy variable indicating whether the vote was on a civil rights issue, as coded by Poole and Rosenthal (www.voteview.com). From the late-19th to mid-20th century, civil rights centered on issues like voting rights and school desegregation. Poole and Rosenthal argue that preferences on civil rights issues are largely responsible for a second dimension during the period of our study. As such, cut line angles on these roll calls should be smaller than average, and we expect β8 < 0.
Because unobserved differences between congresses can bias our results with roll calls used as the unit of analysis, we include dummy variables for each Congress, except the 104th Congress. This controls for anything which varies by Congress, such as the polarization between the two parties or the size of the majority party.
Congress-Level Analysis
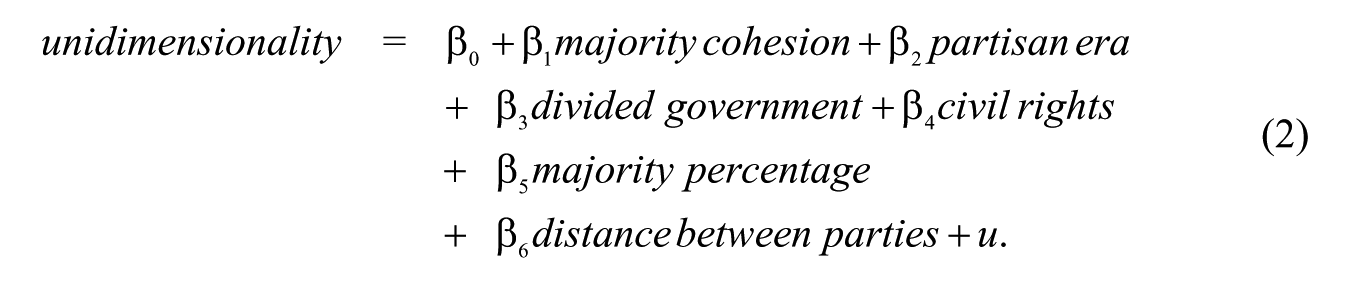
Our second test of the theory examines the relationship between observed dimensionality and the cohesiveness of the majority party more directly. Our theory suggests that when the majority party is more cohesive, the variance explained by a second dimension becomes smaller (as illustrated by comparing the columns in Figure 2). We evaluate this conjecture using the 61 Houses between 1875 and 1997 and the following specification:
This specification is very similar to the previous one except for four changes. First, the unit of analysis is a congress, not a roll call.
Second, the dependent variable, unidimensionality, is the tendency to observe unidimensionality in the data reduction technique which we measure in two ways. The first is the ratio of the eigenvalue of the second dimension to the eigenvalue of the first dimension. As argued earlier, smaller values of this ratio indicate greater reason to conclude unidimensionality from a principle components analysis. The second is the difference in the APRE scores between the second dimension and the first dimension. This is one of the measures Poole and Rosenthal (1997) use to indicate unidimensionality in their seminal work (pp. 48-51). Again, smaller values of this difference indicate greater tendencies toward unidimensionality.
One might think that both measures decline over time, simply because more recent congresses show stronger signs of unidimensionality than older congresses. Although this is partly true for the most recent fifth of our data, Figure 3 shows that both measures exhibit considerable variation, and neither trend with time. The eigenvalue ratio exhibits greater swings than the APRE difference largely because the two measures are on different scales. If the measures were graphed separately, the APRE difference would exhibit similar swings, though there would still be some differences in the measures. For example, in the early years of our data, the eigenvalue ratio peaks during the 52nd Congress in 1891 while the APRE difference peaks during the 53rd Congress in 1893. We use both measures, separately, as a robustness check.
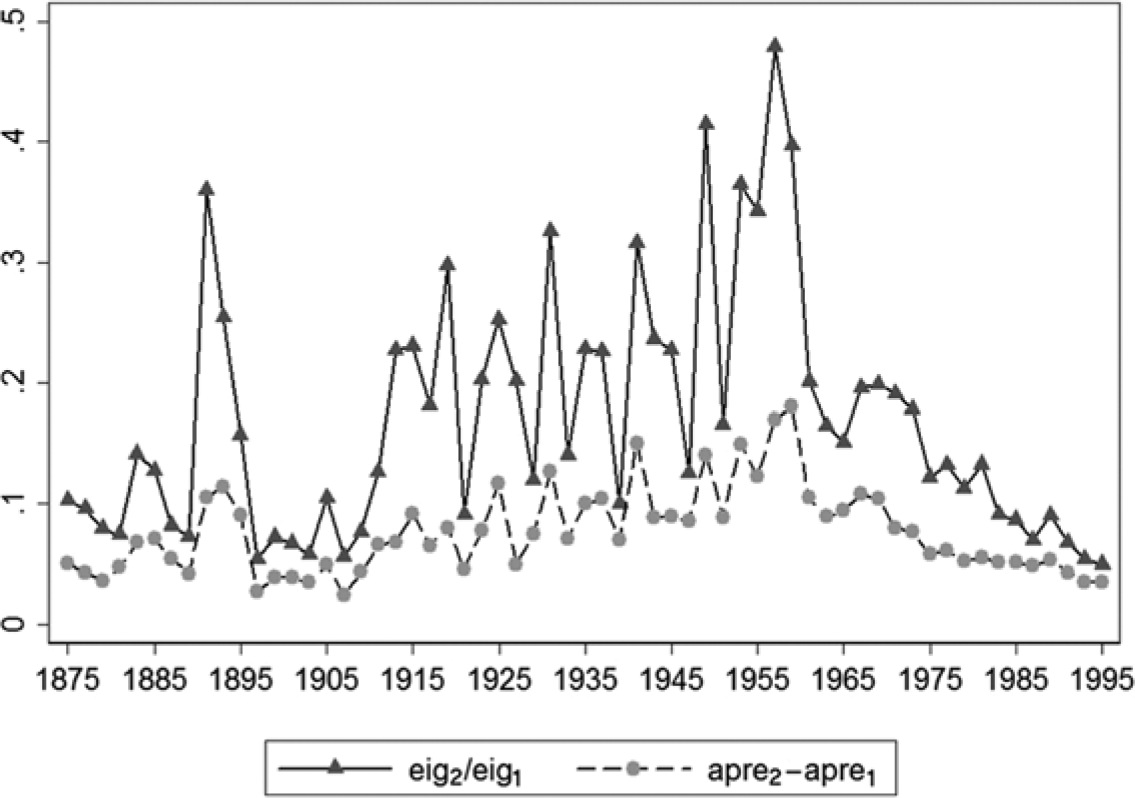
Eigenvalue ratios and reduction in error across time.
Third, this specification includes the distance between parties, which is the Euclidean distance between the multivariate means of the majority and minority parties in two dimensions. Aldrich et al. (2010) suggest that greater distances between the two parties might lead to stronger signs of unidimensionality. Although we are measuring observed rather than latent distances, we include this variable to control for such an effect. The variable is not included in our roll-call level regressions because the congress dummies provide that control.
Fourth, the remaining variables are the same as described previously, except special rule and amendment are no longer included in the analysis, civil rights measures the proportion of roll calls on civil rights in the House, and majority cohesion is the “average’’ percentage of the majority party in agreement on each roll call in a particular House. Because small values of the dependent variable are consistent with increased unidimensionality, the expected signs of the coefficients in this model are reversed from the previous analysis.
We estimate both regressions using ordinary least squares with Huber-White robust standard errors to account for potential heteroskedasticity.
Results
Roll - Call - Level Analysis
The results of the first regression, with roll calls as the unit of analysis, are presented in Table 2. To save space, the estimated coefficients for the congress dummies are not reported in the table. 23
Estimates of Party Effects on Cut Line Angles.
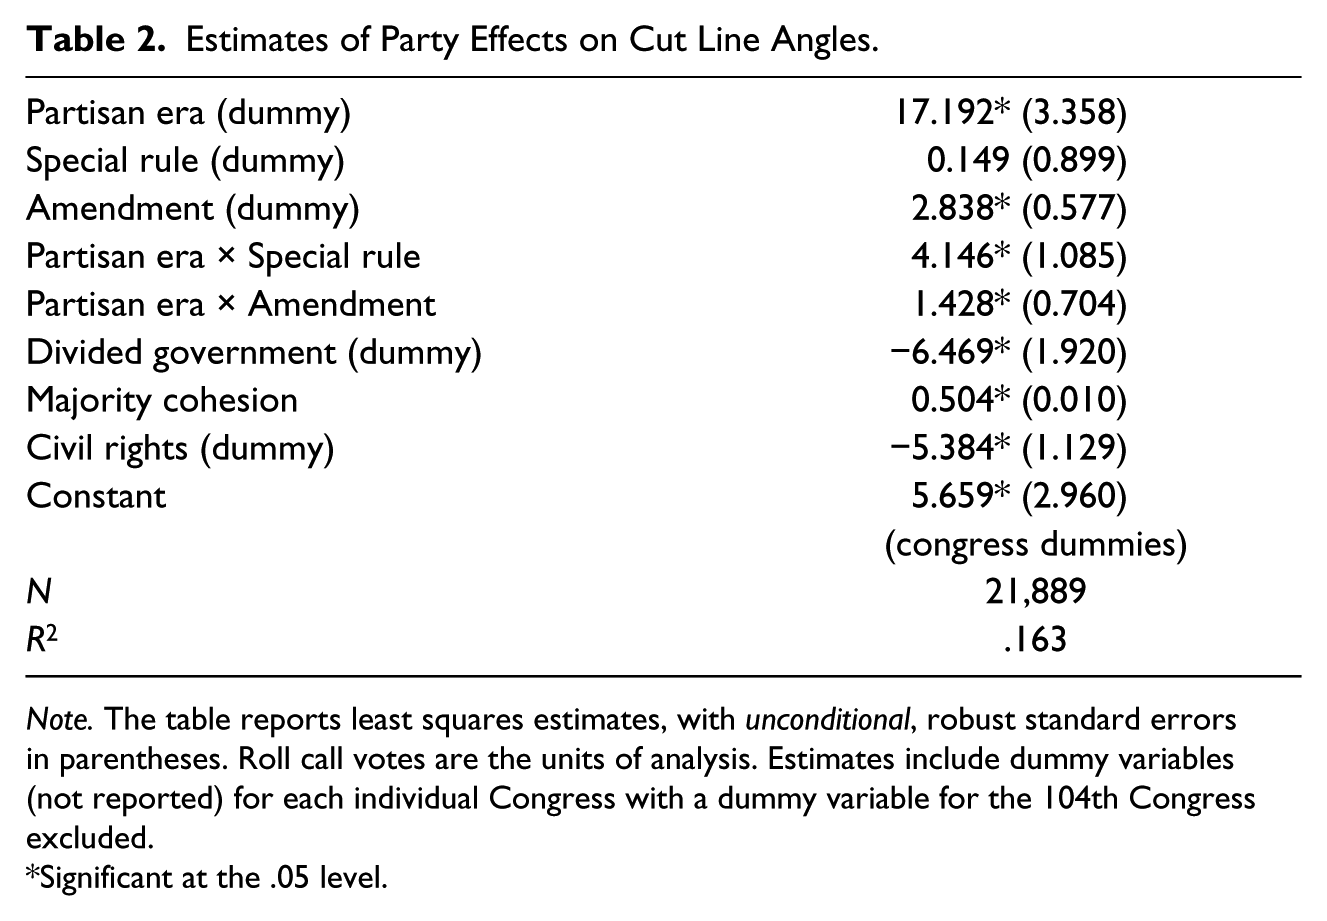
Note. The table reports least squares estimates, with unconditional, robust standard errors in parentheses. Roll call votes are the units of analysis. Estimates include dummy variables (not reported) for each individual Congress with a dummy variable for the 104th Congress excluded.
Significant at the .05 level.
Our partisan variables perform largely as expected. For example, partisan era has a strong, positive effect on cut line angles. If the vote is not on a special rule or an amendment, then a discrete change from a non-partisan era to a partisan era can increase the average cut line angle 17.2 degrees. This alone demonstrates that strong parties can be responsible for the steepness of the cut line angle in final passage votes, procedural votes, and other non-special rule votes when other important factors, such as civil rights legislation, are controlled. As argued previously, steeper cut line angles lead to greater tendencies toward unidimensionality.
The effect of special rules during a non-partisan era does not reach significance. This suggests that in a non-partisan era, the angle of a special rule vote is roughly the same as the angle of a vote on a typical issue. However, in a partisan era, a special rule is a little more than 4.2 degrees steeper than a non-special rule vote on the margin, as indicated by the interaction term. Again, party strength leads to more vertical angles, particularly among special rule votes.
Contrary to our initial hypothesis, amendments during a non-partisan era have a significant and positive effect. During a non-partisan era, amendment votes are roughly 2.8 degrees steeper than non-amendment votes. In partisan eras, amendment votes are 4.3 degrees steeper than non-amendment votes. 25 Perhaps this occurs because most amendments allowed in the roll call record are those which keep the majority party together and estimate as more vertical cut lines. Amendments that reveal second dimension differences are even more likely to be left off the agenda in periods of strong party control.
The level of majority cohesion on a vote also has a strong effect on the angle of the cut line. As parties vote more cohesively, the angle of cut line increases sharply. For each percentage point increase in party cohesion, the average cut line angle increases a half of a degree. Moving from a perfectly divided majority party (majority cohesion =50%) to a majority party in complete agreement (majority cohesion =100%), increases the angle of the cut lines, by 25 degrees. This is because unifying the party makes most cut lines perpendicular to the major axis of disagreement, as outlined in our theory section. Most roll calls that unite the majority party while keeping at least 2.5% of the voters in dissent pit the majority party against the minority party and make cut lines more vertical. This does not mean that all cut lines must be vertical. There can be roll calls that keep the majority party unified, attain the minimum number of dissenters, and produce fairly horizontal cut lines (as shown in the bottom-right frame of Figure 2). Such cases should become more rare with greater unification of the majority party. As a result, if a majority party makes strong use of the Rules Committee, and other techniques to prevent it from splitting, then issues will appear unidimensional even if a latent second dimension exists. Such an effect is independent of partisan eras, special rules, and amendments which are controlled in the regression.
The control variables perform largely as hypothesized. The negative and significant coefficient for divided government suggests the average cut line under divided government is less steep than it is if the three branches of government are unified. This is consistent with the notion that Houses are forced to vote on measures that internally split the majority party during divided government. In addition, civil rights is negative and significant, as expected. Civil rights bills are far more likely to cause internal divisions among the parties and contribute to cut line angles that are flatter than non-civil rights legislation. Votes on civil rights issues see more than a five degree reduction in the average angle of a cut line compared to non-civil rights issues, suggesting that they may contribute to the detection of a second dimension.
Congress-Level Analysis
Our second set of results examines the relationship between unidimensionality and majority cohesion more directly. The left column of Table 3 shows the results with the eigenvalue ratio as the dependent variable and the right column shows the results with the APRE difference as the dependent variable.
Estimates of Party Effects on Dimensionality.
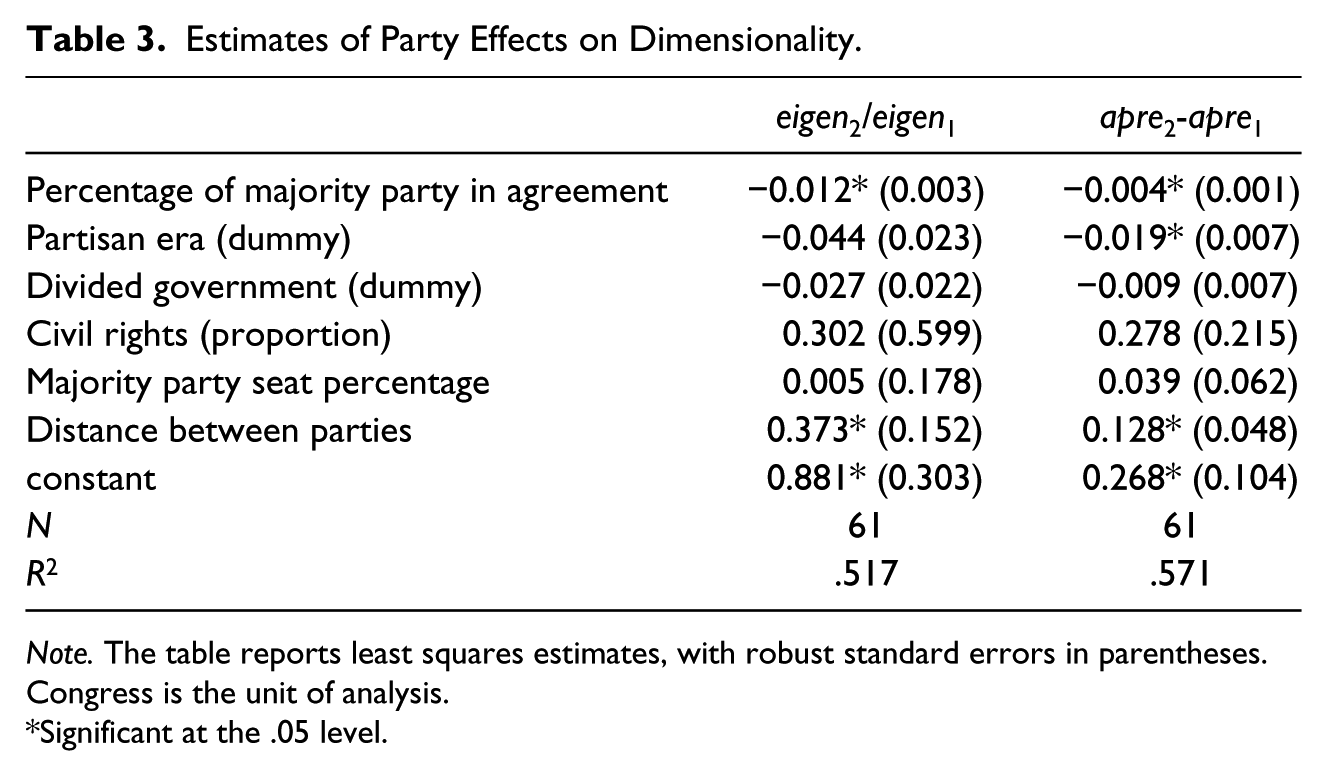
Note. The table reports least squares estimates, with robust standard errors in parentheses. Congress is the unit of analysis.
Significant at the .05 level.
In both columns, the average percentage of the majority party in agreement on a roll call is negative and significant, consistent with our primary hypothesis. As the majority party becomes increasingly unified, either through agenda control or other means, the second dimension explains less unique variance and a unidimensional depiction becomes increasingly appropriate. For each additional percent that the majority party is in agreement, the ratio of the second eigenvalue to the first decreases by .012 and the difference in the APREs decreases by .004. Both differences are less than 3% of the observed range. Although the magnitudes of these changes are small, they are significant. Keeping the party cohesive prevents the House from asking questions which divide the majority party, just like failing to ask questions which differentiate D and F students will prevent teachers from observing educational differences between those students. Without such questions, the roll call data cannot demonstrate differences along a second dimension even if a latent second dimension exists.
On the margin, partisan eras diminish the importance of a second dimension as well - though the coefficient on partisan eras just misses statistical significance at the .05 level in the first regression. The eigenvalue ratio and the APRE difference are both smaller in eras where the parties are strong than in eras where they are weak. This loosely suggests that party strength has a direct effect on reducing dimensionality that may be independent of the cohesiveness of the majority party. Recording motions as voice votes rather than roll call votes could be such an effect.
The coefficients for divided government, civil rights, and the percentage of seats controlled by the majority party are all insignificant, suggesting that these variables have little effect on the estimated number of dimensions. Perhaps the reason that the percentage of civil right bills is not significant is that civil rights legislation makes up a small percentage of the roll calls in any House. On average the House devotes only 1.5% of its roll calls to civil rights, which would explain why civil rights has a significant effect on individual roll calls but not on measures of unidimensionality for an entire Congress. 26
Finally, the coefficient for the two dimensional distance between the two parties is positive and significant in both regressions, suggesting that greater differences between the parties correspond with greater indications of a second dimension. Although this result appears to contradict Aldrich et al. (2010), it is important to keep in mind that we are measuring the observed distances between the parties, not the latent. Everything else equal, it is very reasonable to find greater distances between the estimated means of the parties as a second dimension becomes more pronounced.
Conclusion
NOMINATE and other ideal point estimation techniques have played a major role in advancing our understanding of Congress, the judiciary, and the legislative processes more generally. Most scholars assume a single dimension because seminal work suggests that American politics is single dimensional. We do not entirely deny this claim. We only suggest that partisan agenda control might mask some evidence of higher dimensions. Other factors, such as the correlation of legislator preferences across dimensions or the number of higher dimensional events facing a Congress, might explain why the dimensionality of Congress is characterized as one-and-a-half dimensions. Such factors may be more important for determining dimensionality than the one studied here. Nevertheless, our findings have important implications.
In recent work, scholars have argued that latent dimensionality may be suppressed by like-minded team play (Lee, 2009), increasing divisions between the two parties (Aldrich et al., 2010), aggregating votes (Roberts et al., 2008; Smith, 2007), and combining issue areas (Crespin & Rohde, 2010). Our article offers another explanation for why higher dimensions might be suppressed. A single dimension may simply be a data reduction of an n-dimensional process, partly suppressed by majority parties trying to keep their brand name unified. Considered together, such findings should caution scholars against concluding that latent ideology in Congress must be unidimensional. Instead of claiming that there is only one dimension upon which all politics lie, they should take note that higher dimensions can be reduced to lower dimensions when such factors are at play.
One theory that seeks to explain the stability of outcomes in the U.S. Congress is structurally induced equilibrium (SIE). As originally laid out by Shepsle (1979) and Shepsle and Weingast (1981) the high cost of vote cycling and instability resulting from a multidimensional spatial voting may create the need for institutions that ameliorate such problems. They argue that the primary institution which addresses the problem is the committee system, which divides legislation into single dimensional issues and assigns each dimension to a committee. Because each member maintains a norm of reciprocity and that norm is mutually advantageous, the floor typically defers to committees. Stability is further maintained by ordering the agenda so that the status quo is considered last.
SIE theory holds a justifiably important place in the study of legislative institutions. Our paper compliments its findings. Rather than suggesting that Congress omnisciently splits multidimensional issues into orthogonal single dimensions when it assigns bills to committees, our paper suggests that parties, not committees, may be a partial source of stability. Leaders that try to make the majority party more unified on congressional roll call votes through the use of whips or control from the Rules Committee might unconsciously ameliorate the importance of higher dimensions. In other words, simply keeping the majority party together might partly explain congressional stability in light of the so-called “chaos theorem’’ (McKelvey, 1976; Schofield, 1978).
This article also touches on the debate over the role of political parties in Congress. We suggest that the majority party can play an important role in dictating policy outcomes. Consistent with recent work by Finocchiaro and Rohde (2008), we find the control is a conditional one. Specifically, the majority may influence the angle of roll call cut lines on certain types of votes, but only if it holds the procedural capacity to control the Rules Committee.
Perhaps an example will help illustrate the last point. Like many Speakers before him, Newt Gingrich kept his party unified during the first several months of his Speakership. With a slim majority, he realized that he had to keep his party voting as a unified whole if the Republicans were going to accomplish their goals. But when President Clinton attacked the Republicans for shutting down the government in the fall of 1995, the Republican coalition began to divide. Moderate Republicans felt uneasy about some of the more serious spending cuts and social programs proposed by the social conservatives in their party. Perhaps this is why the ratio of the second eigenvalue to the first increased from 0.045 in the first session of the 104th Congress, when the party was fully unified, to 0. 074 in the second session, when the party began to crack. Signs of a second dimension were barely noticeable in both cases, but failure to fully prevent votes on divisive roll calls in the second session may have allowed a subtle revelation of a second dimension. If more divisive issues were considered, the ideology of the 104th Congress might have been just as multidimensional as the ideology of some earlier congresses.
Footnotes
Acknowledgements
The authors would like to thank Ryan Bakker, Jamie L. Carson, Michael H. Crespin, Simon Hix, Stephen Jessee, Burt Monroe, C. Daniel Myers, Michael Peress, Norman J. Schofield, and Kenneth Shotts for comments on earlier drafts of this manuscript. All errors are their own.
Declaration of Conflicting Interests
The author(s) declared no potential conflicts of interest with respect to the research, authorship, and/or publication of this article.
Funding
The author(s) received no financial support for the research, authorship, and/or publication of this article.