



Abstract
While a large body of research examines cross-state variation in social policy, few studies systematically examine the policy influence of organizations that advocate on behalf of people living in poverty. This article examines relationships between state advocacy communities and policy choices following the passage of the Personal Responsibility and Work Opportunity Reconciliation Act of 1996 (PRWORA), or welfare reform. Using an original data set of states’ advocacy communities, political and economic characteristics, and welfare policy choices, the article analyzes whether a state’s advocacy community is associated with its decisions to reduce the government’s commitment to low-income families on one hand and enact policies providing additional supports to families on the other. The analysis reveals that significant relationships exist for both types of policies, suggesting that organizational advocates may play a role in shaping state-level social policy decisions.
Scholars of American politics have long been interested in understanding cross-state variation in antipoverty policy. States differ in both the nature and scale of their response to the problem of poverty, which ranged in severity from 10% living in poverty in New Hampshire to 24% living in poverty in Mississippi in 2012 (U.S. Census Bureau, 2013). Although federal and state governments share authority over an array of social welfare programs, state governments retain discretion over the program design, eligibility rules, and benefit levels of many federal antipoverty programs. States also develop and administer their own programs, such as state tax credits to low-income working families and cash assistance to individuals living in poverty (Meyers, Gornick, & Peck, 2001).
The existing literature on cross-state variation in antipoverty policy yields important findings regarding the influence of partisan politics, constituent opinion, economic factors, and racial politics on state social policy adoption (Fellowes & Rowe, 2004; Plotnick & Winters, 1985; Soss, Schram, Vartanian, & O’Brien, 2001; Tweedie, 1994). Yet few studies systematically examine relationships between antipoverty advocacy and policy choices across states. As a result, little is known about the policy influence of states’ advocacy communities, defined as the population of organizations that is politically active on behalf of low-income individuals within each state.
The absence of knowledge regarding the role of advocates is surprising, as many states maintain a robust community of groups that routinely advocate on behalf of low-income populations (Berry & Arons, 2003; Pekkanen, Smith, & Tsujinaka, 2014). Furthermore, qualitative research suggests that advocates for the poor are influential in the policymaking process in at least some states (Burt, Geen, & Duke, 1997; Francis & Anton, 1999; Geen, Zimmermann, Douglas, Zedlewski, & Waters, 1998; Karch, 2007; Winston, 2002). As national policies have shifted authority away from Washington and toward the state and local level (Meyers et al., 2001), understanding the role of policy advocates has become increasingly important.
To provide insight into the role of state-level advocates in the social policymaking process, this article analyzes relationships between state advocacy communities and policy choices following the passage of the Personal Responsibility and Work Opportunity Reconciliation Act of 1996 (PRWORA), or welfare reform. Under the PRWORA, the national government ended its 60-year guarantee of cash assistance to needy families and granted states increased discretion over many programmatic aspects of the cash welfare program (Weaver, 2000). Because the federal legislation required each state to define the structure of its new welfare program in select program areas, the PRWORA created similar incentives for advocates to mobilize across states, offering an ideal opportunity to analyze the relationship between advocacy and policy passage.
In the next section of the article, I review the literature on interest groups, nonprofit advocacy, and state policy adoption to motivate the article’s focus on state-level advocates for low-income populations. The “Data” section provides an overview of the data used to analyze relationships between advocacy communities and policy choices. This section introduces two new measures of advocacy community strength that include the number of groups registered to lobby on welfare issues as well as the number of charitable organizations active on social welfare issues. In the “Empirical Analysis” section, I present the results of the empirical analysis. The analysis finds that across the 50 states, states with larger antipoverty advocacy communities were less likely to adopt policies that imposed strict work requirements and penalties on welfare recipients, as well as policies that allowed recipients to possess greater assets without losing welfare eligibility. However, consistent relationships do not exist across all policies considered. The “Discussion, Implications, and Conclusion” section discusses the key empirical findings and argues that scholars interested in cross-state variation in social welfare policy should continue to consider the role of advocates in social policymaking processes in the American states.
Theoretical Foundations
Organized interests play an active role in state politics. In 2007, more than 50,000 groups representing an array of public and private interests were registered to lobby at the state level (Gray, Cluverius, Harden, Shor, & Lowery, 2014). State interest group communities vary considerably, both with respect to the number of groups active and the distribution of interests across economic sectors (Gray & Lowery, 1996; Nownes & Freeman, 1998; Thomas & Hrebenar, 1999). Organized interests also enjoy varying levels of influence across states: Interest groups are described as having a dominant influence in states such as Alabama, Florida, and Nevada, for example, but are described as constrained or subordinate to other political factors in states such as Delaware, Minnesota, and South Dakota (Thomas & Hrebenar, 1999).
A large literature examines the influence of interest groups on public policy choices (see Baumgartner & Leech, 1998; Hojnacki, Kimball, Baumgartner, Berry, & Leech, 2012; and Smith, 1995, for reviews). While much of this literature focuses on the national level, a growing number of studies explore influence at the state level in areas as diverse as education, health, environment, and animal welfare (Allen, 2005; Gerber, 1999; Mintrom & Vergari, 1998; Ringquist, 1994; Ritchey & Nicholson-Crotty, 2015; Shipan & Volden, 2006). Although evidence of influence is mixed, the well-financed business and professional associations that dominate state interest group communities tend to be cited as among the most effective (Nownes, Thomas, & Hrebenar, 2008). Perhaps for this reason, existing research finds that policy platforms and public policy choices, both at the state and national level, more often correspond to the interests of affluent constituents than the interests of low-income populations (Bartels, 2008; Gilens, 2014; Rigby & Wright, 2013).
Across the American states, there are comparatively few groups that are active on issues of concern to marginalized populations such as the poor. In part, this is due to the fact that low-income individuals face considerable obstacles to political participation. Although millions of Americans live below the poverty line, low-income individuals often lack the time, money, and civic skills that enable civic and political involvement and many are isolated from networks of political engagement. As a result, they are less likely than other Americans to engage in the political process or join political organizations (Rosenstone & Hansen, 1993; Soss & Jacobs, 2009; Verba, Schlozman, Brady, & Nie, 1993). In addition, research suggests that the persistent political exclusion experienced by marginalized populations contributes to low levels of political engagement among low-income populations over time (Bruch, Ferree, & Soss, 2010; Schatschneider, 1960).
Such low levels of political engagement and participation have consequences for the mobilization of groups that represent the interests of less-advantaged citizens at the state level. While 34,000 interest groups were active across states in 1997, for instance, only 4% were mobilized around welfare-related issues (Gray & Lowery, 2001). Of the political organizations that do emerge to lobby on behalf of the poor, many lack the resources that scholars theorize lead to interest group influence. Relative to business and professional organizations, social welfare advocacy organizations have fewer members and smaller budgets, spend less on lobbying, and engage in fewer political activities (Schlozman, Verba, & Brady, 2012; Strolovitch, 2008). Such groups are often funded by foundation and government grants, making them vulnerable to shifting preferences among private donors and political actors (Imig, 1996). Because groups that advocate for low-income populations face considerable barriers to political involvement and influence, the conventional scholarly wisdom holds that such groups play a limited role in the policymaking process.
Yet there are reasons to challenge the prevailing view. First, the political interests of low-income Americans are represented by a wide range of organized interests, many of which do not register as lobbying organizations (Hays, 2001). Charitable service organizations, for example, routinely engage in advocacy on behalf of the poor. Although they are legally prohibited from contributing money to political campaigns and face limitations on their lobbying activities, many “act like” interest groups in their interactions with government officials, especially at state and local levels (Berry & Arons, 2003). Pekkanen and Smith (2014) argue that nonprofit organizations that do not register as lobbyists nevertheless engage in a wide range of activities to influence public policy, such as testifying at public hearings and mobilizing grassroots advocacy campaigns. Thus, numbers of registered interest groups may understate the true degree of advocacy for the poor.
Second, despite the resource limitations of groups that lobby on behalf of the poor, advocates are not completely without resources to use in their lobbying efforts. While they lack extensive lobbying budgets and large membership bases, groups including nonprofit service providers, social policy research organizations, and intergovernmental groups often possess information that policymakers value, including information about the needs of the poor and the implementation of social welfare programs (Berry & Arons, 2003; Cammisa, 1995; Hays, 2001). In certain circumstances, advocates may be able to use their expertise to influence the decisions of policymakers eager to address a poverty-related problem and develop policies that have a high likelihood of success (Esterling, 2004; Kingdon, 1989). Moreover, recent studies find evidence of policy influence among comparatively weaker groups, such as those that are small in size and have limited monetary resources (Allen, 2005; Ritchey & Nicholson-Crotty, 2015). These studies suggest that even those groups with relatively fewer resources can achieve influence in state policymaking processes.
Third, qualitative research indicates that advocates for low-income populations are active and influential in the social policymaking process at both national and state levels. On the issue of welfare reform, case studies show that advocates for low-income children and families engaged in a wide range of lobbying activities and were successful in fighting off some proposals to scale back the welfare state at the national level (Haskins, 2006; Weaver, 2000; Winston, 2002). Interest groups are also cited as active and influential on welfare reform across states (Burt et al., 1997; Geen et al., 1998; Heaney, 2004; Karch, 2007; Winston, 2002). Karch (2007), for instance, shows that advocates were able to modify stringent employment-related provisions of welfare reform in Oregon through involvement in hearings, a welfare reform task force, and legislative work sessions. Similarly, Winston (2002) finds that in Maryland, advocates were influential in decisions to preserve the welfare entitlement and set a floor on benefit levels.
The fact that advocates are politically active across states, possess resources that policymakers value, and are cited as influential in the policy process suggests that advocates may play a larger role in state social policymaking processes than the conventional wisdom suggests. If advocates are indeed influential, then cross-state differences in advocacy community strength may be associated with state social policy choices. In states with stronger advocacy communities, advocates may be able to successfully push for the adoption of policies that provide benefits to low-income individuals and families, while blocking policies that restrict or eliminate such benefits.
For several reasons, the size of a state’s advocacy community is likely to provide a strong indicator of sector strength. In states with larger and more robust advocacy communities, advocates have more ability to access the policymaking process and will be better able to engage in the many activities associated with policymaking, such as participating in working groups, contacting state policymakers directly, or testifying in legislative hearings, relative to a single organization. A larger number of advocates also creates more opportunities for collaboration, which is among the most common activity of advocacy groups in the social policy domain (Bass, Abramson, & Dewey, 2014; Delgado, 1986; Mosley, 2014; Piven & Cloward, 1979; Sandfort, 2014; Sherraden, Slosar, & Sherraden, 2002; Staggenborg, 1986; Strolovitch, 2008; Warren & Cohen, 2000). Collaboration offers advocates the opportunity to pool the resources necessary for participating and influencing the policy process, while signaling political strength across numerous actors (Hula, 1999; Phinney, forthcoming). 1
Thus, there are strong reasons to suspect that the size of states’ advocacy community will be systematically related to their social policy choices. The following sections of this article examine the empirical support for two hypotheses concerning the relationship between state advocacy communities and policy choices. Specifically,
In analyzing the support for the above hypotheses, the article is the first to examine the systematic relationship between states’ advocacy communities and social policy choices across all 50 states. Although there is a robust literature on cross-state variation in social policy, quantitative research has not yet prioritized the role of advocates (see, for example, Fellowes & Rowe, 2004; Filindra, 2013; Gais & Weaver, 2002; Hero & Preuhs, 2007; Reingold & Smith, 2012; Soss et al., 2001). By taking into account the advocacy community, this analysis has the potential to contribute to scholars’ understanding of the determinants of states’ social policy choices, as well as the political influence of advocates for low-income populations.
Data
To provide insight regarding the role of advocates in state social policymaking, this analysis focuses on the predictors of state policy choices following the PRWORA of 1996, or welfare reform. The PRWORA ushered forth a wide range of policy changes at the state level by replacing the entitlement program Aid to Families With Dependent Children with the block grant program Temporary Aid to Needy Families (TANF). Under TANF, cash benefits were made conditional on employment activities and time limited. States were also granted increased discretion over numerous programmatic issues, including generosity of benefits, stringency of work requirements, and sanctioning policies for noncompliant behavior (Rowe, 2000; Weaver, 2000).
The PRWORA provides a unique opportunity to examine the relationship between state-level advocates and social welfare policy adoption, for several reasons. First, the PRWORA allowed states to make state-specific welfare policy decisions in multiple program areas, thereby providing an opportunity to examine the relationship between advocacy and policy choices across many different types of welfare policy choices. Second, because states’ enhanced authority existed over a defined set of issue areas, policy choices are comparable across states. Third, states were required to respond to the PRWORA by defining the structure of their new welfare programs, meaning that all state governments exercised their new discretion at a similar point in time. Finally, the fact that states had to respond to the PRWORA meant that advocates for low-income populations had similar incentives to mobilize knowing that the welfare program would gain space on the political agenda. Such factors—the enhanced state discretion in multiple program areas, the comparability of policy choices across states, the requirement that each state respond to federal changes in the welfare program, and the guarantee that welfare would gain agenda space—make the PRWORA uniquely suited for a cross-state analysis of the role of state-level advocates in the social welfare policy process.
State Welfare Policy Choices
Under the PRWORA, the goals of the TANF block grant program were to provide assistance to poor families, end the dependence of poor families on government benefits by encouraging employment, and reduce the incidence of childbirth out of marriage (Gais, Nathan, Lurie, & Kaplan, 2001). In pursuit of these goals, states adopted a range of policies that imposed strict requirements or penalties for noncompliance with welfare program rules, as well as those that offered resources and support to welfare recipients as they transitioned into employment. For simplicity, I refer to the former as “punitive policies” and the latter as “supportive policies.”
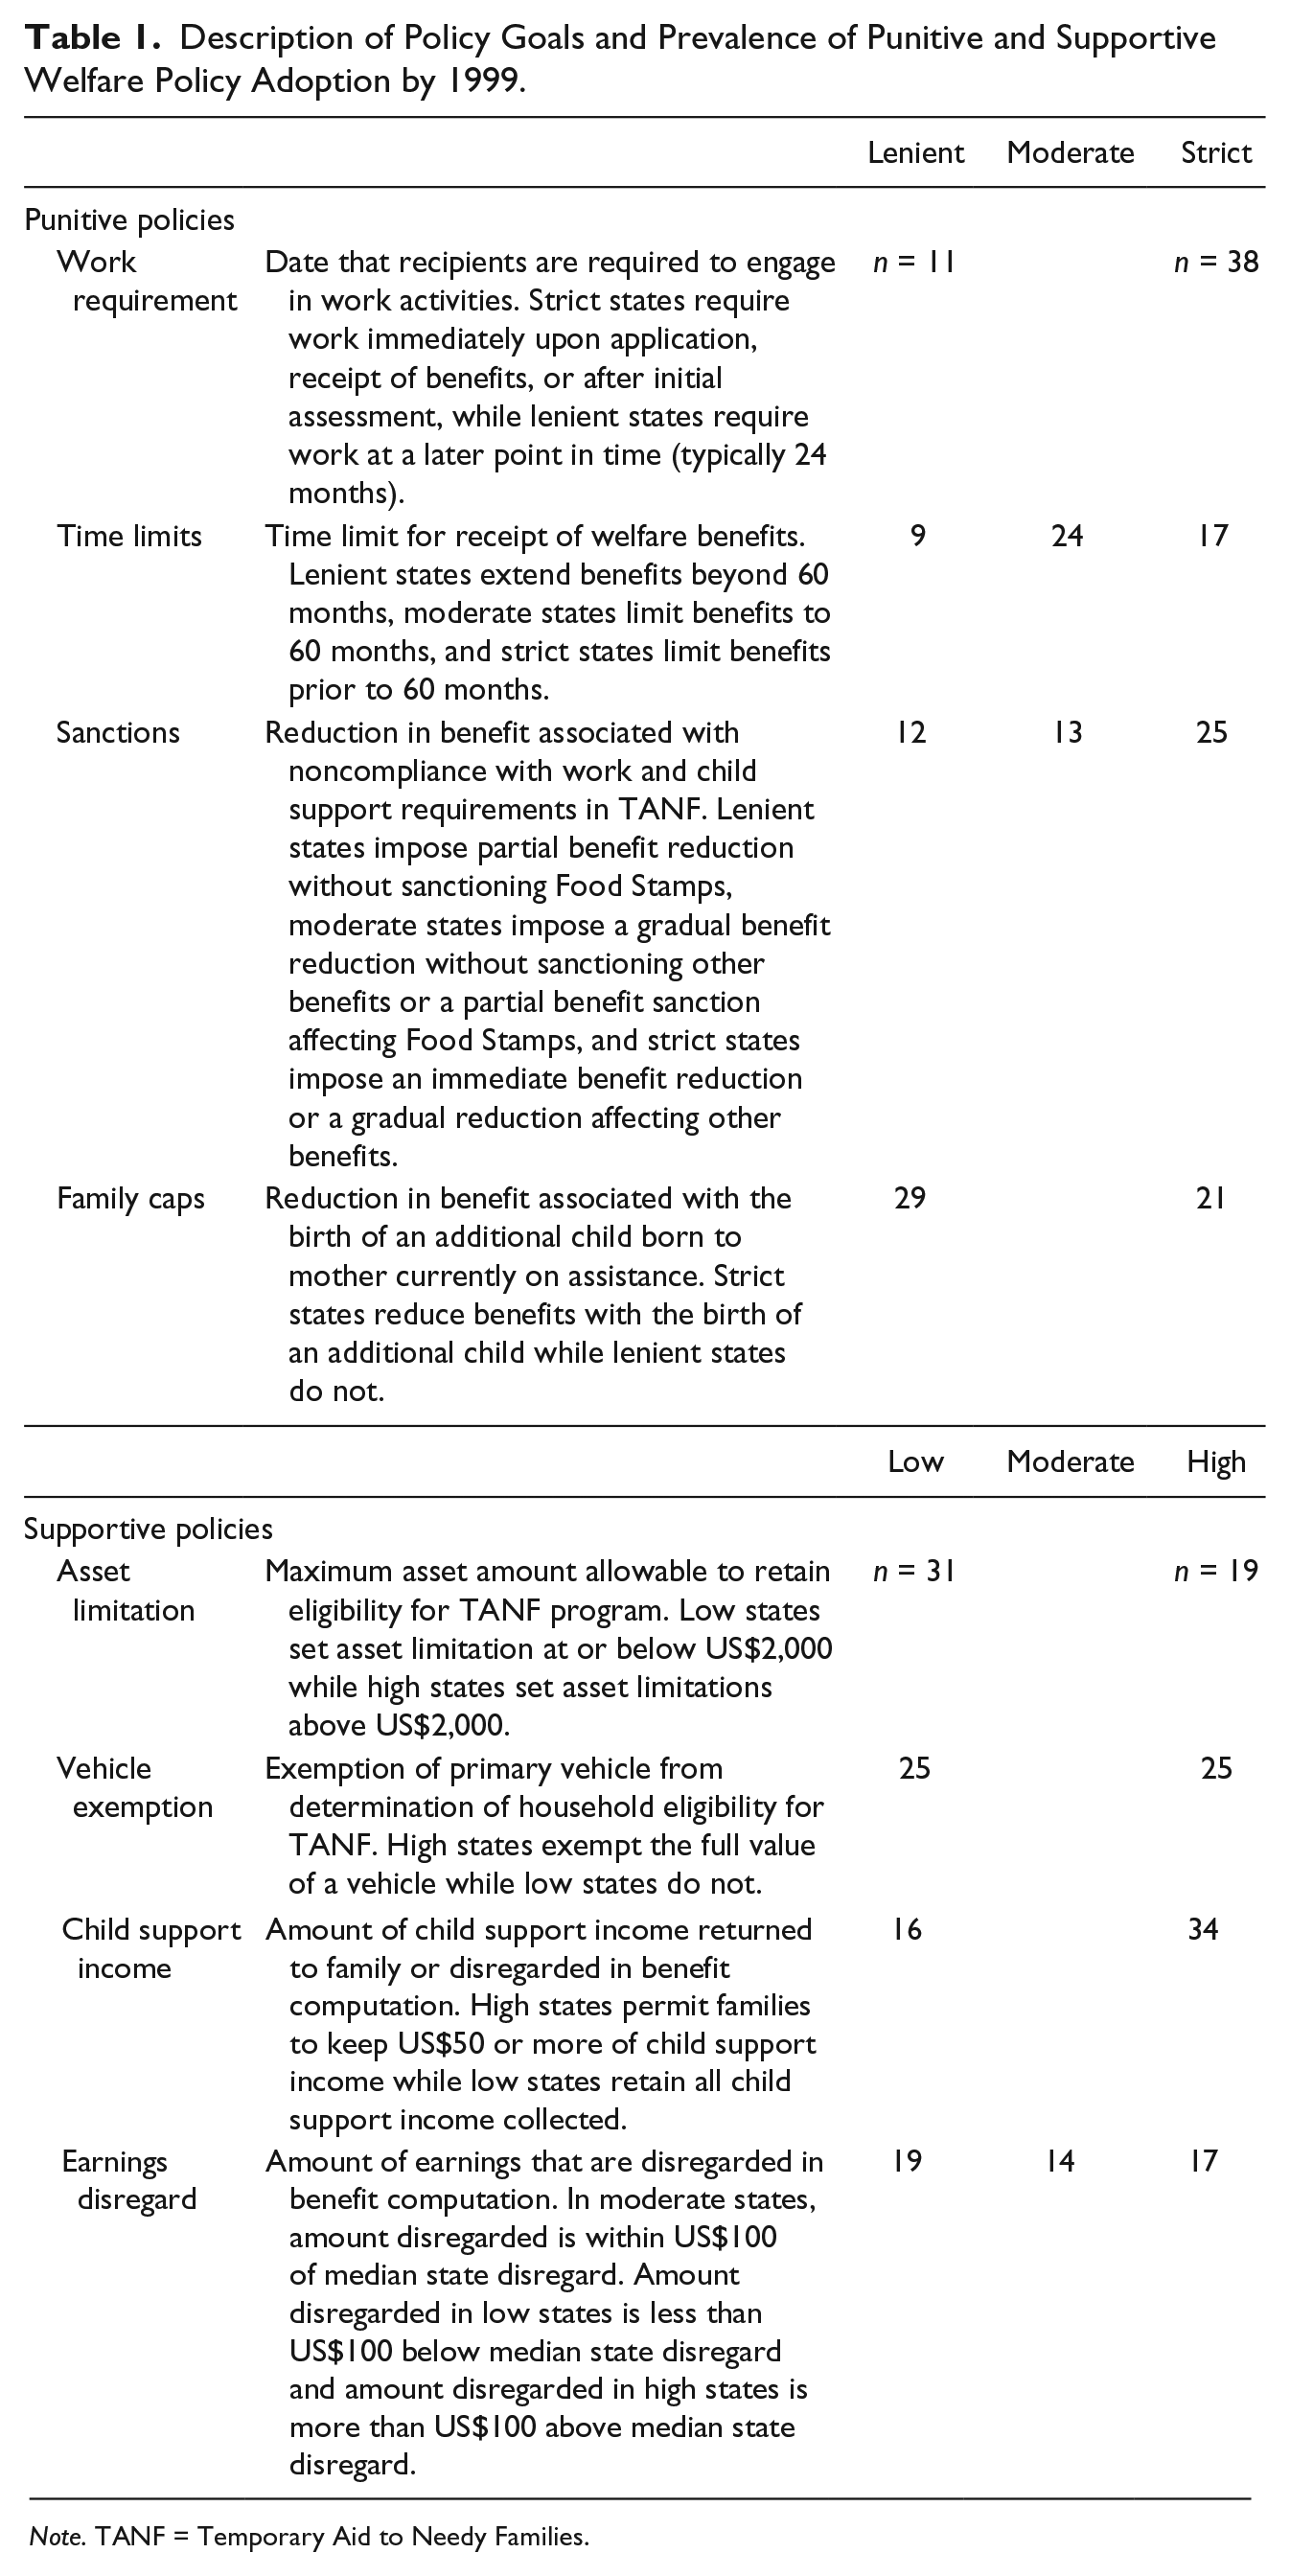
Table 1 provides a brief description of select programmatic issues falling within the categories of punitive and supportive policies, 2 as well as the frequency of policy adoption across states. All policies are coded on a 1 to 3 (time limits, sanctions, earnings disregards) or a 0 to 1 scale (asset limitations, vehicle exemptions, child support income, work requirements, and family caps). 3 For punitive policies, higher values indicate more stringent policies; for supportive policies, higher values indicate greater supports or resources. The policy measures are constructed from the Urban Institute’s Welfare Rules Database (WRD) and existing studies of state policy decisions by leading welfare scholars (Blank & Schmidt, 2001; Pavetti & Bloom, 2001). 4 Policy choices are measured in 1999, when all states had finalized their initial welfare policy decisions. 5
Description of Policy Goals and Prevalence of Punitive and Supportive Welfare Policy Adoption by 1999.
Note. TANF = Temporary Aid to Needy Families.
The first four rows of Table 1 describe the distribution of punitive policies across states. These policies include work requirements, time limits, sanctions, and family caps. With respect to work requirements, federal law requires that all adult recipients engage in work activities after 2 years of receiving benefits, but states are permitted to demand work from recipients at an earlier point. Table 1 shows that by 1999, 38 states had adopted the strictest standards, requiring work activity immediately upon application, receipt of TANF benefits, or after an initial assessment or work orientation (Rowe, 2000). These states are coded as enacting “strict” work requirements. Eleven states are coded as enacting “lenient” work requirements, in which work requirements were not imposed immediately but rather at a later point in time, with the majority of “lenient” states adopting the federal standard of 24 months. 6
With respect to time limits, benefits are time limited at 60 months for the majority of TANF recipients, though states are permitted to set earlier time limits. In this analysis, 24 states are coded as enacting “moderate” time limits, or limiting benefit receipt to 60 months, by 1999. Seventeen states adopted shorter time limits (“strict” time limits) and nine states used state funds to continue benefits past the 60-month federal limit (“lenient” time limits; Pavetti & Bloom, 2001). 7
When a TANF recipient does not comply with activities requirements, states are required to impose a benefit reduction, or sanction, until that family meets the requirement. States vary in the stringency of sanctioning policies, with some state policies punishing noncompliant behavior in areas other than employment or imposing sanctions that affect Food Stamp or Medicaid coverage (Pavetti & Bloom, 2001). Table 1 shows that 25 states adopted the strictest sanctions, in which the sanction was either imposed immediately and or imposed gradually with a full sanction of Food Stamps or Medicaid; 13 states had moderate sanctions, in which the gradual full family sanctions did not affect other benefits or the partial benefit sanction affected Food Stamp benefits completely; and 12 states had lenient sanctions, in which the partial benefit sanction did not include a full sanction of Food Stamp benefits.
Finally, TANF aimed to reduce the extent of out-of-wedlock childbearing by altering the costs and benefits associated with having children out of marriage. The family cap policy prohibits additional benefits to children born to mothers currently receiving welfare benefits. This policy was included in PRWORA at state option, meaning that states were allowed but not required to adopt the policies. By 1999, 21 states had enacted a family cap policy and are coded as adopting a “strict” family cap policy (Rowe, 2000). The 29 states that did not adopt a family cap policy are coded as “lenient” for this policy.
While much of the research on states’ welfare policy choices has focused on punitive policies, the PRWORA also permitted states to provide resources to support recipients’ transitions into employment. The second four rows of Table 1 describe the distribution of several supportive policies. Under the PRWORA, states provide cash benefits to families falling below a predetermined, state-specific income threshold. 8 A family is eligible to receive cash benefits if earned income falls below the income threshold and if assets do not exceed state-specific limits. Prior to PRWORA’s enactment, families were permitted to have up to US$1,000 in assets and US$1,500 in vehicle equity and remain eligible for welfare. By 1999, most states had liberalized these restrictions. Table 1 shows that 19 states raised asset limitations above the median asset limitation of US$2,000 (typically, to either US$2,500 or US$3,000), or adopted a “high” asset limitation, and half exempted the full value of a vehicle, or adopted a “high” vehicle exemption.
The PRWORA also increased state discretion over the division of child support income between families and the state. In 1999, 34 states permitted families to keep US$50 or more of child support income and disregard this income when determining the amount of the welfare cash benefit. These states are coded as “high” for the child support income policy. Sixteen states retained all child support income collected and are coded as “low” for this policy.
States also increased incentives for recipients to work through the use of earnings disregards, which essentially ignore a share of earnings when calculating a household’s eligibility for welfare benefits. The earnings disregard prior to the PRWORA was 33%, which translated into a benefit reduction of 67 cents for every additional dollar earned (Blank & Schmidt, 2001). Most states expanded this initial earnings disregard after reform (Matsudaira & Blank, 2014). Table 1 shows that by 1999, 19 states had enacted a policy of “low” generosity, meaning that the amount that was disregarded for a single mother working full-time at US$6/hr was less than US$100 below the median state disregard. Fourteen states had a “moderate” generosity policy (disregarded earnings within US$100 of median disregard) and 17 states had a “high” generosity policy (disregarded earnings above US$100 of median disregard; Blank & Schmidt, 2001).
The punitive and supportive policies over which states had discretion differ in terms of the structure of the policy as well as the level of controversy surrounding each set of policies. 9 Relative to supportive policies, punitive policies such as sanctions and family caps are more behaviorally directive, restricting or eliminating access to benefits if recipients fail to comply with activities requirements and program rules. In contrast, supportive policies such as asset limitations, vehicle exemptions, and child support pass-through policies allow families to possess greater assets and income without losing eligibility for the welfare program (Gais & Weaver, 2002; Soss et al., 2001).
Few studies investigate whether the economic, political, and social determinants of state policy choices differ for punitive and supportive policies and there is limited past research to suggest that such factors affect punitive and supportive policies differently. For instance, liberal legislators and constituents are likely to oppose punitive policies and favor supportive policies, relative to conservative legislators and constituencies. Yet there are reasons to suspect differences with respect to the role of advocates during welfare reform. At the time of the PRWORA’s passage, punitive policies were highly contentious and visible, whereas supportive policies were relatively less so. Such differences may have influenced whether advocates engaged in lobbying as well as their lobbying success. For instance, advocates may have focused their efforts on preventing the adoption of the punitive policies. Or, perceiving a greater chance of success on the supportive policies, advocates may have focused their efforts on these relatively less-contentious policies. To account for the possibility of differences in the relationship between advocacy communities and punitive and supportive policies, both types of policies are included in the analysis.
State Advocacy Communities
Organizations that advocate on behalf of the poor can be broadly categorized into two types: Political organizations that focus on advocacy on behalf of the poor and nonprofit groups that provide services to low-income populations. While political organizations can and do engage in frequent lobbying, nonprofit charitable service providers—or groups with the tax designation 501(c)3—are organized for a purpose other than advocacy and encounter legal limits on their lobbying activities. Despite legal limits on lobbying, however, research suggests that nonprofit service providers frequently advocate on behalf of the poor, though their political activity is less extensive than lobbying organizations (Berry & Arons, 2003; Pekkanen et al., 2014). Because lobbying organizations and nonprofit service providers encounter different restrictions on lobbying that have implications for their advocacy activities, I distinguish between the two types of organizations in the empirical analysis.
To create a count of the number of lobbying groups, or interest groups registered to lobby on social welfare issues, I use Gray and Lowery’s data set of state interest group registrations in 1997. 10 These data are compiled from lists of lobbying registration rolls provided by each state and include membership and nonmembership based organizations that are listed by name and coded according to economic sector (Gray & Lowery, 2001). In 1997, more than 34,000 organizations were registered to lobby across states. A total of 1,276 groups (4% of all groups) are coded as lobbying on the issue of “welfare.” Of these “welfare” organizations, I code each into a specific category based on the group’s focus. The categories include animal welfare, children, disability, the elderly, housing and homelessness, public interest law, social service, social work, and other welfare issues (such as immigration). 11 The count of registered lobbying groups active on social welfare issues includes those groups with a focus on children, housing and homelessness, public interest law, social service, social work, and “other” welfare issues (n = 799) and excludes those groups with a focus on animal welfare, disability, the elderly and those groups for which a focus could not be determined (n = 477).
To measure the number of welfare-related nonprofit service providers across states, I use data from the Urban Institute’s National Center for Charitable Statistics (NCCS). Compiled from tax records, the NCCS aggregates information for all charitable service organizations that that have registered for tax-exempt status with the Internal Revenue Service. Such organizations differ from traditional lobbying organizations in that they exist to provide services for needy populations rather than to engage in political activity. In 1996, there were more than 530,000 registered nonprofit charitable service (501(c)3) organizations active across a range of issue areas including arts, education, youth development, and science and technology (The Urban Institute, National Center for Charitable Statistics, 1996). A total of 32,916 were registered public charities active on human service issues, 12 excluding those focused on the provision of services to the elderly, disabled, travelers, and the LGBT community. 13 The count of nonprofit service organizations includes social service agencies that provide general services populations in need (such as Catholic Social Services), as well as organizations that provide specialized care and supportive services to children, adults, and families (such as emergency assistance, financial counseling, and support to single parents).
The two advocacy community variables utilize existing, reputable data sources to develop measures of advocacy community strength that are comparable across states. In this sense, the variables represent an important improvement over past research. Although other measures of the strength of advocates exist—for instance, the extent of participation in welfare reform hearings or the access granted to antipoverty advocates by legislative policymakers—the difficulty of gathering systematic data on such activities across states has to date precluded cross-state analyses. Thus, such measures have primarily been used in qualitative research.
State Political and Economic Characteristics
The remaining independent variables are grouped into three categories based on the posited mechanism of influence over state social policy decisions. 14 The categories include political factors, economic factors, and constituent opinion. Because the majority of state welfare plans were passed immediately following the PRWORA’s passage in August 1996, the independent variables are measured in 1996.
With respect to political factors, research suggests that liberal state governments are more likely than conservative governments to adopt generous redistributive policies, particularly on the issue of welfare (Fellowes & Rowe, 2004; Gais & Weaver, 2002; Peterson, 1995). To control for government liberalism, I use Berry and colleagues’ (1998) measure of state government ideology in 1996. This variable uses interest group ratings to estimate the ideological position of five sets of actors (governors, and the two major party delegations in each Congressional house) and aggregates these positions based on the relative power of each actor in the state (see Berry et al., 1998). Because higher values indicate more liberal governments, this variable should be negatively associated with punitive policies and positively associated with supportive policies. 15
Past research also finds that across a range of public policy issues, electoral competition is associated with more liberal policies (Holbrook & Van Dunk, 1993; Plotnick & Winters, 1985). When electoral competition is high, state legislators are more likely to favor disadvantaged interests because the possibility of electoral defeat makes candidates more responsive to constituent needs and because competition results in low-income voters constituting a larger share of the electorate (Barrilleaux, Holbrook, & Langer, 2002; Holbrook & Van Dunk, 1993; see also Key, 1949). To control for electoral competition, I use Holbrook and Van Dunk’s (1993) measure of competition in district-level state legislative elections from 1994 through 1997, updated by Shufeldt and Flavin (2012). For this variable, higher values indicate greater levels of competition. 16 The expected relationship is negative for punitive policies and positive for supportive policies.
Scholars have also drawn attention to the role of racial stereotypes in shaping social policy choices (Fellowes & Rowe, 2004; Fording, Soss, & Schram, 2011; Gais & Weaver, 2002; Soss et al., 2001). Soss, Fording, and Schram (2008) theorize that when race is salient in policy debates, policymakers turn to racial group reputations to evaluate policies. On the issue of welfare, African American recipients were more likely than other recipients to be viewed as having motivational or behavioral deficiencies that led them to become dependent on welfare (Gilens, 1999). The authors posit that policymakers from states with larger minority representation on welfare caseloads were more likely to view themselves as enacting policies for people who faced behavioral or motivational barriers to economic self-sufficiency and more likely to adopt punitive welfare policies (Soss et al., 2008). Following Soss and colleagues (2001), I control for racial bias by including variables measuring the percentage of African American recipients on states’ welfare caseloads in 1996 (African American caseload) and the percentage of Hispanics on states’ welfare caseloads in 1996 (Hispanic caseload). I expect this variable to be positively associated with punitive policies and negatively associated with supportive policies. 17
Economic factors also shape welfare policy choices. Positive economic conditions may increase citizens’ preferences for redistribution or provide increased funding for social policy programs (Plotnick & Winters, 1985; Tweedie, 1994). I use per capita gross state product in 1996 to control for budgetary capacity within a state. Because states with greater budgetary capacity may be less resistant to redistributive policies, this variable should be negatively associated with punitive choices and positively associated with supportive choices.
In addition to political and economic factors, previous research reveals that constituent liberalism is associated with state policy adoption in areas as diverse as health, education, criminal justice, and welfare (Burstein, 2003; Erikson, Wright, & McIver, 1993; Fellowes & Rowe, 2004; Tweedie, 1994). To control for constituent liberalism, I use Erikson, Wright, and McIver’s measure of the ideology of a state’s electorate in 1996 (McIver, Erikson, & Wright, 2001). This variable estimates of the ideological identification of state electorates from cumulative opinion surveys from CBS/New York Times, with higher values indicating more liberal states (see Erikson et al., 1993; McIver et al., 2001). 18 I expect this variable to be negatively associated with punitive policies and positively associated with supportive policies.
Finally, three variables are included to control for the states’ past generosity on the issue of welfare and the overall size of the interest group population. Prior to the passage of PRWORA, states differed with respect to the generosity of their social welfare programs. A state’s orientation in the social welfare policy arena likely influenced policy choices made following PRWORA’s passage. To control for a state’s social policy orientation, I include a variable measuring the value of a cash welfare benefit for a family of three in 1990. States with lower cash benefit levels in 1990 are assumed to be less generous in their orientation to welfare programs, while states with higher cash benefit levels are assumed to be more generous in their orientation. In addition, it is necessary to control for the lobbying population, or the total number of lobbying organizations in a state, and the charitable service population, or the total number of registered public charities in a state (see Table A1 for descriptive statistics for all independent variables).
Empirical Analysis
Nearly all states contain advocates for low-income populations, yet there is considerable variation across states with respect to the number of welfare lobbying organizations and charitable human service providers. Figure 1 depicts this cross-state variation by presenting two box plots that show the distribution of welfare lobbying organizations across states (Panel A) and the distribution of registered public charities across states (Panel B). The first panel shows that median number of lobbying groups is 14, with half of the states possessing between two and 14 registered welfare lobbying organizations. The second panel shows that for half of the states, the number of service providers is relatively tightly clustered between 112 and 478 groups, which is the median number of groups. In addition, the distribution both lobbying organizations and public charities is right-skewed, with several states possessing an unusually large number of lobbying groups (Illinois and Minnesota) and charitable providers (Texas, New York, and California).

Box plots of advocacy community variables.
To examine the relationship between the number of welfare advocacy groups and state social policy choices, I begin by regressing the set of independent variables on the set of punitive policies and set of supportive policies, taken as a whole. In these regressions, the punitive policies and supportive policies are collapsed into two measures of state policy choice, with each state receiving one point if it adopted a “strict” punitive policy (first dependent variable) and one point if it adopted a “high” supportive policy (second dependent variable). The dependent variables thus represent a scale of punitive policies, with higher values indicating stricter policies, and a scale of supportive policies, with higher values indicating greater leniency in policy choice. A series of ordinary least squares regressions indicate that neither advocacy community variable emerges as a significant predictor of social policy choice (see Table A2 for results not shown in text). Indeed, few factors appear to predict the set of punitive and supportive policies: Only government liberalism and per capita GDP show a significant association with punitive policy choice. 19
While the data do not reveal a significant association when the punitive and supportive policies are considered together, it is possible that significant relationships exist for discrete policy choices. To account for this possibility, the next part of the analysis considers the predictors of individual policy choices. In this analysis, I use ordered logistic regression analysis to estimate relationships for sanctions, time limits, and earnings disregards, and logistic regression analysis to estimate relationships for asset limitations, vehicle exemptions, child support income, work requirements, and family caps. As discussed earlier, higher values indicate stricter punitive policies (sanctions, time limits, work requirements, and family caps) and more supportive policies (earnings disregards, asset limitations, vehicle exemptions, and child support income) (see Tables A3 and A4 for complete results).
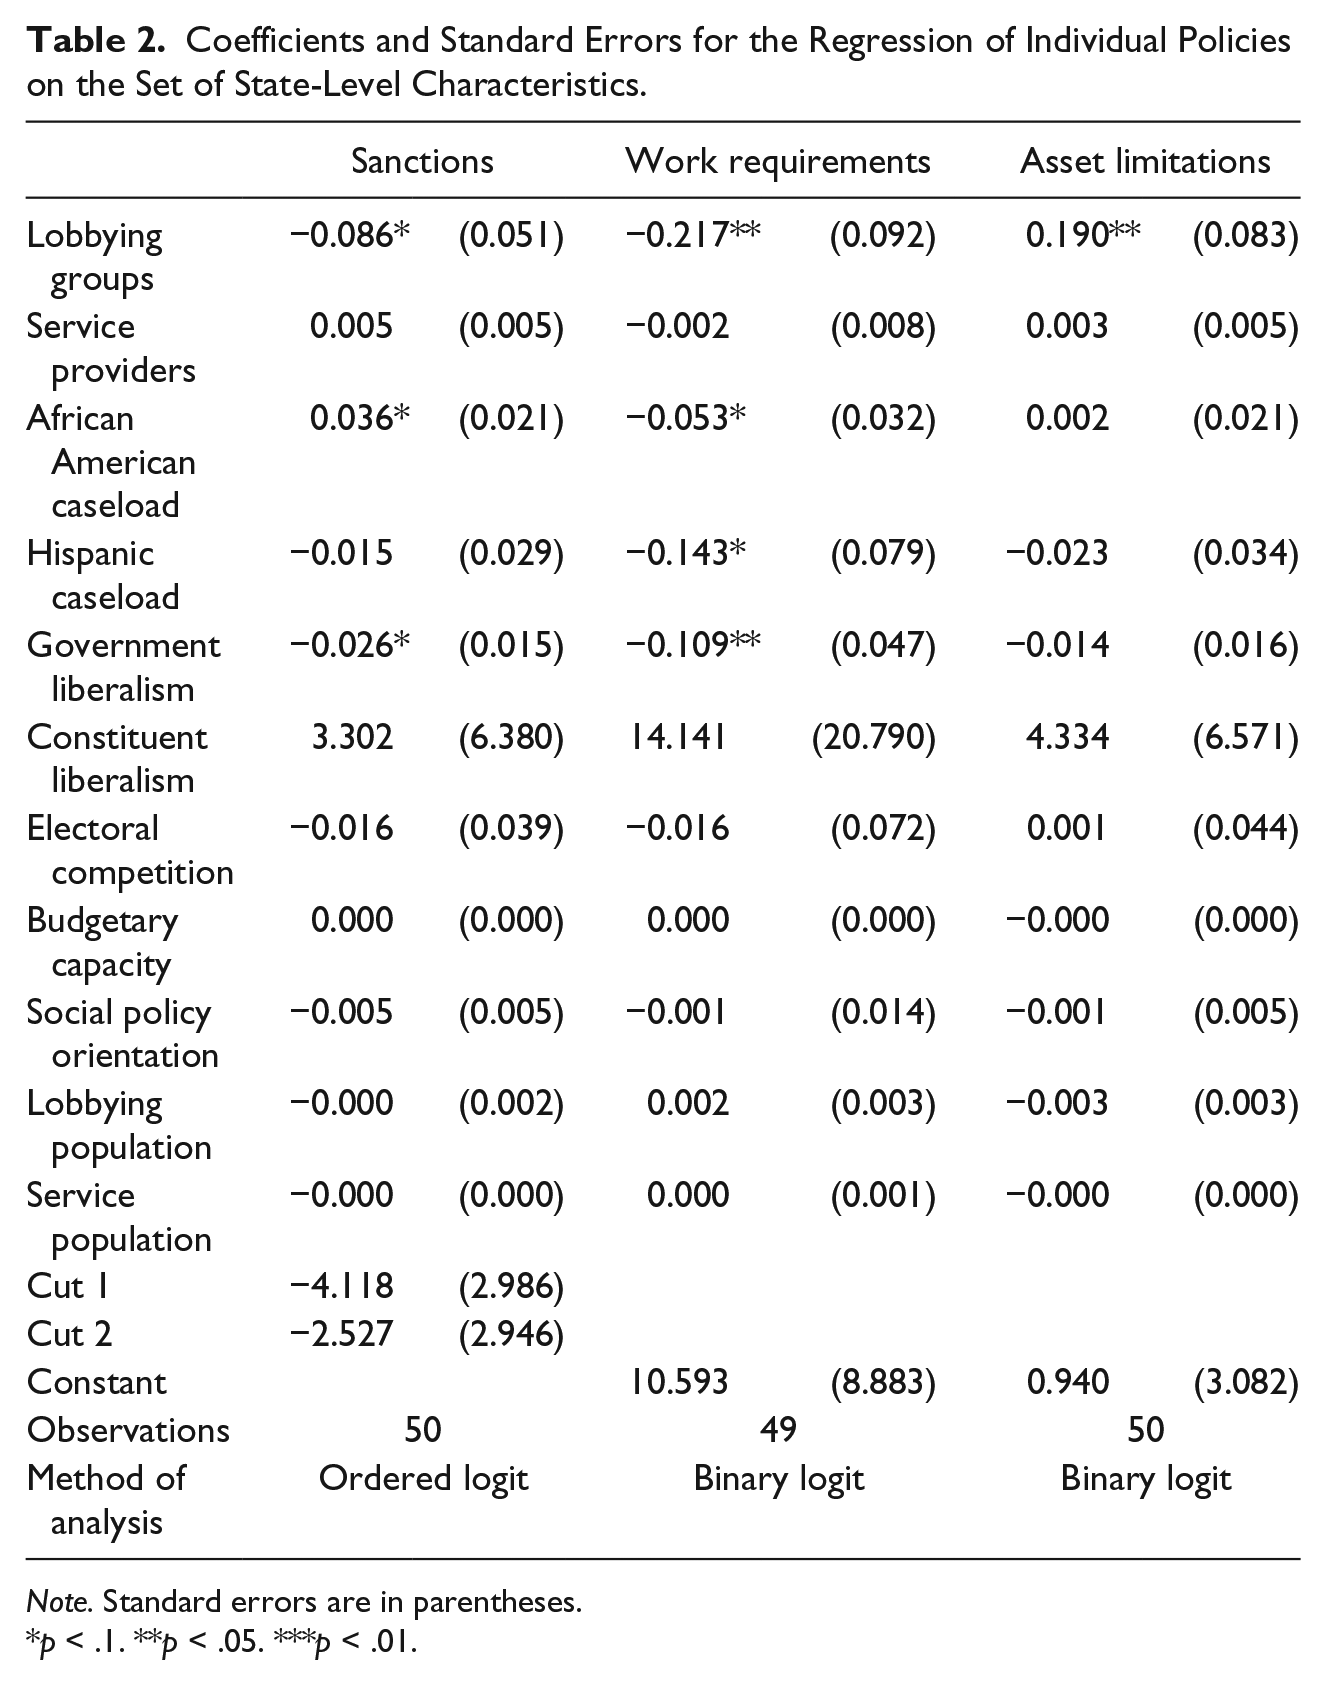
The analysis reveals significant associations between advocacy community strength and three welfare policy choices: sanctions, work requirements, and asset limitations. 20 Table 2 presents the coefficients and standard errors for these three regressions. This table shows that the size of a state’s lobbying community is significantly and negatively associated with the adoption of stricter sanctions and work requirements. The first and second columns show that, controlling for other political and economic characteristics, an increase in the number of lobbying organizations is associated with a decrease in the logged odds of adopting strict sanctioning laws and as well as a decrease in the logged odds of adopting a policy that requires work earlier than the federal standard of 24 months. A state’s lobbying community is positively associated with the adoption of supportive asset limitations: Specifically, an increase in the number of welfare lobbying organizations is associated with an increase in the logged odds of enacting supportive asset limitations. Interestingly, it is the strength of lobbying organizations rather than charitable service organizations that emerges as significant across the three regressions.
Coefficients and Standard Errors for the Regression of Individual Policies on the Set of State-Level Characteristics.
Note. Standard errors are in parentheses.
p < .1. **p < .05. ***p < .01.
Consistent with past research, government liberalism and racial bias also emerge as significant predictors of punitive state welfare policy choice (see Fellowes & Rowe, 2004; Gais & Weaver, 2002; Soss et al., 2001). The first column shows that an increase in the percentage of African Americans on the welfare caseload is associated with an increase in the logged odds of adopting strict policies that penalize recipients for failing to comply with work activities, while an increase in the liberalism of a state’s government is associated with a decrease in the logged odds of adopting such policies. Government liberalism, as well as the percentage of African American and Hispanic recipients on the welfare caseloads, is also associated with a decrease in the logged odds of adopting a strict work requirement, controlling for other factors. Other economic, social, and political factors do not emerge as significant predictors of a high asset limitation. 21
To facilitate the interpretation of the relationship between a state’s welfare lobbying community and its welfare policy choices, the final part of the analysis considers how the probability of a state adopting strict sanctioning policies, work requirements, and generous asset limitations changes alongside a change in the size of a state’s welfare lobbying community. Table 3 shows that for a state with mean political and economic characteristics, the probability of adopting the strictest sanctions is 0.53, the probability of adopting moderate sanctions is 0.32, and the probability of adopting lenient sanctions is 0.15. In addition, the probability of adopting strict work requirements is 0.96, and the probability of adopting a generous asset limitation is 0.34.
Predicted Probabilities, Varying Values for Lobbying Organizations.

For a state with a low number of welfare lobbying organizations (five advocates, or one standard deviation below the mean number of advocates) and mean political and economic characteristics, the probability of adopting the strictest sanction increases by .22 (from .53 to .75), the probability of adopting moderate sanctions decreases by .13 (from .32 to .19), and the probability of adopting lenient sanctions decreases by .08 (from .15 to .07). With respect to work requirements and asset limitations, the probability of adopting short work requirements increases by .04 (from .96 to 1.0), and the probability of adopting generous asset limitations decreases by .28 (from .34 to .06).
For a state with a high number of welfare lobbying organizations (27 advocates, or one standard deviation above the mean), the probability of strict sanctions decreases by .22 (from .53 to .31), the probability of moderate sanctions increases by .06 (from .32 to .38), and the probability of lenient sanctions increases by .17 (from .15 to .32). Thus, the presence of a large number of advocates is associated with an increase in the probability of both lenient and moderate sanctions, and a decrease in the probability of strict sanctions. The probability of short work requirements decreases by .26 (from .96 to .70) while the probability of generous asset limitations increases by .46 (from .34 to .80). The table demonstrates that across the three policy choices, the magnitude of the relationship between the advocacy community and policy choices varies, with the strongest changes occurring for asset limitations, and in the probability of a state adopting strict sanctions.
Discussion, Implications, and Conclusion
Although there are reasons to challenge the prevailing wisdom that advocates for the poor lack policy influence at the state level, previous research has not investigated the relationship between organizational advocacy and policy choices across the 50 states. This article is the first to systematically analyze the role of advocates and to demonstrate an association between the strength of a state’s advocacy community, measured as the total number of lobbying organizations active on social welfare issues within a state, and the adoption of several social welfare policies.
Significant findings emerge for a subset of both punitive (sanctions and work requirements) and supportive (asset limitations) policies. The size of a state’s advocacy community is significantly associated with the adoption of stricter sanctions and work requirements, as well as more generous asset limitations. It is noteworthy that of the two advocacy variables, it is only the size of the lobbying community that emerges as a significant predictor of policy choice. The strength of charitable service providers is not systematically associated with the adoption of social policy across states, despite the well-established advocacy role of nonprofit service providers at the state level. To the extent that the advocacy community acts as a buffer against punitive policies or enabler of supportive policies, this suggests that it is lobbying organizations rather than charitable service providers that are likely to emerge as more important actors.
The strength of advocates does not emerge as a significant predictor of punitive and supportive policies when such policies are considered as a whole. In other words, it is not the case that the strength of advocates is related to a state adopting a set of punitive policies or a set of supportive policies. The fact that few independent variables emerge as significant across the two scales implies that the political and economic determinants of welfare choices are, to some extent, dependent on individual policy choices. The lack of a clear pattern across both the scales and individual policy choices suggests that contextual differences between punitive and supportive policies may be unrelated to the relationship between advocacy and policy choice.
Such findings regarding the relationship between the advocacy community and social welfare policy choice are consistent with existing research on the predictors of state welfare decisions. In previous studies, the predictive power of political, economic, and constituent factors varies considerably across discrete policy choices (see, for example, Reingold & Smith, 2012; Soss et al., 2001). Inconsistencies across policy choices may stem part from the fact that after PRWORA’s passage, states were granted enhanced discretion over a wide number of programmatic decisions and used this discretion in many different ways (De Jong, Graefe, Irving, & St Pierre, 2006; Gais et al., 2001). There is also research to suggest that advocates pursued different types of strategies across states, which may have affected their role in welfare reform policymaking debates (see Karch, 2007).
Nevertheless, evidence of a significant association across several policies warrants further investigation of the role of advocates for low-income populations in the social welfare policy process, particularly those groups that are organized explicitly for advocacy purposes. Future research might expand on these findings in several ways. First, scholars interested in the influence of advocates might investigate alternate measures of advocacy community strength. In this study, advocacy community strength is measured as the presence of advocacy groups rather than their actual activity. While qualitative research demonstrates that antipoverty advocates were active across states and thus supports the validity of this measure, research that systematically examines the activities of advocates across states—for instance, by investigating group participation in legislative working groups or attendance at committee hearings—may provide a more nuanced view of advocacy group involvement and influence in the policy process.
Second, scholars might build upon this research by using modeling approaches that account for unobserved heterogeneity across states, such as panel designs. Although this analysis controls for many forms of observed heterogeneity, it is possible that there are unobserved state differences that are related to both the size of the advocacy community and state policy choices, thereby biasing estimated coefficients. This limitation, though common to many cross-state analyses of policy choices, has consequences for the interpretation of the findings. Because the design is not capable of controlling for unobserved forms of heterogeneity, the findings in this article should be interpreted as descriptive rather than causal.
Finally, future work might expand upon this research by examining the role of advocates in different social policy areas. Though the welfare reform case has distinct advantages for the research questions considered in this analysis, the unpopularity of the welfare program and the defensive nature of much of the lobbying may have served as an additional barrier to influence. It seems reasonable to suspect that groups representing those living in poverty might enjoy greater success on policies that are more strongly supported by constituents and policymakers, such as state tax credit programs for low-income families. Future research may uncover different or more consistent relationships for policies that were relatively less contentious in nature.
Since the passage of welfare reform in 1996, a growing body of research has emerged to better understand the determinants of state social policy choices in an increasingly devolved welfare state. While scholars have recognized that advocacy communities extend beyond lists of registered lobbyists, few studies of state-level social policy adoption incorporate such measures. Using a new data set measuring state advocacy communities, the article provides evidence that the presence of advocates is related to state social policy choice, despite the limited resources of most advocacy groups. The findings imply that the strength of advocates may be related to state policy choice, though the lack of a consistent pattern across all policies examined calls for more research on the topic. Finally, the devolution of policy authority from national to state levels has increased incentives for advocates for the poor to mobilize to influence state social policy decisions. If advocacy communities have grown alongside the shift in policy authority, then research examining the prevalence and consequences of advocacy may prove a fruitful path of inquiry for scholars interested in state-level policies targeting America’s least advantaged citizens.
Footnotes
Appendix
Acknowledgements
For helpful comments, the author thanks Sheldon Danziger, Elisabeth Gerber, Rick Hall, Andy Karch, Charles Shipan, and Chris Roberts, as well as seminar participants at the University of Michigan, University of Minnesota, and the Midwest Political Science Association and American Political Science Association annual meetings. She also thanks Joe Soss and Virginia Gray and David Lowery for making their data available.
Declaration of Conflicting Interests
The author(s) declared no potential conflicts of interest with respect to the research, authorship, and/or publication of this article.
Funding
The authors disclosed receipt of the following financial support for the research, authorship, and/or publication of this article: For funding support, the author thanks the University of Michigan Department of Political Science, Ford School of Public Policy, Horace H. Rackham School of Graduate Studies, Nonprofit and Public Management Center, and the Center for the Education of Women.