
Abstract
We show how symbolic politics condition public opinion on federal spending and how this helps to explain an important puzzle in contemporary American politics. Using multilevel regression and poststratification to estimate state-level opinion on federal spending, we show that, curiously, opposition to federal spending is higher in states receiving more federal money, per tax dollar paid. Belying the popular narrative surrounding so-called “red state socialism,” we find that simple hypocrisy does not explain this paradox—individuals who are likely to benefit from spending tend to support it. But, income is a more powerful predictor of opinion on spending in “taker” states than “giver” states, heightening state-level opposition in the former. There is also more to the story than economic self-interest. Symbolic racism is four times more powerful than income in explaining opposition to spending, and there are more people with such attitudes in states receiving more federal money.
When the House of Representatives delayed voting on a Hurricane Sandy relief bill in January 2013, New Jersey Governor Chris Christie lambasted copartisan speaker John Boehner, arguing that hard-hit states, New Jersey and New York, were “donor states” to the federal coffers and deserved assistance in their own time of need (Mataconis, 2013). 1 This theme resurfaced as he and Rand Paul—two high profile Republican leaders—engaged in a public battle over federal spending in their respective states. Dubbing Christie the “King of Bacon,” the Kentucky senator claimed the New Jersey governor was part of a fiscally reckless group “unwilling to cut the spending, and they’re ‘Gimme, gimme, gimme—give me all my Sandy money now’” (Blake, 2013; Gold, 2013). Christie fired back against Paul’s claim that he was “bankrupting the government,” noting that Kentucky receives $1.51 2 from the federal government for every dollar it contributes in taxes, whereas New Jersey receives only $0.61 (Blake, 2013; Gold, 2013).
This argument revived a popular narrative on so-called “red state socialism,” which also received attention leading up to the 2008 and 2012 presidential elections. 3 In this account, so-called “taker states” (i.e., those receiving more federal funds than they pay in federal taxes) tend to be red states, where voters presumably prefer smaller government and less spending and where the Tea Party has been most politically popular. On the other side, “giver states” (i.e., those paying more in federal taxes than they receive in federal outlays) tend to support Democrats, who presumably promote the kinds of redistributive policies that appear not to benefit these states. The political science literature has noted this pattern as well. Moving beyond the blunt “red state, blue state” and “giver, taker” distinctions, Lacy (2009) finds a positive correlation between Republican vote share and net outlays dating back at least as far as 1984. 4
Now, there is nothing pernicious or even surprising about the existence of “giver” and “taker” states. Reallocation of wealth between people and regions is common practice in liberal democracies. Indeed, the notion that government should mitigate human suffering through redistribution played a key role in the New Deal, which established the modern American state. What is puzzling about contemporary fiscal politics is that the most energetic critiques of federal spending are coming from net beneficiary states. We refer to this correlation between state-level opposition to spending and net receipt of federal outlays as the spending paradox.
Before we investigate this curious correlation, we need to confirm its existence. Thus far, popular and academic accounts of the paradox have used Republican vote share to measure opposition to spending. This is a coarse proxy. Just because someone votes Republican does not mean he is fiscally conservative—many factors go into partisanship and vote choice. If we want to know whether there is a true correlation between opposition to spending and net outlays to states, we should analyze state-level opinion specifically on spending. In doing so, our article provides the first systematic documentation of the federal spending paradox. State-level opposition to federal spending does in fact correlate with net federal outlays to states.
How can we explain this odd relationship? The popular narrative is that individual perversities underlie “red state socialism.” That is, Republicans oppose on principal the very funding on which they depend, while the Democrats they consider profligate spenders pick up the check. Some blame hypocrisy, though others have argued people do not realize how much they benefit from government outlays (Appelbaum & Gebeloff, 2012; Atkins, 2014; Moran, 2012). People might also feel guilty for accepting public benefits and resent the government for providing them (Appelbaum & Gebeloff, 2012).
Although some of these claims may sound compelling, we cannot draw conclusions about individuals from state-level analyses. Just because beneficiary states’ populations oppose spending, on average, does not mean individual beneficiaries do. Gelman, Park, Shor, and Cortina (2008) show, for example, that rich people tend to support Republicans, even though rich states tend to support Democrats. And Lacy (2014) finds that, while people living in taker states were less likely to vote for Obama, whether or not people perceived themselves to be net beneficiaries of government spending was not generally correlated with their presidential vote. In sum, to see whether people truly claim to disapprove of spending from which they benefit, as the popular “red state socialism” narrative suggests, we need to examine the relationship between beneficiary status and opinion on spending (rather than Republican vote choice) at the individual (rather than state) level.
We show that likely beneficiary status is negatively correlated with individuals’ opposition to spending, contra the “red state socialism” narrative. This leads us to a more specific question: If the relationship between opinion on spending and beneficiary status makes sense at the individual level—that is, the more likely one is to benefit from government spending, the more one tends to support it—why is opposition to spending higher in beneficiary states?
We find that the strength of the relationship between beneficiary status and opposition to spending varies across the giver–taker continuum. Income (measuring likely beneficiary status) has a stronger association with opposition to spending in taker states than giver states, raising overall levels of opposition to spending in the former. Thus, the spending paradox is explained in part by differences in the way beneficiary status influences opinion on spending across the giver–taker continuum.
There is also more to the story than economic self-interest. Symbolic factors, like symbolic racism, have been shown to affect opinion across a wide range of issues. We argue that symbolic racism also shapes attitudes on spending writ large, and our empirical analysis supports this claim. Symbolic racism is not only associated with opposition to spending, its relationship to spending is four times stronger than income’s. Because more people express these views in taker states, as our aggregation analysis demonstrates, they contribute to the state-level spending paradox we observe.
Individual Attitudes About Spending
We begin our investigation of the spending paradox by examining known determinants of individual opinion on spending, which fall into two main categories: economic self-interest and symbolic politics.
Economic Self-Interest
Many studies have examined the role of economic self-interest in opinion formation. Essentially, they argue, people run a cost-benefit analysis when deciding whether to support government spending. There is considerable empirical support for this notion. Studies of opinion on specific programs have shown that the most popular programs tend to benefit many people (like Social Security and education), whereas programs targeting smaller groups (like food stamps and welfare) are less popular (Sanders, 1988; Sears & Citrin, 1982).
However, there are limits to what self-interest can explain. In the realm of government expenditures, meaningful cost-benefit analyses are tricky. Unlike market goods and their prices, the relationship between pubic goods and taxes paid is more remote (Birdsall, 1965). Moreover, because citizens cannot pick and choose which government expenditures they wish to pay for, people inevitably pay for some services that do not benefit them, and so, as Downs (1960) observes, “no one ever attains marginal equilibrium” with the government. Misinformation may also distort people’s perceptions of costs and benefits (Citrin, 1979).
On the flip side, empirically, we can see that people sometimes support government programs from which they are unlikely to personally benefit (Mueller, 1963; Sanders, 1988). Some people may perceive a symbolic or collective benefit, if not a material one (Citrin, 1979). Self-interest can be difficult to define, and it is not necessarily the most important factor in people’s evaluations of government spending levels. Their opinions may depend on their perception of how much others benefit, not just their personal cost/benefit calculation (Birdsall, 1965).
Symbolic Politics
Symbolic politics also come into play on fiscal issues. Partisanship and ideology are two classic symbolic factors that we know affect opinion on spending. People take cues from parties in forming their issue positions, particularly on complex matters. Since the New Deal, elite Democrats have supported spending more than elite Republicans, and opinions among the general public reflect this partisan division (e.g., Eismeier, 1982; Mueller, 1963; Sanders, 1988). And, of course, self-identified conservatives are less likely to support government spending than self-identified liberals. On the whole, Jacoby (1994) finds that party identification and ideology match or exceed the predictive power of several specific policy opinions in explaining attitudes about general government spending.
Another symbolic factor associated with opposition to government spending is symbolic racism, a modern form of racial conservatism rooted, in part, in the belief that Blacks get more assistance than they deserve from government (Sears & Henry, 2005, p. 95). 5 Racial attitudes can infiltrate people’s thinking about general government spending in two ways. If people believe that public funding on the whole grants undue benefits to racial minorities (a variation on the belief that minorities “get more than they deserve”), they may be more likely to oppose spending. Symbolic racism could also work indirectly, if people associate general spending with specific programs that symbolic racism is known to influence. 6
Analyzing attitudes about spending at the individual level, Jacoby (1994, 2000) finds support for both mechanisms. Welfare attitudes share the same underlying structure as attitudes about general government spending, whereas opinion on other specific spending programs does not. Thus, he infers that when people are asked a nonspecific question about government spending, they are actually thinking about welfare spending. Jacoby finds a direct effect as well. Symbolic racism is correlated with attitudes on government spending, even after controlling for opinion on specific types of spending, party identification, ideology, and opinion about government waste.
Aggregating Individual Opinion Into State-Level Public Opinion
The relationship between individual and state-level opinion could be straightforward. If there is tension between beneficiary status and opinion on spending at the individual level (i.e., likely beneficiaries are more likely to oppose spending), then adding these individual opinions together could produce a similar tension at the state level (i.e., higher opposition to spending in states with higher spending/tax ratios). Prior work on individual opinion on spending suggests this will not be the case, however. We must then consider reasons why the relationship between individual and state-level opinion might not be straightforward. There are two ways in which a sensible individual-level relationship could become paradoxical at the state level.
First, the distribution of characteristics associated with individual opinion could vary across state populations in a way that would contribute to the paradox. For example, a characteristic associated with greater opposition to spending at the individual level could be more prevalent in taker state populations. This would make opposition to spending relatively higher in taker states than giver states.
Second, the strength of some characteristic’s influence on individual opposition to spending may vary across giver and taker states. One could think about an individual model of opposition to spending as a rough summary of how people weigh their many different and sometimes competing interests to calculate their overall opinion on spending. People might do this the same way everywhere. Given known differences in state political cultures, policy histories, and political economies, however, people probably weigh their interests differently, depending on where they live. The degree to which some individual-level characteristic is political, the degree to which people’s attitudes divide along that cleavage, can be conditioned by these state-to-state differences. If these contextual differences are related to the degree to which states benefit from federal redistribution, then we will find meaningful differences across the giver–taker continuum in how individual characteristics affect attitudes on spending. Such differences would contribute to a paradoxical correlation between opposition to spending and net outlays, if, for example, those in taker (giver) states put more weight on a characteristic positively (negatively) associated with opposition to spending.
These two factors—the distribution of characteristics associated with individual opposition to spending and the strength of their influence on opposition to spending—may be mutually reinforcing or cross-cutting. Gelman et al. (2008) find that these factors operate in a cross-cutting fashion in their study of income and Republican voting, which are positively associated at the individual level and negatively associated at the state level.
Investigating how individual attitudes about spending aggregate to form state-level opinion, we focus on one measure of economic self-interest, income, and one symbolic measure, symbolic racism. Prior work shows that income is positively related to opposition to spending. How, then, might the distribution of income across state populations or the strength of the relationship between income and individual opposition to spending contribute to a positive correlation between state-level opposition to spending and net outlays? If the distribution of income were such that proportionately more wealthy people lived in taker states than giver states, this would raise average opposition to spending in taker states relative to giver states. Based on prior work, however, we know this is unlikely to be the case. Gelman et al. (2008) have shown that there are proportionally more wealthy people in blue states than red states, and Lacy (2009) and Francia and Levine (2006) have shown that taker states tend to be red states. Thus, it is unlikely that the distribution of income across giver and taker states is driving the spending paradox. Indeed, if there are more rich people in giver states than taker states, this would encourage a negative relationship between opposition to spending and net outlays at the state level (i.e., it would be “anti-paradox”). But, the strength of the relationship between income and individual opposition to spending may contribute to the spending paradox—we could find a stronger correlation between income and opposition to spending in taker states than giver states. This is plausible, as income is more strongly associated with Republican voting in poorer states (Gelman et al., 2008). Of course, it is also possible that wealthier people in giver states dislike spending more than wealthier people in taker states, because they may think their money is being redistributed out of state and resent that type of redistribution more than within-state redistribution. Nevertheless, we think it is more likely than not that our findings will parallel those of Gelman et al. (2008). On the whole, we expect the distribution of income and the strength of the effect of income across giver and taker states to act in cross-cutting ways for the spending paradox.
In the case of symbolic racism, we expect that it, like income, is positively related to individual-level opposition to spending. Unlike income, however, we expect that both the distribution of these attitudes and the strength of their relationship with individual opposition to spending will contribute to the spending paradox. Of the 20 states that allowed racial segregation in schools on the eve of Brown v. Board of Education, 17 have been identified as takers in the popular and academic literature on “red state socialism.” 7 Given that legacies of institutionalized racism continue to shape political culture in the contemporary era (Acharya, Blackwell, and Sen, 2016; Elmendorf and Spencer, 2014), we expect that people in taker states might still be more inclined than people in giver states to weigh their racial attitudes more than other interests (e.g., economic self-interest) when they think about spending. In other words, racial attitudes might matter more in taker states than giver states. For similar reasons, we also expect more people to express symbolically racist attitudes in taker states. In sum, we expect the strength of the association between symbolic racism and opposition to spending and the distribution of these attitudes to vary across states in a way that is “pro-paradox.”
Data
Giver and taker states are defined by the amount of money they receive from the federal government relative to the amount they contribute in federal taxes. The ratio of outlays to taxes in giver states is less than 1, whereas the ratio in taker states is greater than 1. We calculate the ratio for each state by dividing mean spending across the years 2001 to 2010 by mean taxes across this period. We refer to this as “the ratio,” “spending/taxes,” and “net outlays.” The ratio ranges from 0.42 in Delaware to 2.91 in New Mexico, and the average is 1.35.
Although we use the language of givers and takers for narrative ease, we are not particularly interested in this binary distinction. Many states have ratios near 1 and change categories over this decade, even though interyear correlations are very high. 8 Category switching can stem from normal interyear fluctuations or changes in economic context. There was a general movement upward in state ratios after the 2008 financial crisis and passage of the American Recovery and Reinvestment Act. We have no theoretical reason to believe there is a more meaningful difference between states with ratios of 0.95 and 1.05 than between those with ratios of 1.05 and 1.15, for example. Thus, we analyze broad variation in the decade mean ratio of spending to taxes rather than comparing the group of givers to the group of takers in any given year.
Our data on federal outlays to states come from the Census Bureau’s Consolidated Federal Funds Report (CFFR) for 2001 through 2010. 9 Data on state tax burdens come from the Internal Revenue Service Databook Table 5, Internal Revenue Gross Collections by State. Total internal revenue collections, or total taxes paid, include corporate income tax, individual income tax, individual employment tax, estate tax, gift tax, and excise tax. The Supplemental Appendix (SI) includes a detailed breakdown of taxes and spending by state in Figures 9 to 15.
We measure opposition to general domestic spending using a question from the 2010 Cooperative Congressional Election Study (CCES), a large nationally representative survey of United States adults conducted by YouGov/Polimetrix (Ansolabehere, 2010).
10
The exact wording for our primary question of interest was as follows:
The federal budget is approximately $600 billion this year. If the Congress were to balance the budget it would have to consider cutting defense spending, cutting domestic spending (such as Medicare or Social Security), or raising taxes to cover the deficit. What would you most prefer that Congress do—cut domestic spending, cut defense spending, or raise taxes? We generated an indicator variable measuring support for cutting domestic spending, coded 1 if people chose this option. To be clear, we are measuring support for cutting domestic spending, as opposed to cutting defense spending or raising taxes in an effort to reduce the deficit.
11
To measure symbolic racism, we use the two standard racial resentment questions that are available on the 2010 CCES. The first asks people to place themselves on a 5-point scale, ranging from strongly agree to strongly disagree in response to the following question: “The Irish, Italians, Jews and many other minorities overcame prejudice and worked their way up. Blacks should do the same without any special favors.” The second question asks people to place themselves on the same 5-point scale in response to the following question: “Generations of slavery and discrimination have created conditions that make it difficult for Blacks to work their way out of the lower class.” We recoded the first variable so that higher values indicate higher levels of symbolic racism on both questions. We then combined answers to these questions into a symbolic racism index, which ranges from 2 to 10.
Additional variables are sex, race, age, education, income, ideology, party identification, Tea Party support, disability status, unemployment status, and receipt of government health insurance. Summary statistics for survey variables, as well as net outlays, are available in the SI in Table 2.
Estimating State-Level Opinion
Like most surveys, the CCES uses samples that are representative at the national level, but not the state level. To calculate opinion by state, we use a two-stage technique called multilevel regression and poststratification (MRP), developed by Gelman and Little (1997) and refined by Park, Gelman, and Bafumi (2004) and Lax and Phillips (2009, 2013), using the mrp package in R (Gelman, Malecki, Lee, & Su, 2014).
First, we estimate a multilevel model of individual opinion on spending as a function of respondent demographic characteristics and state characteristics. From this model, we can predict the likelihood that a particular type of respondent living in a particular state would want to cut domestic spending. For narrative ease, we refer to this as opposition to spending. By partially pooling respondents across states and explicitly modeling the hierarchical structure of the data, the multilevel model allows us to use all the information about each demographic variable in the data to learn about the association between that variable and the survey response.
Specifically, we model the probability of opposing spending as a function of demographic categories: gender (g = male, female), race (r = Black, Hispanic, White/other), age (a = 18-29, 30-44, 45-64, 65+), education (e = less than high school, high school degree, some college, college degree, and postgraduate degree), and income (i = less than $20,000, $20,000-$40,000, $40,000-$75,000, $75,000-$150,000, $150,000 or more), plus state (50 states and the District of Columbia, indexed by s). This allows us to estimate survey responses for 30,600 different demographic–geographic types (indexed by c). The model is

Each demographic characteristic (

For state modeled effects, we allow the mean to be a function of a measure of state-level public opinion liberalism (ideology):

One can think of state modeled effects as a corrective for what a purely demographic model would predict about opinion. They account for the possibility that people’s preferences are influenced not only by their personal demographic characteristics but also by their surroundings. An average White woman aged 18 to 29 years with a high school diploma making $20,000 to $40,000 in Connecticut may have different preferences on spending than a woman with the same personal demographic characteristics living in Louisiana, for example. State modeled effects can be a function of any number of state characteristics (e.g., presidential vote, region, etc.). Lax and Phillips (2013) show that using one state-level predictor is sufficient to produce accurate state-level estimates, and their demographically purged state predictor of opinion liberalism (DPSP) performs best. 12
Estimating the individual model in Stage 1 allows us to determine the predicted level of opposition to spending for each of the 30,600 demographic–geographic types created by our model (e.g., the probability that a Black man from New York aged 30-44 with a college degree making $75,000-$150,000 will oppose spending). In the second stage, poststratification, we use these predictions to estimate the level of opposition to each type of spending at the state level. We do so by weighting the predicted opposition for each demographic–geographic type (

Several studies have demonstrated MRP’s accuracy in estimating state and even congressional district-level opinion (Lax & Phillips, 2009, 2013; Park et al., 2004; Warshaw & Rodden, 2012). 13
Demonstrating the Spending Paradox
Figure 1 summarizes our estimates of state-level opposition to domestic spending in 2010. States labeled in gray (black) supported John McCain (Barack Obama) in the 2008 presidential election. The dotted vertical line marks the national average response, and the light gray horizontal lines indicate 95% confidence intervals for the estimates. 14
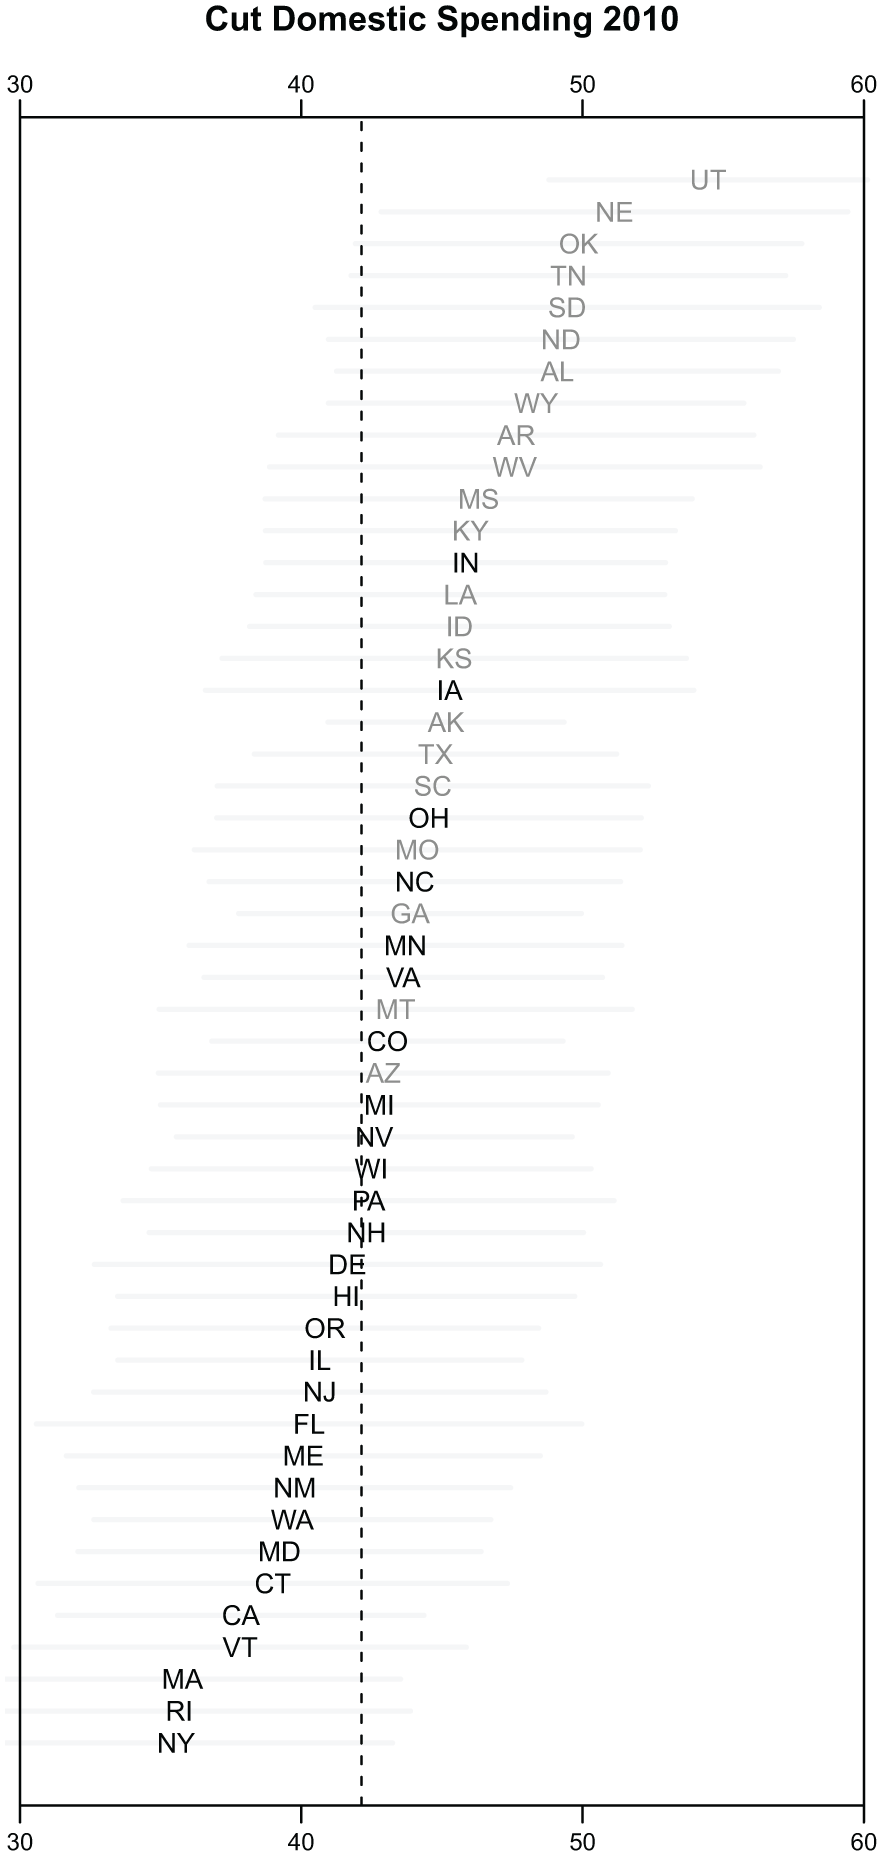
Opposition to spending by state.
There is substantial variation across states, with opposition to spending ranging from 36% in New York to 54% in Utah. While opposition to spending is correlated with Republican presidential vote share, the party sort is not perfect. 15 This underscores the point that Republican vote share is a rough substitute for opinion. Because national parties bundle issues in ways that pose dilemmas for individuals with cross-cutting preferences, a Republican vote does not necessarily suggest fiscal conservatism. In analyzing the spending paradox, it is therefore important to use measures of state-level opinion rather than partisan proxies.
To confirm the paradox, we plot opposition to spending against the ratio of outlays to taxes in Figure 2. 16 The relationship is indeed positive. An increase of 10 percentage points in opposition to spending is associated with an additional $0.37 in outlays per tax dollar. 17 For a state with an average tax burden, this is equivalent to $17.1 billion in outlays from the federal government.

The spending paradox.
In sum, we find there is in fact a spending paradox at the state level. 18 The question now is, why? We begin our inquiry by examining determinants of opposition to spending at the individual level and proceed to show how key characteristics aggregate to the state level.
Opposition to Spending at the Individual Level
Although it might seem obvious that people who are more likely to benefit from federal spending would be more likely to support it, popular narratives on “red state socialism” suggest that people oppose spending in a hypocritical or irrational way. We examine the role of self-interest by looking at income, employment status, disability status, and reported receipt of government health insurance (Medicaid or Medicare). 19 We also consider symbolic factors that could draw people away from their economic self-interest.
We begin with a logit, modeling desire to cut domestic spending as a function of demographic characteristics (sex, age, race, education, and income), as well as the aforementioned measures of economic self-interest, partisanship, ideology, and symbolic racism. 20 Results are displayed in Figure 3. For continuous variables, we subtracted the mean and divided by two standard deviations to facilitate comparison of their coefficients with each other and with those on binary variables (Gelman & Hill, 2007, p. 57). Thus, the unit for the continuous variables is two standard deviations.
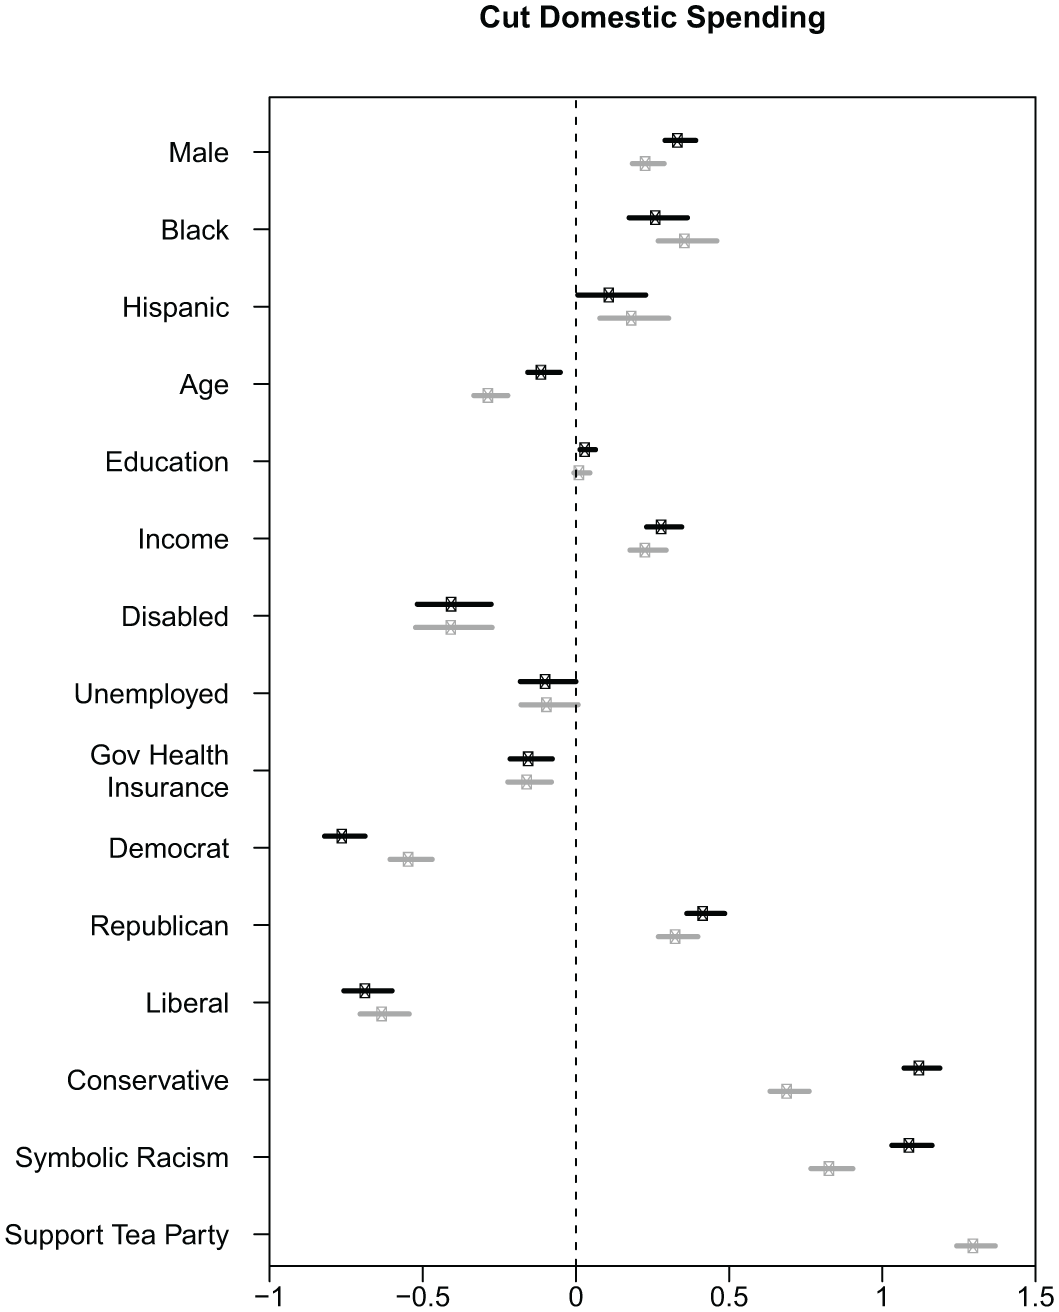
Coefficient plot.
The coefficients from Model 1 (represented by black dots) show that wealthier people are more likely to want to cut spending. 21 This makes sense because they likely benefit less from spending. We also find sensible correlations between support for spending and our other measures of self-interest: unemployment, disability, and having government health insurance. As expected, Republicans and conservatives are much more likely to want to cut spending than independents and moderates, whereas Democrats and liberals are much less so.
We turn now to evaluate our theory that symbolic racism conditions people’s thinking about government spending. As hypothesized, symbolic racism is associated with greater opposition to spending, even controlling for party, ideology, and several measures of economic self-interest. 22 The size of the association, relative to other factors, is striking—racial resentment has a more powerful influence on attitudes about spending than every other factor except conservatism. Notably, symbolic racism is 4 times as powerful as income when it comes to attitudes on spending. It is also much larger than the other measures of self-interest, like unemployment. 23
Some scholars have argued that conservatism could lead people to offer what appear to be “racially resentful” answers to questions intended to measure symbolic racism, even if they harbor no negative attitudes toward African Americans as a group (e.g., Hurwitz & Peffley, 1998; Sniderman & Tetlock, 1986). To account more richly for ideology, we run another logit model, adding Tea Party support. 24 As Model 2 (represented by gray dots) demonstrates, racial resentment is still statistically and substantively significant, remaining more than 3 times as powerful as income. Our racial resentment variable appears to be measuring something distinct from general ideology and conservatism specifically related to spending, and it is powerfully associated with fiscal attitudes. This is a strong finding, as Barreto, Cooper, Gonzalez, Parker, and Towler (2011) and Williamson, Skocpol, and Coggin (2011) find that racial attitudes are also related to Tea Party support. 25
Aggregating to the State Level
Having shown that economic self-interest and symbolic politics both contribute to opposition to spending at the individual level, we now examine the dynamics of their aggregation to electorally relevant “public opinion” at the state level. As explained earlier, the distribution of these characteristics across state populations could vary across the giver–taker continuum. The strength of their associations with opposition to spending could also vary across giver and taker states. For this part of the analysis, we focus on one measure of economic self-interest, income, and one symbolic factor, symbolic racism.
Aggregating Income
We begin our aggregation analysis by examining the distribution of income across giver and taker states. The top left-hand graph in Figure 4 shows the percentage of people in each state with incomes below $20,000 on the x-axis, and the top right-hand graph shows the percentage with incomes above $150,000. The ratio of spending to taxes is plotted on the y-axis in both graphs. 26 These graphs show that giver states have a larger proportion of high income people (who are more likely to oppose spending) and a smaller proportion of low income people (who are less likely to oppose spending). Thus, the distribution of income across giver and taker states does not contribute to the spending paradox we observe.
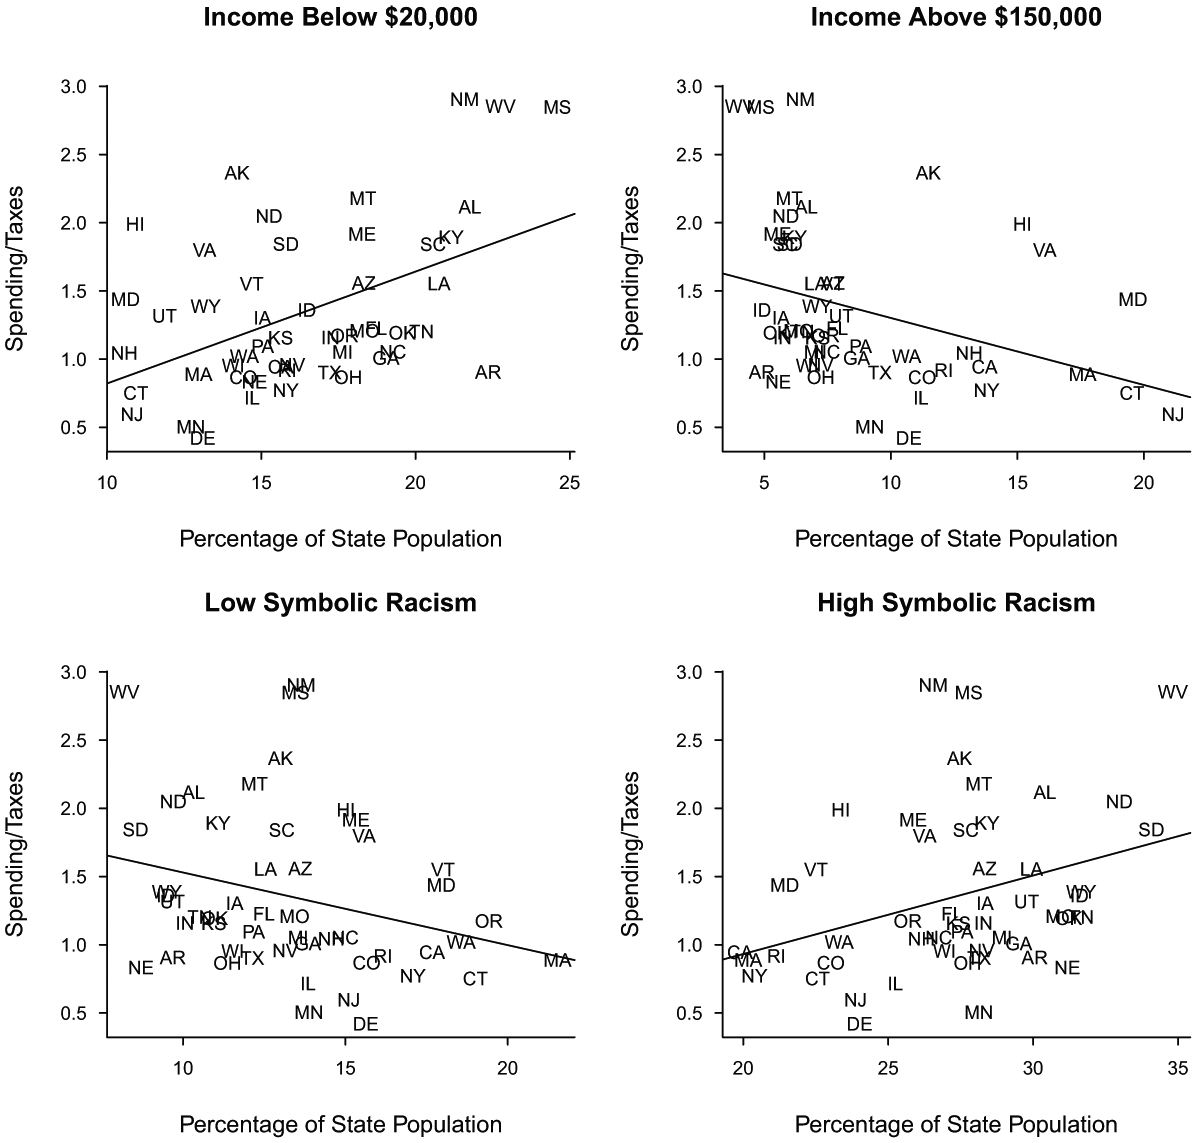
Distribution of income and symbolic racism across state populations.
However, the strength of income’s association with opposition to spending does vary across giver and taker states in a way that contributes to the spending paradox. We come to this conclusion by using a multilevel model of individual opposition to spending. The multilevel model allows us to estimate not just one coefficient on income, but 50 coefficients—one for each state. This permits income to have a different relationship with individual opposition to spending in different states. That is, income may strongly predict the likelihood of opposing spending for residents of state A, while only weakly predicting attitudes about spending among residents of state B. The model also allows us to specify that those 50 coefficients on income are a function of some state-level characteristic of interest. Here, of course, that would be the ratio of spending to taxes. Thus, we can see whether higher income residents drive up opposition to spending more in taker states than in giver states, contributing to the spending paradox.
The model predicts opposition to spending for an individual (i) in a state (s) as a function of the variables in Model 1, plus state net outlays. We call this Model 3:

We allow the coefficient on income to vary by state net outlays, so we can see if income has a stronger association with individual opinion on spending in states with higher spending/tax ratios. In this model,


First, we look at the signs of each of our 50 estimated coefficients on income, graphed on the y-axis in the left-hand panel of Figure 5. We find that the relationship between income and an individual’s likelihood of opposing spending is positive in almost every state. That is, higher income people are more likely to oppose spending nearly everywhere, consistent with existing literature on individual-level opinion. However, this relationship varies widely across states, from a high of 0.49 in Louisiana to a low of −0.15 in Utah. This variation illustrates the power of state-level political context on individual-level opinion and the advantages of using multilevel models to understand public attitudes. A standard individual model of opposition to spending masks the degree to which conflict across income groups varies in intensity across the states.
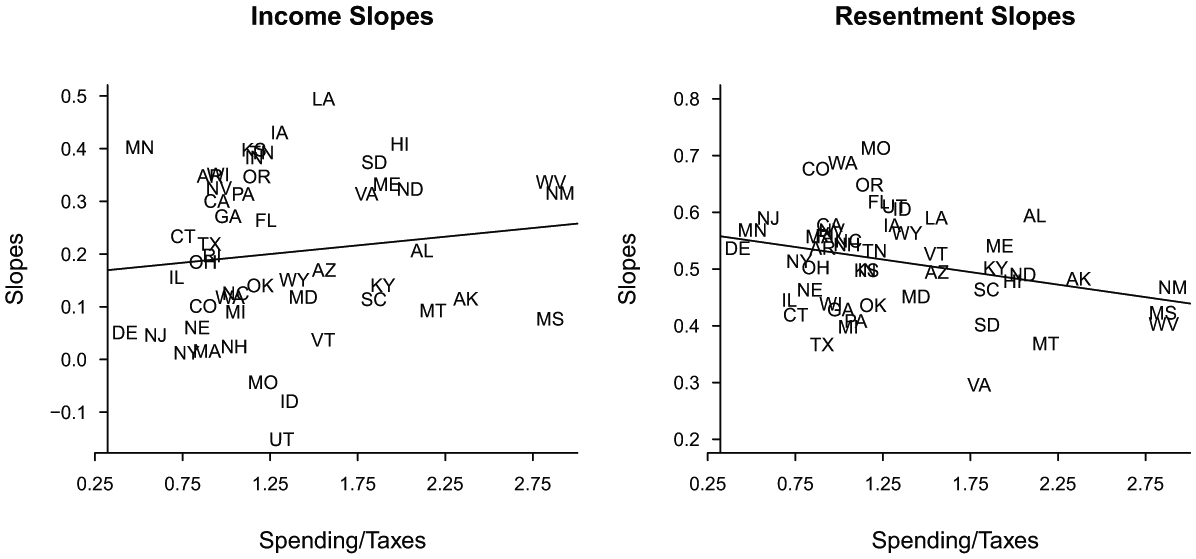
Slopes for income and racial resentment.
The strength of the association between income and individual opposition to spending also varies across the giver–taker continuum. The left-hand graph in Figure 5 plots the slope on income for each state on the y-axis against net outlays on the x-axis. The solid black line shows the linear relationship (characterized by Equation 3a), which is positive and statistically significant. Income has stronger relationship with attitudes about spending in taker states than giver states, though the difference is not large. 27 Consider, for example, the relationship between income and opposition to spending in Alabama (which lies around the 75th percentile of taker states) versus New York (which lies around the 75th percentile of giver states). The slope on income in Alabama is 0.21, compared with 0.01 in New York. This means that a two standard deviation increase in income in Alabama corresponds to (at most) a 5 percentage point increase in the probability that a person opposes spending, while the same difference in income has almost no impact on the likelihood that a person opposes spending in New York. 28
To summarize, the distribution of income across state populations pulls against a paradoxical correlation between state-level opposition to spending and net outlays. There are more rich people in giver states than taker states and more poor people in taker states than giver states. However, the strength of the association between income and opinion on spending varies across states in a way that contributes to the spending paradox. People with higher incomes are more likely to oppose spending in almost every state, but this is particularly true in taker states. The strength of this association drives up opposition to spending in taker states relative to giver states.
Aggregating Symbolic Racism
Symbolic racism also contributes to the state-level paradox we document, but in the opposite way as income. Whereas the distribution of income across state populations mitigates the spending paradox, the distribution of symbolic racism exacerbates it. The bottom left-hand graph in Figure 4 plots the percentage of people in the lowest two categories of symbolic racism on the x-axis and the ratio of spending to taxes on the y-axis. The bottom right-hand graph plots the percentage of people in the highest category of symbolic racism on the x-axis against the ratio of spending to taxes on the y-axis. 29 The negative slope in the left-hand graph shows that people with low symbolic racism scores make up a smaller percentage of taker state populations than giver state populations, while the positive slope in the right-hand graph shows that people with high symbolic racism scores constitute a larger percentage of taker state populations than giver state populations. These relationships are statistically significant. 30 Recall from the individual analysis that symbolic racism is a very powerful predictor of opposition to spending, 4 times as strong as income. This makes the distribution of symbolic racism across state populations an important driver of the paradoxical correlation between state-level opposition to spending and net outlays. But for these attitudes, opposition to spending in taker states would be lower.
To analyze cross-state variation in the strength of the relationship between symbolic racism and individual opposition to spending, we run another multilevel model (Model 4) that is the same as Model 3, except instead of allowing the coefficient on income to vary by state ratio of outlays to taxes, we allow the coefficient on symbolic racism to vary in this manner. That is, we estimate 50 coefficients on symbolic racism, one for each state, centered on each state’s net outlays. The right-hand graph in Figure 5 plots the coefficient of symbolic racism on an individual’s likelihood of opposing spending for each state, from Model 4, against the ratio of spending to taxes. Again, the multilevel model reveals a richer picture of the relationship between racial resentment and attitudes on spending than a standard model could. Symbolic racism is associated with opposition to spending in every state, but the coefficients vary from a high of 0.71 in Missouri to a low of 0.30 in Virginia.
The association between symbolic racism and opinion on spending is different in giver and taker states, but not in the way we expected. 31 The relationship between the slopes on symbolic racism and the ratio of spending to taxes is actually negative. That is, symbolic racism is a less powerful predictor of opposition to spending in taker states than giver states. Consider, for example, the difference between New Jersey and Mississippi. The slope for New Jersey is 0.59, so a two standard deviation increase in symbolic racism is associated with an approximately 15 percentage point increase in the likely of opposing spending. In contrast, the same size increase in symbolic racism is associated with an approximately 11 percentage point increase in the likelihood that a Mississippi resident opposes spending. Whereas the distribution of people expressing racially resentful attitudes heightens the spending paradox, the strength of the relationship across giver and taker states lessens it. In sum, racially resentful attitudes have a weaker impact on attitudes about spending for residents of taker states than for those in giver states, but there are disproportionately more people expressing racially resentful attitudes in taker states.
Conclusions and Next Steps
We offer the first systematic documentation of an important puzzle in contemporary American politics: that opposition to federal spending is higher in states receiving more federal money, per tax dollar paid. We begin our investigation of this spending paradox by showing that a combination of rational cost/benefit thinking and symbolic politics influence individuals’ attitudes about spending. Contrary to the popular narrative, but consistent with prior academic work at the individual level, opinion on spending is not completely nonsensical—the more people are likely to benefit, the more they tend to support spending. However, there is more to opinion on spending than economic self-interest. Symbolic racism is 4 times as powerful as income in explaining opposition to spending. While fiscal politics are often defined in opposition to social politics, we show that fiscal issues are not beyond the reach of illiberal social forces like racial resentment. These findings underscore the troubling and enduring power of racial attitudes in American political life.
Our individual-level results are consistent with prior work. It is well established in the academic literature that economic self-interest and racial attitudes shape people’s opinions about all kinds of issues, including government spending. However, there is only so much we can learn about fiscal politics from individual-level analyses. Individual opinion does not affect lawmaking—public opinion affects lawmaking. And, as we show, individual and public opinion are not the same thing.
Analyzing the path from individual to public opinion reveals important and surprising insights. We find, in the case of income, there are more affluent people in giver states than taker states, and affluent people are more likely to oppose spending. Therefore, the distribution of income across states does not help to explain the spending paradox. But, affluent people in taker states are even more likely to oppose spending than affluent people in giver states, where, in some cases, income plays almost no role in shaping spending attitudes. In the case of symbolic racism, we find the reverse. It is the distribution of people expressing this set of attitudes across giver and taker states that contributes to the spending paradox. People are more likely to express racially resentful attitudes in taker states, and these people are more likely to oppose spending.
Our analysis reveals new puzzles in the realm of public opinion and fiscal politics. Why does symbolic racism so powerfully shape attitudes about spending? A large percentage of federal spending goes toward popular universalistic programs like Social Security and Medicare, suggesting that public notions of spending should be relatively race-neutral. But, perhaps many people think federal money is generally distributed in a way that favors particular racial groups over others. This is an important subject for future research.
Variation across states in the strength of the relationship between income and symbolic racism and spending attitudes also raises questions. Why are rich people in taker states so conservative on spending, relative to those in giver states? Why does racial resentment matter less in taker states, many of which have strong legacies of institutionalized racism? The latter question is particularly curious, as it is counterintuitive. We expected to find that symbolic racism would matter more in taker states, as many are former Jim Crow states. Of course, racial discrimination was common in states outside the south as well. It is possible that racial resentment evokes different images in different regions, and that those in giver states are tied more closely to spending. It is also possible that large minority populations in taker states are dampening the effect of racial resentment on spending among Whites in statewide analyses. 32
Although we know a lot about how individual attributes affect political attitudes, we need to learn more about how people’s political environments affect how they weigh their many different interests in formulating opinions on important issues. The next frontier in public opinion research is to put people in their place, geographically. States have different populations and different politics. Both affect how individual opinion translates to electorally relevant public opinion.
Footnotes
Acknowledgements
Many thanks to Jeffrey Lax, Robert Erikson, Steven Greene, Benjamin Highton, Seth Hill, Nancy Hirschmann, Ira Katznelson, Mike Malecki, Justin Phillips, Craig Volden, Antje Schwennicke, Jeff Segal, Bob Shapiro, Rogers Smith, Deborah Beim, Vesla Weaver, William McBride at the Tax Foundation, our anonymous reviewers, and participants at the Emory Conference on Institutions and Lawmaking, the Congress and History Conference at Vanderbilt University, and the Workshop on American Politics at the Ohio State University for their valuable advice and assistance with this project. Special thanks to Samuel Clark-Clough for outstanding research assistance.
Declaration of Conflicting Interests
The author(s) declared no potential conflicts of interest with respect to the research, authorship, and/or publication of this article.
Funding
The author(s) received no financial support for the research, authorship, and/or publication of this article.
Supplemental Material
Supplementary material is available for this article online.