




Abstract
Well established in the literature is that social context, like the racial or partisan composition of neighborhoods, affects individual political behavior. Less understood is how the design of neighborhoods may also influence these behaviors. This article seeks to improve how physical context is measured and to examine how the built environment subsequently affects individual political participation. Using a nationally representative survey with measures of the frequency of neighbor interaction and individual voter turnout and to which I merged respondents’ census tract information and then used Google Maps images to code respondents’ neighborhood design features, I show how the physical structure of residential places—whether homes have porches, streets are tree-lined, neighborhoods have natural gathering places—promotes neighborly exchanges that subsequently affect individual voter turnout.
Introduction
That residential context affects individual political behavior is well established in the literature. Previous research shows that the sociodemographic composition and the partisan/ideological diversity of neighborhoods influence political participation (Cho, Gimpel, & Dyck, 2006; Costa & Kahn, 2003; Enos, 2016, 2018; McClurg, 2006; Mutz, 2002a, 2002b; Oliver, 2001). Less understood is how the physical composition (i.e., the built environment) might also impact political participation. I want to better understand how, in addition to social context, the physical characteristics of neighborhoods affect political behavior.
The notion that the built environment might also affect political behavior is not new. In 1961, Jane Jacobs described the typical urban neighborhood as a place where neighbors knew each other’s names, talked on street corners, and bumped into each other at the local delicatessen. For Jacobs, and many scholars who followed (Calthorpe & Fulton, 2001; Duany & Plater-Zyberk, 1995; Duany, Plater-Zyberk, & Speck, 2000; Jackson, 1985; Kennedy, 1978; Kohn, 2004; Leydon, 2003; Lofland, 1998; Oldenburg, 1999; Oliver, 2001; Putnam, 2000), these unplanned social interactions between neighbors played an integral role in influencing individual political behavior, because these encounters on city streets helped develop an individual’s desire to engage in community life (Jacobs, 1961). Central to Jacobs’s description of why these unplanned interactions took place was the physical characteristics of these neighborhoods.
Social scientists have begun testing these claims about physical context, but the research has had design limitations. Past studies have relied on measures at high levels of aggregation, like city, despite the fact that neighborhood design may vary greatly within these larger geographic areas (Oliver, 2001). Measures for design, like the percentage of a census tract commuting, have also been used to try and capture the physical characteristics of neighborhood, but these measures present potential problems of measurement error (Hopkins & Williamson, 2012; Oliver, 2001, 2003). And although past studies assert that the reason neighborhood design affects participation is because it influences talk between neighbors, studies have lacked measurement of this neighborly contact they claim happens between design and participation (Duany & Plater-Zyberk, 1995; Duany et al., 2000; Hopkins & Williamson, 2012; Jackson, 1985; Oliver, 2001).
This article attempts to improve how physical context is measured and to test the claims of previous scholars that neighborly contact mediates the effects of neighborhood design and individual participation. It begins with a nationally representative survey with measures of the frequency of neighbor interaction and individual participation. To the survey, I merged respondents’ census tract information and then used Google Maps images to code respondents’ neighborhood design features. With it, I test whether or not neighborhoods with interactive design characteristics—sidewalks, front porches, tree-lined streets, and so on—help increase neighborly contacts and whether or not the consequence of these contacts is increased individual participation. In the following sections, I discuss the important role that both neighborhoods and neighbors play in influencing individual political participation. I then spend time describing my methods and testing my hypothesis. I find evidence that individuals living in neighborhoods with more interactive design features speak to their neighbors more frequently and are, therefore, more likely to vote. I conclude by discussing the significance of these findings.
Theoretical Framework
The relationship between place and individual political behavior is well established. Previous scholarship has demonstrated, for example, that under certain conditions, neighborhood racial diversity can either mobilize or depress turnout (Cho et al., 2006; Costa & Kahn, 2003; Enos, 2016, 2018; Oliver, 2001). Similarly, scholars have shown that partisan status, whether an individual’s partisan identity aligns or conflicts with the majority of her neighbors, can also impact civic engagement (McClurg, 2006; Mutz, 2002a, 2002b). The focus of this article, however, is on what role the physical characteristics of place play, in addition to these important social contextual measures, in affecting individual political participation.
Neighborhood Design and Neighbors Why They Matter
Critics and scholars claim that neighborhood design matters because it can either facilitate or hinder interaction between residents. Design facilitates interaction when it increases opportunities for contact between neighbors and these opportunities are thought to arise in environments that are more walkable and that have more public or shared space (Duany et al., 2000; Jackson, 1985; Jacobs, 1961; Kennedy, 1978; Leydon, 2003; Oldenburg, 1999; Oliver, 2001; Putnam, 2000). A walkable design is one that is pedestrian-centered, meaning streets are narrower, gridded, and tree-lined (Duany et al., 2000; Jackson, 1985; Jacobs, 1961; Kennedy, 1978; Kohn, 2004; Leydon, 2003; Lofland, 1998). In contrast, neighborhoods with wider streets and cul-de-sacs are thought to decrease walking, which then reduces opportunities for contact between neighbors (Duany et al., 2000; Jackson, 1985; Oliver, 2001). In addition, neighborhood designs that provide their residents with public or shared space are thought to help increase contact between neighbors. These spaces can come in the shape of front porches, low-fenced front yards, or stoops. These types of spaces help facilitate interaction because they provide residents with places to go that are public, even when they are on private property (Abu-Ghazzeh, 1999; Fleming, Baum, & Stinger, 1985; Fox, Fox, & Marans, 1980; Skjaeveland & Garling, 1997). On the contrary, neighborhoods designed to maximize privacy limit opportunities for residents to come into contact with their neighbors. Features like private backyards and garage-dominated facades are all thought to reduce the likelihood that neighbors interact simply because they diminish opportunities for neighbors to see one another (Duany et al., 2000; Jackson, 1985; Oliver, 2001). For this reason, neighborhoods with more interactive design features are thought to increase neighbor interaction.
Scholars have demonstrated that these neighborly contacts help provide individuals with basic political information, which reduces the cost of participation and increases the likelihood that an individual does politically act (Downs, 1957; Erikson, 2003; Huckfeldt, 2001; Huckfeldt & Sprague, 1995; McClurg, 2003; Mutz, 2002a, 2002b; Rosenstone & Hansen, 1993). In addition, interaction with neighbors can teach individuals that political participation is a socially desirable behavior, creating pressure to adhere to the social norm, which encourages individuals to participate (Abrams, Iversen, & Soskice, 2010; Cho, 1999; Huckfeldt, 1979; Huckfeldt, 1984; Huckfeldt & Sprague, 1995; McClurg, 2003; Rosenstone & Hansen, 1993; Verba, Schlozman, & Brady, 1995). These neighbor-to-neighbor networks also serve as sources of mobilization, because through them individuals are invited to get involved (Gimpel, Dyck, & Shaw, 2004; Huckfeldt, 1979, 1986, 2001; Huckfeldt & Sprague, 1995; Leighley & Vedlitz, 1999; Mutz, 2002a, 2002b; Putnam, 2000; Rosenstone & Hansen, 1993; Stoloff, Glanville, & Bienenstock, 1999; Verba et al., 1995).
This previous scholarship reveals that neighborly interactions have the power to influence individual political participation. The evidence that design can lead to these neighbor-to-neighbor contacts, however, has lacked empirical study. Do the physical characteristics of place affect the frequency of contact between neighbors? Will these neighborly interactions affect individual participation? To answer these questions, I created a research design that attempts to improve how these neighborhood characteristics are measured and to examine how the built environment may influence neighbor contact and subsequently individual voter turnout.
Data and Methods
To test these claims, my study begins with the Social Capital Benchmark Survey (SCBS)—a nationally representative survey, conducted in 2000. The survey contains 29,724 respondents coming from 4,848 census tract. For this initial phase of my study, I am using 8,092 respondents from 837 randomly selected census tracts. The SCBS provides measures of frequency of contact with a respondent’s neighbors, self-reported participation, and identifies each respondent’s census tract. I matched census tract data from the 2000 U.S. Census to the SCBS. Finally, because I knew each respondent’s census tract, I was also able to code specific neighborhood design characteristics at the census tract level. 1
Key Independent Variable
The “neighborhood design characteristics” variable is the key independent variable in my analysis and measures the presence or absence of interactive design features at the census tract level. For each respondent, I coded specific design features that are believed to either foster or inhibit interaction between neighbors using Google Maps Images. My procedure is as follows 2 :
I first acquired the census tract map for each randomly selected census tract and located each in Google Maps (see Image 1 in the Online Appendix). Next, four geographic points were randomly selected in each census tract. The random selection of each point is completed as follows: (a) Two numbers are randomly assigned from a scale of 0-1 to create an ordered pair or coordinates on a graph. The first number refers to the horizontal position on the x-axis. The second number refers to the vertical position on the y-axis. (b) An xy-axes is laid on top of each census tract, where the x-axis runs across the base of the tract and the y-axis runs vertically from the base to the top of the tract (see Image 2 in the Online Appendix). (c) Using the randomly assigned coordinates, the point is plotted using the xy-axes and a random location is selected for coding (see Image 3 in the Online Appendix). At each point, the architectural features variables were coded (described in detail below). The recorded scores for each variable were then averaged across the four points to create a mean measure for each feature at the census tract level (i.e., an average porch score, etc.). At each randomly selected point, I would enter the “street view” feature in Google Maps, which allowed me to virtually walk the randomly selected street.
After entering the street view of each randomly selected point, I would spin the Google camera 360°, allowing me to observe the architectural features of the selected street (see Image 4 in the Online Appendix). I then coded the following features as present (coded 1) or absent (coded 0) at each selected point: sidewalks, tree-lined streets, porches, fenced front yards, attached garages, cul-de-sacs, hills, and private front entrances. The presence of sidewalks, tree-lined streets, porches, and fenced front yards in a neighborhood are believed to increase interactions between neighbors and are considered to be “interactive characteristics.” The presence of attached garages, cul-de-sacs, hills, and private front entrances are believed to inhibit interactions between neighbors and are considered to be “isolating characteristics”
To calculate the overall “neighborhood design characteristics” variable, I subtracted the average number of “isolating characteristics” for each census tract from the average number of “interactive characteristics.” I then scaled the variable from 0-1, where a 0 indicates that a neighborhood has only isolating characteristics and a 1 indicates that a neighborhood has only interactive characteristics. 3 This variable is summarized in Table 1.
Summary of Key Independent, Dependent, and Control Variables.

Note. The “neighborhood design characteristics” variable is measured at the census tract level. All dependent variables are measured at the individual level and come from the Social Capital Benchmark Survey. Tract-level variables come from the U.S. Census. Individual-level variables come from the Social Capital Benchmark Survey.
Dependent Variables
My analysis proceeds in two stages. In the first, I regress the SCBS measure of talking to one’s neighbors on my measure of neighborhood design characteristics and controls. This regression will demonstrate the impact of neighborhood characteristics on a variable I will call “neighbor talk.” The coefficients will be used to build an instrumental measure of Neighborly Talk for the second stage of my analysis. As an instrument, this variable will be purged of measurement error and serve as a predictor of voter turnout.
Neighbor talk
The neighbor talk variable measures how frequently neighbors talk at the individual level. In the SCBS, respondents were asked, “How often do you talk with or visit your immediate neighbors?” They were then given the following options: (a) never, (b) once a year or less, (c) several times a year, (d) once a month, (e) several times a month, (f) several times a week, and (g) just about everyday. I scaled the variable from 0-1 and it is summarized in Table 1. This variable will serve as the dependent variable in the first stage of the regression analysis.
Voter turnout
The dependent variable in the second stage of analysis is self-reported turnout from the SCBS. Respondents were asked whether or not they voted in the 1996 Presidential Election and were prompted to answer yes (1) or no (0). This variable is summarized in Table 1.
Control Variables
As neighborhood design characteristics are correlated with other variables, both at the census tract and individual level, I need to control for them. By using multivariate analysis, I will be able to parse out the variance in my outcomes that come from design features from those that come from other contextual effects, or from the individual characteristics of respondents. For this reason, my models will include both tract- and individual-level controls.
Tract-level control variables
At the census tract level, I control for several contextual variables that are linked to design, neighbor conversation, and voter turnout. I control for the tract’s economic diversity, racial diversity, median household income, percentage of residents with a bachelor’s degree, percent Black, percent Latino, percent Asian, and percent noncitizen. 4 These variables are summarized in Table 1.
I also control for three tract-level variables that have been used in past research to measure neighborhood design features and which have also been shown to affect individual political participation. The first is the percentage of tract residents commuting alone, which is available in the 2000 Census data. Past studies argue that this variable is a measure for the walkability of a neighborhood, assuming that neighborhoods where more residents are commuting are more car-centered (Hopkins & Williamson, 2012). The second is population density, measured as the logged number of people in each census tract. Past literature has shown that there is an inverse relationship between neighborhood population density and political participation (Hopkins & Williamson, 2012; Oliver, 2001). The final variable is the percentage of homes in a tract that were built before 1940. Past studies have used this variable as a measure for architectural features of homes. New Urbanists argue that neighborhoods built prior to the postwar housing boom (late 1940s early 1950s) possessed features that increased contact between neighbors (Hopkins & Williamson, 2012; Jackson, 1985; Jacobs, 1961; Oliver, 2001, 2003). All three are summarized in Table 1.
Individual-level controls
I control for the standard battery of individual-level characteristics. These include income, education, race, citizenship, gender, and age (see Table 1). Beyond these, I also include controls for length of residency in one’s neighborhood, homeownership, commute time, and metropolitan area status. 5 All have been shown to affect individual political participation (Oliver, 2001). I also include controls for membership in a church/synagogue and membership in a neighborhood group. 6 Memberships in these types of community organizations have been shown to increase civic engagement (Verba et al., 1995). Finally, I control for two attitudinal measures, a respondent’s ideology and interest in politics. These are included to minimize concerns of selection bias. Selection bias occurs in studies of contextual effects, because it is possible that people have an underlying characteristic that affects where they decide to live, their predisposition to socialize with the people around them, and their propensity to participate in politics. By controlling for these attitudinal measures, I hope to minimize the effects of selection bias on my outcomes. All of these variables are summarized in Table 1.
Results
In this section, I use a two-stage regression model. In the first-stage, I use a multilevel linear regression that tests what effect neighborhood design characteristics have on the frequency of neighbor interaction. In the second stage, I use a multilevel logistic regression to test what effect predicted neighbor interaction (calculated in the first stage) has on individual voter turnout.
First-Stage Regression Results
What follows are the results from the first-stage analysis. In this stage, “neighbor talk” is my dependent variable and “neighborhood design characteristics” is my key independent variable. My model includes a large complement of individual and aggregate controls. I begin by running a multilevel linear regression to see what effect “neighborhood design” has on “neighbor talk” while controlling for both individual- and tract-level controls. I then run a second multilevel regression that includes a series of interactions between individual- and tract-level measures. The purpose of these interactions is to test whether or not the effects of “neighborhood design” on “neighbor talk” will hold once accounting for individual status in one’s neighborhood. Previous scholars have established that the effect of individual status—whether one is a racial/ethnic, socioeconomic, or partisan minority in their neighborhood—is an important predictor of individual political behavior (Cho et al., 2006; Costa & Kahn, 2003; Enos, 2016, 2018; McClurg, 2006; Mutz 2002a, 2002b; Oliver, 2001). The inclusion of these interactions in the second model helps me observe whether the effect of the physical characteristics of neighborhoods on neighbor talk is separate and distinct from the effects of the social characteristics of neighborhoods. In both regressions, I cluster the standard errors by census tract because my key independent variable is measured at the tract level. Recall that if “interactive design” features—front porches, sidewalks, tree-lined streets, and so on—really do increase opportunities for unplanned interactions between neighbors, then the “design characteristics” variable should have a positive effect on the frequency of neighbor contact. The results can be seen in Table 2.
First-Stage Model: Effect of Neighborhood Design Characteristics on Neighbor Talk.
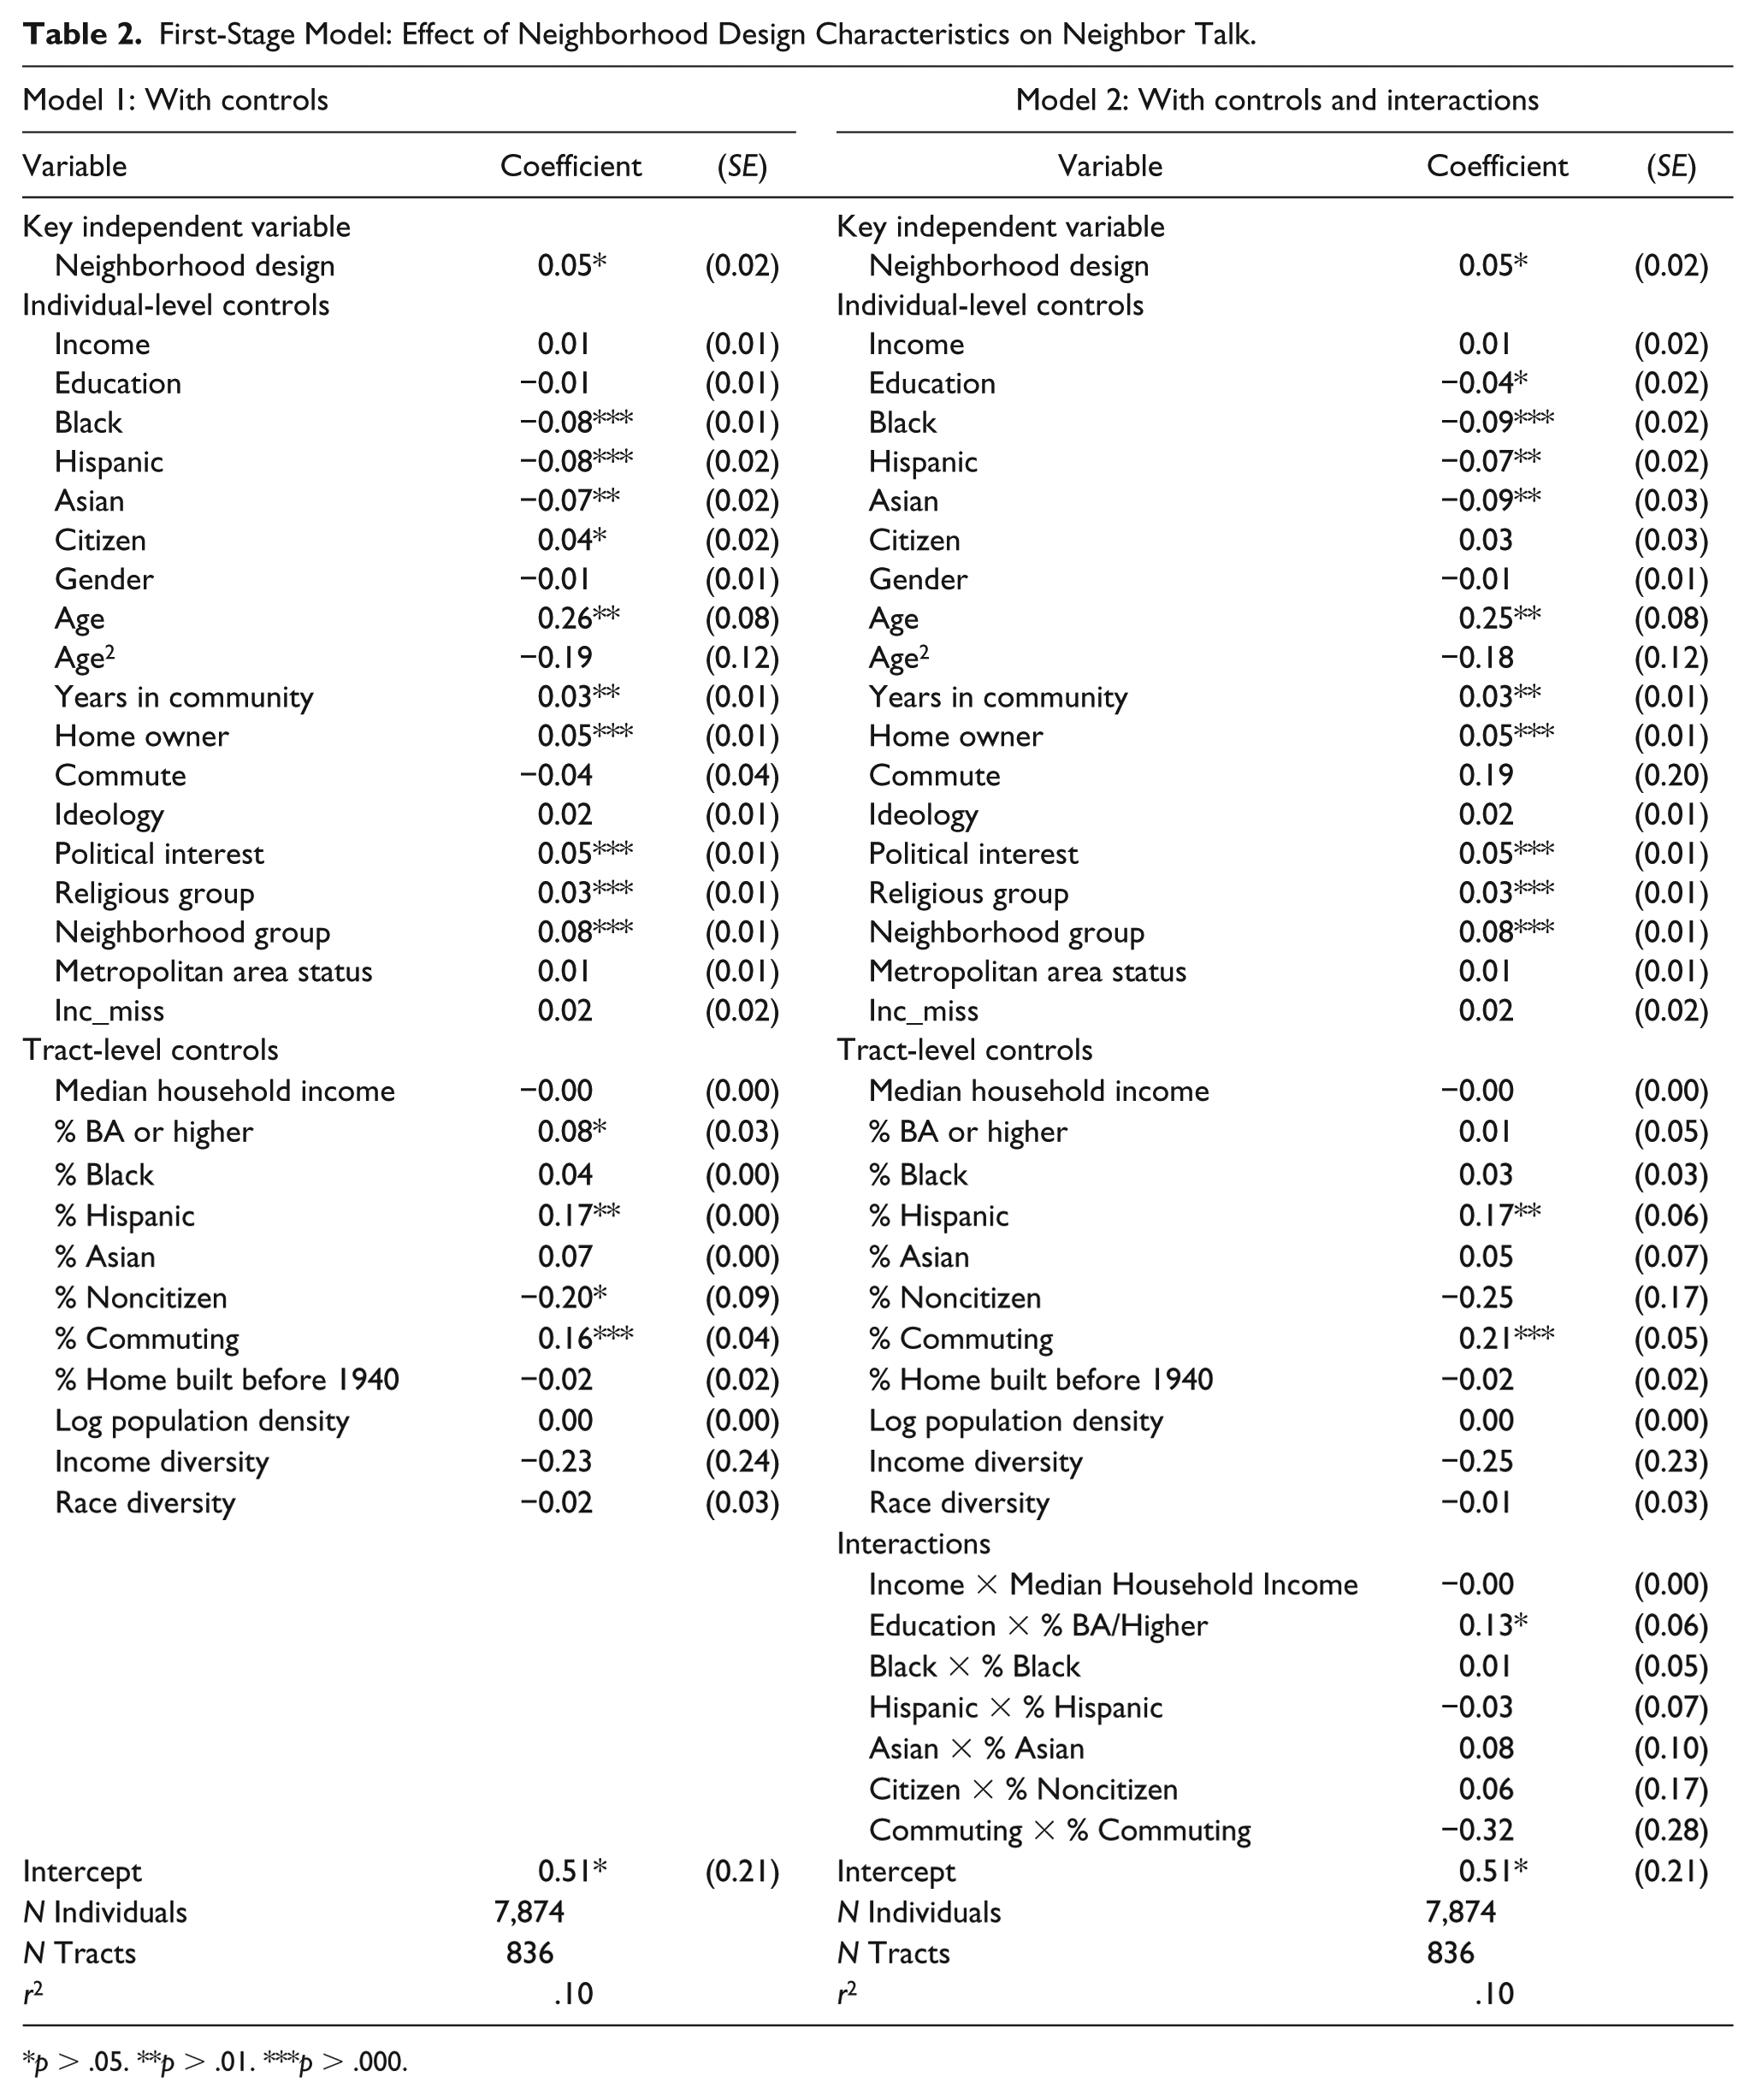
p > .05. **p > .01. ***p > .000.
The results in the first column of Table 2 show the effect of “neighborhood design” on “neighbor talk” is both positive and statistically significant. This finding supports the hypothesis that neighborhoods with more interactive design features lead to more contact between neighbors. On average, respondents in the survey reported talking to their neighbor a couple times a month (when the value of the neighbor talk variable was about 0.67). The results presented in Table 2 show that interactive design features generate a 0.05 increase in the frequency of neighbor contact, which is equivalent to increasing neighbor talk from a couple times a month to about once a week.
The results in the second column of Table 2 show the effect of “neighborhood design” on “neighbor talk” with the inclusion of the social context interactions. To control for socioeconomic minority status in one’s neighborhood (i.e. Is a respondent poorer/richer than an average neighbor?), I interacted the following individual- and tract-level variables: (a) individual income with median household income of tract, (b) individual educational attainment with the percentage of tract with a bachelor’s degree, and (c) individual commute time with the percentage of tract commuting to work. To control for racial/ethnic minority status in one’s neighborhood (i.e. Is a respondent of a different racial group than the majority of her neighbors?), I interacted the following individual- and tract-level variables: (a) whether a respondent identified as Black with the percentage of tract who are Black, (b) whether a respondent identified as Hispanic with the percentage of tract who are Hispanic, (c) whether a respondent identified as Asian with the percentage of tract who are Asian, and (d) individual citizenship status and the percentage of tract who were noncitizens. 7 The results show that even with the inclusion of the social context interactions, the effect of “neighborhood design” on “neighbor talk” holds. The effect remains positive and statistically significant; the magnitude of the coefficient also remains unchanged (0.05). This further supports the hypothesis. The remaining question is, “Is this increase in neighbor contacts enough social interaction to actually influence individual participation?”
Second-Stage Regression
In the second-stage, I run a multilevel logistic regression model, where individual turnout is the dependent variable and the predicted value of “neighbor talk” estimated in the first-stage regression is my independent variable. I continue to include controls for both tract-level and individual-level variables used in the first-stage analysis. In addition, I include the series of social context interactions used in the first-stage analysis. Recall that if contact with neighbors does increase individual political participation, then the effect of the predicted value of neighbor talk should have a positive effect on individual voter turnout. The results from can be seen in Figure 1. 8

Effect of predicted talk on probability of individual voter turnout.
Figure 1 shows the effect of predicted neighbor talk on the probability of voting while holding all other control variables at their mean. The points on Figure 1 represent the observed predicted probability of voting for each respondent in the survey, while the line represents the predicted probability of voting while holding all other control variables at their mean. The results show that talking with one’s neighbor has a positive and statistically significant effect on increasing the likelihood of voting (the coefficient was 10.14, p > .05). For respondents who were predicted to speak to their neighbors several times per year (those with predicted neighbor talk of 0.35), the predicted probability of voting is around 13%, while holding all other variables at their mean. The predicted probability of voting increases to about 93% for respondents who were predicted to speak to their neighbors several times a week (those with a predicted neighbor talk of 0.80). This increase in the predicted probability of turnout demonstrates the important role that neighbor contact can have on influencing individual turnout.
This evidence supports the hypothesis that talking to one’s neighbor will increase individual political participation. These results, however, show the full effect of “predicted neighbor contact” on participation rather than the effect of the unique “design-induced” neighbor contact alone on participation. Many individual characteristics, tract-level characteristics, and social contextual factors also increase contact with neighbors (see Table 2). In the following section, I explore what effect “design-induced” talk—that is contact between neighbors that is generated through design—has on individual voter turnout.
Effects of Design-Induced Neighbor Contact on Participation
To isolate the effect of only “design-induced” talk on participation, I go back to the first-stage analysis, which showed that moving one unit on neighborhood features moves talk by 0.05 units. As the neighborhood design variable varies from 0 to 1.0 (see Table 1), going from no interactive characteristics to many interactive characteristics (moving from 0 to 1.0 on the design score) increases talk by about 0.05 units. So the next question is, “What is the effect on participation of increasing talk by 0.05 units?” The results in Figure 2 address this question.
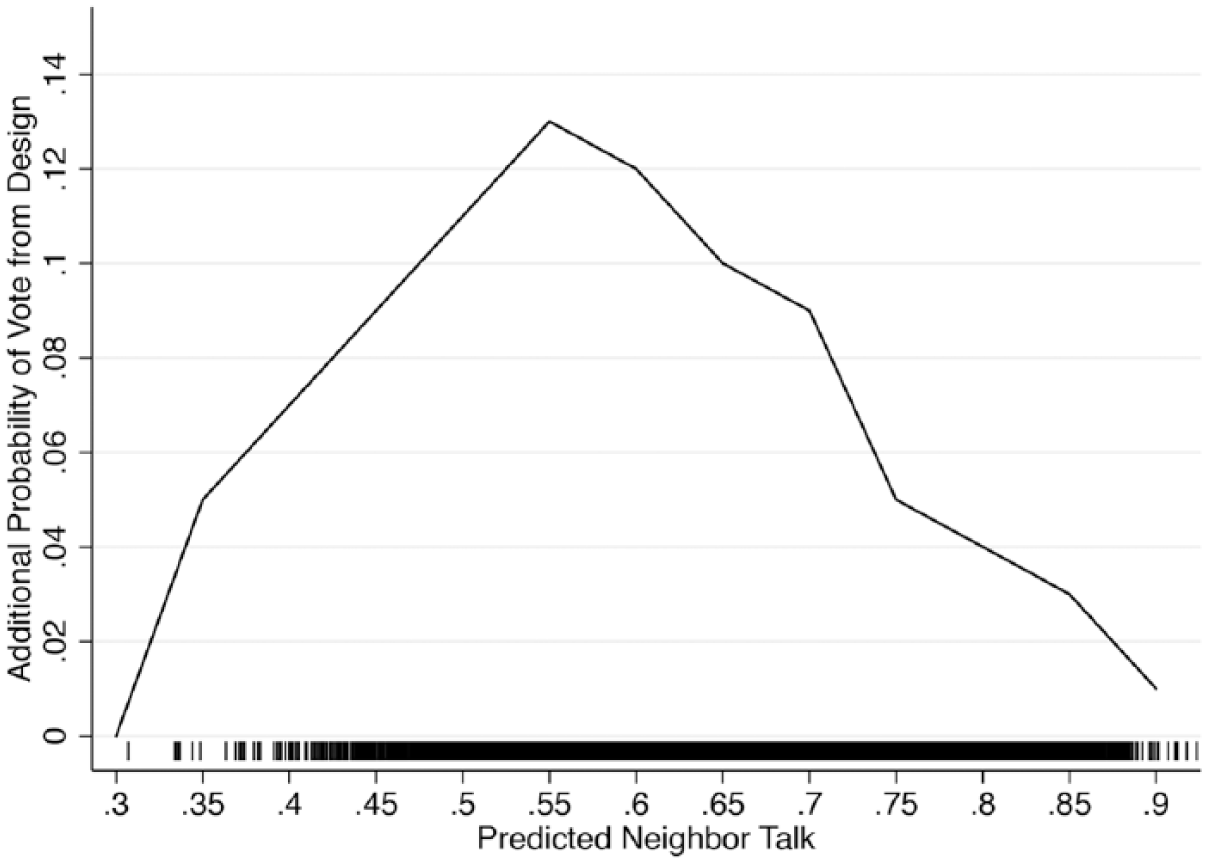
Effects of “design-induced” talk on probability of voting.
The results in Figure 2 show the difference in the predicted probability of voting for each additional 0.05 increase of talk. The rug plot shows the actual distribution of respondents’ self-reported frequency of talk. These results show the effect of an additional 0.05 units of talk on participation varies depending on the frequency of talk. 9 For respondents at very low levels of neighborly contact, an additional 0.05 units of talk has little effect on the probability of voting. For example, small increases in talk for people who never have contact with their neighbors do not seem to generate any additional probability on that individual’s turnout. This is also true at very high levels of talk; small increases in contact for people who already regularly talk to their neighbors seem to generate no significant increases in the probability of turnout. In the middle range of talk, however, the effect of “design-induced talk” on the probability of voting is larger in size. In this region of maximum slope, the effect of design-induced talk on the probability of voting is about 0.13 points. This shows that small increases in contact, like those from interactive neighborhood design features, for those people who have moderate levels of contact with their neighbors—like moving from talking once a month to several times a month—can actually garner a large increase in the predicted probability of turnout. Overall, the average effect of design-induced talk on the probability of voting is 7%. Although an average increase in the probability of voting of 7% may seem small, put into comparison with the effects of intentional mobilization efforts, like partisan mailers which were found to garner an average effect of 0.008%, a 7% increase on voting is actually quite large (Green & Gerber, 2008). The results in Figure 2 support the hypothesis and demonstrate the role that both place and people serve in influencing individual turnout.
Conclusion
Critics and scholars have asserted that “It may well be that people who live in communities defined by garage-dominated facades, non-grid street plans, and private backyards are less engaged than those in communities where the architecture promotes more public intercourse” (Oliver, 2001, p. 153). These conclusions, however, have primarily been supported with limited research designs. This article attempts to improve this scholarship in three ways. First, it develops an innovative method to improve the measurement of the physical characteristics of neighborhoods. Second, the analysis was conducted at a lower level of aggregation, the census tract, which provides a more accurate depiction of an individual’s immediate built environment. Finally, it measures the indirect effect of physical features on participation through the instrument of the frequency of neighbor talk that previous scholars claimed existed but could not test.
The findings suggest that individuals living in neighborhoods with isolating characteristics speak less frequently with their neighbors than those living in neighborhoods designed with primarily interactive characteristics. These findings make sense, because for residents in neighborhoods dominated by isolating features, the design offers fewer opportunities for neighbors to unexpectedly meet. For residents in neighborhoods with mostly interactive features, the design provides more opportunities for neighbors to “bump” into one another. Moreover, the evidence reveals that more talking between neighbors results in higher levels of individual voter turnout. For example, individuals who talk to their neighbor several times per year were predicted to vote about 13% of the time; whereas, individuals who talk to their neighbor several times a week were predicted to vote about 95% of the time. This shows how both neighborhoods and neighbors can affect individual political behavior.
What all of this evidence reveals is that the shift from pedestrian-centered to car-oriented design that happened at the turn of the century has probably contributed to a decline in both neighboring and political participation. Of course, I am certainly not suggesting that neighborhood design is everything. The physical context, however, is part of the broader puzzle working alongside other contextual characteristics, like neighborhood racial composition or socioeconomic diversity. Looking forward, there is still much to learn regarding how place and people affect individual political participation. For example, will these design characteristics work the same for all people living in all neighborhoods (i.e., A Democrat living in a majority Republican neighborhood)? Or, is neighborly contact always the mediating variable between design and participation? Questions like these will certainly need to be answered. What the findings shown here suggest is that both neighborhoods and neighbors seem to matter and both are worth further examination.
Supplemental Material
Appendix_TableA_3_27_2019 – Supplemental material for Neighborhoods That Matter: How Place and People Affect Political Participation
Supplemental material, Appendix_TableA_3_27_2019 for Neighborhoods That Matter: How Place and People Affect Political Participation by Carrie LeVan in American Politics Research
Supplemental Material
OnlineAppendix_3_27_2019 – Supplemental material for Neighborhoods That Matter: How Place and People Affect Political Participation
Supplemental material, OnlineAppendix_3_27_2019 for Neighborhoods That Matter: How Place and People Affect Political Participation by Carrie LeVan in American Politics Research
Footnotes
Declaration of Conflicting Interests
The author(s) declared no potential conflicts of interest with respect to the research, authorship, and/or publication of this article.
Funding
The author(s) received no financial support for the research, authorship, and/or publication of this article.
Notes

Supplemental Material
Supplemental material for this article is available online.
Author Biography
References
Supplementary Material
Please find the following supplemental material available below.
For Open Access articles published under a Creative Commons License, all supplemental material carries the same license as the article it is associated with.
For non-Open Access articles published, all supplemental material carries a non-exclusive license, and permission requests for re-use of supplemental material or any part of supplemental material shall be sent directly to the copyright owner as specified in the copyright notice associated with the article.
