
Abstract
A fundamental requirement of democracy is the existence of contested elections. Our study documents and explains trends in uncontested seats in the U.S. Congress and state legislatures over time. We uncover a striking inconsistency in the health of elections: the frequency of uncontested seats in Congress has declined while the frequency of uncontested seats in state legislatures has actually increased. To explore these divergent trends, we consider factors that are common to both Congress and state legislatures such as the redistricting cycle but also variables that are unique to the state level. Our analysis points to the relative “flippability” of Congress compared to many state legislatures as a factor behind diverging levels of contestation. While many state legislatures have become bastions for dominant parties, congressional districts in those same states are often nonetheless viewed as enticing targets because they contribute to control of the federal government.
Contestation is central to effective democratic politics. At the heart of representative democracy are elections that provide voters with the opportunity to express their preferences about the direction of government. To meet this essential standard, elections must exist not only in theory; they must also be contested so that voters actually get to make choices between competing candidates. Indeed, Dahl’s (1971) classic depiction of a “polyarchy” identified two essential dimensions of democracy: the degree of participatory inclusion of the electorate and the degree of contestation. The presence of uncontested elections thus raises normative questions about whether a democracy is functioning effectively.
We examine the prevalence of uncontested elections for Congress and state legislatures as a measure of the health of these representative bodies. Our longitudinal data analysis reveals a striking inconsistency. Uncontested rates for elections to the House of Representatives are low and have been declining over time. In contrast, uncontested rates for lower houses of state legislatures are high and increasing. Although seats in both kinds of institutions are less likely to be contested in the South, regional differences do not explain the divergent experiences at the federal and state level. We estimate multivariate regression models of the uncontested seat rate and find that several factors such as redistricting and the simultaneous presence of presidential elections work similarly at both levels of government. A key difference between the opposing trends is the likelihood that a given election will flip party control. The margin between the two parties’ seat shares in Congress has been relatively narrow and has no apparent effect on how many districts are contested. In contrast, state legislatures’ much larger margins make them less likely to flip and discourage candidates from contesting seats. Because states have tended to drift toward being reliably “blue” or “red” in their state legislatures, candidates and parties within even those politically lopsided states will view congressional seats as more inviting targets. A key to more contested elections is the presence of narrow legislative majorities that keep chambers “flippable” and subsequently motivate parties and candidates to run.
Understanding Contestation
Generally speaking, uncontested races are those where only one candidate runs and thus faces no opponent. 1 This effectively makes the election a foregone conclusion about which voters have no influence. 2 In contrast, uncompetitive races are those where the favored candidate appears to have an advantage that makes it unlikely that her opponent will win.
Uncontested and uncompetitive elections are both normatively and empirically important. However, we know much less about the former than the latter. Indeed, studies that seek to explain variation in competitiveness sometimes even drop uncontested seats from the analysis together. This approach may be problematic precisely because without more than one candidate on the ballot, an election cannot possibly be competitive. The mere anticipation that an election will be uncompetitive often discourages potential candidates from contesting it in the first place.
When contestation has been studied, the focus is often on the emergence of challengers to take on incumbents (e.g., Carson, 2003; Hogan, 2004; Maestas et al., 2006). These studies have usefully identified district-specific factors such as the ideological fit between a representative and constituents or incumbent fundraising that influence whether incumbents are likely to run unopposed.
Uncontested elections are barometers of the effectiveness of elections as a means for constituents to express their preferences and influence the direction of government. While it is true that “experience-seeking” amateurs (Canon, 1993) are much less successful than “high quality” strategic candidates (Jacobson, 1989), we believe that the complete absence of a choice on the ballot is a distinct concern. Cain (2011) reminds us that “[a]t a minimum, democracy requires contestation for critical offices, meaning that voters get a choice and can hold office holders accountable for their actions and decisions by voting them out of office” (p. 266).
Several undesirable consequences have been shown to result from the lack of contestation. State legislators who face no competition tend to perform more poorly than their colleagues, being more likely to miss roll call votes and less likely to introduce bills (Konisky & Ueda, 2011). Members of Congress holding uncontested seats are less effective as lawmakers (Volden & Wiseman, 2014). Even studies arguing in favor of uncompetitive legislative elections as a way to enhance representation find that the public has less favorable views of incumbents when elections are uncontested (Brunell, 2008; Brunell & Buchler, 2009).
Hypotheses
As we will demonstrate, Americans’ exposure to elections that offer choices between candidates varies tremendously across time and space. Due to historic patterns of party competition, there may be no greater source of variation than differences between states in the South and the rest of the country. Key’s (1949) classic study of the “solid South” portrayed the region as at best a one-party area and at worst essentially without functioning parties at all. As a result, for most of the post-World War II era, contestation in the South was mostly determined by whether or not a Republican candidate emerged (Lublin, 2004).
Yet the party system in the South has involved in significant ways in recent decades. Myers (2018) shows that there is a notable partisan tinge to where seats are uncontested in southern state legislatures. Over the past two decades, Republican-leaning districts have seen declines in the uncontested rate but Democratic-leaning districts have seen increases. Aldrich and Griffin (2018) argue that the region has fully developed politically since 1980, to the point of being just as “competitive” as the non-South. This understanding of realignment in the South makes the evidence we present below about the lack of contestation there all the more surprising.
Beyond regional differences, we consider several factors that affect rates of contestation. One such factor is legislative professionalism, defined as “the extent to which a house provides the resources and tasks to make legislating a full-time job” (Kousser, 2005, p. 12). Professionalism would seem to be an important consideration that could help explain change over time and differences between the national and state levels, yet studies show mixed findings. Legislative pay but not expenditures reduced contestation in the 1970s and 1980s (Van Dunk & Weber, 1997). Greater professionalism actually increased contestation in two studies of state legislative elections (Hogan, 2003, 2004) and brought out more challengers in recent elections (Rogers, 2018) but lowered it in larger panel analyses of state legislative elections (Forgette et al., 2009; Squire, 2000). Although this leaves us without a clear hypothesis, our more extensive empirical analysis should help resolve these mixed results.
Legislative redistricting might affect the uncontested seat rate by influencing the supply of candidates to run. By disrupting the relationship between incumbents and districts, the decennial redistricting cycle itself does appear to increase the uncontested rate in Congress (Wrighton & Squire, 1997). However, Masket et al. (2012) find little evidence that specific redistricting methods affected whether a district was contested in the 2002 state legislative elections. Analyzing a longer time series of elections, Forgette et al. (2009) find that state adherence to specific redistricting principles does affect the uncontested rate. They also find that having a state under the Voting Rights Act “preclearance” requirement surprisingly raised the number of uncontested seats, a result mimicked by Lublin and McDonald (2006).
There are mixed findings on use of multi-member districts. Niemi et al. (1991) find no meaningful differences between single-member and multi-member districts, but a later study from Van Dunk and Weber (1997) finds that multi-member districts reduce contestation. Given the challenge of fielding more than one candidate in a district, it seems likely that parties are less likely to run a full set of candidates in states with multi-member districts.
Based on existing literature, our models also account for several other control variables. Availability of state funding for campaigns appeared to reduce the number of uncontested seats. Hamm and Hogan (2008) and Mayer and Wood (1995) find that challengers are more likely to emerge where public funding exists. District population has shown mixed effects. Two studies find that more populous districts have more contestation (Lublin & McDonald, 2006; Rogers, 2018) and while another finds that contestation is less likely as district population rises (Hogan, 2004). There is also only weak evidence that term limits affect contestation rates (Forgette et al., 2009; Squire, 2000). National forces that shape congressional elections do seem to trickle down to state legislative elections (Rogers, 2015). In particular, uncontested seats are more common in midterm elections, apparently because the presidential race enhances candidate recruitment (Squire, 2000; Wrighton & Squire, 1997).
Finally, the competitiveness of parties at the state level is a key consideration for party leaders and potential candidates thinking about where to run. Intuitively, a legislature where only a few seats must change hands to alter which party is in the majority would bring out a larger number of candidates. A narrow margin between the seat shares of the majority and minority encourages both to run a large number of candidates due to the greater potential of any one seat to be pivotal in determining who governs after the election. Squire (2000) finds a similar effect in showing that uncontested rates are lower in states where partisan competition is greater. More precisely, several studies show that a bigger minority party seat share in the legislature—making future control of the legislature more uncertain—increases contestation (Hogan, 2003; Rogers, 2015, 2018; Van Dunk & Weber, 1997). We believe this variable has the greatest potential to explain rates of contestation across states, between levels of government, and over time. Unlike the other factors highlighted above, the “flippability” of legislatures varies tremendously across time and space. The variable is designed to be more relevant and specific to candidate recruitment than general measures of state party competition such as the Ranney index. Focusing on this explanatory variable also helps to illuminate the unique patterns of the South where Democrats for so long had a dominant hold on state legislatures.
Data on Uncontested Elections
Several studies have analyzed whether and why individual seats are contested. It is certainly important to understand why voters in specific districts see contested races while voters in others do not. We take a different approach by examining aggregate levels of contestation in Congress and state legislatures over time. There are both theoretical and empirical reasons for this approach. A focus on total contestation allows us to assess the overall health of legislative elections in providing voters with choices and to examine how the two levels of government differ and how they each vary over time. As the data will show, there are meaningful and durable differences in the degree of contestation across states that deserve study. In addition, while a district-by-district analysis can illuminate candidate emergence at the local level, it would not spot the big structural trends that we uncover. 3 As a practical matter, a district-based analysis would be a massive data collection undertaking that is beyond the scope of this study.
We consider a seat uncontested if only one candidate appears on the ballot. 4 This allows us to measure the uncontested seat rate for a particular election year and legislature as the share of seats where candidates are unopposed. Higher values indicate that more seats are uncontested.
We assembled parallel datasets for the House of Repre-sentatives and the lower houses of 49 state legislatures. 5 The congressional dataset covers the time period from 1920 to 2016 (49 election cycles) and is drawn from election records kept by the Clerk of the House of Representatives. The main state legislative dataset covers the time period from 1968 to 2016 (25 election cycles) and is drawn from Klarner et al. (2013), with updates by the authors for the last three election cycles. From this we are able to calculate the uncontested seat rate for each state legislature in each election year, for a total of 1,225 observations. Following Hirano and Snyder (2009), multi-member districts using “free-for-all” positions are considered contested if both major parties run as many candidates as there are seats in the district. 6 For the small number of states where state legislative elections are held in an odd-numbered year, we treat the elections as if they were held in the following year. 7
It is unfortunate that the state legislative data to not reach as far back in time as the congressional data. The 1920 to 1968 period encompasses several important changes in legislative elections that might affect contestation, especially the decline of Democratic Party dominance in the South and the 1960s “one person, one vote” Supreme Court decisions that ended malapportionment within states. Collecting data on state legislative elections during this period is extremely challenging. To probe how the omission of state data before 1960s might influence our conclusions and provide some context for the more recent era, we coded the uncontested seat rates going back to 1920 in a sample of 10 state legislatures. This was a difficult task that involved locating, reading, and interpreting old almanacs, registers, and other state reference books where they were available. Although not perfectly representative of the country, the 10 states—California, Illinois, Iowa, Missouri, Pennsylvania, Rhode Island, Tennessee, West Virginia, Wisconsin, and Wyoming—were selected for data availability and to represent different regions of the country. 8
Comparing Congress and State Legislatures
Figure 1 displays the uncontested seat rate for the House of Representatives and the lower chambers for state legislatures. The solid lines represent the period from 1968 to 2016 where we have data on both levels of government. The dashed blue line shows a longer trend from the more limited 10-state sample to make comparisons with the full congressional trend back to 1920.
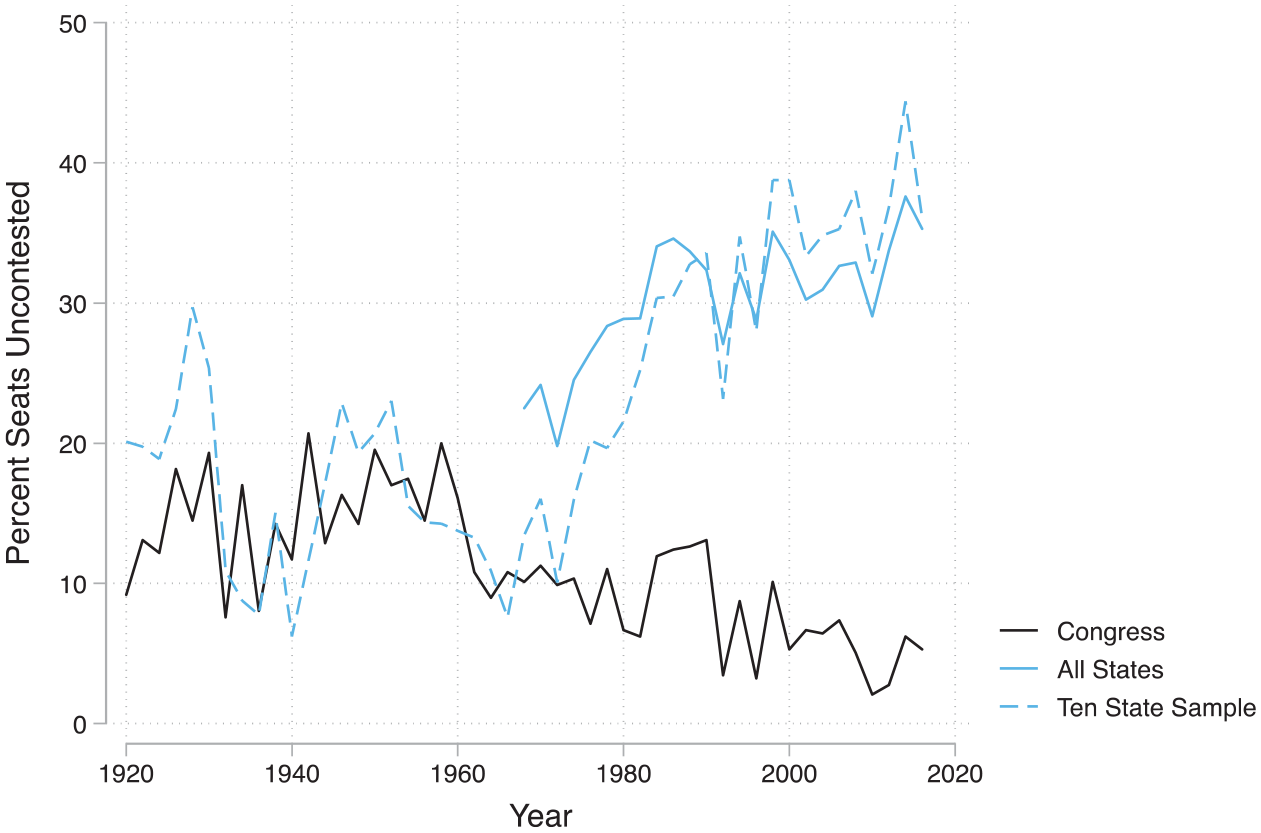
Uncontested seat rates in congress and state legislatures.
The most striking finding from Figure 1 is that in the modern era uncontested rates have been going down in Congress but going up in state legislatures. Although the greater prevalence of uncontested seats in the states has been noted by other scholars (Rogers, 2015; Squire, 2000), as has the rise in uncontested rates in state legislatures (Forgette et al., 2009; Van Dunk & Weber, 1997), we believe this is the first time that these starkly opposing patterns have been observed together.
Before the 1960s, the 10-state sample suggests that Congress and state legislatures were following similar patterns without much of a trend. The two appear to diverge in the 1960s. In 1968 (the first year where we have complete data) the uncontested rate of 24.2% in the states was more than double the congressional rate of 10.1%. Over time the trends have moved apart so much that by 2016 the uncontested rate in the states was seven times that of the congressional rate. The intentional expansion of majority-minority districts in 1992 might have decreased contestation somewhat in the short run, but it did not interrupt the longer-term trends separating federal and state legislative elections.
This appears to be meaningful divergence. If contestation was due mainly to the presence of hopeless sacrificial lambs on the ballot, their entry would presumably be random noise and would not result is such systematic trends. Even if high quality challengers are less common in state legislative elections (cf. Van Dunk, 1997), it seems unlikely that congressional incumbents have become better at deterring them while state legislators have become worse. It is also noteworthy that the figure shows little evidence of familiar “wave” elections. Although a pattern of “surge and decline” or partisan “tides” might well affect the partisan mix of candidates, the net effect on contestation appears to be modest.
Despite complaints about the shortcomings of congressional elections as being predictable and unresponsive, in terms of contestation they appear to have become healthier over time while state legislative races have become less so. This is surprising because congressional districts have actually become more politically lopsided in recent years. For example, Jacobson (2006) shows that the share of House seats that can be considered “favorable” to the incumbent party grew from approximately 60% in the 1970s to 80% in the 2000s. As measured by contestation, democracy is expanding in congressional elections but contracting in the states. The congressional pattern also appears in state Supreme Court elections, which have seen increasing levels of contestation in recent decades (Kritzer, 2011). This suggests that our explanation ought to focus on state legislatures as being exceptions to the larger trend of growing contestation. We believe that the “flippability” of party control in legislatures makes the patterns different than for executive, judicial, and other statewide offices.
Here is also where our longer 10-state sample is helpful for ruling out some potential concerns. 9 The state and congressional trends were actually somewhat more in sync before 1968. The correlation between the congressional rate and 10-state sample rate was a 0.39 before 1968 and −0.30 thereafter. This is apparently not due to something peculiar about the 10 states we selected for longer-term analysis. For the 25 election cycles where the two state lines both exist, they are highly correlated at 0.93. Both are negatively correlated with the uncontested rate in Congress. We conclude that the growing disparity between Congress and state legislatures is a recent phenomenon of the last half-century.
It is important to burrow below national trends that are likely to hide important variations between geographic regions, especially given the unique patterns that have defined politics in the South. Figure 2 presents uncontested rates in Congress and state legislatures separated by the South and non-South for the period from 1968 to 2016. Here we see a pronounced regional division but also more nuanced trends. The high uncontested rates in state legislatures are primarily a southern phenomenon. However, the upward trend in the states is driven more by states outside the South. In contrast, uncontested rates in Congress were long at low levels outside the South and have recently fallen to similar levels in the South. All of this suggests that our analysis allow for different levels of contestation inside and outside the South, but that we also consider that the factors leading to contestation might vary by region.
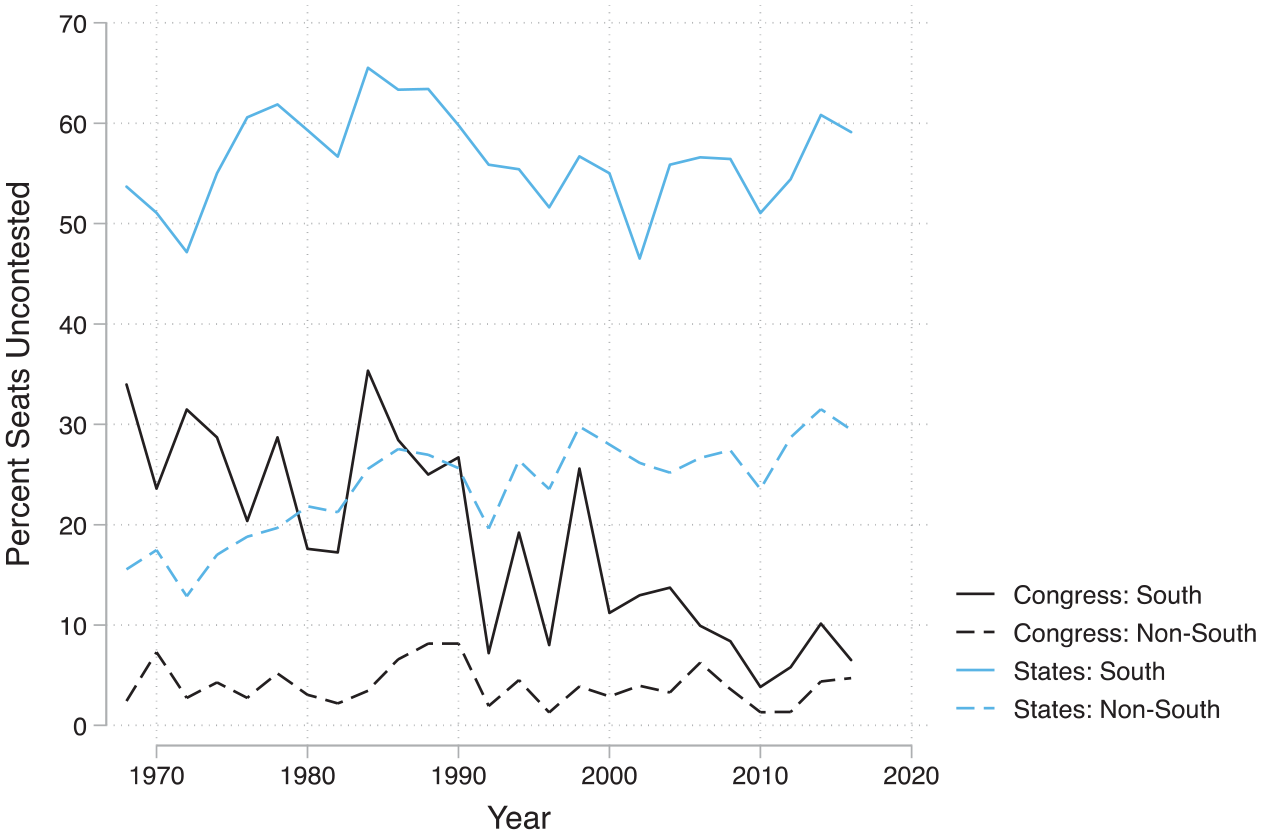
Uncontested rates by region for congress and state legislatures.
Before moving on, we should note, as Rogers (2015) and others show, that there is substantial variation across the states even within a single election cycle. This variation is only partly due to the uniqueness of the South. The median rate of uncontested seats in the states doubled over time from around 15% in the early 1970s to 30% in the 2000s. At the same time, there is also substantial variation even within a given election cycle. The interquartile range, which captures half of the states, is more than 30 percentage points. In nearly every election cycle there are states with zero uncontested seats while other states simultaneously have 75% or more of seats uncontested.
In the following section we estimate multivariate models to explain this variation within and across states, as well as the variation in congressional contestation over time. This tremendous variability across states suggests that common factors such as the redistricting cycle are unlikely to explain much. Instead, we believe that the party balance in the legislature is probably the more potent impact, in part because it also varies tremendously, perhaps more than many have assumed. The ability of a minority to win a majority of seats is in the next round of elections is likely to affect the supply of candidates and thus the rate of contestation. Importantly, even within lopsided states, every congressional race may seem important because it contributes to the overall balance in the U.S. House, which has been seen as winnable by both parties in recent years. As a result, parties, groups, and candidates are more likely to route their resources toward congressional seats that “matter” than to state legislative seats that do not.
Explanatory Variables
Our models of the uncontested seat rate rely on many of the explanatory factors identified by previous authors. Where we differ is in estimating side-by-side models for both federal and state elections in one study. This approach ought to help us spot the variables that are responsible for the growth of uncontested seats in the states and decline of uncontested seats in the House of Representatives. We start by describing the variables that are common to the congressional and state models, and then describe the variables that are unique to one level or the other.
To begin, both sets of models account for cyclical regularities that affect legislative elections. We measure the influence of redistricting as a dummy variable for the first year in which a new legislative map was in place (i.e., years ending in “02”). 10 Because the uncertainty created by new districts often threatens incumbents and invites different kinds of candidates to seek office, the uncontested rate should drop in redistricting years. We also include a dummy variable for midterm election years to reflect the finding in earlier studies that districts are more likely to be contested in years when the presidential election is also on the ballot.
Two other variables are of greater interest because they allow for strategic decision making on the part of candidates and parties about where and when to contest legislative elections. The first strategic variable is a measure of the underlying partisanship of the electorate, operationalized as the margin in the state between the Democratic and Republican candidates in the most recent presidential election. The presidential vote margin variable takes on high values when the vote breakdown is more lopsided, a setting in which we would expect fewer contested elections as a result of less parity in party preferences in the electorate.
The second strategic variable is party seat margin in the legislature. Due to the way voters are aggregated into districts—whether via intentional gerrymanders or as a result of other factors—this variable is distinct from the statewide presidential vote. As noted above, previous studies have found that districts are more likely to be contested when the number of seats that must be flipped to change party control is smaller. We measure this as the percentage difference in the shares held by each party and expect candidates and parties to run fewer candidates (i.e., increasing the uncontested rate) as the margin grows. We square the seat margin variable to permit a quadratic relationship so that uncontested rates may rise even more quickly as the majority party’s advantage grows.
The state models also include several variables that are unique to state legislative elections. We measure the average district population to account for earlier findings that districts with large populations were more likely to be contested. One could also technically include the average district population in Congress. We omit it because growth in the overall size of the American populace makes it difficult to separate the effect of population itself separately from a secular time trend.
We include an indicator variable to mark the small number of states using multi-member districts to elect at least a portion of lower house state legislators. 11 In addition, we capture states that offer public campaign funding to state legislative candidates. Some research suggests that such funding brings out more candidates and should reduce the uncontested seat rate. Our variable marks states that offer “full” rather than “partial” and comes from a variety of sources including Government Accountability Office (2010), Mayer et al. (2006), and the National Conference of State Legislatures. Finally, the models account for the presence of term limits imposed in some state legislatures. Our dummy variable marks states during eras when term limits were “on the books,” that is, had been adopted as law governing time in office. 12
In auxiliary models, we also consider several measures of legislative professionalism. One is the well-known “Squire index,” which scales each legislature relative to the professionalism of the U.S. Congress (see Squire, 2017). We also use three disaggregated indicators from Bowen and Greene (2014): legislator salary, state expenditures on the legislature per legislator, and the length of the regular legislative session in days. Because these measures are only available for a limited time period, we report the results including the professionalism variables in the appendix.
The congressional model also includes a unique variable. Given the longer time series, we mark the beginning of the “redistricting revolution” heralded by the U.S. Supreme Court’s decision in Wesberry v. Sanders (1964). This decision, and related cases, required states to redraw district lines to eliminate malapportionment starting with the 1966 elections. We expect the uncontested rate to drop afterwards because unequal populations could no longer be used to squelch competition. At nearly the same time, the Voting Rights Act of 1965 was signed into law, having its first impact in the same election cycle. We are unable to distinguish these simultaneous influences but measure both of them as a dummy variable that takes on the value of one beginning in 1966.
The models account for differences in the South in several ways. In the state models, we add a dummy variable for the South, measured as the 11 states that joined the Confederacy. In the congressional models we measure the share of the seats that come from the South, a variable that rises over time from 23.4% to 31.3%. To investigate whether the factors that contribute to contestation differ in the South, we will also estimate all of the models separately for the two regions.
Multivariate Results
Table 1 presents models of the uncontested seat rate in Congress from 1920 to 2016. We use a simple linear regression model to estimate the effects of the independent variables. We recognize that the linear regression assumption of uncorrelated disturbance terms might be violated due to the time series nature of the data. However, results were nearly identical when we estimated a Prais-Winston version of the baseline model in which the errors are permitted to follow a first-order autoregressive pattern. 13 A model including a lagged version of the dependent variable also produced nearly identical results. The first column in the table presents a baseline model with the share of seats in the South is included. The next two columns show the results separately for the South and non-South. (The seats in the South variable is omitted.)
Models of Uncontested Seats in Congress.
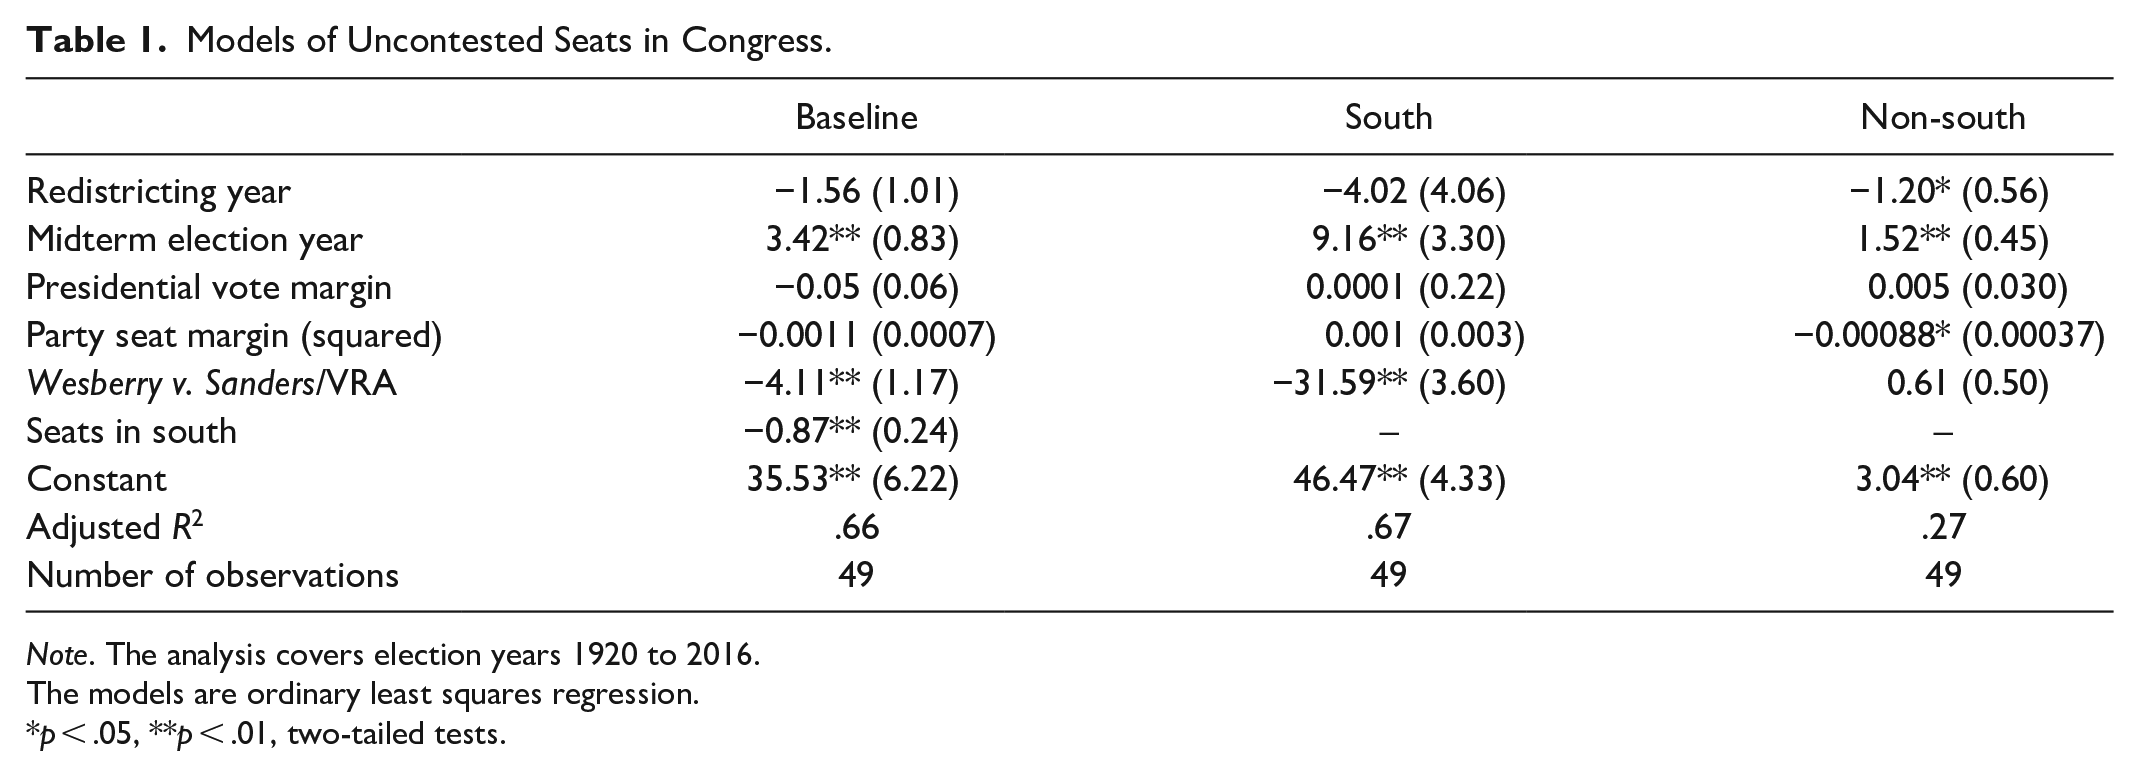
Note. The analysis covers election years 1920 to 2016.
The models are ordinary least squares regression.
p < .05, **p < .01, two-tailed tests.
The table shows that three factors have statistically significant effects on the uncontested rate in Congress. In line with previous literature, midterm elections see fewer candidates, raising the uncontested rate by about 3.4 points in the baseline model. The share of seats coming from the South also decreases the uncontested rate. As noted above, this variable has risen over time by about eight percentage points, resulting in a decline of approximately seven points over a century. The final significant variable is the Wesberry decision striking down malapportioned districts, a watershed that apparently had a democratizing effect, decreasing uncontested seats by 4.1 points. Neither redistricting nor the electoral competitiveness measure affects the uncontested seat rate.
In the final two columns of the table we separate the analysis by region. While the differing constants confirm that the level of contestation differs substantially between the regions, the structural influences on the uncontested rate are not much different in the South. The key exception is that it is now apparent that the combined Wesberry/VRA effect was limited to the South, where its impact was much larger. Midterm elections also appear to boost the uncontested rate in southern states more than non-southern ones. Importantly, the seat margin variable also does not have the expected effect of raising the uncontested rate as the gap in seats between the parties grows. The coefficient is insignificant in the South model; it significant but small and of the “wrong” sign in the model for the non-South. We also estimated a version of the model using a measure known as the “minimum uniform swing distance” (e.g, Feigenbaum, Fouirnaies, & Hall, 2017) in place of the seat margin variable and found similar null results. The full models appear in the appendix.
Having examined contestation in Congress, we now turn to models of state legislatures. As explained in the previous section of the paper, the array of variables necessarily differs in these models because of the greater number of influences such as use of multi-member districts or term limits that vary across states. The modeling options also multiply because of the panel design of the dataset. No single specification is obviously superior for a dataset with the structure of ours. Following recent advice in the literature, we include only one-way fixed effects for states (Kropko & Kubinec, 2017; Mummolo & Peterson, 2018). We believe these fixed effects are more important sources of unmeasured confounders than are differences between election years. Unlike the congressional model, however, we are likely to violate OLS assumptions due to serially correlated errors. We thus employ “panel-corrected” standard errors to allow for first-order autocorrelation in the residuals. 14 These choices unfortunately mean that the coefficients of the congressional and state models cannot be compared directly for precise tests of whether they differ to a statistically significant extent. 15
Table 2 reports the models of uncontested seats in state legislatures. As with the congressional models, the first column shows the baseline model while the next two columns show separate results by region. As with the congressional analysis, most of the variables do not show statistically significant effects. The uncontested rate drops by about 2.5 points in redistricting years and is about 8.9 points lower in states with multi-member districts. Structures such as term limits, VRA preclearance, and public campaign funding show little sign of affecting how many seats are contested.
Models of Uncontested Seats in State Legislatures.

Note. The analysis covers election years 1968 to 2016. Nebraska is omitted due to its nonpartisan elections. State fixed effects are included but not reported in the table. Two states’ fixed effects could not be included due to collinearity. The public campaign funding variable is omitted from models for South due to lack of variation. The models are ordinary least squares regression with panel corrected standard errors.
p < .05. **p < .01, two-tailed tests.
Of greatest interest is the party seat margin variable. The positive and significant coefficient indicates that the uncontested rate increases as the majority party gains over the minority party in seats held. Because of the variation across states and time in party balance, this translates to a substantively important effect. It does not explain all of the divergence from the congressional pattern—allowing the seat margin variable to range from its minimum to maximum only raises the uncontested rate by 15 percentage points—but it is a moving part that bears some responsibility for the decline of choices for voters in state legislative contests. While Congress over time has come to be controlled by “insecure majorities” (Lee, 2016), state governments have sometimes become dominated by single parties. Unlike in Congress, the seat margin in the states generally did not decline and it has in fact been rising in recent elections from a gap of around 25 points in the early 2000s to a gap over 30 points in the 2010s, as we show below.
Other variables do not have the same potential to explain why states and Congress are moving in opposite directions. For example, multi-member districts might be appealing as an explanation because they are used in some states but not for elections to Congress. But Table 2 shows that multi-member districts actually lower the uncontested rate. This suggests that the disparity in contestation between Congress and state legislatures would actually be more severe if multi-member districts were not in use in some states.
As explained above, the models to this point have not included measures of legislative professionalism because those variables are only available for a shorter time period than is covered by our data. To be sure that the omission of professionalism measures is not tainting our analysis, we estimate a series of auxiliary models in the appendix with a sequence of professionalism indicators: Squire’s index, legislative salary, legislative expenditures, and session length. The table shows that three of the four professionalism measures do not have statistically significant effects on the uncontested seat rate. The one measure that does show a surprisingly significant relationship is state expenditures, indicating that higher levels of professionalism on this dimension increase the prevalence of uncontested seats. Most importantly, the effect of the party seat disparity continues to be significant and actually grows slightly in magnitude in every specification. Professionalism might influence candidate decision-making in other ways, but it is a not likely explanation for the divergence of states and Congress.
To further understand how the multivariate analyses can inform why Congress and state legislatures show opposing trends in uncontested seats, consider the levels of the variables used in the baseline analyses. Here it becomes apparent that the seat margin variable differs substantially between the two levels of government. As we report in the appendix, the mean seat margin in Congress was 17.2 points but was almost double that—31.3 points—in the states. There are apparently many state legislatures where the majority’s large caucus discourages the opposing party from fielding candidates at all.
To illustrate how flippability manifests over time, Figure 3 shows the trends in the party seat margin variable for the House of Representatives and all of the state legislatures from 1968 to 2016. It is apparent that states exhibit wild variation in the party seat margins. Even so, the mean state remains at a consistently higher average level—that is, less “flippable”—than Congress through the half century covered by the data. Much of this difference is due to the South where dominant parties often had huge majorities in state legislatures, but there are sometimes massive imbalances in other parts of the country as well. Examples of large party seat margins outside the South include Maryland in 2010 (48.6 points), North Dakota in 2002 (40.8 points) and Nevada in 1994 (38.1 points). In contrast, aside from a short-lived spike during the New Deal realignment era in the 1930s, the congressional seat margin never reached 40 points and was below 30 points in all but four election years.

Party seat margins in congress and state legislatures (1968–2016).
Seat margins in state legislatures and in Congress appear to drop over time. Indeed, both are correlated with the election year at approximately −0.15. But state legislatures stand apart because (1) the levels are roughly twice as high as in the U.S. House and because (2) the effect on the uncontested rate is statistically significant. As a result of this analysis, we conclude that aside from baseline differences between the South and the rest of the country, the most important factor distinguishing uncontested seat rates is the flippability factor in two ways. The distance the minority party must go to win control has been much larger in the states than in the U.S. House, and that has deterred candidates from running for state legislature but not in Congress. To the extent that ambitious politicians view state legislative seats as less appealing or merely as stepping stones to higher office, that should dampen the effects of flippability, which nonetheless appears to be an important factor in determining levels of contestation at the state level.
Conclusion
Uncontested elections are a normative concern because they prevent voters from having choices about who represents them. It is striking that this measure does not imply a single, coherent narrative about the health of representative democracy in the United States. Our presentation shows that since starting at similar levels of contestation in the 1960s, state legislatures and the Congress have moved in opposite directions. Uncontested rates in the House of Representatives have fallen to about 5% whereas uncontested rates in the lower chambers of state legislatures have risen to over 30%. A simple account of change in American party politics or the political evolution of the South cannot explain these trends.
We argue that levels of contestation are driven by perceived competitiveness of the legislature. When the majority holds a narrow seat margin, candidates from both parties have greater incentive to run for office because the “flippability” of the legislature is more immediate. As flippability becomes less likely, uncontested rates rise more rapidly. Even before the recent era of narrower margins in Congress, the heydays of large Democratic majorities in the House were still smaller than are observed in a number of state legislatures, despite the increase in party competition in the South. As a result of a variety of factors including the geographic polarization of the electorate and distortions introduced by redistricting, the minority party in the typical state legislature has twice the ground to make up as does the minority party in the U.S. House.
There are surely other factors that affect contestation that we could explore, yet it is not clear that they would help us understand why Congress and state legislatures fare so differently. For example, studies have found that more demanding filing requirements to get on the ballot and more restrictive campaign finance laws reduce contestation (Ansolabehere & Gerber, 1996; Hamm & Hogan, 2008). Although our analysis is broader than studies of challenger emergence, evidence indicates that campaign “war chests” deter challengers from running in state legislative elections (Hogan, 2001) but not in congressional elections (Ansolabehere & Snyder, 2002b; Goodliffe, 2001). The lesser ability to deter challengers in House elections might contribute to the differing levels of contestation, although maybe not the growing divergence in contestation rates. At the same time, Tamas and Hindman (2014) find that ballot access requirements for congressional candidates became stricter over the past century, a trend that actually runs contrary to the dropping uncontested rates in the House. Yet another possible explanation is that the power of incumbency has moved in opposing directions at the federal and state levels. However, analysis by Ansolabehere and Snyder (2002a) shows that the incumbency advantage grew at similar rates for members of Congress and members of state legislatures from the 1940s to the 1990s. If anything, the incumbency advantage is greater in Congress, which again makes it difficult to explain the higher level of contestation.
More nuanced measures of flippability would be welcome. We have simply recorded the share of seats that the minority needs to make up to become the majority. There are likely to be other contextual factors to consider such as whether a race higher up the ballot is likely to influence legislative races down the ballot or history in the state. These factors might influence whether a particular seat margin is more or less surmountable than the percentage alone would indicate. Given the crudeness of our indicator, more sophisticated measures along these lines would probably show even bigger effects of flippability than we have detected.
Further analysis might even incorporate larger contextual factors such as expectations about partisan tides that might affect candidate emergence differently across parties depending on their likelihoods of success. In the raw data we saw little evidence that “wave” elections affect net contestation rates, but other interesting patterns might exist at the district level. Even though partisan tides are evidently not responsible for the divergence between the two levels of government, different electoral environments could influence how many seats are contested, especially by “strategic” politicians who are attuned to contextual factors (Jacobson, 1989).
The importance of flippability in driving contestation in state legislative elections raises normative concerns beyond those that arise from the lack of choice that voters receive in uncontested elections. The low levels of contestation that appear at the state level, where one election cycle is less likely to change partisan control of the legislature, imply that candidates are prioritizing the collective concerns of their party in the legislature over the representational needs of particular districts when making decisions about candidacy. In other words, rather than running for a seat in a district in which they may be able to make a strong showing regardless of what winning that seat would mean for the party seat margin, candidates appear to be holding off until conditions are right for a change in the legislature’s partisan control. Paradoxically, this line of thinking could also have negative consequences for parties in legislatures by making it more difficult for them to make incremental gains within the legislature over a series of elections. It may require an election year with particularly good prospects for one party to disrupt this trend. Indeed, the midterm elections of 2018, which saw high levels of enthusiasm from Democratic candidates and voters that resulted in a Democratic majority in the House of Representatives, also produced a sharp decline in the number of uncontested state legislative seats. This striking interruption of the pattern that we have uncovered here suggests that perceptions of flippability, perhaps influenced by national political conditions, may drive contestation in state legislatures as well.
We realize there is a bit of chicken and egg problem when it comes to competition and contestation, but that is partly the point. The likelihood of a seat or a legislative majority being competitive is what drives many decisions about candidacy. However, while contestation either takes place or it does not, flippability has a subjective element that could be the more important moving part. If party strategists and potential candidates perceive that a legislative majority is up for grabs, it might affect contestation even beyond the objective, statistical measures that we have considered. Studies of competitiveness are important and should continue, but the bare existence of even a second candidate on the ballot should be of great interest as well as it reflects choices by parties, groups, and individual candidates about where it is worth running. More balance in the party divisions in the legislature results in more elections in which voters are offered choices.
Supplemental Material
Burden_Snyder_APR_resubmission_supplemental_file – Supplemental material for Explaining Uncontested Seats in Congress and State Legislatures
Supplemental material, Burden_Snyder_APR_resubmission_supplemental_file for Explaining Uncontested Seats in Congress and State Legislatures by Barry C. Burden and Rochelle Snyder in American Politics Research
Footnotes
Declaration of Conflicting Interests
The author(s) declared no potential conflicts of interest with respect to the research, authorship, and/or publication of this article.
Funding
The author(s) received no financial support for the research, authorship, and/or publication of this article.
Supplemental Material
Supplemental material for this article is available online.
Notes
Author Biographies
References
Supplementary Material
Please find the following supplemental material available below.
For Open Access articles published under a Creative Commons License, all supplemental material carries the same license as the article it is associated with.
For non-Open Access articles published, all supplemental material carries a non-exclusive license, and permission requests for re-use of supplemental material or any part of supplemental material shall be sent directly to the copyright owner as specified in the copyright notice associated with the article.