



Abstract
What can American partisan affect groups tell us about different models of partisan affect over a recent snapshot in time? Moreover, what implications do these groups have for political trust over that same snapshot in time? Results from the 2020 and 2016 American National Election Studies suggest that most partisans feel positively toward their inparty and negatively toward their outparty (Classically-Polarized)—consistent with classical approaches to affective polarization. However, some feel negatively toward their inparty and outparty (Double-Dislikers)—more consistent with negative partisanship models. Finally, some feel positively toward their inparty and outparty (Double-Likers). Despite recent work suggesting increasing outparty and inparty animosity, which implies growth in Double-Dislikers and the Classically-Polarized, only the Classically-Polarized grew between 2016 and 2020. Regarding political trust, compared to the Classically-Polarized, Double-Dislikers are associated with less political trust, whereas Double-Likers are associated with increasingly more political trust, suggesting substantive reasons for focusing on each group.
Two major theories of partisan affect—classical affective polarization and negative partisanship— vary in the extent to which they apply to different partisan affect groups, even if they were not designed to explain those groups wholly. “Classical” approaches to affective polarization, for instance, are best at accounting for partisans who “view opposing partisans negatively and co-partisans positively” (Iyengar & Westwood, 2015, p. 691; Iyengar & Krupenkin, 2018; Már 2020; Iyengar et al., 2012). We refer to this group as the “Classically-Polarized.” By contrast, “negative partisanship” approaches focus on negative outparty affect (Abramowitz & McCoy, 2019; Abramowitz & Webster, 2016; 2019), thus allowing for inparty disdain and better explaining partisans who feel negatively toward both parties (“Double-Dislikers”) than classical approaches to affective polarization. However, neither theory does a good job accounting for partisans who feel positively toward both parties (“Double-Likers”). This poses two key questions. First, how prevalent are these three different partisan affect groups in the United States over a recent snapshot in time, specifically between 2016 and 2020? Second, what implications does affective group membership have for essential outcome variables, such as political trust over that same snapshot time?
Given widespread affective polarization in the American public (Iyengar & Westwood, 2015; Iyengar & Krupenkin, 2018; Már, 2020; Iyengar et al., 2012), we expect partisans who like their inparty and dislike their outparty (the “Classically-Polarized”) may be most common. However, recent work finds that negative feelings toward one’s outparty and inparty are rising in the U.S. (Groenendyk, 2018), suggesting Double-Dislikers' increased prevalence. This may suggest the growing appropriateness of classical approaches to affective polarization and negative partisanship approaches to partisan affect.
Different combinations of inparty and outparty affect may also have distinct ramifications for other important affective variables, such as political trust. Political trust is vital to democracy for a variety of reasons, including its association with support for government officials and institutions (Hetherington, 1998), lawful compliance (Marien & Hooghe, 2011), and a government’s legitimacy and longevity (Easton, 1965). We expect the three affective groups will show differing levels of trust in government because partisan affect reflects different feelings about the two parties who may be in power. We hypothesize that (H1) those who like both parties (Double-Likers) will show higher levels of trust (relative to the Classically-Polarized), as they are likely to feel warmly toward either party in power. We also hypothesize that (H2) those who dislike both parties (Double-Dislikers) will show lower levels of trust (relative to the Classically-Polarized), as they are likely to feel colder toward either party in power.
Using inparty and outparty feeling thermometers from the 2020 American National Election Studies (ANES), we find that the vast majority of U.S. partisans feel positively toward their inparty and negatively toward their outparty (the Classically-Polarized). However, there are also some Double-Dislikers and Double-Likers. Surprisingly, the Classically-Polarized grew at the expense of the other two groups (including Double-Dislikers) from 2016 to 2020. Consistent with our two hypotheses, these groups are also associated with different levels of political trust. Relative to the Classically-Polarized, Double-Likers are associated with higher political trust, while Double-Dislikers are associated with lower political trust. Whereas overall trust did not change between 2016 and 2020, Double-Likers increased in their already high trust levels.
These results suggest the growing applicability of classical approaches to affective polarization, but not necessarily negative partisanship, to understanding the affect of American partisans. Despite their decline, other non-Classically-Polarized groups exist and display substantively meaningful relationships with political trust: Double-Dislikers trust government less, and Double-Likers increasingly trust government more, suggesting important reasons to theorize about and empirically investigate these affective groups as well.
Methods
The data presented are from the 2020 and 2016 ANES. We use these data as they are nationally representative, and although the two years contain distinct samples of participants, they feature consistent measures, allowing for temporal comparison between 2016 and 2020. Participant details, study measures, and analyses are described below.
Participants
Multinomial Logistic Regressions Using Robust Standard Errors Predicting Affective Group Membership (2020 ANES).

Note. Values represent exponentiated coefficients, and p statistics are in parentheses. * p < .05, ** p < .01, *** p < .001; with significant coefficients (p < .05) bolded for the reader. Each column corresponds to the coefficients for a given affective group. The Classically-Polarized group (whose members like the inparty and dislike the outparty) is the reference group. Individuals with low inparty and high outparty affect were included in the full model to ensure all combinations of positive and negative partisan affect. Still, due to their relatively small group size and theoretically distinct nature, these coefficients are not reported here and can be found in the online Appendix E.
Measures
To measure partisan affect, we use responses from two partisan feeling thermometers in the 2020 and 2016 ANES (ANES, 2016; 2019; 2020; 2021). The two thermometers were re-coded to represent the relative coolness/warmth (0–100) that participants felt toward their inparty and outparty. For Democrats and Democratic-leaners, the Democrat feeling thermometer was coded to indicate inparty feelings. In contrast, the Republican feeling thermometer was coded to indicate outparty feelings and vice-versa for Republicans and Republican-leaners.
These re-coded items were then used to classify the extent to which American partisans liked/disliked their inparty and outparty. Respondents who reported a greater than 50 value on the inparty or outparty feeling thermometer were classified as “liking” that party, whereas respondents who reported a lower than 50 value on the inparty or outparty feeling thermometer were classified as “disliking” that party.
Political trust was measured using Macdonald’s (2020) procedure: principal components analysis combined four standard trust items from 2020 American National Election Studies (Hetherington, 1998; 2005) into a single measure. The same procedure was used for the 2016 ANES. Each year’s single trust measure was then standardized to range from zero to one, where zero represents the lowest level of trust and one the highest. Party identification (Democrat, Republican), partisan strength (whether the respondent was a leaner), political interest (ordinal scale from never [1] to always [5]) were used, age (years), education (highest level of school completed), income (ordinal scale from under $9,999 [1] to $250,000 or more [22]), sex, and race (white excluded as the comparison category) were also used as demographic (and political) controls. See online Appendix B for question wordings.
Modes of Analysis
We compare the size of the affective groups in 2020 using single proportion z-tests. We examine changes in group size between 2016 and 2020 using a 2 Year (2016, 2020) by 3 Affective Group (Classically-Polarized, Double-Dislikers, Double-Likers) Chi-Square test.
Associations between the different affective groups and trust in 2020 are assessed using multinomial logistic regressions. In these analyses, the dependent variable is a categorical variable representing the affective groups (Double-Dislikers and Double-Likers, with the Classically-Polarized serving as a reference group), and the primary predictor of interest is political trust. Those models also include political affiliation, political interest, age, education, income, sex, and race/ethnicity as controls. 3 Finally, we compare changes in trust by group between 2016 and 2020 using a 2 Year (2016, 2020) by 3 Affective Group (Classically-Polarized, Double-Dislikers, Double-Likers) between-subjects ANOVA.
Results
Affective Group Size
In 2020
Figure 1 displays a scatterplot of Democrats’ and Republicans’ inparty and outparty feeling scores using the more recent 2020 ANES data. Higher values indicate more liking of the inparty (on the y-axis), and the outparty (on the x-axis), respectively. The figure divides between quadrants of partisans that like their inparty and dislike their outparty (“Classically-Polarized,” top left), like both their inparty and their outparty (“Double-Likers,” top right), dislike both their inparty and their outparty (“Double-Dislikers,” bottom left), and dislike their inparty and like their outparty (bottom right). Triangles represent Democrats and Democratic-leaners, and squares represent Republicans and Republican-leaners. Note that Democrats and Republicans show relatively similar patterns of partisan affect and are thus combined in further analyses. Scatterplot of Democrats’ and Republicans’ Inparty and Outparty Feelings Note. Squares represent Republicans, and triangles represent Democrats. Feeling thermometers range from 0 (coolest feelings) – 100 (warmest feelings) on each axis. The figure divides between quadrants of partisans that like their inparty and dislike their outparty (“Classically-Polarized,” top left), like both their inparty and their outparty (“Double-Likers,” top right), dislike both their inparty and their outparty (“Double-Dislikers,” bottom left), and dislike their inparty and like their outparty (bottom right).
Collapsing across Democrats and Republicans, most partisans and leaners in these data were “Classically-Polarized;” 85.5% (n = 5,421) of partisans and leaners liked their inparty while disliking their outparty, following the model expected by classic approaches to affective polarization. Per a single proportion z-test, this proportion was considerably higher than what might be expected by chance (25%), given four quadrant options, z = 111.3, p < .001. However, other combinations of partisan affect were also prevalent, even if less frequent. For instance, 8.2% (n = 521) of partisans (“Double-Dislikers”) disliked both their inparty and their outparty (significantly fewer than the Classically-Polarized, z = −174.8, p < .001)—consistent with negative partisanship models of partisan affect. Additionally, 4.2% (n = 267) of partisans (“Double-Likers”) liked both their inparty and their outparty (significantly fewer than the Double-Dislikers, z = −11.6, p < .001)—consistent with neither theoretical approach. 4
Changes Between 2016 and 2020
To provide a snapshot of how partisan affective group membership has changed over time, we examine the relative size of these groups across 2016 and 2020 using a 2 Year (2016, 2020) by 3 Affective Group (Classically-Polarized, Double-Likers, Double-Dislikers) independent-samples Chi-Square test. Figure 2 visualizes this comparison by reporting the sample percentage in each affective group in 2016 and 2020. Affective Group Size, as Percentage of Sample in 2016 and 2020 with 95% Confidence Intervals Note. Data are pulled from the 2016 and 2020 ANES. The Y-axis represents the percentage that each affective group makes up the total valid sample. Individuals with low inparty and high outparty affect were included in that total sample to ensure all combinations of positive and negative partisan affect were included. However, due to their relatively small group size and theoretically distinct nature, results with that group are not reported here, and can be found in online Appendix E.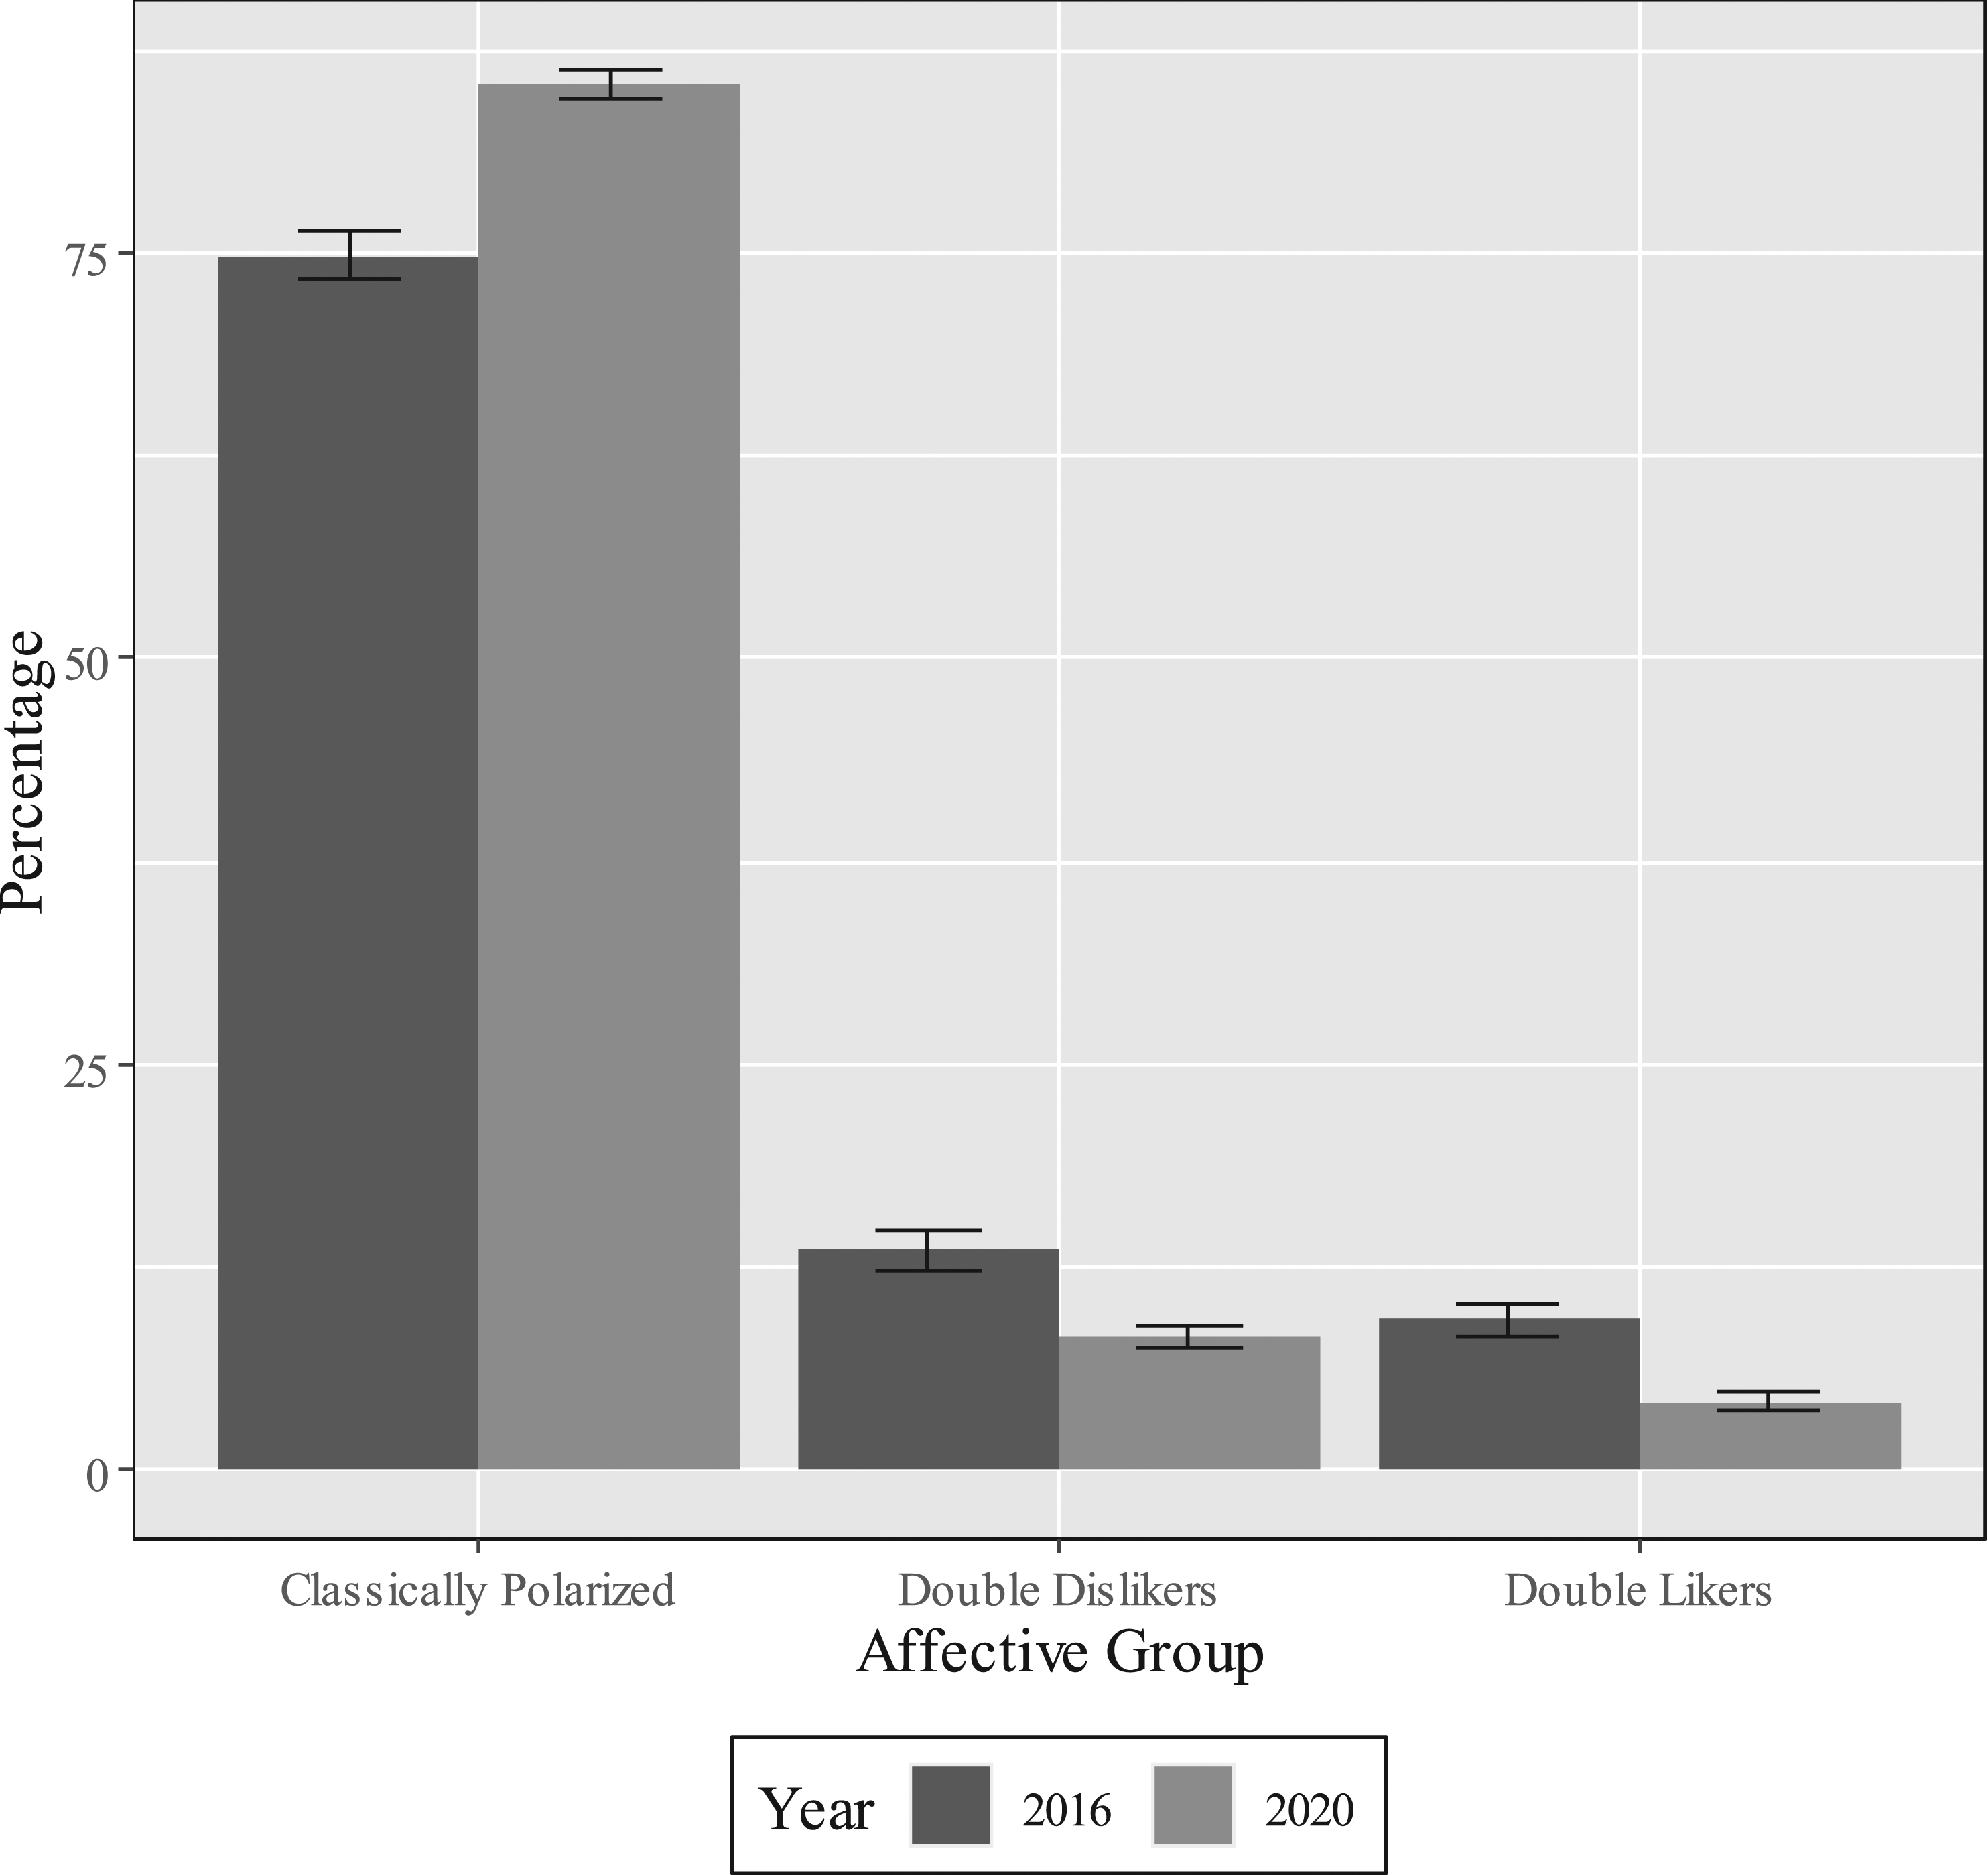
Results suggested significant changes (χ 2 (3) = 179.6, p < .001) across the four years. Specifically, the Classically-Polarized group grew significantly from 74.9% of the partisan sample in 2016 to 85.5% in 2020 (a 14.2% increase in size; z = 12.6, p < .001). However, this growth came at the cost of the Double-Liker group (from 9.3% in 2016 to 4.2% in 2020—a 54.8% reduction in size; z = -9.9, p < .001) and the Double-Disliker group (from 13.5% in 2016 to 8.2% in 2020—a 39.3% reduction in size; z = -8.1, p < .001), each of which shrunk significantly over the four years.
Affective Groups and Trust in Government
In 2020
Table 1 presents the results of multinomial logistic regressions predicting affective group membership from political trust and demographic controls using the 2020 ANES data. Coefficients are presented in exponentiated form, indicating each predictor’s relative risk of group membership. A coefficient of greater than one indicates an increased risk of membership in a specified group, and a coefficient of less than one indicates decreased risk. Note that the present analyses provide evidence indicating associations rather than causal relationships.
Consistent with H1 and H2, results show that, relative to the Classically-Polarized, Double-Likers are associated with higher trust in government (RR = 44.17, p < .001). In comparison, Double-Dislikers are associated with lower trust (RR = 0.04, p < .001).
Changes Between 2016 and 2020
Next, we examine the role these groups may play in any changes in political trust (measured as a z-score) between 2016 and 2020. The results of a 2 Year (2016, 2020) by three Affective Group (Classically-Polarized, Double-Dislikers, Double-Likers), revealed no significant overall differences in trust between the 2 years (M
2016
= - 0.02, SD
2016
= 1.42; M
2020
= - 0.01, SD
2020
= 1.36; F (1, 9,110) = 1.17, p = .19). Rather, changes in trust were dependent on group membership (F (2, 9,110) = 3.65, p = .026). Double-Likers were the only group that changed significantly,
5
increasing their level of trust between 2016 (M
DL2016
= 0.70, SD
DL2016
= 1.59) and 2020 (M
DL2020
= 0.99, SD
DL2020
= 1.58; F (1, 9,110) = 6.28, p = .012) Figure 3. Comparing Mean Trust in Government by Affective Group Between 2016 and 2020 with 95% Confidence Intervals Note. Data are pulled from the 2016 and 2020 ANES. The Y-axis represents the mean standardized trust index (0–1), and whiskers indicate 95% confidence intervals. Due to their relatively small group size and theorsetically distinct nature, partisans who reported low inparty and high outparty affect are not included in these analyses, but separate analyses with that group included can be found in online Appendix F.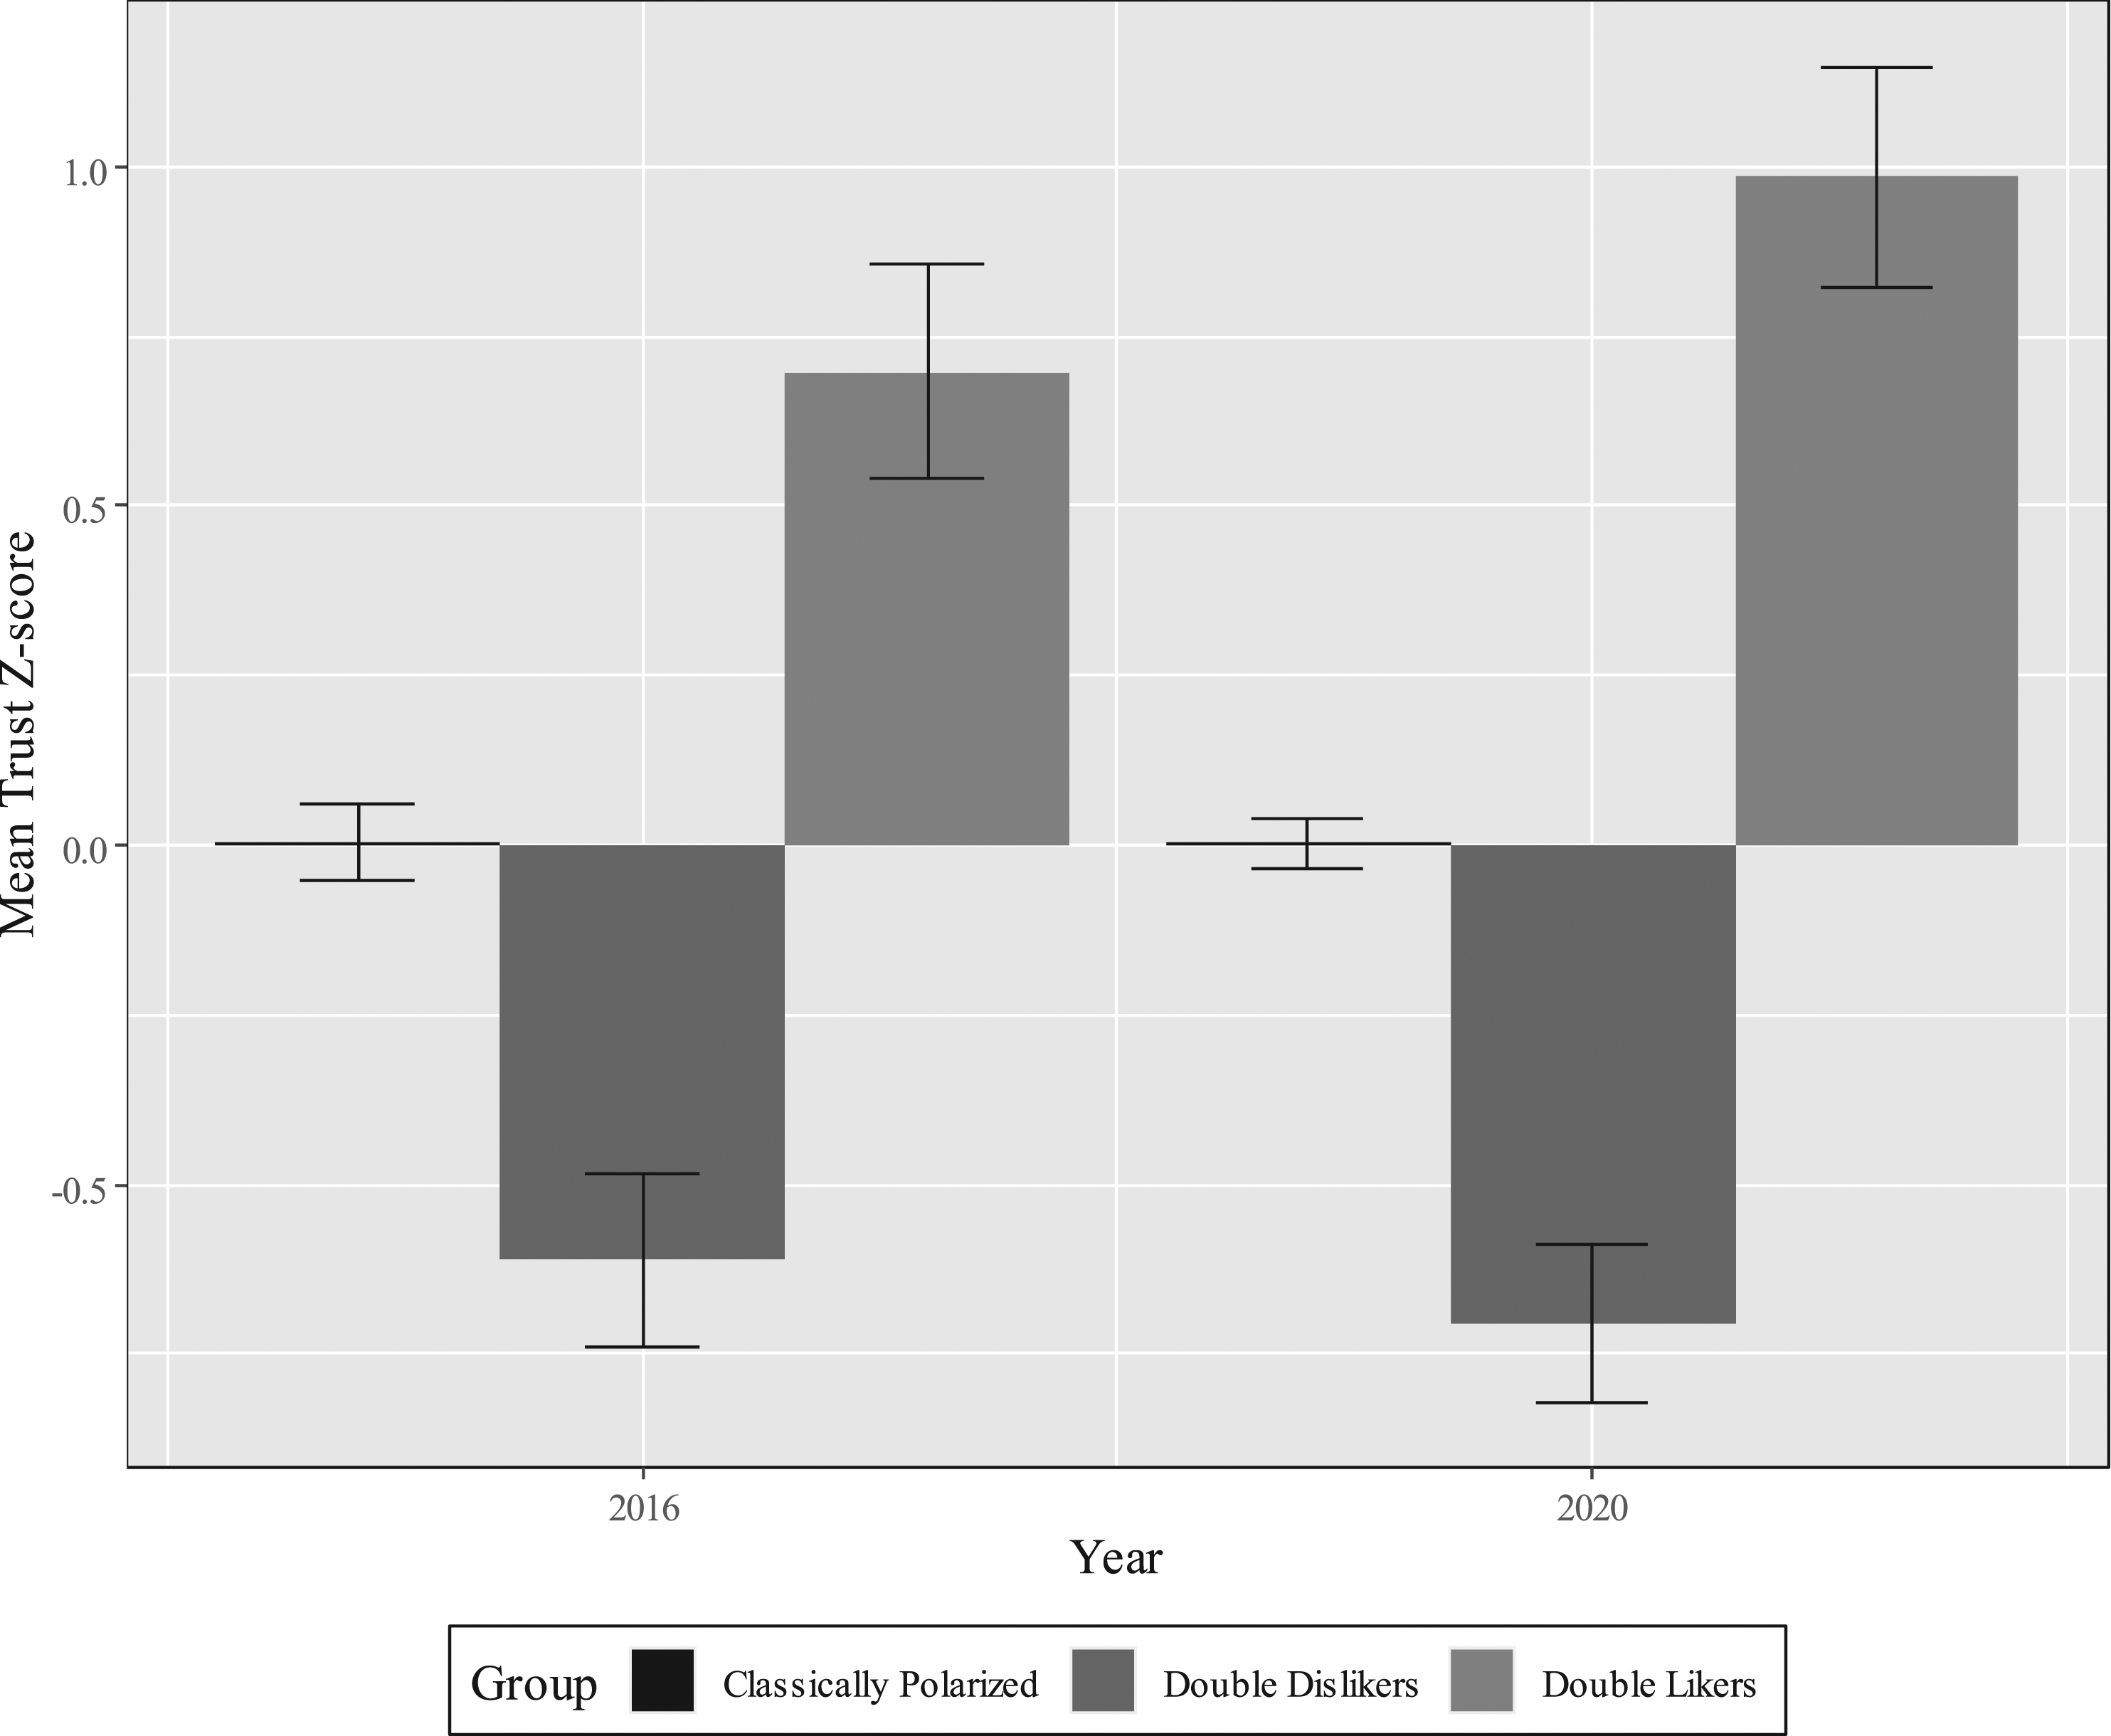
Notably, these results also replicated those of the 2020 multinomial regression analyses, using another method (ANOVAs) and another year (2016), offering another way to visualize support for our two initial trust hypotheses. In 2020 and 2016 alike, Double-Dislikers showed the lowest mean trust z-scores, the Classically Polarized showed intermediate mean trust-z-scores, and the Double-Likers showed the highest mean trust z-scores. 6
Discussion and Conclusion
The present work has a series of implications, particularly for the applicability of different theories of partisan affect and political trust. First, the results suggest that the vast majority of U.S. partisans (about 85% in 2020) like their inparty while disliking their outparty. This “Classically-Polarized” group is well-explained by “classical” approaches to affective polarization (Iyengar & Westwood, 2015; Iyengar & Krupenkin, 2018; Már, 2020; Iyengar et al., 2012). Moreover, despite recent cooling feelings toward the outparty and inparty alike (Groenendyk, 2018)—which would suggest the growth of Double-Dislikers—an increasing number of partisans are “Classically Polarized,” showing a roughly 14% increase between 2016 and 2020 at the expense of Double-Dislikers and Double-Likers. This growth implies the applicability of classical approaches to partisan affect to a growing share of American partisans. However, given the constraints of our temporal analysis, future work is necessary to understand the longer-term trends in the prevalence of these different affective groups.
Nevertheless, affective variability was still present, suggesting the utility of other theoretical models. Approximately 8% of partisans indicated disliking their inparty and their outparty alike (“Double-Dislikers”)—a group better captured by “negative partisanship” approaches to partisan affect (Abramowitz & McCoy 2019; Abramowitz & Webster 2016; 2019). In addition, 4% indicated liking both their inparty and their outparty (“Double-Likers”)—an affective group not well-explained by either classical approaches to affective polarization or negative partisanship.
Moreover, these smaller affective groups also had critical associations with a key outcome variable: political trust. In general—and consistent with our two hypotheses—Double-Dislikers showed significantly lower levels of political trust, whereas Double-Likers showed significantly higher levels of political trust. Notably, these results held whether modeled in comparison to the Classically-Polarized using multinominal regressions with several control variables or simple mean comparisons in between-subjects ANOVAs. The results also held whether using data from 2016 or 2020, suggesting the robustness of this trust relationship.
Interestingly, although it was the group least well-explained by the two major partisan affect theories emphasized here, Double-Likers were the only group to show significant changes in trust between 2016 and 2020. They showed the highest level of political trust each year, and Double-Likers also increased in that level of trust between 2016 and 2020 (albeit with separate samples of participants). Thus, given trust’s implications for institutional support (Hetherington, 1998), lawful compliance (Marien & Hooghe, 2011), and governmental legitimacy (Easton, 1965), Double-Likers may be important to investigate more closely in future empirical and theoretical approaches to partisan affect, as their investigation may provide practical lessons for improving trust in government.
Given that these affective groups may have key ramifications for both affective theory and predicting trust, it is notable that in our data, they are also associated with different demographic features. This may suggest specific heuristic cues for the applicability of different models of partisan affect and levels of political trust. For example, per Table 1, both Double-Dislikers and Double-Likers were younger, more likely to be partisan leaners, and less politically interested than the Classically-Polarized, suggesting that age, fully identified partisanship, and political interest may be signals of the greater applicability of classical models of affective polarization. By contrast, given that Double-Dislikers were more likely to be male and educated, those features may imply both greater applicability of negative partisanship models of partisan affect, and reduced trust. Finally, since Double-Likers were more likely to be non-White and less wealthy, the presence of those traits may imply the reduced theoretical applicability of classical models of affective polarization and negative partisanship alike but may also cue higher levels of political trust. Notably, no affective group was more or less likely to be a Democrat or Republican in 2020. However, Republicans were more likely to be Double-Dislikers than Classically-Polarized in the highly contentious 2016 election, implying that partisan events may affect the share of certain partisans in a given affective group. Future research should examine the causal order of some of these relationships and the robustness of these cues as predictors of membership in different partisan affect groups.
In sum, this work suggests the importance of differentiating between different kinds of American partisan affect groups, specifically, Double-Likers, Double-Dislikers, and the Classically-Polarized. Each implies the appropriateness of different models of partisan affect and shows distinct relationships with political trust, at least in two recent election cycles. We believe this suggests the promise of future theoretical and empirical work considering distinctions in the combinations of inparty and outparty affect and their relationships with outcomes such as political trust.
Supplemental Material
Supplemental Material - Do Partisans Always Like Their Inparty and Dislike Their Outparty? An Analysis of Partisans Across the Affective Spectrum
Supplemental Material for Do Partisans Always Like Their Inparty and Dislike Their Outparty? An Analysis of Partisans Across the Affective Spectrum by John Kergan Wagner, and Miss Adi Wiezel in American Politics Research
Footnotes
Acknowledgments
ANES Statement of Use: We acknowledge that the original collector of the data, ANES, and the relevant funding agency/agencies bear no responsibility for our uses of the data or for the interpretation or inferences based on these uses.
Declaration of Conflicting Interests
The author(s) declared no potential conflicts of interest with respect to the research, authorship, and/or publication of this article.
Funding
The author(s) received no financial support for the research, authorship, and/or publication of this article.

Supplemental Material
Supplemental material for this article is available online.
Notes
Author Biographies
References
Supplementary Material
Please find the following supplemental material available below.
For Open Access articles published under a Creative Commons License, all supplemental material carries the same license as the article it is associated with.
For non-Open Access articles published, all supplemental material carries a non-exclusive license, and permission requests for re-use of supplemental material or any part of supplemental material shall be sent directly to the copyright owner as specified in the copyright notice associated with the article.
