
Abstract
Introduction
There is currently no biomarker for progression-free survival (PFS) for patients undergoing treatment for metastatic renal cell carcinoma (RCC). The aim of our study was to evaluate computed tomography perfusion (CTp) blood flow as an early marker of PFS in patients with mRCC treated with targeted agents.
Methods
Associations between CTp blood flow and PFS were evaluated from prospective randomized evidence using univariable and multivariable Cox proportional hazards regression models with Harrell’s concordance index (c-index) in patients with mRCC randomized to receive one of three targeted agents (everolimus, bevacizumab, or pazopanib). Analyses included baseline tumor CTp blood flow (BF0) and changes in blood flow after 8 weeks of therapy (ΔBF). Demographic and clinical prognostic factors (International mRCC Database Consortium [IMDC] risk score and ECOG performance) were included in the models as covariates.
Results
The median PFS of the 55-patient cohort was 0.80 years (95% CI: 0.76-1.38 years), with no significant difference among the targeted agents. ΔBF and BF0 were significantly associated with PFS on univariable analysis (p=0.002 and p=0.013, respectively). Multivariable analyses incorporating all the above factors indicated that higher baseline BF0 (>166 mL/min/100g) and reduced ΔBF (<2.8%) were significantly associated with longer PFS (p<0.02).
Conclusion
CTp blood flow may have utility as independent prognostic and early surrogate markers of PFS in mRCC patients treated with targeted agents, surpassing clinical markers like IMDC risk classification. Higher baseline perfusion (BF0) delineates tumors responsive to targeted therapy, while reductions in perfusion (ΔBF) just 8 weeks after starting treatment are associated with longer PFS. These findings arise from randomized evidence, warranting further evaluations.
Keywords
Introduction
In therapeutics, there is always interest in discerning whether a particular treatment might be “working”. This is particularly pressing in oncology, where time is extremely valuable, and where tools to detect efficacy early in the course of therapy are at a particular premium. Delays in making this determination not only increase the risks and severity of toxicities of an ineffective therapy, but they can also delay the initiation of alternative, potentially more efficacious, therapies.
Progression-free survival (PFS) is a commonly-used endpoint in clinical trials and the concept on which it is based, namely, changes in tumor size, is frequently used in day-to-day patient management to assist in decisions of whether to continue or stop a given treatment. 1 Markers, both prognostic and surrogate, which can offer insights into this outcome, especially early in the course of a treatment, are extremely valuable. Prognostic markers provide information about an outcome based solely on initial (pre-treatment) features; while surrogate markers refer to factors available after commencement of therapy. 2 PFS is pivotal to clinical trials for experimental agents.
Computed tomography (CT) perfusion is a noninvasive imaging technique which has the potential, at least theoretically, to yield information that might offer these capabilities, particularly in the context of targeted antivascular agents in the treatment of tumors. CT perfusion imaging can yield a number of parameters which characterize aspects of tissue perfusion, such as blood flow (BF), blood volume (BV) and permeability surface-area product (PS).3-5 Targeted antivascular agents have been specifically designed to mediate effects on tissue vasculature. Several studies have shown that CT perfusion can detect changes in perfusion parameters in tumors within a few days or weeks after initiation of such agents.6-9 A limited number of studies have suggested that reductions in CT perfusion parameters may be associated with better responses, as assessed by progression-free survival.10,11
Targeted antivascular agents have been in the armamentarium of therapies for metastatic renal cell carcinoma (mRCC) since 2005.12-16 As with other tumors, studies in patients with mRCC have shown reductions in CT perfusion parameters, such as BF, BV, and/or PS, within weeks of initiation with these therapies.17-22 Some of these studies have also suggested, on univariable analyses, that reductions in CT perfusion parameters might be associated with longer PFS.20-22
Of note, these studies evaluated the CT perfusion parameters in isolation. They did not investigate the potential utility of CT perfusion in the wider context of known clinical prognostic factors in oncology and specifically in mRCC, for example, Eastern Cooperative Oncology Group (ECOG) performance status, Memorial Sloan Kettering Cancer Center (MSKCC) risk score and International Metastatic RCC Database (IMDC) risk score, and of standard clinical tumor response evaluations (Response Evaluation Criteria in Solid Tumors (RECIST)).23-27
The purpose of this exploratory study was to investigate the potential utility of blood flow derived from CT perfusion as an early biomarker of treatment response, specifically PFS, in patients with metastatic renal cell carcinoma treated with targeted agents. In the process, to evaluate the utility of CT perfusion blood flow in relation to conventional prognostic and surrogate markers of response and to assess their independent contributions to interrogation of prognosis.
Materials and Methods
Patients with mRCC enrolling to a prospective randomized clinical trial of 3 targeted agents were offered the option to also participate in the correlative CT perfusion study that forms the basis of the work herein. The 3 targeted agents were everolimus (mechanistic target of rapamycin (mTOR) inhibitor, 10mg daily), bevacizumab (vascular endothelial growth factor (VEGF) inhibitor, 10 mg/kg 2-weekly), and pazopanib (VEGFR inhibitor, 800 mg daily).
The principle inclusion criteria for the prospective therapeutic trial were: metastatic renal cell carcinoma of clear cell histology, prior nephrectomy, adults older than 18 years, no prior targeted antivascular therapy, Eastern Cooperative Oncology Group (ECOG) performance status 2 or less, and RECIST evaluable disease.27,28 Disease response assessments were undertaken at 8-week intervals (i.e. every two cycles) and evaluated by RECIST criteria, which formed the basis for determining the changes in sum-of-long-axis diameters (ΔSLD) and RECIST classification at 8-weeks, and PFS. 27 Progression-free survival was defined as the duration from initiation of treatment of one of the above agents to progression by RECIST criteria (or death).
Participation in the CT perfusion study also required a target metastatic lesion which was a contrast-enhancing solid mass, well-demarcated and larger than 2 cm. Lesions were in general the largest available and in locations which were least likely to be affected by imaging artifacts (CSN, 25 years’ experience in body imaging).
The over-arching clinical trial was a prospective, single-center, open-label, parallel-group randomized clinical trial approved by the institutional review board (IRB). Participants were randomized (1:1:1) among first-line therapies bevacizumab, pazopanib, and everolimus within a two-stage design for which different second-line salvage therapies were pre-assigned at enrolment. Randomization (implemented via Department of Biostatistics of the Institution using the Pocock-Simon method) was stratified by prior cytokine or vaccine therapy and MSKCC risk group. The allocation sequence was concealed to treating investigators. The CT perfusion study reported herein, also approved by the IRB, was a prospective correlative imaging sub-study offered optionally to patients after they had been randomized on the above therapeutic trial. All patients provided signed informed consent to participate in both the over-arching clinical trial and the companion CT perfusion study. Blinding of interventions was not feasible because the three targeted agents have distinct routes of administration, schedules, and toxicity profiles; however, the investigators performing CT perfusion analyses were blinded to patient treatments and outcomes. The reporting of this study conforms to the CONSORT statements. 29
CT Perfusion
CT perfusion evaluations were undertaken at baseline (before therapy) and 8-weeks after the initiation of therapy. CT perfusion data were acquired of the target lesion using a 64-row multidetector CT scanner (VCT, GE Healthcare, Waukesha, WI), employing a two-phase protocol over a period of 590 seconds.30,31 The acquired images were registered using a semi-automated rigid registration algorithm. 32
CT perfusion analyses were undertaken with commercially available CT perfusion software (CT Perfusion 4D version 4.3.1, Advantage Windows 4.4; GE Healthcare, Waukesha, WI). The platform models tissue perfusion, which uses the distributed parameter model, and yields tissue perfusion parameters including blood flow (BF), blood volume (BV) and permeability surface area product (PS). 33 The CT Perfusion Body protocol, which employs a single (arterial) input function, was utilized, except for liver metastases, in which case a dual vascular input function was used (arterial and portal venous). The target tumor regions of interest (ROI) was delineated following carefully review of the source cine images and the generated parametric perfusion maps (CSN, 25 years’ experience in body imaging). Summary statistics of the voxel values of the perfusion parameters for the delineated tumor volumes of interest were obtained as previously described.31,34
Statistical Analyses
Statistical analyses interrogated associations between progression-free survival (PFS) and CT perfusion blood flow while accounting for established prognostic and surrogate factors. Progression-free survival was defined as the duration from initiation of treatment to progression or death. Patients alive without progression were right-censored at the time of last contact or end of study evaluation period.
PFS was estimated using the Kaplan-Meier method with Greenwood’s formula for interval estimation. Statistical summaries report the median follow-up and range. Median PFS are reported with 95% confidence intervals (CI) by treatment cohort. CT perfusion blood flow was summarized by median and interquartile range by each treatment cohort and overall. Evaluation of prognostic factors included available baseline features before therapy, namely, patient demographics (age, gender, race), ECOG performance score, IMDC risk classification, and baseline CTp blood flow (BF0). Analysis of surrogate factors included observed changes 8-weeks after initiation of therapy in CTp blood flow (ΔBF) and sum-of-long-axis tumor diameter (ΔSLD), respectively.
Univariable Cox proportional hazards regression estimated associations with PFS for each individual demographic and clinical factors: age (≤65 vs >65 years), sex (Female vs Male), race (White vs Other), ECOG score (0 vs 1,2), IMDC risk (1 [favorable risk] vs 2,3 [intermediate, poor]). For each variable, associations are described by hazard ratios (HR) reported with 95% CI and p-values arising from Wald Test. Reference levels are indicated by factor levels that are less than or equal to the threshold (≤). Multiple regression was applied to evaluate prognostic and surrogate models combining clinical and demographic features and RECIST status with CTp blood flow.
Harrell’s concordance index (c-index) is used to measure the predictive utility of the resultant linear model. 35 The c-index (which ranges between 0.5 and 1) extends the concept of area under the receiver operating characteristics curve used in classification settings to analyses of right-censored time-to-failure endpoints through evaluations of rank-ordered pairs. The statistic compares model estimated linear predictors and observed failure time durations among pairs of patients. A pair of patients (i and j) are considered “concordant” if patient j lives longer than patient i and the model estimates a higher relative risk of death for patient i when compared to patient j. The c-index describes the proportion of concordant pairs. The maximum value of 1 indicates perfect rank-ordering of linear predictors and observed failure-time durations. A value of 0.5 indicates random rank-ordering with no predictive utility. Thresholds were selected for CTp blood flow parameters over the grid of uniquely observed values to maximize the c-index. Univariable associations with PFS are described for each CTp blood flow parameter as binary predictors partitioned by its optimal threshold.
Sensitivity analyses assessed the robustness and internal validity of the selected models, using bootstrapping with 1000 replications was performed to compute optimism-corrected concordance indices. 95% CIs for corrected c-indices were derived from bootstrap percentiles. Leave-one-out cross-validation (LOOCV) results were summarized by reporting the median c-index across all leave-one-out folds, along with the interquartile range to capture variability in predictive utility. P-values of less than 0.05 were considered statistically significant. All statistical analyses were performed in R version 4.2.1 using the survival and boot package.36,37 The sample size of the CT perfusion sub-study was justified in the protocol (see Statistical Appendix).
Results
Enrollment to the CT perfusion study extended from January 2011 to March 2014, with follow-up through July 2018. There were 55 patients with mRCC who had CT perfusion evaluations at baseline and 8 weeks following the initiation of therapy who formed the basis of the analyses. 62 patients consented to participate in the CT perfusion study, which was an optional component of the over-arching therapeutic study (which enrolled 180 patients); 7 of the 62 patients withdrew consent prior to undertaking or completing their CT perfusion evaluations (Figure 1). The median age of the patients was 60.9 years (range, 34.9 - 83.0 years), with 38 men and 17 women. The demographic and clinical features of the patients are summarized in Table 1. Patient flows Patient Characteristics and Baseline CT Perfusion Parameters BF in mL/min/100g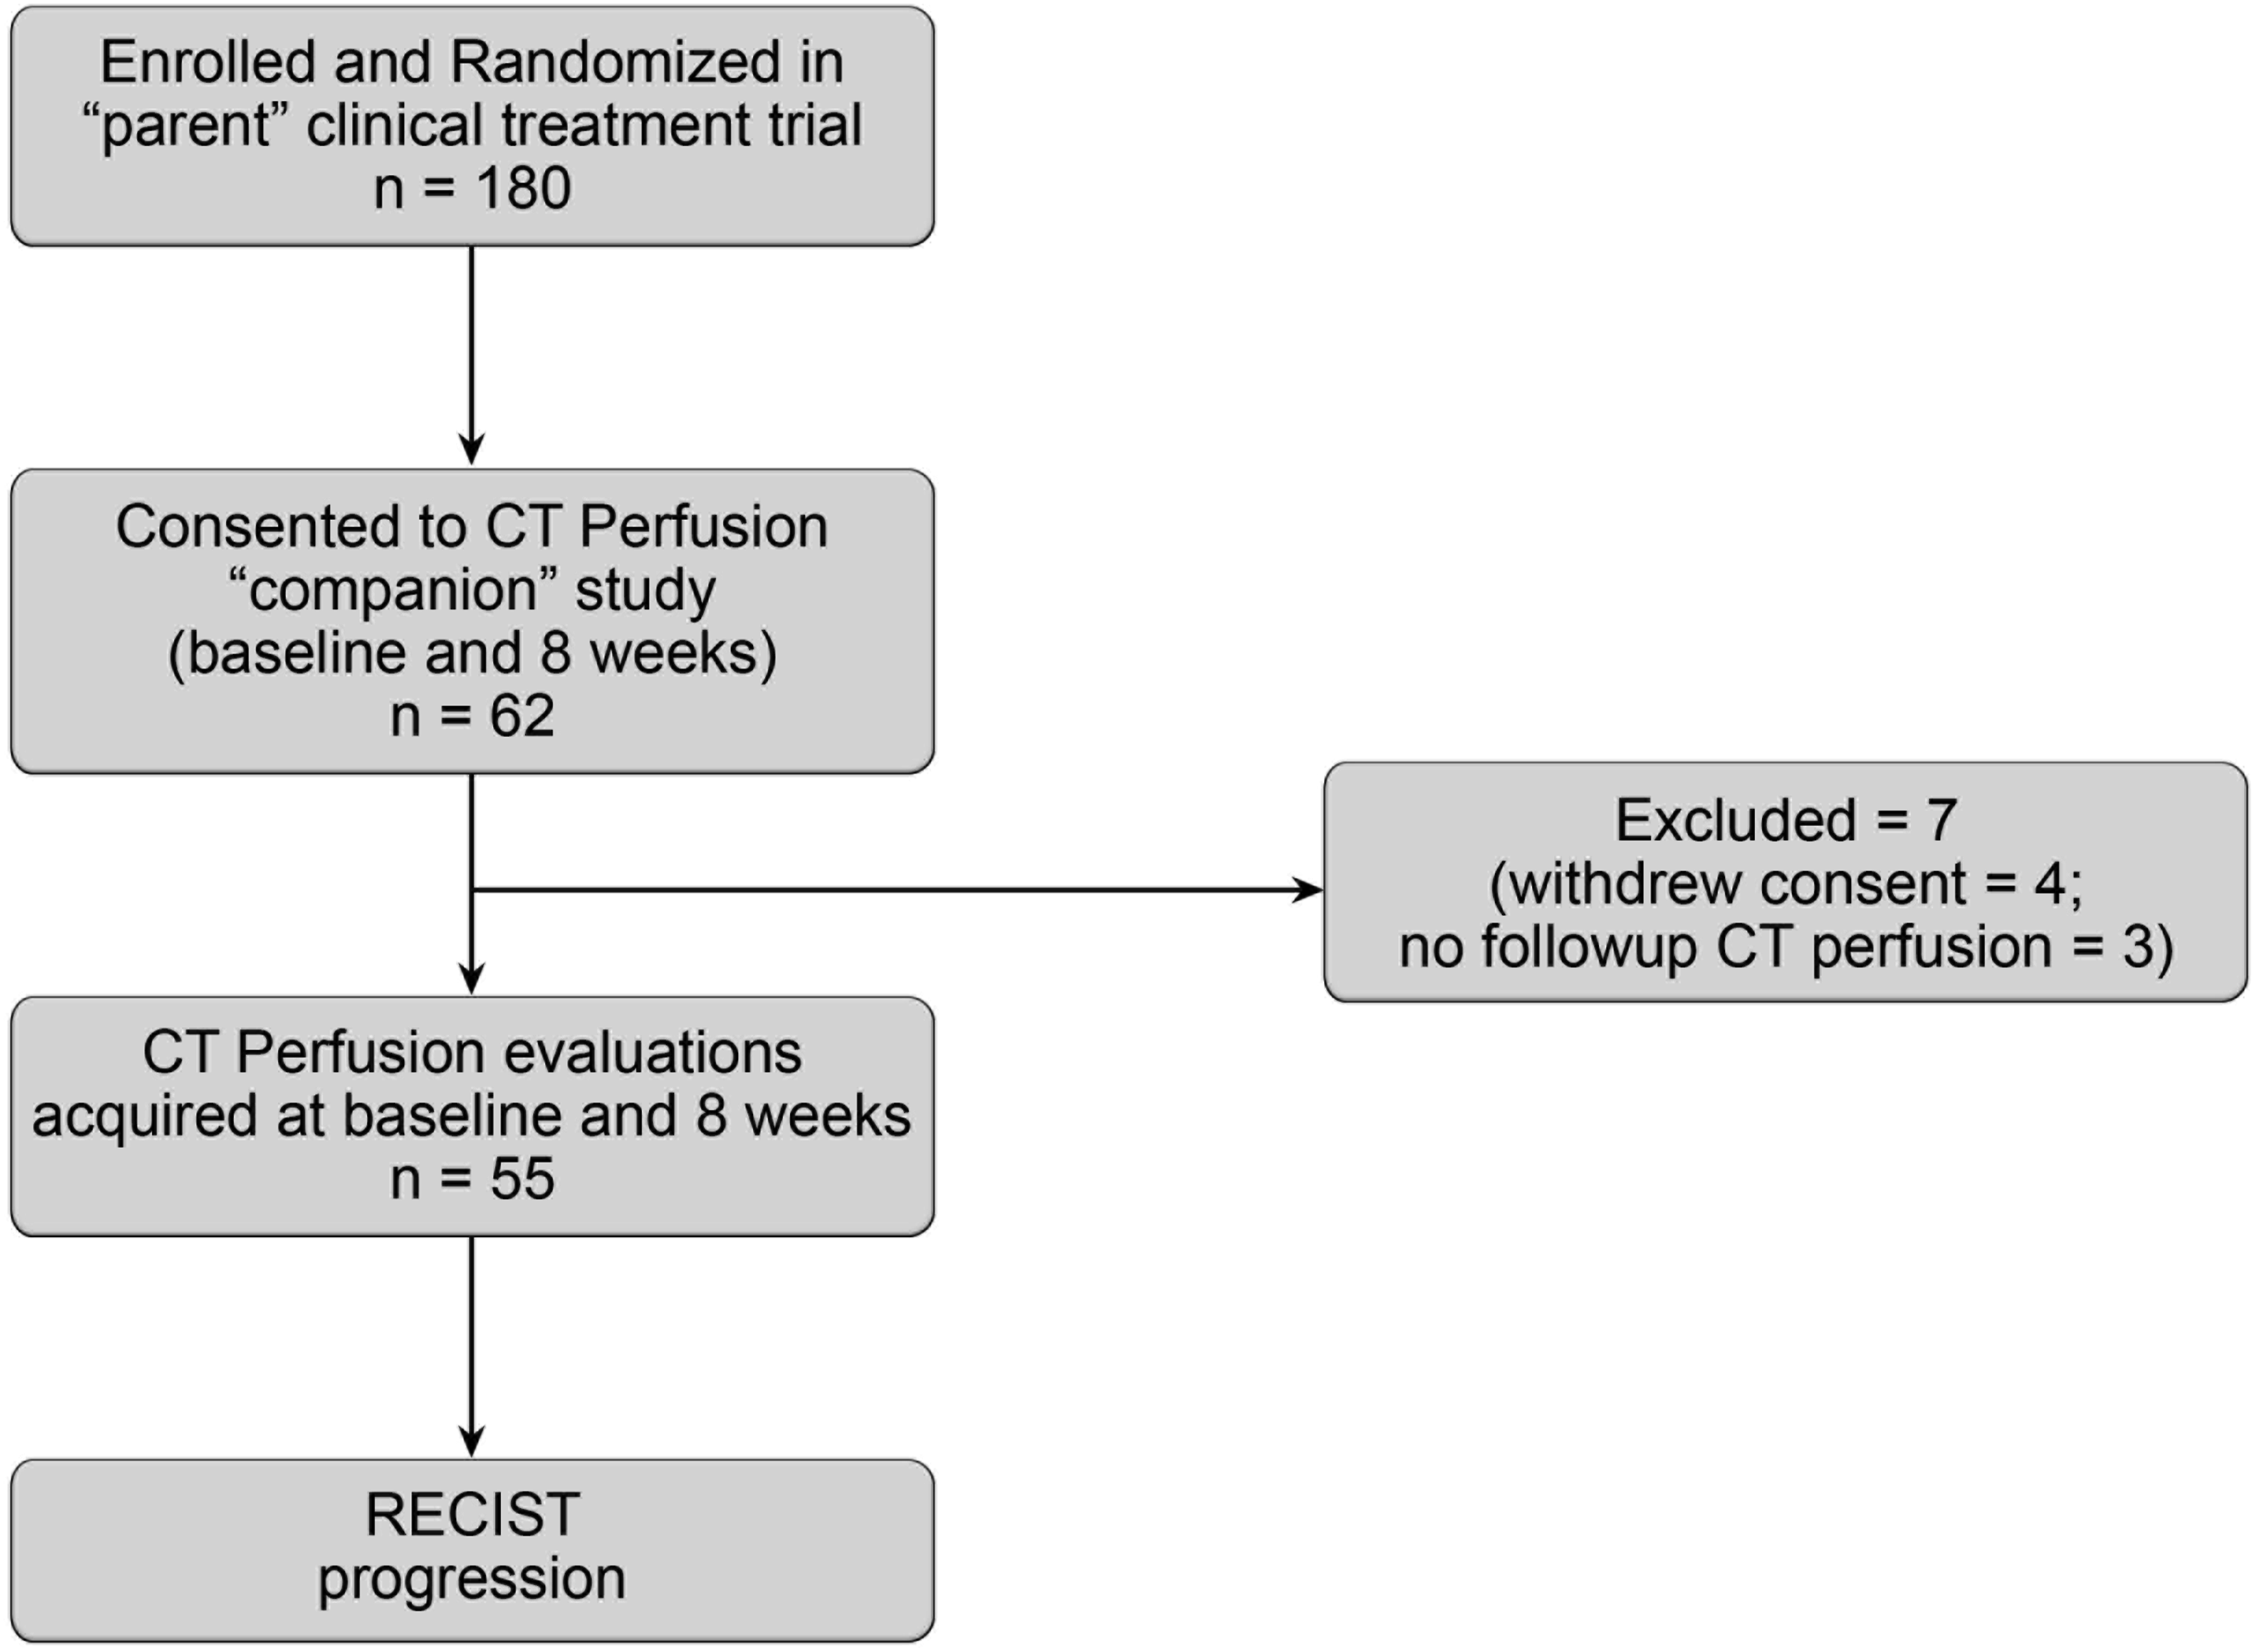

The median PFS of the 55 patients was 0.80 years (95% CI: 0.76, 1.38 years), with no significant difference among the targeted agents (p=0.116) (Figure 2). 12 patients were censored (5 because of toxicity and 7 for other reasons). Kaplan-Meier plots of progression-free survival by treatment *p-value from log-rank test for difference among all survival curves
The majority (29/55, 52.7%) of the target metastatic lesions were intra-abdominal, with 43.6% (24/55) intra-thoracic, as follows: 15 retroperitoneal implants/adenopathy/adrenal, 9 liver metastases, 5 pancreatic; and 11 lung metastases and 13 intrathoracic adenopathy. Bony and axillary metastases comprised one patient each. The median size of the target lesions was 3.1 cm (range, 1.8 - 7.7 cm); with median volume of 9.2 cm3 (range, 1.2 - 107 cm3).
Changes in Parameters at 8-Weeks and Outcome
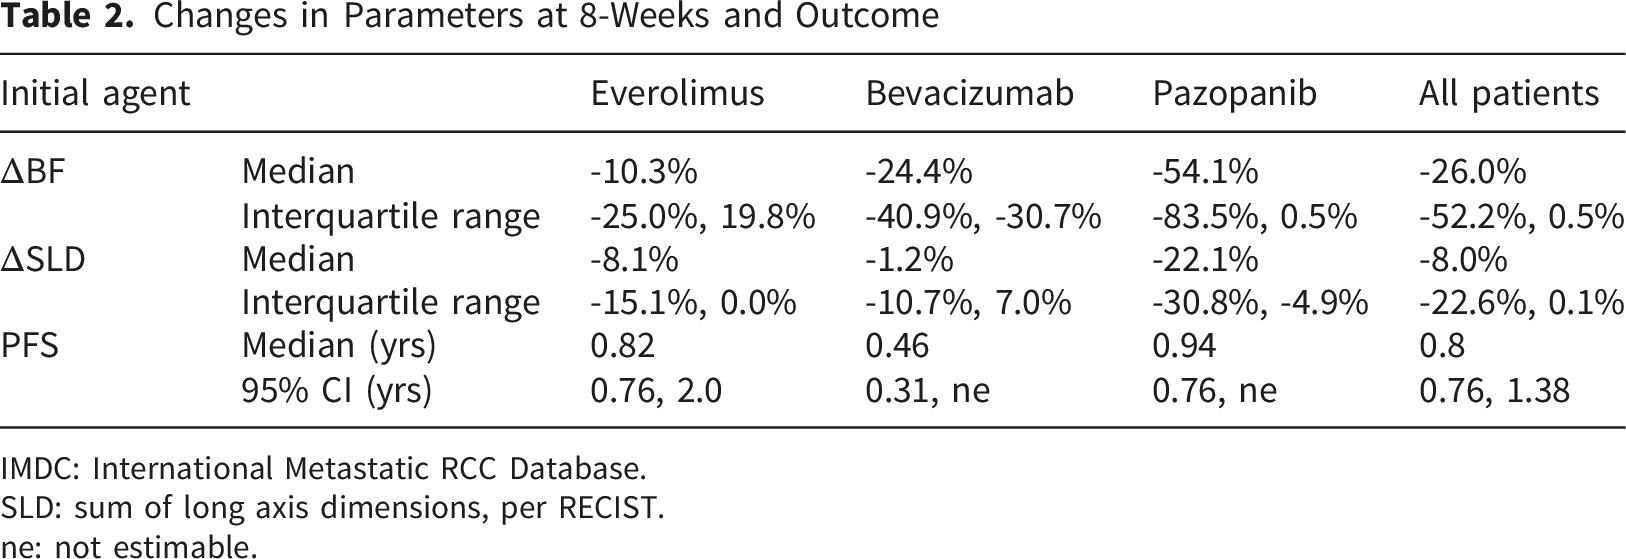
IMDC: International Metastatic RCC Database.
SLD: sum of long axis dimensions, per RECIST.
ne: not estimable.
Prognostic Factors
On univariable analysis, baseline CTp blood flow, BF0, was significantly associated with PFS (p=0.013). Conventional clinical prognostic factors (ECOG performance status and IMDC risk score) were not significant (p>0.17), while race was a borderline significant demographic factor (p=0.046). BF0 yielded a c-index (0.605) that was higher than those observed for conventional clinical prognostic criteria. Observing higher baseline values of BF0 (>166 mL/min/100g; HR=0.45, p=0.013) was associated with prolonged PFS, respectively (Figure 3, Table 3). Kaplan-Meier plots of progression-free survival by baseline features Univariable Cox Proportional Hazard Models for Progression-free Survival. BF in mL/min/100g. Hazard Ratios and Corresponding 95% Confidence Intervals are Reported With the Reference Group Represented by Patients With Values That are Less Than or Equal to (≤) the Reported Cutoff. *Significant

Multivariable Cox Proportional Hazard Models for Progression-free Survival

BF in mL/min/100g. Hazard ratios and corresponding 95% confidence intervals are reported with the reference group represented by patients with values that are less than or equal to (≤) the reported cutoff. Concordance index is presented for each model along with 95% confidence interval (CI), as well as the median and interquartile range simulated from leave-one-out cross-validation (LOOCV). *significant.
Bev = bevacizumab, Eve = everolimus, Paz = pazopanib.
Surrogate Factors
On univariable analysis, ΔBF was significantly associated with PFS (p=0.002) (Figure 4, Table 3). Multiple regression analyses evaluating post-treatment changes in CTp blood flow at 8-weeks after treatment while adjusting for baseline and clinical factors yielded ΔBF to be highly statistically significantly associated with PFS (p=0.008), with a significant contribution from baseline BF0 (p=0.044) (Table 4). The relative rate of progression or death was 2.86 times higher (p=0.008) for patients whose ΔBF increased by more than 2.8% following treatment. The findings were robust in regression models adjusting for randomization arm which yielded concordance index 0.69 (95% CI, 0.61- 0.77) (Table 4). Kaplan-Meier plots of progression-free survival by changes in CTp blood flow at week 8 and sum of long axis dimensions, per RECIST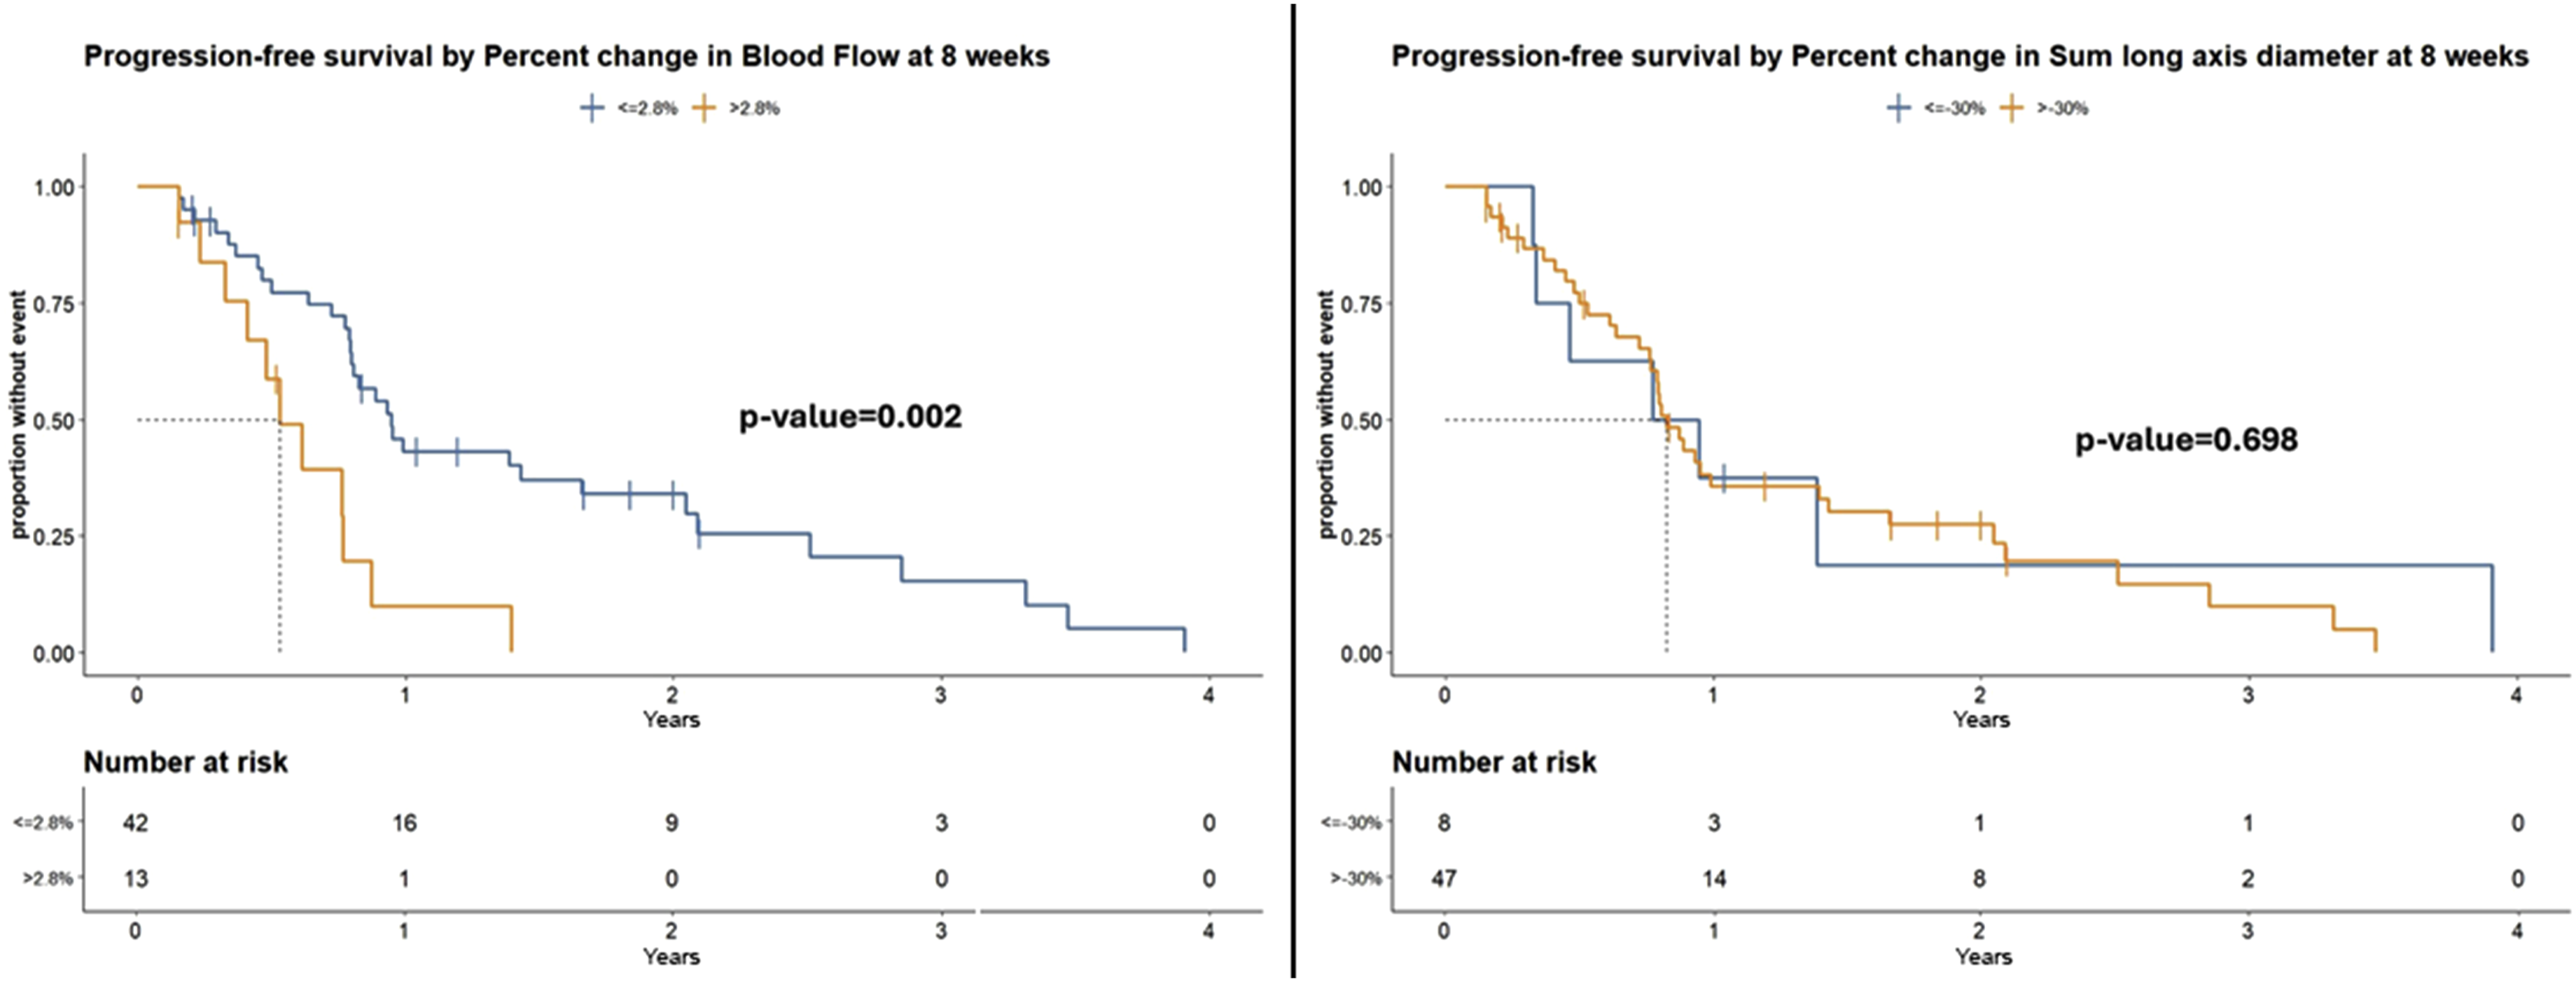
Discussion
Our results suggest that CT perfusion blood flow may offer utility as an early biomarker of treatment response in patients with metastatic RCC treated with the agents utilized. When considering baseline demographic, clinical and perfusion features and changes in CT perfusion blood flow after 8 weeks of therapy, multivariable analyses showed that changes in ΔBF and baseline BF0 were the only significant factors associated with PFS. Sensitivity analyses demonstrated robustness to sample variability. Interquartile ranges of replicate estimates of survival concordance from subsamples deviated negligibly from their overall estimates (Table 4). Furthermore, 95% confidence intervals for c-indices exclude the null value (0.5) for all models (Table 4), indicating that all concordance measures were statistically significant at the 0.05 level.
On univariable analyses, our results suggested that reductions in ΔBF were significantly associated with longer PFS. Previous studies of patients with metastatic RCC and other tumors treated with antivascular agents have reported similar findings.10,11,20-22,38 It is to be expected that antivascular agents would mediate effects on perfusion, specifically, reduce blood flow; it is reassuring that such changes in perfusion might be associated with treatment outcome, thereby potentially offering some surrogate utility.
It is perhaps less well appreciated that baseline perfusion may also have an impact on treatment outcomes. On univariable analyses, our results suggest that high baseline perfusion (BF0) and its correlate blood volume (BV0) [results not shown], might be associated with longer PFS. A few studies of patients with metastatic RCC have also reported similar associations, specifically BV.19,20,22
Importantly, these prior studies did not interrogate the interactions of the individual CT perfusion findings (changes and baseline) with more robust multivariable analyses, in which other factors known to influence patient outcomes might also be incorporated. These include general and specific clinical prognostic factors, such as ECOG performance status for oncologic patients, and IMDC risk groups for patients with metastatic RCC treated with targeted antivascular agents. In many clinical settings, demographic factors may also impact outcomes. When such multivariable analyses were undertaken, our results suggest that only CT perfusion parameters (both changes and baseline) were significantly and independently associated with PFS.
The analyses reinforced the univariable findings that increases in ΔBF are significantly associated with shorter PFS. Other factors (clinical and demographic) were not independently significant and were displaced from the model.
Tumor size, per RECIST, is widely used in oncology to assess treatment efficacy and response. One difficulty in the context of targeted antivascular agents is that these drugs are typically cytostatic, rather than cytotoxic. 39 Consequently, the agents induce little or no change in tumor sizes, especially initially, as borne out by the modest changes in tumor size observed at the first restaging (8 weeks) evaluations in our study (-8%) (and indeed subsequently at 16 weeks (-3.7%) and 24 weeks (2.6%)). In comparison, changes in CT perfusion blood flow at 8 weeks (ΔBF) was observed to be notably larger (-26.0%).
The changes in CT perfusion blood flow were assessed at 8 weeks. This corresponded to the first restaging timepoint in this study, and the CT perfusion evaluation could also conveniently be undertaken at the same time as routine CT restaging. If it were possible to have an indication of the likely response or otherwise to therapy at a relatively early timepoint after the initiation of therapy, there is then the opportunity to not delay in transferring to alternative treatments, thereby reducing potential toxicities, cost and lost time.
PFS is an important measure of treatment response in oncology. It is a widely utilized endpoint in clinical trials as it can provide a readout more expeditiously than overall survival (OS), and is not confounded by subsequent therapies. It is also commonly accepted as a regulatory endpoint.
Our study has a number of limitations. The number of patients in the study was small. One consequence was that we were not able to incorporate additional CT perfusion parameters into a single multivariable analysis. However, since BF and BV are highly correlated, only one of these would be required in any model. Despite these limitations, there were sufficient patients in combination to apply robust analytical principles, which in turn yielded important results. However, there would still be a need to undertake larger studies to confirm or not the overall findings. Despite being underpowered relative to its original design (see Statistical Appendix), associations between CT perfusion blood flow and progression-free survival were evident in this randomized clinical trial. The specific thresholds reported, however, should be considered hypothesis-generating. Further research will be required to confirm the results and refine statistical thresholds for clinical interrogation in a larger, multi-center trial administering the current generation of first-line therapies.
Our CT perfusion evaluations were limited to one target lesion per patient, which therefore did not allow for assessment of the potential heterogeneity in responses amongst different metastases in the same patient, which can be encountered. Unfortunately, the total volume of tissue that can be interrogated by the CT perfusion technique at present is essentially limited by the z-axis footprint of detectors. In comparison, current RECIST evaluations are themselves limited to a maximum of 2 lesions in one organ, and a maximum of 5 in total.
Our analyses used CT perfusion parameter thresholds which were optimized with the specific data of our study. Larger studies would be needed to determine robustly applicable thresholds.
Conclusion
Evidence acquired in this randomized clinical trial suggests that CT perfusion blood flow may provide an early biomarker for PFS in patients with metastatic RCC treated with the targeted agents under study. It is possible that CT perfusion blood flow might also have utility as an early biomarker of treatment response in other therapeutic and oncologic settings. However, both areas would require further studies and evaluation.
Supplemental Material
Supplemental Material - CT Perfusion Blood Flow Provides an Early Response Marker for Progression-free Survival in a Prospective Randomized Clinical Trial of Metastatic Renal Cell Carcinoma
Supplemental Material for CT Perfusion Blood Flow Provides an Early Response Marker for Progression-free Survival in a Prospective Randomized Clinical Trial of Metastatic Renal Cell Carcinoma by Chaan S. Ng, Yanwen Chen, Wei Wei, Adam G. Chandler, Brian P. Hobbs and Nizar M. Tannir in Technology in Cancer Research & Treatment.
Footnotes
Consent to Participate
The studies were approved by the institutional review board (IRB) of University of Texas MD Anderson Cancer Center Protocol number 2009-0845 (approved 3rd March 2010) and all patients provided signed informed consent to participate in the study.
Funding
The authors disclosed receipt of the following financial support for the research, authorship, and/or publication of this article: The work was supported in part by the John S. Dunn, Sr. Distinguished Chair in Diagnostic Imaging.
Declaration of conflicting interests
The authors declared no potential conflicts of interest with respect to the research, authorship, and/or publication of this article.
Disclosures
CSN was previously a consultant to GE Healthcare. AGC was previously employed by GE Healthcare. NMT is a Scientific Advisor to Nektar Therapeutics; Pfizer, Oncorena. Eli, Lilly, Eisai Medical Research, And Consultant to Bristol-Myers-Squibb. Pfizer; Nektar Therapeutics. Exelisis, Inc, Eisai Medical Research. Eli Lilly, Oncorena; Calithera Bioscience; Surface Oncology; Novartis, Ipsen; Merck Sharp & Dohme. BPH is a Scientific Advisor to Amgen, STCube, Bayer HealthCare, Pharmaceuticals Inc., Presagia. And Consultant to Pfizer. YC, WW have no disclosures.
Supplemental Material
Supplemental material for this article is available online.
Appendix
References
Supplementary Material
Please find the following supplemental material available below.
For Open Access articles published under a Creative Commons License, all supplemental material carries the same license as the article it is associated with.
For non-Open Access articles published, all supplemental material carries a non-exclusive license, and permission requests for re-use of supplemental material or any part of supplemental material shall be sent directly to the copyright owner as specified in the copyright notice associated with the article.