
Abstract
Performance measurement systems (PMSs) are developed and implemented to support the accomplishment of objectives of an organization or organizational initiative. PMSs are structured to enable monitoring of performance. This monitoring is accomplished through the identification of areas of concern and success, with the ultimate goals of developing organizational capabilities and enhancing organizational learning. This article reviews the literature on performance measurement and its implementation, and proposes a model to guide the development and implementation of PMSs. The article concludes with a consideration of the broader implications of PMSs and provides recommendations for future research in PMSs with regard to human resource development.
Decades ago, performance measurement systems (PMSs) were generally undertaken to broaden an organization’s accounting systems (Neely, 1999). In the 1940s and 1950s, there was a growing recognition of Japanese industries’ high effi-ciency and success. Subsequently, Western companies sought to replicate Japanese performance management practices. This attempt led to the blossoming of the field of performance measurement (PM) during the 1970s and 1980s (Nudurupati, Bititci, Kumar, & Chan, 2010). This growth culminated in the 1990s, in what has been termed a “revolution” in the field of PM (Neely, 1999). In the span of about 2 years, close to 4,000 articles were published on the topic, which tallies to “one new article on business performance every five hours of every working day“ (p. 207). While the rate of article production has waned, interest in performance metrics is still keen.
Presently, the norm for measuring organizational and initiative outcomes is through the use of PMSs (Nudurupati et al., 2010). The goal of PMSs, as related by Harbour (2011), is to “provide performance-based data that can be easily converted into actionable performance-based knowledge, thus enabling users to understand, manage, and improve what they measure” (p. 5).
Indeed, a recent article in the Economist (“Management: Reinventing the Company,” 2015) described the emergence of a new type of organization. These new entrepreneurial entities are not concerned about going public or about accounting procedures; instead, they “measure how they are doing using performance indicators (such as how many products they have produced)” (“Management: Reinventing the Company,” 2015, Section: The New Menagerie, para. 2).
Problem and Research Questions
Although much literature exists regarding PMSs, it exists primarily in the business and management literature. There are only a small number of articles in the human resource development (HRD) literature related to PMSs. Furthermore, these articles have tended to focus on issues of evaluating HRD interventions rather than on measurement of organizational activities. As a result, questions still remain concerning ways of choosing and implementing PMSs. In the effort to examine these concerns, the following are the questions guiding the present work:
Given these questions, we offer a model for use in developing and implementing a PMS. Such a model will enable practitioners to determine appropriate interventions to aid individuals, groups, and the organization in the use of the PMS adopted by the organization. This model is followed by suggestions for HRD practitioners. We also provide recommendations for continued research on issues related to PMSs in HRD and organizational development.
Methods for Conducting the Literature Review
This literature review was conducted around a strategic framework as discussed by Torraco (2011). Journal articles, books, online resources, and other literature related to PM were identified through keywords drawn from the themes, specific subjects, and PM areas of focus. Key search terms included performance indicators, performance measurement, PI, KPI, organization and performance indicators, private industry performance indicators, governmental performance indicators, foundations and public sector performance indicators, organizational constraints performance indicators, performance indicators and learning, performance indicators and accountability, dashboards, performance prism, development of performance indicators, organizational change performance indicators, politics performance indicators, social conflicts performance indicators, limitations performance indicators, and emerging patterns performance indicators. Databases and resources searched included Academic Search Premier, Business Source Premier, EBSCOhost (includes Medline), Education Research Complete; ERIC; LexisNexis Academic, Nursing Resource Center, Nursing and Allied Health Collection, Nutrition Abstracts, ProQuest Direct, PsycINFO, WorldCat, and a regional library system catalog. The abstracts of 188 sources were reviewed. Those articles found most relevant to the keywords, as related to HRD, were chosen for inclusion. Articles not relevant to PMS development and implementation and those not related to PMS in HRD were rejected. In addition, the following journals were searched: Advances in Developing Human Resources, Human Resource Development International, Human Resource Development Quarterly, and Human Resource Development Review.
Identified resources were reviewed through a multistage process. First, article abstracts were scanned and archived. Next, selected references were placed under their germane topic headings in a working outline, similar in use to a concept matrix (Webster & Watson, 2002). Complete readings were then conducted, and further screening ensued. In addition, numerous older articles were identified through the citations and reference lists of newer sources.
As noted, we then synthesized the findings from this review into the creation of a model for the development of a PMS by organizations. The model emphasizes communication and systematic decision making, while recognizing the flexibility needed to be relevant across a range of organizational contexts.
Definitions
Performance Measurement is defined as “the process of quantifying the efficiency and effectiveness of past [organizational] actions” (Neely, Adams, & Kennerley, 2002). The PMS is defined as the mechanism by which organizations engage such processes.
The term performance indicator (PI) is applied in various disciplines in numerous ways. Organizations often engage with what they identify as PIs when in fact they are operationalizing other PM tools. This misapplication of terms and concepts often results in miscommunication:
The words frequently used in the performance measurement field include performance measure, metric, performance indicator, key performance indicator (KPI), key result indicator (KRI), performance measure, lead indicator, lag indicator, initiative, strategy, goal, objective, target, priority, critical success factor (CSF), key result area (KRA), strategic theme, vision, mission—and no doubt many more. The problem isn’t the sheer volume of words we use. The problem is that we use them differently, with varying and overlapping meanings, and we fail to explain our meanings to each other. (Barr, 2014, paras. 1 and 2)
Parmenter (2010) distinguished four distinct types of performance measures:
(a) Key result indicators (KRIs) tell you how [well] you have done in perspective or [what] critical success factor [may exist]; (b) Result indicators (RIs) tell you what you have done; (c) Performance indicators tell you what to do; and (d) KPIs tell you what to do to increase performance dramatically.(p. 1)
Key result indicators (KRIs) are expressed as measures which provide the vision of where you are going by “giving you a picture of whether you are traveling in the right direction. They do not, however, tell you what you need to do to improve results” (p. 2).
RIs summarize activity and all financial performance measures are RIs. . . . KPIs represent a set of measures focusing on those aspects of organizational performance that are the most critical for the current and future success of the organization. (pp. 3-4)
PIs are
instruments that tend to [denote] the health, progress and/or success of a project, process, or area of service delivery. They focus on resources and processes that are most likely to lead to successful outcomes and are usually short, focused, relevant, measurable, repeatable, and consistent. (smartKPIs.com, 2010, para. 2)
Furthermore, PIs, as a measure of an organizational goal, help teams align themselves with their organization’s strategy. PIs are “nonfinancial and complement the KPIs; they are shown on the scorecard for each organization, division, department, and team” (Parmenter, 2010, p. 3). In addition, PIs are not expressed in financial terms; they are appraised on a short-term basis (daily, weekly, monthly, or quarterly) and are ordinarily reported on a team’s scorecard (or other reporting format); they are tied to specific activities and therefore to specific teams, and the activity to which they are aligned affects at least one of the organization’s critical success factors. Bours (2014) noted that indicators and measures are two distinct concepts. For example, an indicator of a table’s size is that it can seat six people, while a measure of its size describes it as 6 feet by 3 feet.
PMS Usage
Most PM frameworks have the capacity to accomplish a number of beneficial outcomes. A partial list, as suggested by Artley and Stroh (2001), includes (a) identifying goals; (b) surfacing and correcting issues; (c) portraying and enhancing processes; (d) detailing progress; (e) helping to determine effectiveness and efficiency of programs, processes, and individuals; (f) determining if initiatives are fulfilling vision and meeting strategic goals; (g) providing assessable results for goals; and (h) determining effectiveness of specific parts of organizations. For these outcomes to be realized, as noted by the U.K. Audit Commission (2000), PMSs should possess the following characteristics: clarity of purpose, focus, alignment with organizational goals, balance, regular refinement, and robust PIs (Given, 2005).
Lines (2005) suggested that PMSs can be used for institutionalizing organizational change, while Alagaraja and Shuck (2015) indicated that PMSs align organizational learning efforts with strategic planning activities. Stolz and McLean (2009) argued, in an analysis comparing three HRD interventions focused on corporate citizenship and organizational development, that one of the important organizational subsystems was the PMS. Improving the efficiency of organizational functioning was found to increase employee involvement, although it proved difficult to implement because of the changes that it required in PMSs and other management systems.
Private industry employs numerous types of PMSs. Some of the more notable include the following: (a) Strategic Measurement and Reporting Technique (Cross & Lynch, 1988), (b) The Performance Measurement Matrix (Keegan, Eiler, & Jones, 1989), (c) Results and Determinants Framework (Fitzgerald, Johnston, Brignall, Silvestro, & Voss, 1991), (d) Balanced Scorecard (BSC; Bhagwat & Sharma, 2007; Kaplan & Norton, 1992, 1996a, 2001), (e) Cambridge PMSs Design Process (Neely et al., 2000), (f) Integrated PMSs (Bititci, Carrie, & McDevitt, 1997), (g) Performance Prism (Neely et al., 2002), and (h) European Foundation for Quality Management Business Excellence Model (European Foundation for Quality Management, 1999); (Nudurupati et al., 2010). Firms apply these and numerous other PM models to appraise various aspects of organizational success.
In one study, Eker and Eker (2009) examined data from 122 Turkish manufacturing firms to analyze their implementation of diverse PM frameworks with respect to organizational culture. Their work clarified a number of utilizations of PM, including monitoring, attention focusing, strategic decision making, and legitimization, that is, utilizing PMS to obtain a base for strategic or ordinary decisions (Malina & Selto, 2001). Of interest was the finding that firms which employ PM exclusively for monitoring and legitimization have a top-down “control” cultural structure, while organizations that utilize PM for a variety of functions in addition to monitoring (e.g., focusing attention and strategic decision making) have a more “flexible” organizational culture.
Governmental and nonprofit PM models used for creation, implementation, and management of PIs have many similarities with that of the private sector (Neely, 1999; Osborne & Gaebler, 1992). For example, with increasing pressures on governmental agencies to enhance performance and with the financial crisis of the last decade, economic efficiency considerations have become increasingly important to public-sector PM. However, in comparison with the private sector, financial considerations play a smaller role in the pressure to measure performance (Mackie, 2008). As of 2004, he noted, governmental efforts to measure agency performance had evolved into attempts to measure a society’s overall quality of life. As noted by Ogata and Goodkey (2002), “Economic and financial indicators can only provide a limited perspective of the overall well-being of society” (p. 261). Instead, there is an increased effort to measure societal indicators. Other researchers shared that their own efforts to quantify such qualitative indicators posed a challenge. This was a sentiment echoed by many (Chen, 2010; Kaplan & Norton, 1996a; Parmenter, 2010).
Popular PM Frameworks and Systems
Many PM frameworks exist with which to measure performance. Organizations, including public, private, and nonprofits, often meld or adapt PM frameworks to meet specific needs. Over the course of decades, this process of “smorgasbord” framework development by, multitudes of organizations, has created dozens if not hundreds of hybrid frameworks, most of which have not been reported in the literature (Boland & Fowler, 2000; Chow-Chua & Goh, 2002; Gooijer, 2000; Pun & White, 2005).
However, a systematic comparison of 10 explicit PM frameworks/systems was conducted by Pun and White (2005). The study examined six dimensions of performance, seven characteristics, and nine specifications and requirements related to the listed frameworks. In terms of ranking, the Cambridge PM Process (Bourne, Mills, Wilcox, Neely, & Platts, 2000; Neely et al., 1996) scored highest with compliance in all 22 of the criteria for performance. The Integrated PMS (Engineering and Physical Sciences Research Council, 1998; Bititci et al., 1997) and the Dynamic PMS (Bititci, Turner, & Begemann, 2000) ranked second, with 21 criteria. The most popular of the PM frameworks, the BSC (Kaplan & Norton, 1996a, 1996b, 2001) met 16 of the 22 criteria expressed by Pun and White and tied for seventh in their ranking.
Given the myriad options, making decisions about which frameworks to consider is a challenging process. The relevance of specific frameworks will vary for different types of organizations. Therefore, we begin by exploring strategic PM, and then move on to consider some of the better known and more commonly used approaches to the application of indicators.
Strategic PM
Strategic performance measurement (SPM) is a PM framework with the intentioned goal of impacting organizational strategy. As argued by Micheli and Manzoni (2010), the differences between SPM and other PMSs go well beyond semantic distinctions. Strategic performance measurementis unlike other measurement frameworks, in that it does not have as its focus one single project that aligns with current organizational purposes. Strategic PMSs (or SPMSs) are more detailed and designed to employ indicators incorporating multiple perspectives and causal linkages in their design, while operational PMS is concerned with more routine functions and activities of a business or organization (e.g., customer service, product fulfillment functions). These differences are considered the major distinction between the two.
The many potential functions of SPMSs can be grouped into four key roles. The first is “Diagnostics” which relates to strategy implementation. The second is the “Interactive role,” which reflects the use of SPMSs as a tool for communication both within the organization and with external stakeholders. This Interactive role is used to facilitate the development of new strategies. Third, SPMSs can be viewed as “Communication tools” when they are utilized to impart the core values, mission statements, and vision statements of organizations. The final role is that of “Boundary systems.” This function of the SPMS is developed to establish and enforce employee behavior within the organization. Micheli and Manzoni (2010) further noted that a SPMS is utilized to examine feedback loops which include both past performance and strategic objectives. Within the SPMS framework, it is important that each indicator be concretely defined in the design process and communicated during its execution.
BSC
The BSC can be viewed as a strategic organizing framework for action. The philosophy behind BSCs is that of, balancing functions; that is, making them equally weighted, reduces competition between functions (Artley & Stroh, 2001; Kaplan & Norton, 1996a). A balance is struck between short- and long-term goals, financial and nonfinancial indicators, and internal and external performance perspectives (Kaplan & Norton, 1996b). Ultimately, the BSC is considered a PMS, strategic management system, and communication tool (Kaplan & Norton, 1992, 1996a, 2001).
Scorecards can vary depending on the type of organization (for-profit vs. nonprofit; Chen, 2010). The number of perspectives that are measured can also vary depending on need. In addition, the chief indicators used in most models, such as financial measures, need not rank prominently in all models. As an example, “the mission of governments and non-profit organizations should be placed at the top of the balanced scorecard to measure its success” (p. 3007). However, Chen argued that nonprofits can learn from the for-profit sector to consider costs more closely. He suggested that after the mission and vision, the following should be considered: “(1) the financial and customer perspectives, (2) the internal process perspective, and (3) the learning and growth perspective” (p. 3010).
In terms of reporting, BSCs offer the ability for management to view an organization’s activities, initiatives, and/or project functions with comprehensive graphics. One purpose for launching a scorecard framework process is to mobilize the organization in a new strategic direction (Kaplan & Norton, 1996a). Schiff (2008) noted the importance of discussions, involvement, and approval of senior managers throughout an organization for the strategic development of BSC.
According to Kennerley and Neely (2004), the BSC model explicitly ties organizational strategy with measurement. However, Pun and White (2005) offered a more critical assessment, noting that the BSC does not link operations to strategic goals, does not provide fast or accurate feedback, is not considered easy to maintain, and typically does not involve key users during the development process. Ultimately, Pun and White noted that to accomplish intended outcomes PMSs must be integrated into organizational structure, align with current strategies, and include consistent improvement actions, which they contend that the BSC does not always do.
BSC implementation
Kaplan and Norton (1996a) noted the following as first steps in implementation: (a) clarify the organization’s vision and strategy, (b) communicate the strategy through management level, (c) launch cross-organizational strategic initiatives, and (d) each team develops its own strategies which are consistent with the organizational vision. These initial steps are generally implemented within the first year of scorecard development.
Further necessary actions for scorecard development are addressed in depth by Kaplan and Norton (1996a). Upon team completion of scorecards and strategies, approval for the plan and its implementation is sought. At a minimum, a monthly review of a team’s work is recommended, with quarterly strategy meetings also desirable. Subsequent refinement of the vision and updating of the scorecards are regularly scheduled and iterative processes. At the end of the first year, when management is satisfied with the strategy’s approach, the BSC can be disseminated throughout the organization. At this point, individual performance measures and incentives for participants at all levels of the organization are tied to the scorecard. During the second year of implementation, review and updates of a 5-year vision and budget for each perspective on the scorecard can begin, while monthly and quarterly meetings continue. Annual strategy meetings are also encouraged to make major course adjustments. By the end of the second year of scorecard implementation, all staff objectives should be tied to the scorecard through linkages to compensation.
Dashboards
Dashboards are often confused with BSCs or other PMSs, although they are distinct. A dashboard is used as a reporting mechanism for PM. According to Schiff (2008),
A dashboard is a graphical display, ideally suited to share the status of the various performance measures that make up the scorecard. Dashboards use familiar objects such as gauges, stoplights, and [other] graphs to make the performance information more intuitive to a wider audience. (p. 29)
As an example, a set of traffic light icons would be used to “signal variations from performance measure target values. A red light attracts the greatest attention for a significant undesirable deviation from target . . . A yellow light indicates caution for smaller deviations, or a trend toward a significant deviation” (p. 63).
The usefulness of dashboards is their ability to provide performance information in a timely and functional display. This capacity, in theory, increases the likelihood that superior decisions can be made (Bremser & Wagner, 2013). Potential additional benefits experienced through the use of dashboards can be the reduction of information overload, identification and filtering of critical information, and the replacement of complicated or boring reporting systems.
Dashboard implementation
The use of dashboards as a reporting mechanism is encouraged by PM experts (Allio, 2012; Bourne et al., 2000; Few, 2006b); however, there are factors to consider with regard to their development and implementation. Bremser and Wagner (2013) suggested that dashboard development involves the following steps: define the dashboard objective and metrics, seek user input, build and test the initial dashboard, and, finally, publish the dashboard and monitor its use.
Few (2006a) shared the 13 most common pitfalls encountered when designing a dashboard, as well as real-life examples of each and strategies for avoiding them. His pitfalls include the following:
(1) Exceeding the boundaries of a single screen; (2) Supplying inadequate context for the data; (3) Displaying excessive detail or precision; (4) Expressing measures indirectly; (5) Choosing inappropriate media of display; (6) Introducing meaningless variety; (7) Using poorly designed display media; (8) Encoding quantitative data inaccurately; (9) Arranging the data poorly; (10) Ineffectively highlighting what’s important; (11) Cluttering the screen with useless decoration; (12) Misusing or overusing color; and (13) Designing an unappealing visual display. (p. 3)
In defining the objectives of the dashboard, it is important to identify its purposes and by whom it will be used (Technology Affinity Group [TAG], 2013). Bremser and Wagner (2013) noted that the dashboard objective most usually utilized by management is that of realizing strategic goals. Once one has identified the purposes and users, it is beneficial to explore what information users want to see expressed in the dashboard. There is a need for limiting the focus of the dashboard. Expressing too many measures results in taxing people’s “limited working memory for diagnostic activity” (TAG, 2013, p. 65). They suggested engaging in a refinement process to hone measures to those which are the most important to express.
With respect to selecting a dashboard platform, there are many options from which to choose. Some examples offered by the TAG (2013) include Excel, existing grants management systems, plug-in reporting tools, and custom-built tools.. One useful resource for dashboard creation is Information Dashboard Design (Few, 2006b), which is a step-by-step guide for the creation of dashboards.
In the end, dashboards are meant to be iterative (TAG, 2013). They need to be examined frequently for continued viability, as data requirements will change and adaptations will need to be made.Performance Prism
Created by Neely (Neely, Adams, & Crowe, 2001), the performance prism is a second-generation PM framework. This framework considers some of the failings of its predecessors and attempts to ameliorate them. The prism refers to facets which encompass a broader view than the contents of BSCs and other initial frameworks.
In contrast to other frameworks, the performance prism considers all stakeholders, even those beyond the shareholder and customer. It suggests that stakeholders include employees, local communities, suppliers, regulatory agencies, and other interested groups. The prism’s founding philosophy supports a reciprocal relationship between the organization and its stakeholders. Of great interest is that Neely and his team’s research failed to turn up considerations of this crucial reciprocal model in any other existing measurement framework. This Stakeholder facet was deemed so vital it is listed as the first facet of the prism.
The second facet is the Strategies facet, which is tied back to the stakeholders and what they want and need. Neely et al. (2001) noted the importance of this perspective by stating, “The only reason an organisation has a strategy is to deliver value to some set of stakeholders” (p. 5). They reiterated that these strategy relationships concern a multitude of stakeholders (including employees, suppliers, customers, investors, as well as the local community) and further emphasized the complex relationships that exist among these stakeholders. These facts need to be acknowledged, and the intricacies of such relationships explored.
The third facet is titled Processes, which addresses the processes required for successful implementation of strategies. A key theme is that a strategy can only deliver results if the organization’s processes are aligned.
The fourth facet, Capabilities, is considered to be the least understood. Neely et al. (2001) explained the Capabilities facet as follows:
Capabilities are the combination of people, practices, technology and infrastructure that together enable execution of the organisation’s business processes (both now and in the future) . . . The key question associated with this facet becomes: “What are the capabilities we require to operate our processes?” (p. 7)
This facet is essential because it allows the organization to identify necessary resources, such as employees, finances, and materials. In addition, it defines the processes to develop these resources, such as training and mentoring of employees, identifying and obtaining the needed capital, and purchasing needed equipment. Finally, it suggests the ways in which to utilize these resources most effectively.
The final facet is Stakeholder Contribution, which expresses stakeholder relationships in a novel way by defining and examining what the stakeholder’s contribution back to the organization will entail. As an example, from the employees’ perspective, in return for job security, fair compensation, and recognition, the organization expects input and effort, in the form of ideas, suggestions, the development of expertise, and staff loyalty.
With respect to the performance prism, indicators and measures have the advantage of unification of measures through the use of “sets of hypothetical relationships termed ‘success maps’” (Najmi, Etebari, & Emami, 2012, p. 3). Another strength is the multidimensional detail encompassed by the approach. Such dimensionality helps ensure that any missing measurement can be recognized and subsequently included. In terms of disadvantages, the prism, like the BSC, has the deficiency of failing to include an iterative review process. This lack is a major flaw, given that such a process is seen by many to be especially important (Bourne et al., 2000; Kennerley & Neely, 2004; Neely et al., 2002; Parmenter, 2010).
Performance prism implementation
In practice, the application of the performance prism model involves a series of meetings that are used to identify key stakeholders and their needs, examine organizational processes and capabilities, and select and prioritize those measures that are both centrally important and capable of implementation (Neely et al., 2001). To facilitate these functions, the authors suggested the development of a “measures tree . . . which identified the essential linkages between the measures selected for each facet of the Performance Prism framework” (Neely et al., 2001, p. 10).
Other significant considerations include deciding which indicators will answer the identified questions and determining how and where to obtain such information (TAG, 2013). A lengthy and in-depth facilitation process is usually required to reach agreement on the information necessary to provide a valid picture.
As noted, one initial insufficiency of the prism model (and most other frameworks) was its lack of an ongoing review process. However, potential solutions have been proposed to address this shortcoming. The work of Najmi et al. (2012) resulted in the creation of a model to address the lack of an integrated review system. They noted two review processes to be considered when implementing PM frameworks: the review of individual measures and the review of the framework’s “supporting infrastructure” (p. 11). Manoochehr, Etebari, and Emami (2012) also offered a remediation for the lack of ongoing review by most models.
A Practical Model for Developing a PMS
To begin, prior to adoption of a framework and development of the PMS, a planning team/group should be assembled. The purpose of such a team is to develop and implement the PMS. Teams should consist of representatives from all major stakeholder groups, including a broad array of organization management and staff (those who will be responsible for implementing the system and those directly impacted by system results). Teams can also include internal or external consultants.
To assist teams interested in choosing and implementing a PMS, we have created a model which provides the key elements of PMS development and application. Although guidance for the implementation of a PMS is provided by most PMS developers (e.g., Areana, Arnaboldi, Azzone, & Carlucci, 2009; Bititci, Carrie, & McDevitt, 1997; Bourne et al., 2000; Cavalluzzo & Ittner, 2004; Elg, 2007; Few, 2006a, 2006b; Guerra & Hutchinson, 2013; Harbour, 2011), criteria for choosing a specific framework are rarely provided. In addition, certain PMSs either omit or fail to emphasize concerns and considerations that should be addressed in the operationalization, implementation, and utilization of such a system. Our model, supported by the previously discussed literature, provides guidance and suggestions synthesized from the major frameworks. Moreover, it provides guidance for the selection and development of associated PIs. As illustrated in Figure 1, the model details the sequence of planning, defining, and decision-making activities.
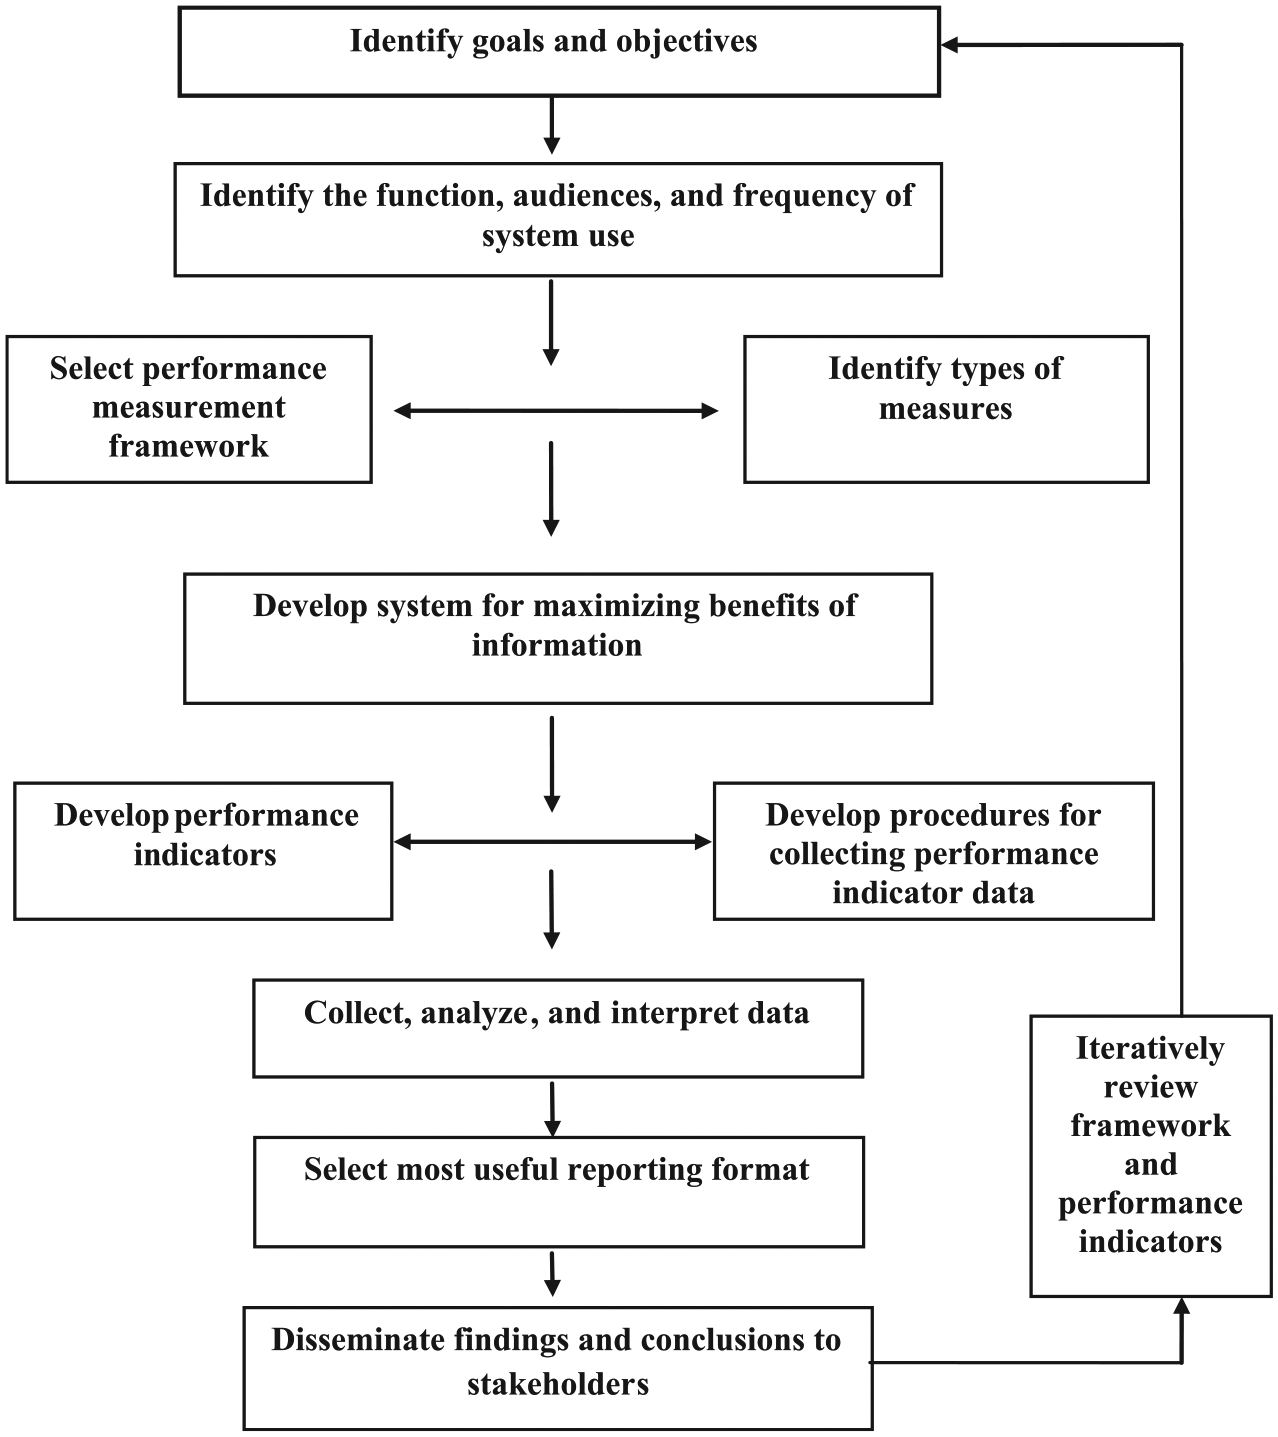
A model for performance measurement system development.
Identify Goals and Objectives
The initial step involves identification of the organizational goals and the objectives upon which the PMS will be founded. As per Harbour (2011), “A well-developed strategic performance objective clearly states what a system (an individual or organization) is trying to accomplish (or avoid). It should contain an action verb, the subject matter, and associated performance goals” (p. 6). There are no hard and fast rules about the numbers of goals and objectives on which to focus, but prioritization is advisable. As several PIs can be developed for a single goal or objective, it is wise to focus on only a few objectives, for reasons of both economy and utility.
Identify the Function, Audiences, and Frequency of System Use
Next, decisions must be made on the desired function of the information, the potential uses of the PMS’s results, and the audiences or users of those results: Who will be using the information, how frequently it will be used, and for what specific purposes? The team should also identify the primary individuals whose actions will influence goal attainment and the ways in which objective realization might occur. Clarification of the objectives to be assessed by the system and the frequency with which the information will be collected and shared are significant considerations at this step. These decisions, particularly with respect to the audiences, affect the transparency of the process and indicate the level of resources that may be needed.
With respect to audience, the literature unambiguously expresses that stakeholder inclusion, buy-in, and engagement are all key elements of the process (Edgar, Geare, Halhjem, Reese, & Thoresen, 2015). It is crucial at all levels of PMS development and implementation that both internal and external stakeholders are queried and involved. It is not uncommon for organizational leaders to overlook input from the persons who will be implementing these systems. Broad inclusivity is necessary to realize buy-in and the success of the PMS. Accordingly, the planning team should include representatives of the user audiences.
During this phase, as well as during the development of the indicators, definitional clarity is important. If there is confusion or incongruity around meanings, processes and outcomes can be negatively impacted. Terms and definitions can remain idiosyncratic, reflecting an organization’s internal culture. However, if such terms are used, everyone should know and use them in the same way. It can be useful to create and disseminate an organizational glossary and share expectations for language at ongoing meetings. Doing so will help to ensure that everyone is sharing the same terminology.
Select PM Framework and Identify Types of Measures
The next two steps, selection of a PM framework and the identification of the types of measures to be included in the framework, should proceed in parallel. Potential frameworks can focus on specific areas of measurement (e.g., customer satisfaction, quality, finance, public opinion) and/or on development and implementation aspects (e.g., top management support, evaluation of existing system, set timescales). The presence of existing (or readily obtainable) measures in areas emphasized by a specific framework should encourage serious consideration of that particular framework. However, if these measures are not aligned with the PMS’s major goals and objectives, another more fitting framework should be considered. Failure to select a specific framework would prevent a group or organization from realizing the framework’s demonstrated advantages, but would not prevent the creation of a framework-free PMS with previously undocumented strengths and weaknesses.
Develop System for Maximizing Benefits of Information
To maximize the benefits of the information collected and disseminated, there must be a shared understanding of how the information will be utilized by the organization. Doing so will guide development of a system with appropriate rewards and sanctions. For example, a system developed for performance assessment (with performance-based rewards and sanctions) will be much less effective for promoting organizational learning than a system whose focus is shared responsibility and goal attainment. Informing staff that a PMS with an organizational learning focus is dissociated from rewards and punishments—and having them believe and internalize this—is challenging and not possible without continuous staff involvement.
Develop PIs and Develop Procedures for Collecting PI Data
The next two steps, development of PIs and development of procedures for collecting PI data, should also be conducted in tandem. When completing these steps, it is important to keep in mind that PIs should not be merely a wish list of things one would like to measure: If the process of obtaining certain measures is costly or measures are difficult to obtain in a timely fashion, alternatives should be proposed. Conversely, readily available data should not be the sole driver of indicator choice, as such data might not adequately assess the indicator one wishes to assess. If the PMS’s objectives include problem identification, the indicators should focus on factors that will reflect short-term progress. One should also be wary of “feel-good” indicators (indicators on which a work group or organization consistently earns very high scores). Such indicators rarely lead to effective change or organizational improvements. Having attained certain goals and objectives, other “stretch” goals should be set in an effort to promote organizational learning.
Finally, while many articles noted that financial and numerical measures provide critical quantitative data and can be fairly straightforward, developing accurate nonfinancial and qualitative measures is frequently more challenging. Time and effort are required to ensure that qualitative measures are indeed assessing what is desired. Systems and processes need to be defined in ways that will enable their measurement, such as the use of customer surveys to determine customer satisfaction.
There are numerous guides for the development of PIs (e.g., British Columbia, Office of the Auditor General, 2010; National Research Council, 2005; Parmenter, 2010, 2012, 2015). The acronym “SMART” (Government of Canada, 2015; Rozner, 2013) is often used to describe the characteristics of the objectives underlying quality PIs. This acronym stands for
Specific: The objective is clear and describes an observable action or achievement;
Measurable: There is a way to assess the objective in terms of its results (e.g., quality, time, quantity);
Attainable: The objective of the indicator represents an achievable goal;
Relevant: Is the most important aspect of the activity being measured?; and
Time-bound: Is there a deadline? Can progress be tracked?
Developing specific PIs meeting these characteristics can be informed by reviewing the literature to identify indicators which have been developed by others with similar goals and objectives. In certain fields, organizations have been created to develop or endorse a standardized set of performance measures. In one discrete sphere, health care, the National Council on Quality Assurance (NCQA; n.d.) was responsible for the creation of the widely used set of measures and indicators that comprise the Healthcare Effectiveness Data and Information Set (HEDIS) (Healthcare Effectiveness Data and Information Set, n.d.). HEDIS includes measures of performance in dozens of health care areas (e.g., advising smokers to quit, breast cancer screening, child and adolescent immunization status, controlling high blood pressure, and prenatal and postpartum care). Similarly, the National Quality Forum (NQF; 2015) reviews and endorses consensus health care performance measures and indicators which are valid, evidence based, and accessible to the public. Their measures are presented in a range of broad areas, including cost and resource use (e.g., risk-adjusted resource use by health plan members with asthma in measurement year), efficiency (e.g., percentage of cardiac stress imaging performed in low-risk surgery patients for preoperative evaluation), outcomes (e.g., improvement in mobility using the Care Assessment and Evaluation Tool Mobility subscale), patient-reported outcomes (e.g., the Consumer Assessment of Healthcare Providers and Systems In-Center Hemodialysis Survey, with three subscale scores reflecting different experiences of care dimensions), and process (e.g., percentage of patients discharged on beta blockers following Coronary Artery Bypass Graft [CABG] surgery). In addition, standardized procedures for the collection of their approved measures are often provided (NQF, 2015).
Collect, Analyze, and Interpret Data
Indicator data should be subjected to practices that characterize any high-stakes data collection effort. Especially important are checks for accuracy and completeness, as well as issues of validity, reliability, and possible bias associated with the collection of such data. These checks are important in ensuring that the stakeholders and users of the data can be confident in the credibility of the information and its interpretation. If stakeholders have been involved in the entire process of PM and indicator data collection and analyses, these concerns can, to a large extent, be addressed proactively. Nonetheless, even the best designed systems are not perfect. Unanticipated issues will arise; real-world changes will make revisions advisable.
Select Most Useful Reporting Format
Dashboards are a commonly used reporting format but are not the only way to share and report indicator data. Other formats may be those used in annual reports and may rely on graphical forms. As suggested by Torres, Preskill, and Piontek (2005), selecting the reporting format is essential for leading to stakeholder use of the information. Such reporting can aid in building awareness and support, in demonstrating results and accountability, and in decision making about changes and improvements. Thus, keeping in mind the information needs of the various stakeholders can suggest the most appropriate formats to convey details.
Regardless of the choice of format, adherence to good graphic design principles, as well as limiting the number of indicators included, are key principles. As with any graphic design, usability testing (Barnum, 2010; Dumas & Redish, 1999; Rubin & Chisnell, 2008) will help identify unforeseen issues and enhance the utility of the indicator data. Presentation of results in an attractive and easily comprehensible format can greatly facilitate the information’s utilization.
Disseminate Findings and Conclusions to Stakeholders
Once the reporting format is populated with indicator data, results are disseminated to stakeholders. Failure to disseminate findings and conclusions to stakeholders can raise questions about the impacts of their involvement. Such a failure can also generate questions regarding any subsequent actions which are based on the PMS data.
After data dissemination, meetings are held to “dig deeper” into the meanings of the findings. The data will show whether the initiative and organization are moving in the desired direction or whether course corrections may be indicated. Subsequently, the collection of supplemental information may be necessary to understanding the results. If so, such clarifying information gathering should take place prior to using the reported data to inform potential changes to processes, approaches, and strategies.
Findings should be disseminated on a regular basis. In addition to providing the bases for informing change, staff should become more knowledgeable about the indicators and more comfortable in using them for intended purposes. To foster use, management may require action plans based on indicator results.
Iteratively Review Framework and PIs
As shown, PMSs must align with organizational strategies and the structures employed for attaining goals. As those strategies and structures evolve, the choices of PM frameworks and PIs need to be reassessed to ensure that they meet ever-changing needs. To remain relevant, the planning team should reassess the PMS and its attendant PIs on a scheduled (and frequent) basis. Failure to engage in this review and updating will, almost certainly, lead to an outdated system that will become progressively ineffective in helping the organization or initiative meet its goals and objectives.
Upon reassessment, if measures or frameworks are found no longer applicable, they should be reworked (or even abandoned) to accommodate current initiative/organizational need. Toward this end, stakeholders’ ongoing input about the process and its utility will be invaluable. To clarify, such reassessment needs to be inclusive, iterative, and interactive (Franceschini, Galetto, & Maisano, 2007). When PMSs are found to be sound, relevant, and without need of change, the collection of PI data, its analysis, and reporting should continue on an agreed-upon schedule.
Considerations in the Design and Use of PIs
In this section, we discuss issues associated with the identification and overcoming of organizational constraints, while providing guidance for dealing with matters that will likely arise in implementing the model. In addition, accountability and organizational learning, two major goals/objectives of PMSs, are discussed in greater detail, reflecting the importance of these goals for HRD. Finally, issues with regard to dynamic and complex systems and their relationships to PM are examined. This topic is worthy of consideration as individual, organizational, and societal factors’ dynamism and complexity can exert great influence upon the development and implementation of PMSs.
As previously shown, the PMS can be a powerful tool for identifying progress toward the success of organizational goals and initiatives. In turn, this progress (or lack thereof) can assist in the identification of areas of staff strengths and weaknesses. Such strengths and weaknesses are areas in which HRD interventions, focused on individuals and teams, may be crucial for goal attainment. And, after such interventions, effectiveness on organizational goal development can be assessed and a determination made about whether some additional organizational intervention is required for improved performance.
Identifying and Overcoming Organizational Constraints
The successful implementation of PIs, and by extension PM frameworks, is dependent upon the contextual environment within which PIs are employed. Given the number of stakeholders, complexity of the environments, and the number of dimensions (PIs) to be managed, two such contextual issues are power relationships between stakeholders and conflicting stakeholder interests (Covaleski, Dirsmith, & Samuel, 1996). Both of which can lead to an imbalance in dimensions. The more complex the system and the greater the number of stakeholder influences placed upon an organization, the more likely it is that imbalance will result. When there is less conflict between stakeholder groups, even when the power balance between the groups is uneven, the indicators have a tendency to be more balanced.
In their case studies on the dynamics of PM and organizational culture, Bititci, Mendibil, Nudurupati, Garengo, and Turner (2006) found a multidirectional interchange among organizational culture, management styles, and PM. They argued, “PMS can shape organisational culture and management style, and organisational culture and leadership can affect the success of a PMS initiative,” with well-implemented PMSs leading to a “more participative and consultative management style” (Bititci et al., 2006, p. 1343). They further showed that with success, there were substantial performance improvements and a culture that valued achievement. They concluded that “management styles need to evolve as the maturity of the PMS and the organisational culture evolves” (Bititci et al., 2006, p. 1344). The organizational cultures examined were shown to initially exhibit a more dominant top-down less consultative power base. Ultimately, cultures evolved toward a more consultative management style, though this progression required influences external to the organization.
In our proposed model, the early steps focus on sorting out questions related to organizational issues such as those listed above. For example, Step 2 involves identifying the functions and audiences for the developing PMS. In this process, differences in perspective between stakeholder groups, which may cause disagreement over appropriate usage, can be identified and resolved. In the step Select PM Framework, the selection process should take into account specific organizational characteristics, such as organizational culture and communication patterns.
Accountability
One major focus of consideration, with regard to PMSs, is that of accountability. Using PM for accountability purposes can provide information on whether an organization is connecting the lines between reality and vision. As we have discussed, PMSs and PIs aid organizations in making clear an initiative’s goals or a strategic direction. Furthermore, PMs suggest the work that needs to be undertaken and the departments or teams and the people responsible for that work. In turn, these functions can lead to identifying the departments, teams, and groups responsible for achieving or failing to achieve the strategy. J. Watkins and Drury (1999) conducted a series of group discussions with managers and professionals in the United Kingdom’s financial services sector, which focused on determining how changing organizational structures influence professional skills and roles. One major finding of these interviews was that there is a movement toward greater accountability and PM.
While some research exists on process and outcome accountability, most of the literature discussed the misuses and negative and/or unintended consequences of accountability measures. In addition, these studies “represent a mere scratch on the surface of the complex concept of accountability . . . other facets of accountability are awaiting empirical exploration” (Ossege, 2012, p. 602).
As per Hailey and Sorgenfrei (2005), performance improvement, accountability, and learning are roles that are “often at odds with each other and tensions are provoked around this accountability-learning dichotomy” (p. 2). Discussions regarding accountability versus learning generally revolve around which takes precedence and to what degree each is employed. The answer to these questions is often context dependent.
In the public sector, managers often “lament about perverse effects of accountability” (Ossege, 2012, p. 586). One such example was shared by Smith (1995): when faced with difficult decisions for which they will be held to an accountability standard, managers often choose to pass these decisions off to others, thereby maintaining their own high success rates. Such fear responses can be mitigated through assurance, and subsequent follow through, that PI outcomes will be utilized as educational and course corrective tools. Ultimately, according to Patton (2011), PM, from the macro to the micro, can help to answer the questions of accountability: Is the initiative focusing on its original intents? Is there a collective responsibility for outcomes?
Organizational Learning
Organizational learning represents another critical management objective for PIs and PM frameworks, including the measurement and promotion of that learning. Organizational learning can be viewed as the acquisition of information for the purposes of sharing and interpreting; and such sharing and interpreting can foster iterative strategic alignment and improved feedback systems (Argyris, 1977; Argyris & Schön, 1974, 1978). It is through such feedback systems, particularly those which include error detection and correction, that organizational learning is enhanced (Argyris & Schön, 1978; K. E. Watkins & Marsick, 1992).
According to Srimai, Damsaman, and Bangchokdee (2011) in their study of the Thai government’s use of PMS and organizational learning and its influences on strategic alignment, achieving strategic alignment requires the distribution of knowledge and information within and among departments. Given PMS’s capacity to encourage both vertical and horizontal dialogues within an organization, the processes of developing and implementing such systems enhanced capacity for alignment with initiative goals. Accordingly, “The translation and deployment of SPMS [strategic performance management systems] foster strategic alignment as it triggers strategic dialogue and discussion throughout an organization” (p. 60). This strategic dialogue became the practice of sharing and interpreting of information for goal alignment and feedback. Strategic PMS development and deployment had the benefit of creating internal consistency through sharing, discussion, the debates it generated, and the organizational learning it produced.
The frequent use of PM frameworks as tools for learning “belies the picture that they are merely instruments of managerial control or mechanisms for accountability” (Hailey & Sorgenfrei, 2005, p. 3). It has been shown that PMS activities engaged in for learning’s sake have a greater impact on overall organizational learning than do PMS activities focused on diagnosing problems (Srimai et al., 2011). While necessary for episodic review of indicators, Henri (2005) found a significantly negative relationship between the diagnostic use of PMSs and organizational learning. Even in light of this finding, it remains true that “given the lack of reliable information about investments in HRD, organizations can be expected to invest conservatively and satisfice rather than maximize employee learning and performance needs” (Kuchinke, 2003, p. 306). To whatever degree PM is used for learning, there remains a prevalent contrary belief that such measurement is used to comply with formal requirements as opposed to organizational development.
Kleiner (1997) reinforced these concerns regarding the placement of excessive emphasis on measurement with his aptly titled work, When Measurement Kills Learning. He argued that those who feel the need to focus attention on meeting measurement goals have less time to spend on, and less inclination toward, learning activities. Furthermore, he suggested that learning is often a messy process; mistakes are inherent. Deep and transformative learning can only take place in environments where risk is allowed and support is provided (Russ-Eft, 2002). Thus, environments that promote a climate of trust and courage are most conducive to learning (Botcheva, Roller White, & Huffman, 2002). The arguments concerning the use of PMS to monitor and measure performance only, in contrast to its use for organizational learning, bear some similarity to the arguments undertaken concerning a focus on performance (Swanson, 1995) versus on learning for HRD (Alagaraja, 2012; Marsick & Watkins, 1999, 2003; O’Neil, Watkins, & Marsick, 2010).
Dynamic Complex Systems
The development of a PMS takes place within the context of individual, organizational, and societal factors. All of which interact at every level in multidirectional relationships (Guerra & Hutchinson, 2013). These contexts constitute dynamic and complex systems.
Yawson (2012) defined complex systems as “interconnected parts that exhibit concerted properties as a whole which are different from the properties exhibited by the individual constituent parts when acting alone” (p. 57). Such dynamic complexity and change have proven impacts on organizational, initiative, and personnel performance (Hailey & Sorgenfrei, 2005; Russ-Eft & Preskill, 2009; Szabla, 2007). As the discipline of PM seeks to attend to greater and greater system complexity, it develops newer, more detailed PM frameworks. These newer frameworks depend upon more sophisticated PIs and integrated multilevel and multidimensional structures (e.g., Fisher & Sleezer, 2003; Sleezer, Russ-Eft, & Gupta, 2014; Upton & Egan, 2010). However, in opposition, many practitioners are seeking greater simplicity and ease of applicability for PMSs (Hailey & Sorgenfrei, 2005).
Related to complexity, organizational and initiative dynamism (Bánáthy, 1996, 2000; Yawson, 2012) leads to new opportunities for engaging PMSs. As noted by Yorks and Nicolaides (2006), “Complex systems may [initially] seem simple but are dynamic, ever interacting as they evolve in a nonlinear way” (p. 145). This degree of unpredictability can make outcome measurement difficult.
One tool used for inquiring into a potentially complex initiative and organizational change is the examination of historic milestones (Hailey & Sorgenfrei, 2005). In this case, a comprised team, representing different divisions of the organization, meets to create a timeline for the organization, identifying past events and suggesting future events or goals. Such an activity can help disparate segments of the organization learn from one another to understand the problems confronting the organization. In turn, identified goals can then serve as candidate goals for the PMS.
Another related approach is that of the Future Search process (Dewey & Carter, 2003; Weisbord & Janoff, 1999). A Future Search process is particularly effective when there are conflicts to be resolved, as in situations of a merger or a change in direction for the organization. Such a process typically includes a large number of diverse stakeholders, potentially anywhere between 80 and 300 people. The process entails the examination of past landmarks, which can help to unite the diverse factions of a complex and changing organization, and therefore make it less challenging to deal with uncertainty in establishing future goals. The identified goals can then serve as candidate goals for a PMS.
A third approach to planning during uncertainty involves the use of scenario planning (Chermack & Lynham, 2002; van der Merwe, 2008). Originally developed in the military, Royal Dutch Shell used the method beginning in 1967 to plan for the year 2000. It enabled the company to weather the storms of the 1973 Yom Kippur war and plummeting oil prices. Using this method, managers and employees meet in multiple workshops to identify key driving forces within the business environment. A listing of issues is developed, and each issue is rated in terms of its impact and level of uncertainty. Those issues that are rated high in both impact and uncertainty are used as the basis for developing scenarios. The scenario development process includes (a) identifying a strategic agenda, (b) challenging existing assumptions, (c) examining the external environment, (d) pulling together the available information into three or four possible futures, (e) developing stories about those futures, and (f) using the stories to adjust and refine strategic thinking (Chermack, Lynham, & van der Merwe, 2006). Data from a PMS can prove invaluable in this process, which will help the organization develop flexible strategic plans and lead to organization, group, and individual learning.
Another option would be the use of systems dynamic modeling and simulation, as discussed by Yawson (2012). Systems dynamic modeling attempts to represent the feedback processes, including a PMS, in a system. Indeed, the dynamics of a system arise from either positive feedback loops, which are self-reinforcing and accelerate change, or negative feedback loops, which are self-correcting and inhibit change. The process begins by determining the initial conditions and any limitations, based on history, market research, and expert judgment. Feedback loops and their directions are then determined, along with any interconnections and time lags. For complex systems, Sterman (2001) recommended the use of computer simulations. Although not seen as a tool to predict the future, the use of systems dynamics and simulations can yield organizational, group, and individual learning.
To attend to complexity and dynamism, as with other PM considerations, regular monitoring and modification of PMSs are necessitated by changes within an organization’s priorities or initiatives. Thus, our proposed model includes the iterative review of the framework and PIs at regular intervals. This process, while essential for all PMSs, takes on particular significance with an increase in complexity of the initiative, organization, or social setting. The schedule for which reviews should occur takes into account, to whatever degree possible, the pace and processes of the sources of change. Ad hoc reviews of the PMS, outside of the planned schedule, may occasionally be beneficial and include rapid need analysis (Barksdale & Lund, 2001) as well. This reevaluation and adaptation requires new performance measures to be introduced on an ongoing basis (Hailey & Sorgenfrei, 2005; R. Watkins, 2007).
Limitations of PMSs and the Role of HRD Practice
A PMS’s indicators provide certain knowledge about an organization’s initiative but do not yield all needed information. Indicators provide a single snapshot of a specific situation at a given point in time. Therefore, cause and effect relationships can be difficult to establish, as rigorous experimental or quasi-experimental designs are rarely tolerated and therefore unlikely to have been conducted (Russ-Eft & Hoover, 2005). Detecting both the impacts of relationships among indicators and the outcomes of indicators could potentially require several years of monitoring. The HRD practitioner, in working with an organization’s PMS, must continue to remind decision makers to consider the long-term perspective. As an example, poor outcomes do not necessarily represent poor effort (Artley & Stroh, 2001). Failure to meet objectives can occur for a variety of reasons. For instance, organizational or individual change efforts may fail because of a lack of managerial or supervisory coaching and mentoring, misaligned reward systems, individual motivation, and/or individual readiness for change, among other factors (e.g., Choi & Ruona, 2011; Holton, Bates, & Ruona, 2000; Rouiller & Goldstein, 1993). All of these issues reside within the HRD practitioner’s purview. Thus, the HRD practitioner must assist the organization to identify root causes of failure.
In addition, numerical quotas do not repair defective processes (Artley & Stroh, 2001). Turning performance objectives into numerical quotas creates problems. Such quotas can do nothing to achieve improvements in processes. Rummler and Brache (1990); Bergmann, Hurson, and Russ-Eft (1999); and Sleezer et al. (2014) recommended that organizational process be mapped to determine the flow of the work. Naming causes and changing procedures are ultimately the actions that improve outcomes. The HRD practitioner can aid the organization by developing the appropriate groups to work on organizational process maps that identify the handoffs and the potential duplications in the work flow.
Furthermore, it is important to acknowledge that “a measured system is not the same as the actual system” (Artley & Stroh, 2001, p. 6). Measured systems represent an approximation of the actual system (Franceschini et al., 2007). Measurements are only representational facsimiles for the functioning of the genuine system. Consequently, completely accurate information and data may not be possible to generate.
Ultimately, all PM frameworks have advantages and limitations inherent within their specific models. The extensive research on framework models over the last three decades has pointed out many of both. The HRD practitioner can provide insights which will help guide the organization in selecting the most appropriate measurements and help decision makers to recognize what can and cannot be measured.
Implications for Future HRD Research
There continues to exist an ongoing concern about the lack of strong evidence on the specific benefits and limitations of PM and a belief that research to date has proved inconclusive (Micheli & Manzoni, 2010). This deficit opens the door for ongoing multidisciplinary studies in the realm of PM. It is our hope that the model we have proposed be used to organize and guide many of these research concerns and questions. This includes, for example, questions about the tailoring of PMSs to reflect organizational characteristics, the process of formulating goals and objectives for a proposed PMS, the ways that a PMS may influence communication and decision making within the organization, and numerous other issues.
Undertaking studies of organizations adopting and implementing this model would help to identify the steps that are most useful and most needed. Furthermore, as suggested by some of the cited studies, the culture of the organization and the level of management control may need to evolve throughout the PMSs development and implementation process. It would be enlightening to undertake studies that examine such implementation and the level of management control at various stages.
As we have described, another prominent issue in the literature is the tension between the use of PMSs and PIs for accountability versus for organizational learning. Further research on the dynamics of this conflict, and the corresponding impacts and implications for organizations, would be valuable. Does a focus on accountability reduce attention to organizational learning, and conversely, does a focus on organizational learning lead to neglect of accountability concerns? And what are the organizational, departmental, and individual consequences of the two different foci?
HRD researchers should be examining management’s role in determining the focus of PMs and PIs. Who are the primary decision makers, and what degree of involvement is needed from each of those decision makers for a successful implementation? To what extent do HRD practitioners influence the decisions, particularly concerning the focus on accountability or on organizational learning in such systems? When deciding to implement PMs and PIs, what type of information and consulting is needed by executives and managers? And, when implementing such systems, what HRD interventions are needed for management and individuals within organizations? To what extent do the HRD interventions need to change over time with the development of the PMS?
Few organizations have the time or desire to formally investigate, for example, through experimental comparisons, the advantages of different approaches to the development of their PMSs. Instead, case studies, reflecting naturalistic variation in the procedures and processes used, will probably be the dominant approach for further investigation. Such case studies can also employ survey research and other observational tools, to enable participants to assess the value and utility of various elements used in the design, implementation, and information utilization process. For assessing outcome measures, one might ask about the utility of the data and how they were used to inform change. Perceived involvement in the PMS development process, the extent to which the system is integrated into the organization’s structure and practices, and the amount of senior management support and participation can be assessed and linked to outcomes. Different measures of each of the steps in the proposed model are amenable to such approaches.
Finally, most of the literature cited in this review comes from the perspective of researchers and organizations in North America and Europe. Presumably, organizations in Africa, Asia, the Middle East, and South America face similar issues and questions. Future research can examine the similarities and differences in the development and implementation of PMS and PIs in diverse geographical and cultural contexts.
Conclusion
A PMS can be a powerful tool for identifying progress toward the success of organizational goals and initiatives. In turn, such progress, or lack thereof, can assist in the identification of staff strengths and weaknesses and the understanding of organizational resources. These organizational characteristics can highlight areas in which HRD interventions, focused on individuals and teams, can serve a vital support function for goal attainment.
Organizations implement different approaches to PM and PIs for a variety of reasons, and as a result they experience different outcomes and impacts. Although a good deal of critical examination—as well as rhetoric—exists on these topics, the field needs more empirical research to clarify the issues involved. The model presented in this article can provide a blueprint for organizations interested in implementing a PM approach. The efforts involved in planning, designing, and implementing PMSs can be amply rewarded by gains in organizational effectiveness, efficiency, and learning.
Footnotes
Acknowledgements
The authors gratefully acknowledge the Robert Wood Johnson Foundation for their support of this work. They especially thank Laura Leviton for her invaluable consultation and support.
Authors’ Note
The contents of this article are the responsibility of the authors and not of the Robert Wood Johnson Foundation.
Declaration of Conflicting Interests
The author(s) declared no potential conflicts of interest with respect to the research, authorship, and/or publication of this article.
Funding
The author(s) received no financial support for the research, authorship, and/or publication of this article.