



Abstract
Universal screening using curriculum-based measures allows educators to detect students who may be in need of instructional interventions. Curriculum-based measures, such as oral reading fluency and Maze, are effective at accurately and efficiently identifying reading proficiency levels for overall school populations. Nevertheless, little is currently known about whether these measures are equally predictive for the diverse populations of students in schools. The current study examined whether Maze has prediction bias for Hispanic students and for students who primarily speak Spanish at home. Slope and intercept bias were examined using hierarchical linear modeling techniques. Intercept bias was found; however, effects were small. Maze underpredicted scores on a high-stakes state language arts test for both Spanish-speaking and Hispanic students, compared to their English-speaking and Caucasian counterparts. Maze was a strong predictor of the state outcome measure and should not be ruled out as a potential universal screening measure. Implications are discussed along with suggestions for future research.
Universal screening involves using a procedure across all students to assist in the evaluation of student risk (Glover & Albers, 2007; Ikeda et al., 2008). Universal screening is important for identifying students who are at risk for reading problems before difficulties become insurmountable (Kratochwill, Albers, & Shernoff, 2004; Simmons, Kuykendall, King, Cornachione, & Kame’enui, 2000; Walker & Shinn, 2002). Early identification and remediation mitigate possible later adverse outcomes (Durlak, 1997). Hence, national organizations formed to promote scientifically based reading instruction (e.g., Gersten et al., 2008; National Reading Panel, 2000; President’s Commission on Excellence in Special Education, 2002) strongly recommend making universal screening a practice in all schools. Results from screening measures can trigger intensified supports and guide conversations about how to meet student needs with existing school resources. However, in order to make quality decisions about matching student need with intervention resources, it is important that screening measures be reliable and valid to the greatest extent possible across all groups about which decisions will be made (DAmerican Educational Research Association [AERA], American Psychological Association, & National Council on Measurement in Education, 1999; Deno, Mirkin, & Chiang, 1982).
Bias has been defined as the “differential validity of a given interpretation of a test score for any definable, relevant sub-group of test takers” (Cole & Moss, 1993, p. 205). Within the literature on test fairness there are two statistical ways to evaluate test bias: internal test structure, which evaluates whether or not a given item measures the same thing for different groups relative to the other items, and external test structure, which evaluates whether or not a test measures the same thing for two groups relative to some external criterion (Camilli, 2006; Jensen, 1980).
If a screening measure has different validity characteristics for different populations, it might under-, over-, or poorly identify who needs additional instructional support. If it underidentifies, students who need support will not be found and these students may unnecessarily obtain substandard outcomes. If the measure overidentifies, then time and resources are wasted in remediation where none is needed; the falsely identified students will miss receiving more appropriately targeted educational opportunities and the school’s intervention resources will be unnecessarily taxed. If the measure poorly identifies, then large numbers of students who need support will not get it and other students who don’t need the support will; the efficiency and outcomes of the system will be poor. The degree to which a measure does not maintain its validity across demographic groups is known as bias (Cole & Moss, 1993). When there is little difference in validity characteristics between groups, level of bias is low. When differences are large, the degree of bias is high. If a screening measure shows bias for particular populations, it is important for decision makers to know so they can mitigate adverse consequences from undependable decision rules (Hosp, Hosp, & Dole, 2011).
Comparison of regression lines (the criterion measure regressed onto the predictor variable) is the primary tool for evaluating external test bias (Jensen, 1980; Linn & Dunbar, 1986; Linn & Werts, 1971). Regression offers two approaches to evaluating bias: intercept bias and slope bias (Cleary, 1968). Intercept bias occurs when a regression line for one population is higher than another. In such cases, a score on the screening measure for one population consistently predicts a higher score for one population than another. Slope bias occurs when the regression lines for two populations have different slopes. In such cases, the screening measure predicts better for one population than another and it makes interpretation problematic.
Maze
Maze is currently one of the most common universal screening measures to identify upper elementary school students who are at risk (e.g., AIMSweb, http://www.aimsweb.com/; Good & Kaminski, 2010; STEEP, http://www.isteep.com/login.aspx). Maze is well suited for universal screening because it is efficient and has well-documented reliability and validity (Hosp, Hosp, & Howell, 2007; Good & Kaminski, 2007; Shinn, 1989; Swain & Allinder, 1996; Wayman, Wallace, Wiley, Ticha, & Espin, 2007).
Maze consists of a passage of connected text in which every seventh word has been deleted and replaced with three alternatives, one correct and two incorrect replacements (Shinn & Shinn, 2002). The two incorrect replacement options (known as distracters) typically include one item that makes grammatical sense in the context of the sentence (a near distracter) and one that is not grammatical (a far distracter). The students circle as many correct replacement words as they are able within a given amount of time. Maze is scored by counting the number of correct replacements. In some versions, test takers are additionally penalized for errors (e.g., Good & Kaminski, 2010). Proficiency on the Maze measure requires the student to be both fluent in reading and to understand what is read.
Two studies have evaluated the relation between Maze and high-stakes, state criterion-referenced tests (Espin, Wallace, Lembke, Campbell, & Long, 2008; Wiley & Deno, 2005). Reports indicated a correlation of .73 between Maze and the Minnesota Comprehensive Assessment at both the third and fifth grade (Wiley & Deno, 2005) and a correlation of .80 in the eighth grade (Espin et al., 2008). Both studies indicate that Maze is a strong predictor of outcomes on Minnesota’s high-stakes state tests. Furthermore, the Maze procedure showed more sensitivity to growth for middle school students than did the more commonly administered Oral Reading Fluency Measure (ORF; Espin et al., 2008). Of the two published studies examining the relation between Maze and high-stakes language arts tests, only Wiley and Deno explored questions of external bias.
Using Maze and ORF With English Learners
While Maze correlates well with and predicts scores on outcome measures such as state-mandated accountability tests for the general population, it is important to establish that Maze has similar validity characteristics for use with students who speak a primary home language other than English. Since they do not have the same background in spoken English, English learners (ELs) have additional burdens to overcome when learning to read English. For example, they are likely to have difficulty mapping what is decoded onto existing vocabulary and grammatical structures so that meaning can be ascertained (Garcia, 1991; Laberge & Samuels, 1974; Mace-Matluck, 1979; Peregoy & Boyle, 2000; Potter & Wamre, 1990). With native English speakers, once decoding becomes automatic it is quickly mapped onto an existing well-developed oral language structure. ELs do not have the same cognitive-linguistic structures on which to map decoded words. Furthermore, due to ELs having less cultural background knowledge, a narrow test of reading in English might not adequately sample the breadth of skills required to be successful in American schools. Consequently, it is conceivable that Maze might predict success on high-stakes outcome tests differently for EL and non-EL students either under-, over-, or poorly predicting who will pass.
There is little evidence in the research literature concerning predictive validity of curriculum-based measurement (CBM) with ELs. The few studies that have been published have focused on ORF. Of the three published studies that have been conducted on the differential predictive validity of using CBM in reading with ELs, two have concluded that ORF accurately estimates reading performance for ELs (Baker & Good, 1995; Wiley & Deno, 2005), and one concluded that reading proficiency of Hispanic students whose primary home language was other than English was systematically overpredicted by ORF (Klein & Jimerson, 2005). This overprediction could lead to underidentification for services. Only Wiley and Deno have addressed the use of Maze with the EL population. However, because of a small sample size, generalizability is limited.
Wiley and Deno (2005) examined the predictive validity of ORF and Maze with third- and fifth-graders using a standardized, criterion-referenced state accountability test (i.e., Minnesota Comprehensive Assessment) as an outcome measure. Participants in this study included 36 third-graders (21 were native English speakers and 15 were ELs) and 33 fifth-graders (19 were native English speakers and 14 were ELs). All of these students were selected from a pool of those scoring in the bottom 50% of their class on Maze. The resulting reduction in score variability likely reduced validity coefficients. Both Maze and ORF had moderate to strong correlations with the state accountability test across groups. ORF validity coefficients ranged from .57 for fifth-grade non-ELs to .71 for third-grade non-ELs. Maze validity coefficients ranged from .52 for third-grade ELs to .73 for third- and fifth-grade non-ELs. Maze had a higher correlation than ORF for non-ELs in both third and fifth grade (.73 at each grade). The different correlation coefficients found for the ELs and non-ELs in this study across different measures suggest that there may be some systematic bias. That is, the tests may function differently across different populations. However we should not judge in haste, while in and of themselves the correlation coefficients were statistically significant, differences between correlation coefficients were not tested for significance. Furthermore, given the small sample size it is likely they would not be statistically significant. The question of whether or not there are real differences in validity characteristics between ELs and non-ELs merits further investigation.
Several important additional limitations are present with the Wiley and Deno (2005) study. First, 80% of the ELs in this study spoke Hmong as a first language. It is important that the Hmong population was studied; however, this population has very different cultural and linguistic characteristics from the Spanish-speaking population, the largest proportion of ELs in the United States. Hmong is a tonal language spoken by the Hmong people in northern Thailand, Vietnam, and Laos (Fadiman, 1997; Lemoine, 2005). The grammar, phonology, and orthography of Hmong differ significantly from romance languages such as English and Spanish (Mortensen, 2004). Empirical evidence suggests that reading in alphabetic languages with transparent orthographies, such as Arabic and English (and Spanish), require somewhat different cognitive skills than they are for those of non-alphabetic or less transparently alphabetic languages such as Chinese and Hungarian (Everatt et al., 2010; Smythe et al., 2008). Hence reading in English might present varying types of cognitive gymnastics for speakers of different non-English languages that have different orthographies, and phonologies. Second, only two grade levels were investigated. It is unknown what trends in predictive validity would have emerged had other grades been included. Third, the number of students included in the study was relatively small and homogeneous: one school in St. Paul, Minnesota. This study bares replication with a different population, larger sample, and more sophisticated tools like hierarchical linear modeling (Raudenbush & Bryk, 2002) so that levels of test bias can be more accurately measured.
Klein and Jimerson (2005) investigated bias in ORF for ethnicity, sex, home language, and socioeconomic status. The population of this study included approximately 4,000 first- through third-grade White and Hispanic students. The outcome measure was the SAT-9 (Stanford Achievement Test Series–Ninth Edition; Technical data report, 1997). Investigators used a series of hierarchical multiple regression models to examine bias. As in most previous studies, correlation coefficients between ORF and the SAT-9 were robust, ranging from .74 to .84, indicating a strong relation between ORF and SAT-9. Results suggested that while no single factor in isolation resulted in bias, combinations of factors did. In particular, having a home language other than English combined with Hispanic ethnicity led to increased intercept bias (that is, the regression intercepts vary across groups) across all three grades. ORF overpredicted the achievement levels, as measured by SAT-9, of ELs with lower language proficiency. Thus using ORF as a screening measure might lead to underidentification of students in need of enhanced services for this population.
The Klein and Jimerson (2005) study advanced the research base by applying more sophisticated regression tools to a larger data set, by using more homogeneous disaggregated groups (e.g., all ELs were Hispanic), and for looking at factors in combination. However, this study did not address Maze, and did not address screening in upper grades of elementary school. Conclusions as to why this bias occurred remain uncertain. Perhaps it resulted from SAT-9 measuring aspects of reading with which ELs are likely to have more difficulty (such as vocabulary, cultural background knowledge, and comprehension) to a greater degree than ORF does. If this were the case, it would be worth investigating whether or not Maze has similar bias with respect to the combined factors of ethnicity and home language.
Purpose of Investigation and Research Questions
Screening provides an important function in finding students who require additional educational support. Maze is a promising screening measure that has demonstrated efficiency, reliability, and validity. After reviewing the literature, questions remain concerning the degree of bias Maze carries for culturally and linguistically diverse groups when predicting outcomes on state accountability tests. This study was designed to answer the following questions:
Does Maze show indications of statistical bias pertaining to Hispanic ethnicity when predicting outcomes on a high-stakes state test?
Does Maze show indications of statistical bias pertaining to Spanish-speaking students when predicting outcomes on a high-stakes state test?
Method
Setting and Participants
This study was conducted in an urban school district of 29,513 students in the western United States. The district was composed of 27 elementary schools, 5 middle schools, and 3 high schools. Student enrollment was predominantly minority (53%), with the largest minority group being Hispanic (35% of total population). Those who spoke a primary home language other than English (ELs) represented 33% of the total population. Although there were 80 languages spoken in the district, 22% of the student population had a primary home language of Spanish. Many students in the district lived in poverty with 58% receiving free or reduced school lunch.
Fourth through sixth graders at six of the 27 elementary schools in the district were selected to participate in the study. A stratified sample of schools was selected not only to reflect the ethnic, linguistic, and socioeconomic diversity of the district but also to reflect high, medium, and low levels of achievement as measured on the state language arts test. One school had a long history of high academic achievement (with average high-stakes language arts test results .85 standard deviations above the district mean in fourth through sixth grades), served primarily students with high socioeconomic backgrounds (18% free and reduced-price lunch), and had a low percentage of minorities (89% White). Two of the schools had histories of average academic achievement (with average high-stakes language arts test results of .53 standard deviations above and .07 standard deviations below district means), served middle income students (54% and 66% free and reduced-price lunch), and had a medium percentage of minorities (43% and 58% White). Three of the schools had histories of lower academic scores (with average high-stakes language arts test results ranging between .20 and .67 standard deviations below the district average), high poverty rates (between 89% and 93% free and reduced-price lunch), and large percentages of minorities (between 18% and 31% White).
Participants were enrolled in fourth through sixth grades: 90 fourth-graders, 305 fifth-graders, and 324 sixth-graders. In all, the sample included 31 classrooms with 719 students: 51.9% male, 41.1% White, 34.2% Hispanic, 3.9% Pacific Islander, 6.7% African American, 6.9% Asian, and 3.1% American Indian, 15.9% with disabilities, 65% on free or reduced-price lunch, and 36.7% with a primary home language other than English. Of these students who spoke a primary home language other than English, 26.1% had limited English and 47.7% were rated as non-English speakers based on the Oral Language subtest of the Idea Proficiency Test (IPT). For the purpose of this study, ELs are defined as students who spoke primarily Spanish at home and were not rated as Fluent on the Oral portion of the IPT. Table 1 displays demographic data by grade.
Demographics of Students in Sample by Grade
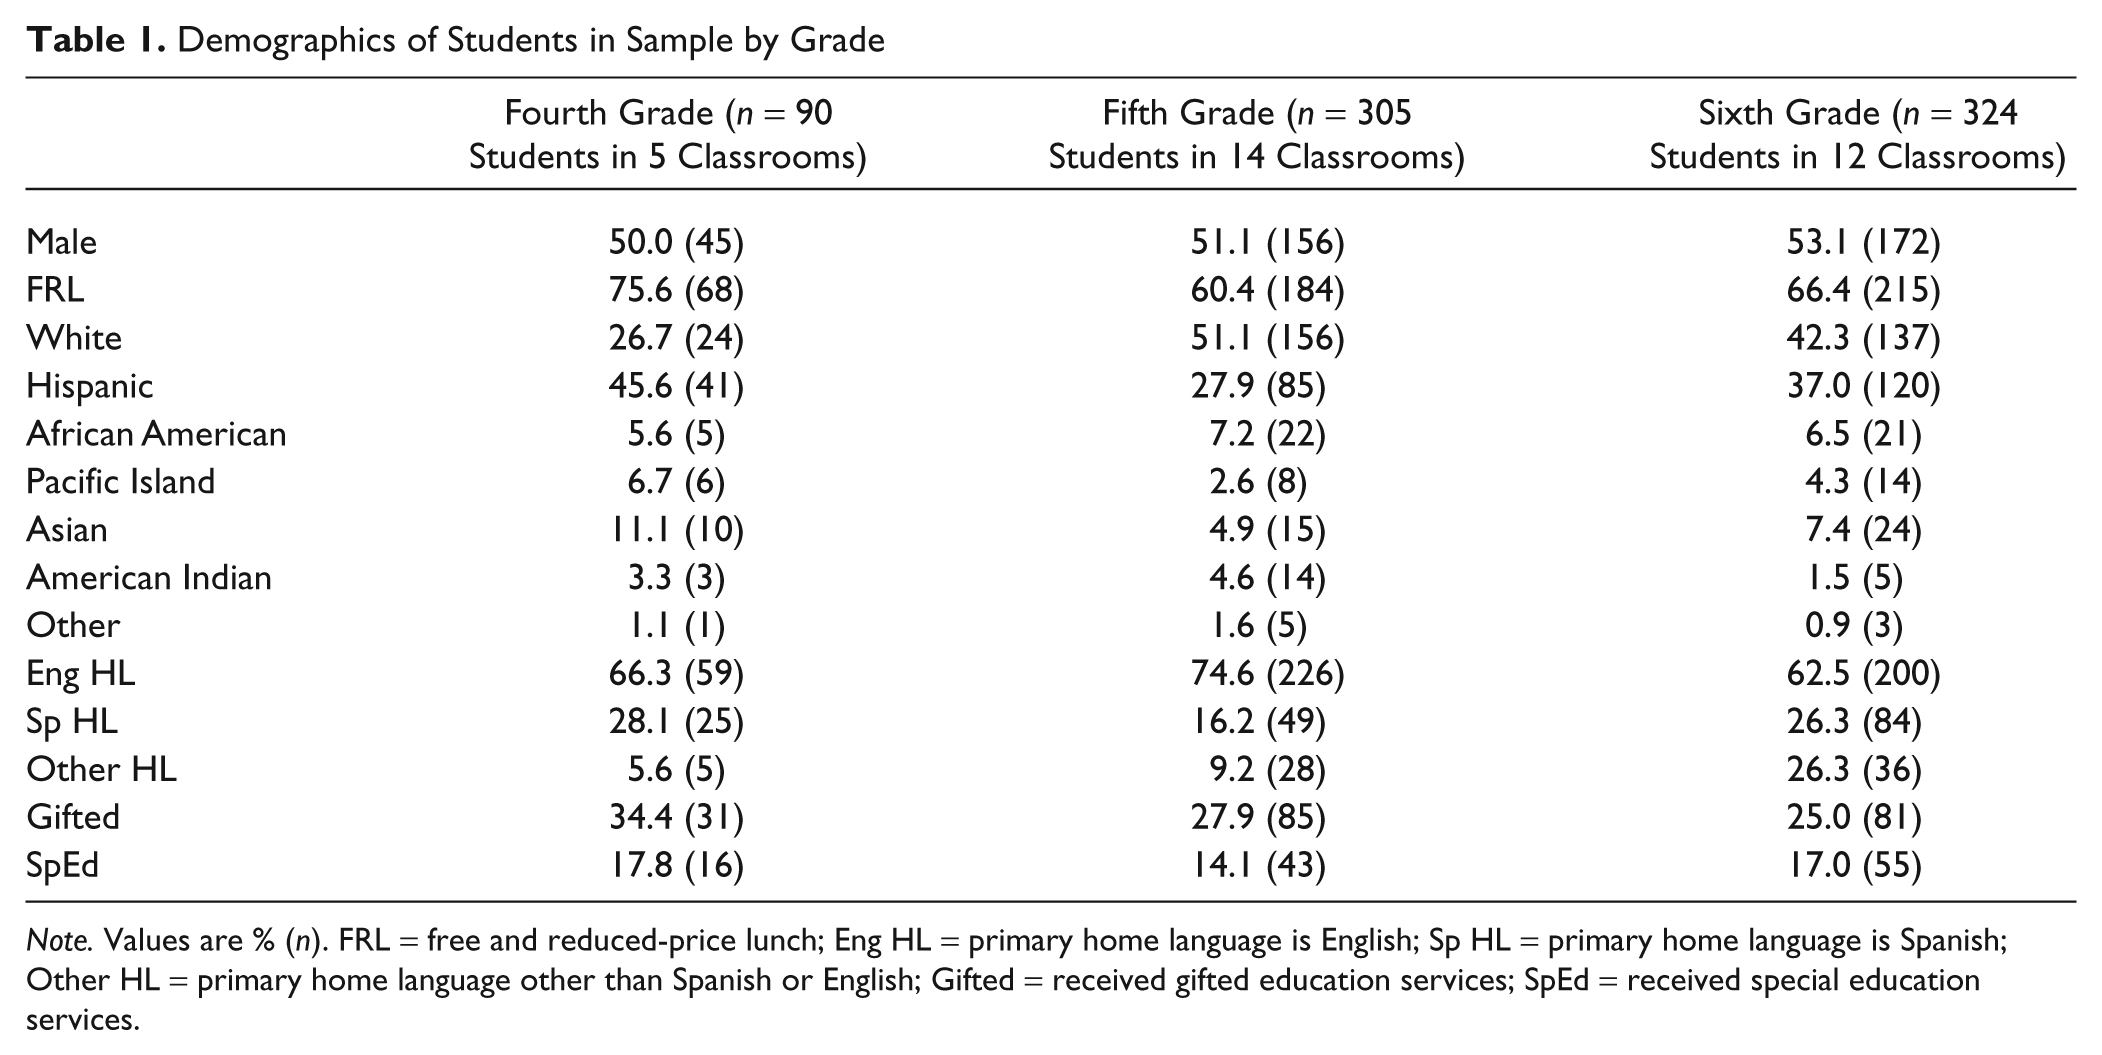
Note. Values are % (n). FRL = free and reduced-price lunch; Eng HL = primary home language is English; Sp HL = primary home language is Spanish; Other HL = primary home language other than Spanish or English; Gifted = received gifted education services; SpEd = received special education services.
Measures
AIMSweb Maze
Maze benchmark passages were obtained from https://aimsweb.edformation.com. Maze passages consisted of a text of about 350 words. The first sentence of the passage was left intact and thereafter a multiple-choice replacement response was required for every seventh word. Students read silently from the passage circling correct word replacements. The examiner times the students for 3 min using a stopwatch. Maze is scored for total number of correct word replacements within the 3-min period. The total possible number of correct replacements was 47 for the fourth-grade passage, 45 for the fifth-grade passage, and 48 for the sixth-grade passage. Construction procedures for the AIMSweb passages are described in the technical manual (Shinn & Shinn, 2002).
No validity data were found for AIMSweb Maze passages; however, concurrent validity coefficients for other researcher-developed Maze passages found in the literature range from .50 (Ardoin et al., 2004) to .80 (Espin et al., 2008) when comparing Maze to lengthier norm-referenced tests such as Woodcock Johnson-III Broad Reading Index (1989), Iowa Tests of Basic Skills Reading Index, or state language arts high-stakes tests. In general, concurrent validity coefficients are higher for upper grades of elementary, into middle and high school (Espin et al., 2008; Jenkins & Jewell, 1993; McMaster, Wayman, & Cao, 2006; Wayman et al., 2007).
English Language Arts Criterion Referenced Test
Utah’s English Language Arts Criterion Referenced Test (http://www.schools.utah.gov/assessment/info_ela.aspx) is a high-stakes accountability test used to make determinations concerning whether or not schools and districts have made adequate yearly progress (NCLB, 2002) The ELA-CRT was developed by the state of Utah to test the minimal level of literacy skills required for basic competency. It is administered to all students enrolled in 2nd through 11th grade. This test covers reading, writing, and listening as outlined in the state’s core curriculum. It has a multiple-choice format (66 items in fourth grade, 79 items in fifth and sixth grades) and takes approximately 150 minutes to complete. Items are sampled from the state curriculum objectives and standards. Test blueprints were examined for the 2008 ELA-CRT (Utah State Office of Education [USOE], 2008). For all three grades, about half the ELA-CRT assesses standards regarding reading, and half the ELA-CRT assesses standards regarding oral language and writing. The ELA-CRT results in standard scores and in categorical proficiency level scores: minimal, partial, sufficient, and substantial. The standard score for passing at each grade level is a standard score of 159.5 (the break between partial and sufficient proficiency scores).
Reliability and validity information on the ELA-CRT were provided by the USOE (2008). Internal consistency reliability was measured with Cronbach’s alpha (Cronbach, 1951) resulting in overall coefficients of .94 for fourth, fifth, and sixth grades. Item response theory (IRT) marginal response reliability coefficients, which take into account the standard error of measurement around test cutoff points, were .90 for fourth grade and .92 for fifth and sixth grades. Evidence of validity of the ELA-CRT was provided in the forms of content validity, construct validity, and criterion validity. Factor analysis suggests that between .83 and .90 of the variance in the ELA-CRT is explained by a unitary common factor in fourth through sixth grades. Concurrent validity was evaluated by comparing the ELA-CRT to norm-referenced tests (NRT) administered throughout the state in third, fifth, and eighth grades. In 2007, statewide correlations between ELA-CRT and a norm-referenced test (Iowa Test of Basic Skills; Hoover, Hieronymus, Frisbie, & Dunbar, 1996) ranged from .62 to .72 (USOE, 2008).
Procedures
The ELA-CRT was administered in May of the school year to all elementary schools throughout the district as part of ongoing testing operations. It was administered as a pencil and paper test. The Maze passages were group administered in students’ classrooms during this same month. The AIMSweb procedure fidelity checklist was used to guide administration and was completed during the course of administration (Shinn & Shinn, 2002). The first author tested students at two schools (15 classrooms). Classroom teachers, who were trained in the Maze procedure by the first author, administered the test at the remaining four schools (16 classrooms). Teachers practiced administering with a peer prior to classroom administration. Procedural reliability of 100% was required before teachers were allowed to administer the Maze. Half of Mazes were scored by district reading coaches who were trained in scoring procedures by the lead author. The other half were scored by the lead author.
Results
The data from the extant district database (concerning student demographic and ELA-CRT data) and a Maze Excel database were merged for analysis using a statistical software package (SPSS-version 15.0, 2007). Errors were corrected and no cases needed to be thrown out. The analysis was conducted in three steps. First, descriptive statistics pertaining to the various measures were generated. The data were inspected for outliers and distributional characteristics to verify that assumptions for statistical procedures were met. Second, scores from all tests were converted to z-scores so they would be on the same scale. Third, students were disaggregated based on ethnicity and home language, and hierarchical linear modeling was used to regress Maze onto ELA-CRT scores.
Interscorer Reliability and Data Screening
Interscorer reliability
Fifty of the Maze tests were randomly selected (through the SPSS program) to be rescored and compared to the database score to check for accuracy. Interscorer agreement was calculated through percentage of agreement, calculated by dividing the number of agreements by the total number of agreements plus disagreements, multiplied by 100. Agreement was 99%. Scores from 50 rescored tests and their originally entered values were correlated yielding a coefficient of .999. All scoring errors were corrected in the database.
Data screening
Prior to analysis, Maze and ELA-CRT results were examined for missing values and distributional characteristics in order to ensure the quality of the data set and to verify that assumptions of statistical procedures were met. Only students with data for all tests remained in the database, resulting in the removal of seven participants.
The mean scores of the ELA-CRT were above the cut score for passing (159.5) at each grade level. The CRT failure rate for the sample was 36% for fourth grade, 25% for fifth grade, and 28% for sixth grade. This compares to an overall district failure rate of 31% for fourth, 33% for fifth, and 32% for sixth and an overall state failure rate of 23% for fourth, 24% for fifth, and 22% for sixth (USOE, 2008). The distributions of ELA-CRT scores were approximately normal, with skewness ranging from −0.375 to 0.384 and kurtosis ranging from 0.20 to 1.16 across grades. Average Maze scores ranged from 14 correct replacements (CR) in fourth grade to 22 CR in fifth. Skewness and kurtosis for Maze approximated a normal distribution. Maze was slightly positively skewed across grades. Data for all measures met assumptions of normality (see Table 2).
Descriptive Statistics of Sample (N = 712)

Note. ELA-CRT = Utah English Language Arts Criterion Referenced Test standard score; ORF = Oral Reading Fluency number of words read correctly; Maze = AIMSweb’s version of Maze, number of correct replacements; n = number of students in grade-level grouping.
A one-way random effects ANOVA was run through HLM 6.06 to examine the degree to which nesting effects were present at classroom and school levels. There were significant nesting effects at classroom and school levels. An empty model with random effects and no predictor variables showed significant variability in mean ELA-CRT scores across schools: χ2(5) = 17.7, p < .01. Variability between classrooms within schools was also significant: χ2(25) = 242.1, p < .01. Twenty-eight percent (28%) of the variance in ELA-CRT scores was due to classroom-level variables and 16% of the variance in scores was due to school-level variables. The reliable proportion of variance among classrooms within schools was 89%, indicating good ability to distinguish between classes within schools based on mean class ELA-CRT scores. The reliable proportion of variance among schools was 67%, indicating good ability to distinguish between schools based on mean school ELA-CRT scores.
Minority Disproportionality
Of particular interest, because of their large representation in the sample, were those of Hispanic ethnicity and those who speak Spanish at home. Screening probes were considered biased if, using linear regression, there were significant differences in slope or intercept, based on group membership (Cleary, 1968). Because of relatively small numbers in many ethnic groups within the sample, groups were combined into three general categories: White, Hispanic, and neither White nor Hispanic (NWNH). Likewise, primary home languages spoken at home were combined into three categories: English, Spanish, and neither English nor Spanish (NENS).
Table 3 displays ethnic, home language, gender, and socioeconomic group mean scores and standard deviations for Maze and ELA-CRT. Differences in group means are not evidence of bias; however, they do indicate levels of disproportionality of identification that will result from norm-based selection procedures. Furthermore, group mean differences can aid in understanding correlation coefficients and regression coefficients. All reported means and standard deviations are z-scores, with a mean of 0 and with a standard deviation of 1, based on grade norms of the sample. This was done to facilitate comparisons across grades and measures. On average, White students performed about 0.9 standard deviations better than Hispanic students on ELA-CRTs and 0.8 standard deviations better than Hispanic students on Maze. Similarly, on average native English speakers performed 0.8 standard deviations better on Maze and ELA-CRT than did those who spoke primarily Spanish at home. Standard deviations for the Hispanic and Spanish-speaking students were lower, indicating less range in scores. To test statistical significance of mean difference, one-way ANOVAs were run with Tukey HSD (Honestly Significant Difference) as the follow-up post hoc analysis (see Table 3).
Z-Score Means and Standard Deviations Across Demographic Groups

Note. Standard deviations listed in parentheses. Tests for significance on ELA-CRT were not run because of significant random effects in HLM. NWNH = Neither White nor Hispanic; NENS = Neither English- nor Spanish-speaking.
p < .01, two tailed.
Analysis of Bias for Ethnicity
To determine if differences in intercepts or slopes were significant without violating the independence assumption, analysis was conducted using multiple regression with the HLM statistical package (Raudenbush, Bryk, & Congdon, 2008). Dummy coding was used to reflect regression contrasts between Whites and Hispanics and between Whites and NWNH.
Table 4 shows the results of fixed and random effects of the HLM analysis. Intercept bias was found for Hispanic students and NWNH students. Maze has a tendency to underidentify Hispanic students. There were mean differences in intercepts for these groups. Minority students, both Hispanic and NWNH, had lower mean scores than White students: t(706) = −3.926, p < .001, and t(706) = −4.584, p < .001, respectively. Hispanic ethnicity was responsible for a predicted 3.0 point drop in ELA-CRT standard scores and NWNH was responsible for a 3.7 predicted drop.
Fixed and Random Effects of Ethnicity and Maze

Slope bias was evaluated by examining the interaction effects between Maze and ethnic status (Maze × Hispanic Ethnicity and Maze × NWNH ethnicity). There were no significant interactions between Maze and ethnicity for either the Hispanic, t(706) = 0.039, p = .97, or the NWNH group, t(2.287) = 2.287, p = .07; that is, no statistically significant slope bias was found. This suggests that Maze functions similarly across the range of scores for the various ethnic groups (i.e., incrementally higher Maze scores suggest incrementally higher ELA-CRT scores at similar rates across the measure). However, the difference between White and NWNH slopes varied significantly across schools, χ2(5) = 32.4. In other words, on average, NWNH students were not significantly different from White students; however, from school to school, the difference in slope between White and NWNH groups varied significantly.
Analysis of Bias for Home Language
The same procedures were used to evaluate bias for home language. Dummy codes created provided a centered contrast for each student expressing the difference between home language groups, with the English-speaking group being the reference group. Spanish home language (SHL) students were compared to English home language (EHL) students. Students who spoke a language other than Spanish or English (NENS) were also compared to English-speaking students. The dummy-coded variables, the interaction contrasts, and Maze z-scores were modeled in HLM.
Table 5 shows the result of fixed and random effects of the HLM analysis. Maze had a tendency to underidentify Spanish-speaking students. Both SHL and the NENS had lower mean scores than did EHL, t(706) = −3.77, p < .0005, and t(706) = −3.20, p = .002, respectively. A Spanish home language was responsible for a predicted 3.25 point drop in ELA-CRT scores.
Fixed and Random Effects of Home Language and Maze

Slope bias was evaluated by examining the interaction effects between Maze and language status (Maze × SHL and Maze × OHL). There were no statistically significant interactions between Maze and ethnicity for either SHL, t(706) = −1.85, p = .065 or OHL, t(5) = 1.945, p = .108. This suggests that Maze functions similarly across the range of scores for the various linguistic groups. However, as was the case with NWNH ethnicity, there were significant differences between schools regarding the interaction between NENS and Maze, χ2(5) = 21.1, p = .001. In other words, although the grand mean difference in slopes between EHL and NENS students was not significantly different, from school to school there was significant variation.
Practical Impact
To further evaluate the practical significance of intercept bias across demographic groups, a percentage of false negatives, false positives, and correct decisions were calculated for each demographic group. Results of these correct and incorrect decisions are displayed in Table 6. Cut scores were established by using a logistic regression to select the Maze score that gave students an 80% chance or better of passing the ELA-CRT, based on the aggregation of all participants.
Percentage of Incorrect and Correct Decisions Across Demographic Groups

Note. FRL = free or reduced-price lunch; Full lunch = did not receive free or reduced-price lunch.
Overall, Maze yielded low rates of false negatives (2.8%). When the screening measure indicated that students were likely to pass the ELA-CRT, they generally did. Across measures and demographic groups, meeting or beating the cut score did put odds dramatically in favor of passing the ELA-CRT. Maze had very few false negatives across demographic groups (1.2%–4.4% across all groups).
The overall hit rate for Maze (65.2%–81.9%) was acceptable but not as high as we would have liked because of the number of false positives. False positives for Maze ranged from 15% to 31% across demographic groups studied. The greatest percentages of false positives came from students with Hispanic ethnicity and who spoke primarily Spanish at home.
Discussion
The current findings suggest that across demographic groups Maze has good concurrent validity with a state high-stakes language arts test outcome measure. Slope bias was not found for either those who speak primarily Spanish at home or for those of Hispanic ethnicity. So between demographic groups and across scores, Maze functions similarly in prediction of high-stakes test results. However, statistically significant intercept bias was found. Maze has a tendency to underidentify students with Hispanic ethnicity and students who speak primarily Spanish at home. In other words, a given score on Maze is associated with a lower predicted score on the state outcome measure for Hispanic and Spanish-speaking students than for their White and English-speaking counterparts.
Test bias has been a contentious topic at least since the Civil Rights Act of 1964, which among other things made it illegal to classify in a way that that would adversely impact employment opportunities of various demographic groups (Camilli, 2006). Bias found in high-stakes tests concerning intelligence, college entrance, employment, and special education have resulted in court cases, discussions on how to measure fairness, and revised test standards (Camilli, 2006; Cole & Moss, 1993). Is bias of equal concern for a low-stakes screening measure? The adverse consequence of biased tests used to make high-stakes decisions, such as college entrance exams, is clear. Consequences from screening measures are less dramatic. Catts (2006) recounted the costs of under- and overidentification in academic screening measures: underidentification results in missed opportunity for early intervention, and overidentification results in increased expense of additional testing and intervention services. Of these negative consequences, missing opportunities for early intervention when it is needed is the most detrimental to those most in need of support and protection.
Fortunately, Maze is a reasonably strong predictor across groups and the bias had a relatively small practical effect, particularly where the false-negative rate was very low for Whites and just a bit higher for minority populations (e.g., NHNC, and Hispanic). For ELs (both Spanish and NENS) and for ethnic minorities, the practical significance of false negatives for Maze was small (Table 6). Given our cutoff scores, the overall false negative rate was low for native English speakers (2.1%) and slightly higher for Spanish speakers (4.4%). Nevertheless, the finding of intercept bias among minority populations is of concern. Decision makers such as teachers and administrators should be aware of the potential of Maze to underidentify Hispanic and Spanish-speaking students for remediation services.
In addition to having more false negatives, which resulted in overall underidentification, Hispanic and Spanish-speaking populations also had a higher percentage of false positives than the White population (Table 6). That there are more errors in both directions (false positives and false negatives) may be explained in either (or both) of two ways: greater random measurement error and population diversity. There may well be more random error involved with scores in Hispanic and Spanish-speaking populations. Scores of both predictor and outcome measures are the result of multiple-choice responses. Perhaps because of more limited cultural and linguistic background, students within these populations are more prone to frustration and engage in more random guessing, thereby reducing reliability of scores. An alternative explanation is that diversity within Hispanic and Spanish-speaking populations leads to a less predictable relation between Maze and the State test. For example, perhaps in some Spanish-speaking subpopulations, students attain a higher ranked score on Maze than on the State test because they have developed their reading skills (measured with Maze) to a higher degree than they have developed content area and cultural knowledge (measured to a greater degree with the State test). In other Spanish-speaking subpopulations, which have had more educational opportunity yet less English reading instruction, there may be a greater degree of content area and cultural knowledge (important for the State test) relative to reading skills in English (important for Maze). One would expect the latter from a well-educated recent immigrant, and the former from a precocious student who formerly had limited educational opportunity. The degree to which the current results are due to one or another of these explanations cannot be determined from existing data. Studies involving differential reliability between demographic groups, and item analysis of the ELA-CRT would be required to answer such questions.
Implications for Practitioners
Practitioners should be aware that Maze may have a tendency to underidentify Hispanic students and students who speak primarily Spanish at home. There are several possible remedies for underidentification. First, schools can maintain high benchmark scores to minimize false negatives across all demographic groups. Those who are screened as potentially needing additional assistance could then be further evaluated with another gate of reading assessment, perhaps ORF. A second option would be for schools to use multiple screening measures universally, such as administering both Maze and ORF to all students. Using Maze and ORF together may help reduce false positives. In another study examining adding ORF to Maze reduced the number of false negatives by half (Richardson, Hawken, & Kircher, 2011). However, this option is more costly in terms of testing time and resources. A third option, which could be used in conjunction with either of the first two options, would be to encourage teachers to use additional classroom information they have about their students regarding language acquisition level, classroom performance, and motivation in combination with screening measures to help place students in intervention groups. Of course this latter approach has a clear danger of being inconsistent and introducing other forms of bias, especially absent training and decision rules to guide the process.
Overidentification is an easier problem to address. Once students have been identified as being at risk, an additional course of progress monitoring has been shown to dramatically reduce the numbers of false positives (Compton, Fuchs, Fuchs, & Bryant, 2006). Once progress monitoring data show that students are performing at appropriate levels, they can be removed from remedial services. This weighs in favor of maintaining high benchmark thresholds to increase the degree of certainty of finding culturally and linguistically diverse students who may require additional instructional support.
Limitations and Future Research
The current study has several limitations and is suggestive of lines for future research. These limitations can be grouped into two categories: limitations concerning the study’s sample and the measures used.
Population sample
The current study is limited in its generalizability by the sample’s size and composition. The sample consisted of 719 students from the three upper grades of elementary school all enrolled in a single school district. Very large state or national databases such as those found in Roehrig, Petscher, Nettles, Hudson, and Torgesen (2008) are able to produce results with more power and are able to measure more subtle between-group differences. This study was also limited in generalizability because of the composition of the participants. There were a high proportion of Hispanic and Spanish-speaking students, mainly of Mexican origin; however, other ethnic groups were not present in large enough numbers to make strong conclusions.
Measures used
Other limitations to generalizability concern the measures used. Although many other states use similar test construction methods and value similar academic outcomes in their core standards, the ELA-CRT is a test that is unique to Utah, and other high-stakes state tests of reading might lead to slightly different results. Little is known about the degree of bias in the ELA-CRT. Whenever there are indications of external bias, it is uncertain whether that bias results from the screening measure or the outcome measure (Linn & Dunbar, 1986). Under- or overprediction can result from a biased outcome measure just as it could result from a biased predictor. All that is currently known is that EL status and Hispanic ethnicity are associated with lower scores. A discrimination analysis of the ELA-CRT scores indicates correlations of −.25 to −.29 with EL status (USOE, 2008, p. 63) and the average score of Hispanic students is significantly lower than that of White students. However, no studies of internal or external bias of the ELA-CRT have been conducted.
The Maze passages used in this study were carefully developed with meticulous attention to test development with input from previous research on Maze regarding factors such as optimal administration time, number of distracters, distracter selection, and passage difficulty levels (Howe & Shinn, 2002; Shinn & Shinn, 2002). Nevertheless, not enough is known about their reliability characteristics. A recognized source of bias is variation of the standard error of measurement from one population group to the next (Linn & Werts, 1971). The standard error of measurement depends on two factors, the standard deviation of scores within a population and the reliability within that population (Jensen, 1980). Further studies concerning alternate form reliability should be performed in order to gain further confidence with Maze. Alternate form reliability coefficients should be generated and disaggregated by demographic group to further understand in what contexts and with what populations Maze is (and is not) dependable.
Footnotes
The authors declared no potential conflicts of interest with respect to the research, authorship, and/or publication of this article.
The authors received no financial support for the research, authorship, and/or publication of this article.