
Abstract
Using extant data, the purpose of this study is to examine methods for determining response to intervention (RTI) in a sample of kindergarten English Learners (ELs). Three commonly used methods for determining RTI—(a) benchmark criteria, (b) slope discrepancy, and (c) dual discrepancy—are investigated. Participants included 117 ELs. Students were administered pretests and then provided intervention in phonological awareness and phonics in small groups. Progress was monitored weekly on two Dynamic Indicators of Basic Early Literacy Skills measures, Phoneme Segmentation Fluency and Nonsense Word Fluency. Results indicate that there is very little overlap across the three methods and across the two measures in determining response and nonresponse for kindergarten ELs. The results of the study have implications for continued research regarding response of ELs as well as practical implications regarding which methods and measures should be used to determine response.
Students who speak a language other than English at home continue to be a rapidly growing segment of the K-12 population in the United States (National Center for Education Statistics, 2011). In fact, the number of English Learners (ELs) has increased from 4.7 to 11.2 million (21% of the school-age population) over the last 29 years. Of these ELs, approximately 72% speak Spanish at home. Only 7% of 4th grade and 3% of 8th grade ELs scored at or above proficiency on national reading assessments as compared with 37% and 35% of native English speakers (National Assessment of Educational Progress, 2011). This suggests a persistent and increasing achievement gap between ELs and their English-speaking peers. The achievement gap begins at school entry with only 17% of kindergarten ELs scoring above the 50th percentile on initial school assessments in language arts, math, and general knowledge (Gándara, Rumberger, Maxwell-Jolly, & Callahan, 2003). The long-term effects of the achievement gap and inadequate instruction are significantly higher drop-out rates for 10th graders whose first language is not English as compared with those who speak English as a first language (Rumberger, 2011). In addition, many ELs live in poverty and, therefore, attend underresourced schools with less qualified teachers and limited access to appropriate curriculum and materials, which exacerbates the academic difficulties of these students (Gándara et al., 2003). Unfortunately, many teachers are unsure of how to adapt curriculum to meet the individual needs of ELs and therefore look to special education for assistance (Gersten & Woodard, 1994).
Research examining the representation of ELs in special education is limited (Artiles, Rueda, Salazar, & Higareda, 2005; Samson & Lesaux, 2009). Often, ELs are underrepresented in the primary grades, kindergarten through second grade, and then overrepresented in third grade and beyond. Teachers in the primary grades often do not identify ELs as at risk because they believe that their reading difficulties are due to lack of English proficiency, and therefore, these young ELs may not receive the interventions they need (Limbos & Geva, 2001). However, once students reach third grade and are expected to have greater proficiency in English, teachers identify ELs for special services at a higher rate than their monolingual peers. The majority of these referrals are for high-incidence disabilities, such as learning disabilities (LDs), most commonly, reading disabilities (Artiles et al., 2005; Samson & Lesaux, 2009).
Response to Intervention (RTI)
Recent educational initiatives, including the 2004 reauthorization of the Individuals With Disabilities Education Act (IDEA), have emphasized the critical role of early reading instruction in general education to prevent reading difficulties. These initiatives recognize that students who do not develop the skills necessary to read adequately in the early grades (e.g., kindergarten and first grade) typically have persistent reading difficulties throughout secondary school (Francis, Shaywitz, Stuebing, Shaywitz, & Fletcher, 1996; Juel, 1988; Torgesen & Burgess, 1998). In addition to addressing the prevention of reading difficulties, the field has sought an alternative to the traditional IQ-discrepancy model in identifying students with LD. A specific framework has grown out of these two needs, RTI, which was proposed in IDEA (2004) as an alternative method for identification of students with LD. Although the details of implementation vary, RTI is a model that consistently
integrates assessment and intervention within a multi-level prevention system to maximize student achievement and reduce behavior problems. With RTI, schools identify students at risk for poor learning outcomes, monitor student progress, provide evidence-based interventions and adjust the intensity and nature of those interventions depending on a student’s responsiveness, and identify students with learning disabilities. (National Center on Response to Intervention, 2010, p. 2)
RTI is a model that considers students’ achievement level and academic growth, or response, as a result of adequate instruction (Gresham, 2002). Typically, a three-tiered model is conceptualized. In this framework, Tier 1 is high-quality core or general education instruction, Tier 2 is more strategic intervention for students at risk, and Tier 3 is more intensive intervention and/or special education (see O’Connor, Fulmer, Harty, & Bell, 2005, for a review of RTI).
Data-based decision making is at the center of RTI. Instructional decisions are made based on screening and progress monitoring data (National Center on Response to Intervention, 2010), allowing teachers to modify instruction if students are not making adequate progress. Measurement and instructional methods vary across RTI models. RTI is a framework that guides these decisions, but does not provide specific methods for evaluation or curricula delivery. Variability includes choice of curricula, method of implementation, and local versus national norming samples. In the present study, the RTI model implemented adheres to a standard protocol approach, in which screening criteria are based on benchmark norms and curricular methods are predetermined (see “Method” section).
The literature, particularly on Tier 2 interventions within RTI models, has grown tremendously over the past several years. In a recent practice guide on RTI, published by the Institute of Education Sciences, Gersten and colleagues (2008) reviewed existing Tier 2 interventions. The authors found that across the studies, explicit instruction in reading skills was effective and produced positive reading outcomes for students. In addition, the studies suggested that Tier 2 interventions for kindergartners should include phoneme segmentation, letter-sound identification, alphabetic principle, as well as beginning decoding skills. However, the majority of these studies included only monolingual English-speaking students.
RTI for ELs
Although much of the RTI literature has focused on monolingual students, there has been an increase in the research on effective instruction and intervention for ELs, particularly in reading (August & Shanahan, 2006; Denton, Anthony, Parker, & Hasbrouck, 2004; Gerber et al., 2004; Gersten et al., 2007; Vaughn et al., 2006) as well as research on progress monitoring instruments that are valid for ELs (Graves, Plasencia-Peinado, Deno, & Johnson, 2005; Linklater, O’Connor, & Palardy, 2009; Oh, Haager, & Windmueller, 2007; Vanderwood, Linklater, & Healy, 2008; Wayman, Wallace, & Wiley, 2007). In a synthesis of research on effective reading instruction and intervention for ELs, Gersten et al. (2007) suggested that ELs should be screened for reading problems, and those identified at risk should receive intensive, small group instruction in phonemic awareness, phonics, fluency, vocabulary, and comprehension. In addition, the progress of these students should be monitored. The authors also found that instruction for ELs should include targeted vocabulary instruction and many opportunities for peer interaction (Gersten et al., 2007).
Intervention
RTI studies examining intervention for ELs generally have addressed Tier 2 reading interventions, and this growing body of research shows promising effects for systematic, explicit instruction (Graves, Gersten, & Haager, 2004; Haager & Windmueller, 2001; Leafstedt, Richards, & Gerber, 2004; Linan-Thompson, Vaughn, Hickman-Davis, & Kouzekanani, 2003). Studies that have focused on early reading skills (i.e., phonological awareness [PA], decoding, reading fluency) indicate that with intervention, ELs make significant growth in these skill areas (Denton, Anthony, Parker, & Hasbrouck, 2004; Gerber et al., 2004; Leafstedt et al., 2004; Vaughn et al., 2006), and this growth is similar to the growth of their English-speaking peers (Linan-Thompson, Cirino, & Vaughn, 2007). Interventions for ELs are most effective when they maximize student engagement by providing multiple opportunities to accurately respond within small, homogeneous instructional groups (Gersten & Geva, 2003; Vaughn et al., 2006).
Assessment
Research that has focused on screening and progress monitoring measures for ELs is limited but promising, indicating that curriculum-based measures used for progress monitoring are valid for ELs (Graves et al., 2005; Linklater et al., 2009; Oh et al., 2007; Vanderwood et al., 2008; Wayman et al., 2007). Several of these studies have examined prereading measures used for screening and progress monitoring such as Phoneme Segmentation Fluency (PSF) and Nonsense Word Fluency (NWF) from the Dynamic Indicators of Basic Early Literacy Skills (DIBELS). Studies indicate that for young ELs, these measures are valid for predicting later reading outcomes and provide information for making instructional decisions (Oh et al., 2007; Vanderwood et al., 2008). More specifically, for ELs in kindergarten, DIBELS measures of PSF and NWF are predictive of decoding and reading fluency in first grade (Oh et al., 2007).
Promises and limitations
For ELs, RTI holds promise for improving student academic outcomes (Haager, 2007). The focus on preventing reading difficulties offers the possibility of delivering Tier 1 instruction that is high quality and appropriate for ELs, providing early intervention, and reducing the number of unwarranted referrals to special education. Although the RTI literature includes an increasing amount of research with ELs (Kamps et al., 2007; O’Connor, Bocian, Beebe-Frankenberger, & Linklater, 2010; Richards, Leafstedt, & Gerber, 2006; Vaughn et al., 2006), much more research is needed. We cannot assume interventions and methods for determining response that are effective for monolingual students are appropriate for ELs (Klingner & Edwards, 2006; Klingner, Sorrells, & Barrera, 2007).
Determining Response and Nonresponse
Although effective instruction and progress monitoring are critical components of RTI models, RTI also requires determining whether a student responds sufficiently to the provided instruction (L. Fuchs & Fuchs, 1998). Typically, response has been examined by using three different methods: benchmark criteria, rate of growth, and dual discrepancy (DD; D. Fuchs & Deshler, 2007; L. Fuchs, Fuchs, & Compton, 2004; Speece, Case, & Molloy, 2003). Benchmark criteria methods determine performance cutoff levels on specific target skills known to predict reading ability (Gresham, 2002). Students who do not reach the specified benchmark or are one standard deviation below the average of their peers on target skill measures are considered to have not responded sufficiently. Benchmark methods have been used mainly for oral reading fluency (ORF) with populations of first and second graders (Barth et al., 2008; Linan-Thompson et al., 2007; Schatschneider, Wagner, & Crawford, 2008). Growth methods are generally evaluated by calculating slope. Students who have a slope that is a given standard deviation below the average of their peers are considered to have not responded sufficiently (L. Fuchs et al., 2004; McMaster, Fuchs, Fuchs, & Compton, 2005; Speece, Case, et al., 2003). DD methods consider a discrepancy on both benchmark criteria and slope. Using this approach, students who do not meet benchmark criteria and are not making growth comparable with peers are considered to have not responded sufficiently (L. Fuchs et al., 2004; Speece, Case, et al., 2003).
Studies investigating the three aforementioned methods to determine insufficient response have shown varying results. Some studies have indicated that slope is more predictive of later achievement and more clearly discriminates response and nonresponse than using only benchmark criteria (L. Fuchs et al., 2004; McMaster et al., 2005; Speece, Case, et al., 2003). Although one standard deviation below the mean slope is typically used, McMaster and colleagues (2005) used a half standard deviation below the mean and found that it was predictive of student RTI. Furthermore, these studies indicate that DD methods, which consider both benchmark level and slope, are most useful in identifying student response. In comparison, other studies have shown that slope does not predict response better than using a benchmark criterion (Barth et al., 2008; Schatschneider et al., 2008). For example, in an effort to determine which method of measuring response is most effective in predicting later reading performance, Schatschneider et al. (2008) examined these three methods in a large sample of first-grade students. The authors found that growth on ORF did not provide any additional information about response beyond what ORF benchmark criteria predicted. In another study examining methods of defining response (Barth et al., 2008), results indicated that none of the three methods for determining response were more discriminating than the others in predicting response. In addition, the authors found that the three methods had minimal overlap in predicting nonresponse. That is, each method for the most part predicted a different group of students as insufficiently responding.
Response and nonresponse among ELs
For ELs, there is very limited research regarding methods of determining response (Linan-Thompson et al., 2007). Linan-Thompson et al. (2007) examined various methods for defining response in a population of ELs, specifically first-grade ELs, who received a supplementary, Tier 2 intervention. To examine response, the authors used three methods based on Woodcock Language Proficiency Battery–Revised (WLPB-R) word attack and passage comprehension, and DIBELS ORF scores: (a) benchmark criteria (standard score of 95 or higher on WLPB-R and raw score of 40 on DIBELS ORF), (b) benchmark discrepancy (W score at or above the mean of longitudinal sample on WLPB-R and raw score at or above mean of the longitudinal sample on DIBELS ORF), and (c) slope discrepancy. When examining the best method for predicting response in second grade, defined as standard scores at 37th percentile on WLPB-R word attack and passage comprehension, and an ORF score of 70, slope discrepancy (i.e., growth as compared with peers) most accurately determined which students responded and which students did not.
Purpose
Minimal research on methods for determining response exists, particularly for ELs, and the lack of consensus in the existing literature indicates the need for further investigation in this area. The purpose of the present study is to extend the research on defining response for ELs by examining response and nonresponse in a group of at-risk kindergarten ELs who received a supplementary, Tier 2 intervention. Specifically, the study investigates response/nonresponse in a sample of ELs when categorized by (a) benchmark criteria, (b) slope discrepancy, and (c) DD. This study uses extant data from two research studies conducting similar Tier 2 interventions. The original studies were designed to examine the effectiveness of interventions for ELs, but the data provide a unique opportunity to examine different methods for determining response. The major research questions are as follows:
Research Question 1: When applying the three commonly used methods for determining response, what percentage of students respond or do not respond?
Research Question 2: Do the three methods and key measures identify a similar group of students as responding sufficiently or insufficiently?
Method
Participants
The participants in the study were 117 kindergarten Spanish-speaking ELs; however, only 114 students had full data sets and were used for analyses. The students represent three cohorts, situated in the same school. Students were from seven intact kindergarten classes across three school years. Students’ mean age was 66 months with a range of 60 to 71 months. Sixty-one (52%) of the students were female. All students in these kindergarten cohorts were designated as ELs by the school district using the California English Language Development Test (CELDT). The CELDT places students into one of five levels of English proficiency, ranging from beginning to advanced. In kindergarten, this level is based on scores from two domains: listening and speaking. The English proficiency of the students in this study ranged from beginning to advanced, with approximately 70% of the students falling in either Level 1, beginning, or Level 2, early intermediate. Parent survey data indicated that 79% of the students were born in the United States, 63% of the families spoke only Spanish at home, and 37% spoke a mixture of English and Spanish. Average household income was reported between US$20,000 and US$29,000 for a family of four. Of the students in these cohorts, 35% attended preschool, and parents reported an average of 1.5 books in the home. Parent education was varied; of the student participants, 25% had at least one parent who completed only a sixth-grade education, 50% had at least one parent who had a high school education, and 20% had at least one parent who had some college education.
Setting
The study was conducted at a Title I elementary school in a semirural, predominately Spanish-speaking community in southern California. According to state demographic data, 74% of students in the school were designated as ELs at the time of the study. The school received an Academic Performance Index (API) ranking of 1, the lowest possible score, during all 3 years the studies were conducted. API measures the academic performance and growth ranking of schools on a variety of academic measures. The kindergarten program at the school was half-day, and all instruction was in English. All ELs at the school received 30 min of English language development in addition to language arts instruction. The language arts curriculum was a state-adopted curriculum, which included research-based reading components. The same teachers taught kindergarten over the 3 years that the studies were conducted. The school was not using a schoolwide RTI model at the time of this study.
Descriptive Measures
At pretest in November and December of the kindergarten year, and posttest in May and June, students were administered PA, word reading, and vocabulary measures. The PA measures were administered in both English and Spanish and included onset and rime detection, segmentation, and blending. All measures, except for the English blending measures, were developed specifically for the larger research study (see Gerber et al., 2004). The English blending measure was from the Comprehensive Test of Phonological Processing (CTOPP; Wagner, Torgesen, & Rashotte, 1999). To measure English word reading and decoding, the word identification and word attack subtests from the Woodcock–Johnson III Tests of Achievement III (2001) were administered. Vocabulary level was assessed with English and Spanish standardized receptive vocabulary measures, Peabody Picture Vocabulary Test (PPVT; Dunn & Dunn, 1981) and Test de Vocabulario en Imagenes Peabody (TVIP; Dunn, Lugo, Padilla, & Dunn, 1986). The measures described here were not used as outcome measures but instead used to provide a description of the student population and to conduct initial analyses comparing the three cohorts. (See Table 1 for raw score means and standard deviations.)
Pretest and Posttest Means and Standard Deviations on Descriptive Measures for All Students (N = 117).

Note. PA = phonological awareness; TVIP = Test de Vocabulario en Imagenes Peabody; PPVT = Peabody Picture Vocabulary Test.
Early PA composite score includes English and Spanish onset and rime scores.
Late PA composite score includes English and Spanish segmentation and blending scores.
Progress Monitoring Outcome Measures
The DIBELS PSF and NWF (Good & Kaminski, 2002) were used to identify at-risk students and monitor student progress weekly during intervention. Both assessments are individually administered, 1-min timed tests. For PSF, the assessor provides each word orally to the student. The student states each sound in the word. After the student responds, the assessor provides the next word. One point is given for each correct sound. For NWF, the student is given a probe sheet with consonant-vowel-consonant (CVC) nonsense words to read. The student provides either the individual sounds of the word or reads the whole word. The score is the number of correct sounds per minute. Total number of nonsense words read as whole words was also recorded. For PSF, reliability coefficients range from .74 to .99 and validity coefficients from .52 to .65 (Good et al., 2004). For NWF, reliability coefficients range from .83 to .94 and validity coefficients from .66 to .77 (Good et al., 2004).
PSF and NWF were chosen as outcome measures for several reasons. First, they both have been found to be predictive of later reading outcomes (Good, Simmons, & Kame’enui, 2001) and have been shown to predict various first-grade reading outcomes (Fien et al., 2008; Rouse & Fantuzzo, 2006; Speece, Mills, Ritchey, & Hillman, 2003). The limited research on early reading measures for ELs indicates that DIBELS measures of PSF and NWF are valid and reliable for this population of students (Oh et al., 2007; Vanderwood et al., 2008). In addition, although some research has indicated that word identification fluency in first grade is a better predictor than NWF of later reading outcomes (Compton, Fuchs, Fuchs, & Bryant, 2006; L. Fuchs et al., 2004), this has not shown to be true for kindergarteners just beginning to learn to read words or for ELs. Finally, although there are two additional DIBELS measures used in kindergarten, Letter Naming Fluency (LNF) and Initial Sound Fluency (ISF), these measures were not used because LNF is not available to be used as a weekly progress monitoring instrument and ISF is not as good of a predictor as PSF after December of kindergarten (O’Connor & Jenkins, 1999).
Procedure
Teachers volunteered to have their classes participate in the studies. Interventions began in January after pretesting was complete. All students were provided supplementary intervention in addition to their 90 min of language arts instruction. All students received intervention because so many students were originally identified at risk based on initial PSF and NWF measures, and practically it was more feasible for all students to rotate in small groups to the “intervention center.” Intervention was provided in small ability-level groups of three to five students within the kindergarten classroom. Instruction was accelerated for higher performing students. For example, interventionists moved higher performing students to later lessons and at times completed two lessons in one session. Students received between 350 and 400 min of intervention over the course of either 8 or 10 weeks. Across the cohorts, no student missed more than two intervention sessions; the majority of students did not miss any sessions. In Cohorts 1 and 2, the intervention was provided 2 days per week for 20 min over 10 weeks. In Cohort 3, the intervention was provided 3 days per week for 15 min over 8 weeks.
Students received supplemental intervention in PA, decoding, and spelling using the Core Intervention Model (CIM), which was developed for use with ELs who have reading difficulties (Leafstedt et al., 2004; Richards & Leafstedt, 2010). The CIM uses a direct instruction model (Englemann & Carnine, 1982) and dictates that (a) material must be appropriate for students’ ability level, (b) specific objectives must be set, (c) skills must be taught intensively and explicitly at a rapid pace, (d) students must be provided opportunities for many correct responses, and (e) explicit correction procedures must be used (Richards & Leafstedt, 2010). A small group of the 117 students (n = 40) received a listening comprehension intervention in addition to the PA and decoding intervention for 10 min each day (see Solari & Gerber, 2008). Students were randomly selected to receive this additional intervention, as it was part of the original study design (see Solari & Gerber, 2008). There were no significant differences between the group of students who received the listening comprehension intervention and the other students who only received the PA and decoding intervention at pretest or posttest.
Each intervention session incorporated activities addressing at least two skills and varied in task difficulty. Decoding and spelling skills were taught in conjunction with PA skills using letter tiles, whiteboards, and other manipulatives to read and spell CVC words. The listening comprehension portion of the intervention introduced identifying main idea/summarizing, direct recall of facts, and inferencing in a read aloud format. The intervention was developed specifically for ELs. Specific attention was paid to needs of ELs by (a) providing extensive modeling, (b) using simple vocabulary for PA tasks, (c) providing multiple opportunities for oral language use, and (d) providing support in Spanish as needed.
Interventions were delivered by a credentialed classroom teacher or trained graduate students. For Cohorts 1 and 3, three (one for Cohort 1 and two for Cohort 3) graduate students were trained on both the content and methods of the intervention and were required to meet criterion on all elements of the intervention before they could deliver intervention in the classroom. They were provided 2 days of initial training and observed others delivering the intervention. They were observed regularly by lead researchers and provided feedback for improvement. Graduate research assistants were bilingual and/or had experience teaching ELs. For Cohort 2, a teacher was provided 2 days of training in the content and methods of the intervention prior to the intervention. In addition, the teacher was provided coaching throughout the intervention. The teacher had several years of experience working with ELs and was also certified to teach ELs.
Across the studies, treatment fidelity was collected on 30% of intervention sessions equally across interventionists. Graduate students who collected fidelity data were first trained in the intervention and then were trained specifically on how to observe the intervention to gather fidelity data. The fidelity checklist was developed specifically for the CIM and was based on critical elements for teaching word reading skills (Swanson & Hoskyn, 1998). The following seven elements were included on the checklist for both PA and listening comprehension: (a) Objective is clearly stated, (b) each activity is described clearly and correctly, (c) each activity is modeled, (d) steps are broken down as needed for the students, (e) corrective feedback is provided, (f) oral praise is given for correct responses, and (g) students are provided many opportunities to respond. The data indicated that the intervention was implemented as intended with 95% fidelity. Six of the elements were implemented with 100% fidelity. One element, provides corrective feedback, was not implemented in every session at the beginning of intervention. However, after meeting with the interventionists and providing modeling, this element was delivered with fidelity.
Prior to intervention and during each week of intervention, students were assessed on both PSF and NWF individually by a graduate student researcher. The graduate students were provided a 1-day training on how to administer and score both measures. The training included modeling, guided practice, and individual practice with feedback for the administration and scoring of each measure. Specific fidelity data on the assessments were not collected. However, each assessor was provided the specific script for administering the measures.
Defining Risk
Initial DIBELS scores on PSF and NWF were used to determine initial risk status. Students who did not meet the mid-year benchmark for “low risk” on PSF (correct sounds per minute = 18) and/or NWF (correct sounds per minute = 13) were considered at risk at initial time of testing. Using the “low-risk” benchmark means that our “at-risk” students included students who would be considered “at risk” and “some risk” according to DIBELS. In total, 74 students (63%) were at risk on PSF and 55 students (47%) were at risk on NWF. Of these students, 51 students (43%) were at risk on both measures.
Defining Sufficient and Insufficient Response
This study examined response using three different methods: benchmark criteria, slope discrepancy, and DD using both benchmark criteria and slope. To examine response for this kindergarten EL population, we first determined benchmark criteria and slope with data using our local normative sample after intervention. A comparison between the DIBELS benchmark criteria and a local normative sample benchmark was of interest because the field knows little about expected level of performance for kindergarten ELs on these specific measures. To calculate the local norms for benchmark and slope, we used the full sample (N = 114), including those at risk and not at risk.
For benchmark norms, we compared our local sample means to both DIBELS benchmarks and DIBELS means (Good, Wallin, Simmons, Kame’enui, & Kaminski, 2002). The local sample means for both pretest and posttest were similar to the DIBELS middle of year and end of year benchmarks for “low risk” as well as the DIBELS means at these time points (see Table 2). For example, DIBELS middle of year benchmark for “low risk” on PSF is 18 with a mean of 27.5 (SD = 20.6), and the local sample mean was 16.7 (SD = 13.1) at pretest. The DIBELS end of year benchmark for “low risk” on PSF is 35 with a mean of 40.6 (SD = 19.3), and the local posttest mean was 40.7 (SD = 17.9) on PSF. For NWF, the local sample also scored similar to the DIBELS benchmark of 13 for middle of the year, with a mean of 14.0 (SD = 10.1), and only slightly lower than the DIBELS mean of 20.1 (SD = 17.8). A similar pattern existed for the end of the year with the local sample mean of 29.8 (SD = 16.1), which was similar to the DIBELS NWF benchmark of 25 and mean of 32.5 (SD = 22.45).
Means and Standard Deviations on PSF and NWF Pretest and Posttest.
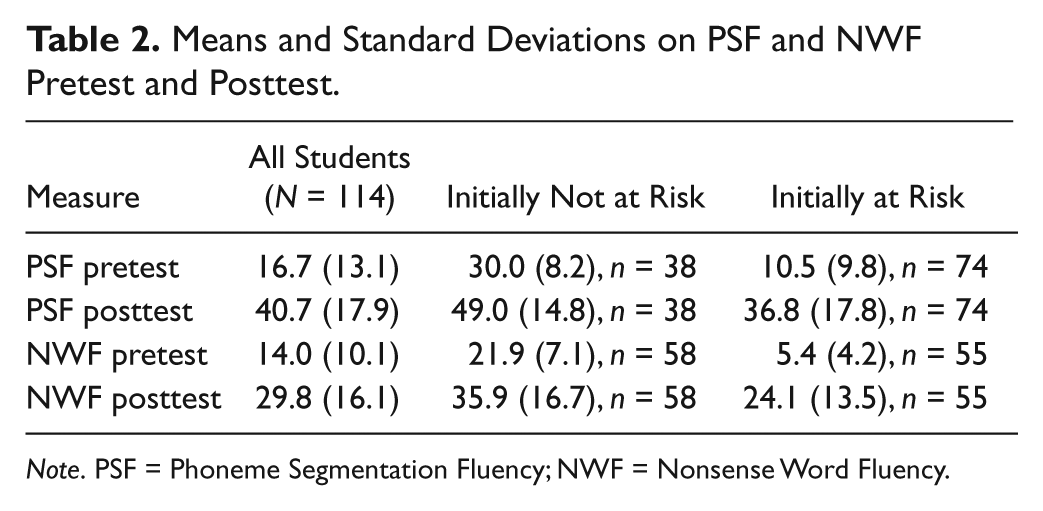
Note. PSF = Phoneme Segmentation Fluency; NWF = Nonsense Word Fluency.
Because our local sample scored similarly to the DIBELS means, particularly at the end of the year, we used the DIBELS benchmarks as they are more widely used in both research and practice. Therefore, response using the benchmark criteria was defined as students who scored 35 or higher on PSF and 25 or higher on NWF at the end of intervention. Conversely, nonresponse was defined as students who scored below 35 on PSF and below 25 on NWF.
For the second method, slope discrepancy, we calculated means and standard deviations for slope using change scores across the weeks of intervention. We used the data from our total local normative sample as we know little about the expected growth over time for this population of students. We could not impose previously used slope criteria based on growth trajectories for monolingual English-speaking students. Although all students in our sample received intervention, not all were at risk, and therefore we felt confident that we had a range of scores that would provide us with an accurate measure of slope for this population. From the local sample analyses, we defined response as those who scored within one standard deviation of the slope mean, and, therefore, nonresponse was defined as more than one standard deviation below the slope mean (see L. Fuchs & Fuchs, 1998). The average slope of students from the local sample was 3.45 on PSF with a standard deviation of 2.16. On NWF, the average slope was 2.23 with a standard deviation of 2.21. This slope and standard deviation were different from the reported slopes of the DIBELS sample (PSF = 1.12, SD = 1.06; NWF = 2.08, SD = 1.62), and therefore we used the local norms on slope to determine response and nonresponse. Students were considered to not respond on PSF if they had a slope below 1.29 and were considered to not respond on NWF if they had a slope below 0.02.
For the third method, DD, a combination of benchmark criteria and slope discrepancy was used. Nonresponse was not meeting the DIBELS benchmark and more than one standard deviation below the sample mean on slope.
Analyses
Three separate cohorts of students across two studies were combined to conduct a series of analyses, and therefore, it was essential to run a preanalysis check of the data. A series of ANOVAs tested for statistically significant differences between the cohorts on both descriptive measures and outcome measures at pretest and posttest. We found no statistically significant differences between the students at either pretest or posttest; p values were above .05 for all measures, and thus, we combined the cohorts into one data set.
Preanalysis data checks also included examination of patterns of missing data, outliers, and departures from normality. Only students who had full data sets were included in the following analyses (N = 114). Moderate outliers were found in the data; however, they were retained, as they represented students performing above expected levels and were used only to determine local sample averages and standard deviations for our discrepancy criterion.
The three criteria for determining response were evaluated through frequency analyses and tables. First, students who were initially at risk were examined to determine whether they responded to intervention based on each of the three methods: benchmark criteria, slope discrepancy, or DD. Next, the percentage of overlap among students identified by the three methods and across the two measures, PSF and NWF, was examined.
Results
Percentage of Students Who Responded Sufficiently or Insufficiently
To examine the first research question regarding the percentage of students who responded or not using each of the three methods, only data of students who did not meet the DIBELS benchmark of “low risk” on PSF (n = 74) and/or NWF (n = 55) were analyzed. These analyses were conducted after the students had received intervention.
Response and nonresponse defined by benchmark criteria
Of the 74 students who were initially at risk on PSF, 52 (70.3%) students met the criterion for response using the DIBELS end of year benchmark and 22 (29.7%) did not. Of the 55 students initially considered at risk on NWF, 39 (70.9%) met the criterion for response on the measure using the DIBELS end of year benchmark and 16 (29.1%) did not.
Response and nonresponse defined by slope discrepancy
Using the slope discrepancy criteria, 57 (77%) of the 74 students initially at risk on PSF met the criterion for response and only 17 (23%) did not. On the NWF measure, 41 of the 55 students (74.5%) initially at risk met the criterion for response and only 14 (25.5%) did not.
Response and nonresponse defined by DD
DD was determined by combining the benchmark and slope criteria. Students who did not meet the criterion for response based on the DIBELS benchmarks for the end of the year and also did not meet the criterion for response based on slope, with a slope one standard deviation below the mean of the local sample, were considered to be DD. Using the DD method, 66 (89.2%) of 74 students initially at risk on PSF met the criterion for response and 8 (10.8%) did not. For NWF, 52 (94.5%) of the 55 students initially at risk met the criterion for response and 3 (5.5%) did not.
Overlap Across Methods and Measures
To determine the amount of overlap across the three methods for determining response and nonresponse, the percentage of students who met the criterion for response or not based on each of the three methods, benchmark, slope discrepancy, and DD, was examined. In addition, the percentage of overlap between the two measures was examined.
PSF
For PSF, there were a total of 22 students who did not meet the criterion for response at the end of intervention based on the DIBELS benchmark. In all, 17 students did not meet the criterion for response based on slope discrepancy method, and 8 students did not meet criterion using the DD method. Because of our definition of DD, all students who did not meet criterion using this method also did not meet criterion for both benchmark and slope methods. Therefore, the percentage of overlap of DD with benchmark and slope was 100%. However, for the other two methods, benchmark and slope, there was a small amount of overlap. For PSF, only 8 students were the same across the two methods and 23 students were different. The percentage of overlap between these two methods is 25.8%; that is, only 25.8% of the students who did not meet the criterion based on the two methods are the same. This also means that 74.2% of the students who did not meet the criterion across the two methods are different students.
NWF
For NWF, a total of 16 students did not meet the criterion for response at the end of intervention based on the DIBELS benchmark. In all, 14 students did not meet the criterion for response based on slope discrepancy method, and 3 students did not meet the criterion using the DD criteria. Again, because of our definition of DD, all students who did not meet criterion using this method also did not meet criterion using both the benchmark and slope criteria. However, when considering the other two methods, benchmark and slope, there was again a small amount of overlap. For NWF, only 3 students were the same across the two methods and 24 students were different. The percentage of overlap between these two methods is 11%; that is, only 11% of the students did not meet the criterion for response using both methods.
Risk based on both measures
For the students initially at risk, 51 students were considered initially at risk on both PSF and NWF using the DIBELS benchmarks for the middle of the year. The percentage of overlap was relatively high, 68.0% for PSF and 94.4% for NWF; that is, 68% of the students who were at risk on PSF were also at risk on NWF, and 94.4% of the students at risk on NWF were also at risk on PSF. However, at the end of intervention, there was much less overlap in the students who did not meet the criterion for response on both measures. This was true for each of the three methods. There were only 4 students who did not meet the criterion for response on both measures using the benchmark criteria. Therefore, only 18% of the students who did not meet the criterion on PSF also did not on NWF, and only 25% of the students who did not meet the criterion on NWF also did not on PSF. Of these 4 students, 3 were initially at risk on both measures and 1 was initially at risk only on NWF. Using the slope discrepancy method, only 2 students did not meet the criterion on both measures. This is only an 11.8% overlap for PSF and a 14.3% overlap on NWF. Both of these students were initially at risk on both measures. There were no students who did not meet the criterion for response on both measures using the DD method.
Discussion
The goals of this study were twofold. First, the percentage of ELs meeting and not meeting the criterion using three common methods for determining response and nonresponse in RTI models was examined. Second, the study sought to investigate whether the three methods and key measures identified a similar group of students. To investigate these two research questions, it was necessary to define response and nonresponse. In defining these terms for this population of students, there are several notable points to consider before discussing the results related specifically to the research questions.
Examination of the local normative sample indicated that, for at least this group of kindergarten ELs, the DIBELS benchmarks were considered appropriate markers of progress. In this sample, the means for both the middle of the year and end of the year were similar to DIBELS national sample means. Although the local sample means for middle of the year were slightly lower than DIBELS means, they were within the standard deviation, and the means for the end of the year were very similar to the DIBELS means. In addition, the local sample means were almost identical to the DIBELS benchmarks for “low risk” at each time period. Furthermore, the average growth on both PSF and NWF for this EL population was over two sounds per minute per week, which is the approximate amount of growth necessary to move from “at risk” on the DIBELS measures to “low risk.” These findings are similar to what other research has found on the DIBELS ORF measure with ELs in first grade (Linan-Thompson et al., 2007). The present study indicates that ELs make similar or more growth on these early reading measures when compared with the DIBELS samples, which contain mainly monolingual students. However, the size of the standard deviations for slope on both measures indicates that there is much variation in the growth of these students, particularly on NWF.
Although definitions from the existing literature were used to establish the three methods of determining response used in the present study (Barth et al., 2008; Linan-Thompson et al., 2007; Speece, Case, et al., 2003), the slope discrepancy cutoff for the local sample on NWF was particularly low at 0.02. This was surprising because the slope discrepancy cutoff for the local sample for PSF was 1.29, which was a reasonable amount of growth per week to indicate response. There are several plausible explanations for these results. First, the finding seems to further indicate that there is larger variation in growth on these measures for kindergarten students who are just beginning to develop these early reading skills. Second, the finding might suggest that, for this population of students, using a slope discrepancy of one standard deviation below the mean may not be the best indication of “response” as it yielded a low threshold for response. Perhaps using a more stringent criterion for response such as a half standard deviation below the mean, which was used in McMaster et al. (2005), may provide a more accurate indication of response. Third, it could be that slope is not an accurate metric for determining response for kindergarten ELs. Other research has found that slope does not indicate response better than final level of performance (Schatschneider et al., 2008).
The variation in slope for the local sample on NWF could also be due to the inherent characteristics of the NWF measure (L. Fuchs et al., 2004). In our sample, there were students who were able to reach fluency in letter sounds but were not able to decode the words. However, there was also a group of students who began to read words or at least tried to read words on the measure toward the end of intervention. Some of these students never actually reached benchmark on NWF, but over time they could decode words and would try to read the words. Although their scores never improved, in reality, their performance was improving when measured by blended words versus sounds read. For the vast majority of students who meet benchmark on NWF, there is a fairly sizable drop in the scores as the students slow down to read words. That is, children become very efficient in identifying letter sounds; however, reading whole words is a more advanced task and requires more processing time, reducing the total number of sounds identified in 1 min.
In addition, students make more mistakes when reading whole words as they are just beginning to read, which lowers their scores (e.g., buv read as biv). This phenomenon results in many students not demonstrating linear growth on the NWF measure. This finding coincides with longitudinal research that indicates that the NWF benchmark for kindergarten might underidentify students who need more intensive interventions (Johnson, Jenkins, Petscher, & Catts, 2009). This underidentification in kindergarten may stem from the fact that students can become very fast and accurate at identifying the sounds of letters and not be able to read the nonsense words, and/or the fact that many of the students demonstrate nonlinear growth (L. Fuchs et al., 2004). In contrast, research conducted by Vanderwood and colleagues (2008) suggests that NWF is a valid measure for first-grade ELs, indicating that as students get older and these early reading skills stabilize, NWF is a better indicator of response. It is notable though that these researchers also found that for the lowest performing first-grade ELs, there was a higher rate of underidentification.
The results regarding the percentage of students who met or did not meet the criterion for response indicated that, overall on each of the methods for determining response, there were more students who met criterion than not after intervention. This finding is similar to other studies of intervention that indicate that the majority of ELs respond to intervention (e.g., Linan-Thompson et al., 2007). In addition, the results show that more students met the criterion for response when using the DD method than when using either slope or benchmark alone. This makes sense given that the criteria for DD are more stringent than that of either benchmark or slope. However, this study was just an initial examination of response in a kindergarten EL population, and we did not have outcome data available to determine which of these methods was most accurate at predicting response.
The results related to the overlap between the methods and measures indicate that there is very little overlap among three methods for determining response. Specifically, results indicate that the benchmark and slope criteria yielded slightly different percentages of students. However, the methods identified different students. This finding is similar to recent literature that indicates little overlap among these methods for defining response of English-speaking students (Barth et al., 2008); thus, the present study extends this literature to include ELs. Using the benchmark method, approximately 30% of the students initially at risk did not meet the criterion for response on each of the two DIBELS measures (PSF, n = 22; NWF, n = 16). Using slope discrepancy, 25% of students did not meet criterion on each of the measures. Because of our definition of DD, all the students who did not meet the criterion using this method also did not meet for both benchmark and slope. For PSF, eight students did not meet criterion using DD, which is 5.9% of the total population of students. The DD criteria yielded very few students not meeting the criterion using NWF, only three, which is about 2% of the total population of students in the sample. However, no students were DD on both NWF and PSF.
Before intervention, 51 of the 114 students were at risk on both PSF and NWF. However, at the end of intervention, very few students did not meet criterion on both measures using the benchmark or slope method and there was no overlap in the students who were DD on both measures. Using the benchmark method, PSF and NWF identified only 4 students not meeting criterion on both measures. Not surprisingly, 3 of these 4 students were also initially at risk on both measures. In addition, using slope discrepancy, PSF and NWF again identified very few students on both measures. Only 2 students did not meet criterion on both measures; these 2 students were also initially at risk on both measures.
Although these measures tap different skills, they are highly related skills (Good et al., 2004); PSF measures PA skills and NWF measures application of the alphabetic principle. It would seem logical that there would be more overlap between the students who did not meet criterion on both measures. However, as stated previously, it is likely because in kindergarten, the early reading skills of these young children are not yet fully developed, their within-student performance is highly variable. If these skills are assessed in first grade, there may be more overlap between the students who did not meet criterion on both measures. In addition, in DIBELS Next (Good & Kaminski, 2011), the authors have created composite scores that include scores from the various measures at a particular grade level. This composite score may be a better indicator of response than the individual measures.
Implications for Practice
This study has two major implications for practice. First, because of the lack of overlap between the methods for determining response, districts and schools should proceed cautiously when choosing the methods and measures they use for making decisions about student performance and potential intervention needs. In practice, the issue of inconsistency in which students are identified by the three methods is a real problem. It means that if School A uses the benchmark method and School B uses slope discrepancy or DD, these schools are likely identifying students who are very different and have different needs. The lack of overlap between the two measures, PSF and NWF, is problematic as well. This is particularly true for ELs in kindergarten as there appears to be much variation among students and even high variability within individual students as they develop these early reading skills.
Second, based on the little overlap among the three methods and limited overlap between the two measures using the methods, it appears important to examine individual data more closely. Individual differences in how ELs respond to intervention suggest that schools will need to use a RTI model more closely rooted in the problem-solving approach when it comes to determining response for kindergarten ELs. The problem-solving approach does not require that response be determined strictly through benchmarks and/or discrepancy but instead requires examination of individual student data across multiple measures. Using the problem-solving approach, response is determined on a case-by-case basis and instructional techniques are tailored to individual students (D. Fuchs, Mock, Morgan, & Young, 2003).
Limitations and Future Research
In this study, using extant data, we address questions related to response in RTI models for ELs. This descriptive study examining response patterns adds empirical data to the literature on important educational questions with a dearth of research but does have limitations that must be considered. First, the study used extant data and is therefore limited to the available data. The original studies were intervention studies that used DIBELS PSF and NWF to identify students “at risk,” monitor student progress, and determine student performance at the end of intervention. Later outcome data (e.g., first-grade performance) were not available to examine the predictive nature of the three methods for determining the response of kindergarten ELs. Data on standardized measures in kindergarten were available. However, the sample size became too small for the various groups of response and nonresponse that meaningful interpretations of the data were not possible. Furthermore, the overall sample size of this study was relatively small. Therefore, caution must be used when generalizing findings, even to other EL populations, as this study only included Spanish-speaking ELs.
In addition, a slope discrepancy of one standard deviation below the mean of the sample provided a very low threshold for defining response on NWF. Students only needed to make an average growth of 0.02 sounds per week to meet the criterion for response. If the cut-point had been half a standard deviation below the mean, more students would have met the criterion on this measure and perhaps there would have been greater overlap between the different methods and the measures. However, the slope discrepancy for PSF was 1.29 and the problem of lack of overlap across methods still existed. Further research needs to investigate response using the various methods along with various cut-points (e.g., 1 SD and 0.5 SD) to determine which is most accurate. Currently, even the literature on monolingual students is limited and inconsistent in this area (Barth et al., 2008; McMaster et al., 2005; Schatschneider et al., 2008; Speece, Case, et al., 2003). Finally, due to the lack of extant literature with similar populations, these data cannot be compared with other findings and instead only could be compared with the limited studies available for monolingual students.
Future research needs to be designed to specifically examine response and how it predicts “risk” status in later grades for ELs and should also consider response with larger samples of ELs with various first languages. Furthermore, to accurately make decisions about students who respond sufficiently or not, we need additional progress monitoring measures, particularly for young ELs, that are reliable and valid and assess other skills that we know affect reading outcomes, such as listening comprehension, writing, and vocabulary. Other broader questions regarding RTI and ELs still need to be answered (see Klingner & Edwards, 2006), particularly regarding interventions for ELs and how each of the tiers of the RTI model should be used in schools with large EL populations whose performance may not reflect national norms. Through better understanding of the methods used to determine response, educators can provide ELs with early intervention that is appropriate and effective.
Footnotes
Declaration of Conflicting Interests
The authors declared no potential conflicts of interest with respect to the research, authorship, and/or publication of this article.
Funding
The data used in this study were collected as a part of two research studies that were funded in part by the University of California Linguistic Minority Research Institute and the America Education Research Association.