
Abstract
Promoting self-determination has been identified as an important practice for the successful transition of youth and young adults with disabilities, and numerous studies have examined the relationship between levels of self-determination and transition-related and postsecondary outcomes. Only a few such studies, however, have examined the global self-determination of students with disabilities. The majority of those studies measured self-determination using The Arc’s Self-Determination Scale (SDS) and involved students with intellectual disability (ID) or learning disabilities (LD), examining the impact of interventions, environment, disability category, intelligence level, and gender on self-determination. Although students with intellectual and LD are often studied as a single group, for students with cognitive disabilities, there have been no studies that examine whether assessments are measuring the same construct within these two populations. The purpose of this study is to test for measurement invariance to examine further whether a measure like the SDS is assessing the same concept in students with ID and in students with LD by conducting analysis with a series of multiple-group confirmatory factor analysis (CFA). Results showed that the SDS is measuring the same construct across both groups; however, significant differences in both groups were found in latent variances/covariances and latent means.
Promoting self-determination has been established as an evidence-based practice to enhance positive school and transition outcomes for students with disabilities (Algozzine, Browder, Karvonen, Test, & Wood, 2001; Cobb, Lehmann, Newman-Gonchar, & Alwell, 2009; Shogren, Wehmeyer, Palmer, Rifenbark, & Little, 2013). Studies have been conducted to examine the effect of interventions to promote student self-determination (Powers et al., 2012; Wehmeyer, Palmer, Shogren, Williams-Diehm, & Soukup, 2013; Wehmeyer et al., 2012), to encourage access to the general education curriculum and academic outcomes (Konrad, Fowler, Walker, Test, & Wood, 2007; Lee, Wehmeyer, Palmer, Soukup, & Little, 2008; Shogren, Palmer, Wehmeyer, Williams-Diehm, & Little, 2012), and to support transition-related outcomes (Martin et al., 2006; Shogren et al., 2013; Wehmeyer & Palmer, 2003; Wehmeyer & Schwartz, 1997).
In addition, a growing body of literature has documented the importance of self-determination as a critical component in promoting positive academic, social, and adult outcomes for adolescents with disabilities by examining a relationship between self-determination and postschool outcomes, such as employment, independent living, and quality of life (LaChapelle et al., 2005; Shogren et al., 2012; Shogren et al., 2013). For example, Shogren and colleagues (2012) examined the impact of the Self-Determined Learning Model of Instruction, a model of instruction based on the principles of self-determination, with 312 high school students with intellectual disability (ID) or learning disabilities (LD). They found significantly higher attainment of academic goals and higher ratings for access to the general curriculum as observed using the Access Version of the Code for Instructional Structure and Student Academic Response (Access CISSAR; Bashinski & Wehmeyer, 2002) for those who were in the treatment group compared with the control group. Moreover, Shogren and colleagues (2013) investigated the relationship between self-determination status and adult outcomes of 779 young adults with disabilities who received self-determination intervention. They found that self-determination intervention had positive influences for students in secondary school, employment, and community settings. Specifically, higher self-determination status predicted higher levels of employment outcomes and more community access.
Although issues pertaining to self-determination have been examined across multiple disability categories, most of the research that measures the impact of intervention on self-determination has been conducted with students receiving special education services under the categorical areas of ID or LD (often including students with both disabilities; for example, Shogren et al., 2012). Grouping students together presumes that instruments measuring the construct have established measurement invariance; that is, the assessment measuring the construct is, in fact, measuring the same thing across groups. There have been several studies establishing that students with LD score higher, in general, on measures of self-determination (and on domain scores within such measure) than do students with ID (Wehmeyer, 1996; Wehmeyer & Kelchner, 1995; Wehmeyer & Schwartz, 1997). None of these studies, however, have conducted analyses to examine measurement invariance and to ensure that the self-determination measures are, indeed, measuring the same construct in both groups.
The majority of studies conducted that measured self-determination with students with ID or LD used The Arc’s Self-Determination Scale (SDS; Shogren et al., 2013; Wehmeyer, 1996; Wehmeyer et al., 2013). This scale was developed to operationalize a functional model of self-determination proposed by Wehmeyer and colleagues (Shogren et al., 2008; Wehmeyer, Kelchner, & Richards, 1996). According to this theoretical framework, self-determined behavior refers to “volitional actions that enable one to act as the primary causal agent in one’s life and to maintain or improve one’s quality of life” (Wehmeyer, 2005, p. 117).
The functional model suggests that people are self-determined if their action(s) embody four essential characteristics of self-determination: “(a) the person acts autonomously (AUTO); (b) the behaviors are self-regulated (SREG); (c) the person initiates and responds to event(s) in a psychologically empowered manner (PSYE); and (d) the person acts in a self-realizing manner (SREA)” (Wehmeyer et al., 1996, p. 633). A comprehensive discussion of these essential characteristics is beyond the scope of this article (see Wehmeyer, Abery, Mithaug, & Stancliffe, 2003, for an extensive discussion), but what is relevant is that the SDS was designed with major domain areas to match each essential characteristic.
The SDS (Wehmeyer & Kelchner, 1995) is a measure of global self-determination developed based on the functional theory of self-determination (Wehmeyer et al., 1996). The SDS measures the four essential characteristics of self-determined behavior: autonomous functioning, self-regulation, psychological empowerment, and self-realization as domain scores. Students with both ID and LD were included in the norming sample for the measure (Wehmeyer, 1996). To date there has been no in-depth examination of what the measure represents for each of these populations; however, the hypothesis is that the SDS is measuring the same construct with both populations.
Purpose of the Study
This study investigated the results of the SDS with two disability groups, to determine whether construct of self-determination can be consistently measured across adolescents with varying disability categories. Specifically, the purpose of this study was to test for measurement invariance to further examine whether a measure like the SDS is assessing the same concept in students with ID and with LD (Brown, 2006; Floyd & Widaman, 1995). If measurement invariance has been established, so that latent constructs within self-determination measurement are comparable, researchers are able to compare latent means across groups of students with ID and students with LD. There were two research questions:
Method
Participants and Procedures
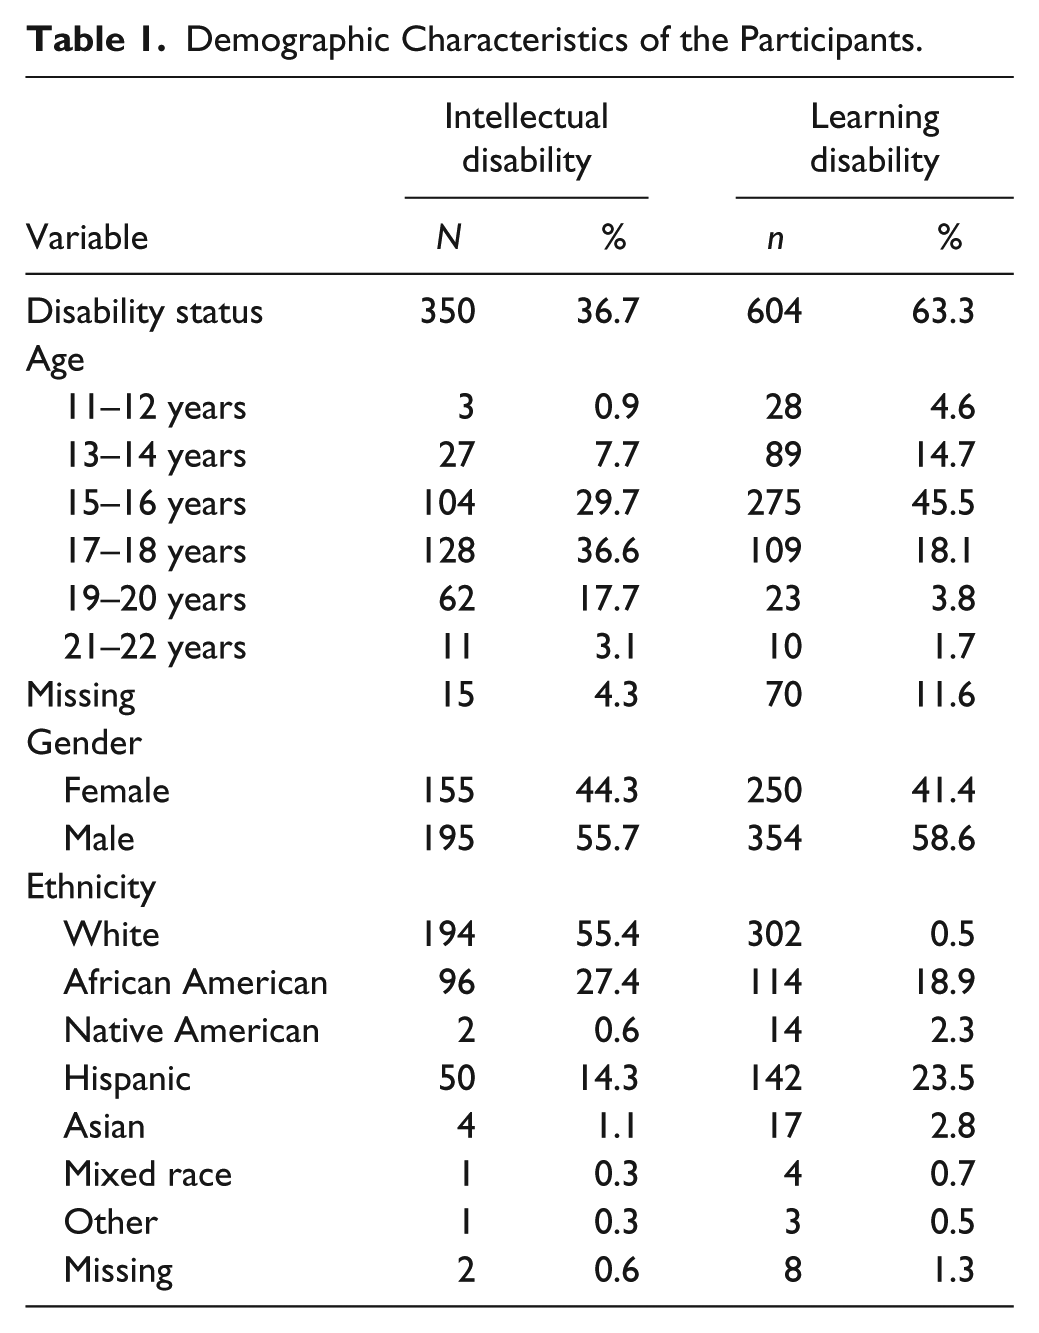
Participants were 954 high school students from 50 schools recruited in six states (Arkansas, Kansas, Missouri, Nebraska, Oklahoma, and Texas). In this study, participants ranged in age from 11.3 to 22 years and were identified as having an ID (n = 350; 36.7%) or a learning disability (n = 604; 63.3%). The sample was 42.3% female (n = 404) and 57.7% male (n = 550). Most participants were Caucasian (n = 515; 54%) and other races/ethnicities are shown in Table 1: African American (n = 204; 21.4%), Hispanic (n = 192; 20.2%), Asian or Pacific Islander (n = 13; 1.4%), Native American/Alaskan Native (n = 10; 1%), Other (n = 10; 1%), and missing data (n = 10; 1%).
Demographic Characteristics of the Participants.
The data used in this analysis were collected as part of several intervention studies examining the self-determination of students with disabilities. Participants for each project were recruited in the same manner to provide a consistent overall sample. For example, adolescents with ID or LD who were judged to be capable of answering yes/no questions and who could give their opinions orally were selected. In most cases, administration of the SDS was done by reading each item and having students rather mark a response or dictate responses to a scribe. More specifically, researchers provided adaptations to participants, when necessary, by reading each item aloud and transcribing the student’s response. This is often preferable to do in group situations, however, in some cases assessments were administered in one-to-one interviews for those who needed additional accommodations. In this study, students varied in the level of support they needed with necessary adaptations to complete the assessment. For more detailed information, the procedural guideline is provided on the Beach Center website (http://www.beachcenter.org/resource_library/beach_resource_detail_page.aspx?intResourceID=1445&Type=Manual).
In all cases, human subjects approval was obtained from the University Institutional Review Board. Once this was done, project personnel contacted school districts, and for districts that were willing to participate, obtained district-level consent for research. Then, a contact person in each district, typically a special education coordinator, determined which middle and high school campuses would participate. Subsequently, teachers at each campus identified students who met the project criteria, which included middle and high school students who (a) received or were receiving special education services under the category of ID or LD, (b) could reliably fill in self-report measures, and (c) would be receiving special education services for an additional 2 years after the project implementation.
After receiving assent from students who were willing to be involved in this study and consent from their parent or guardian and teachers, project personnel collected data that consisted of demographic information and level of self-determination as determined by the SDS.
Measures
The SDS
The SDS (Wehmeyer & Kelchner, 1995) is currently a widely used self-report measure of self-determination. The scale consists of a total of 72 items, across four domains, with a total possible score of 148 points. Domain scores can be calculated by users as well, with higher scores indicating higher levels of self-determination. The SDS was normed with 500 students with cognitive disabilities and reported adequate reliability (Cronbach’s α = .90) and adequate construct validity based on multiple means, including a factor structure analysis (Wehmeyer, 1996). From the norming sample, the overall mean score was 97.52 (SD = 19.43). The mean score for each subdomain is as follows: autonomous functioning, 63.35 (SD = 15.50); self-regulation, 9.78 (SD = 4.95); psychological empowerment, 13.28 (SD = 2.64); and self-realization, 11.11 (SD = 2.25; Wehmeyer, Palmer, Lee, Williams-Diehm, & Shogren, 2011).
Data Analysis
Multiple-group confirmatory factor analysis (CFA) was used to investigate differences in levels of self-determination for students with ID or students with LD. Specifically, CFA enables researchers to examine all potential aspects of measurement invariance and population heterogeneity across groups. Before concluding that a measure like the SDS is assessing the same concept in students with differing disabilities, equivalence of all measurement and structural parameters should be investigated across groups (Brown, 2006; Floyd & Widaman, 1995). Hence, the measurement model reflects the evaluation of across-group equivalence of observed measures, such as factor loadings, intercepts, and residual variances. In addition, the structural parameters evaluate the latent variables, such as factor variances, covariances, and latent means. To determine whether the disability category affected the students’ levels of self-determination, two groups (i.e., ID, LD) were compared in a series of models to determine whether the disability category affects the students’ levels of self-determination.
Mplus version 7.0 (Muthén & Muthén, 2012) was used to examine all models. The following section includes (a) parcels, (b) missing data analysis, (c) effects coding, (d) measurement invariance testing, and (e) structural invariance testing.
Parcels
A definition of a parcel is “an aggregate-level indicator comprised of the sum (or average) of two or more items, responses, or behaviors” (Little, Cunningham, Shahar, & Widaman, 2002, p. 152). Models based on parceled data are more efficient compared with item-level data by reducing likelihood of distributional violations, parameter estimates, likelihood of correlated residuals, and dual factor loadings (Little, 2013; Little et al., 2002). Thus, parcels were created for each latent variable in this study and it provides a clearer result for analysis with increased reliability, communality, and ratio of common to unique factor variance. Four latent constructs were provided in the measurement model by the SDS that indicate four essential characteristics of self-determined behaviors, as shown in Figure 1: autonomous functioning (AUTO), self-regulation (SREG), psychological empowerment (PSYE), and self-realization (SREA). First, domain-representative parcels were created for the three latent constructs of AUTO, PSYE, and SREA. For each latent construct, three parcels were created to maintain a just-identified model using a balancing approach that “assigns the item with the highest item-scale correlation to be paired with the item that has the lowest-item scale correlation” (Little, 2013, p. 24). Second, two facet-representative parcels were created using the SREG construct, which includes two distinct subdomains on the SDS (Interpersonal Cognitive Problem-Solving and Goal Setting and Task Performance). After parcels were created, each parcel was used as a manifest indicator of the latent construct to provide more satisfactory factor analysis and results. This was achieved by taking advantage of parcels as mentioned above.
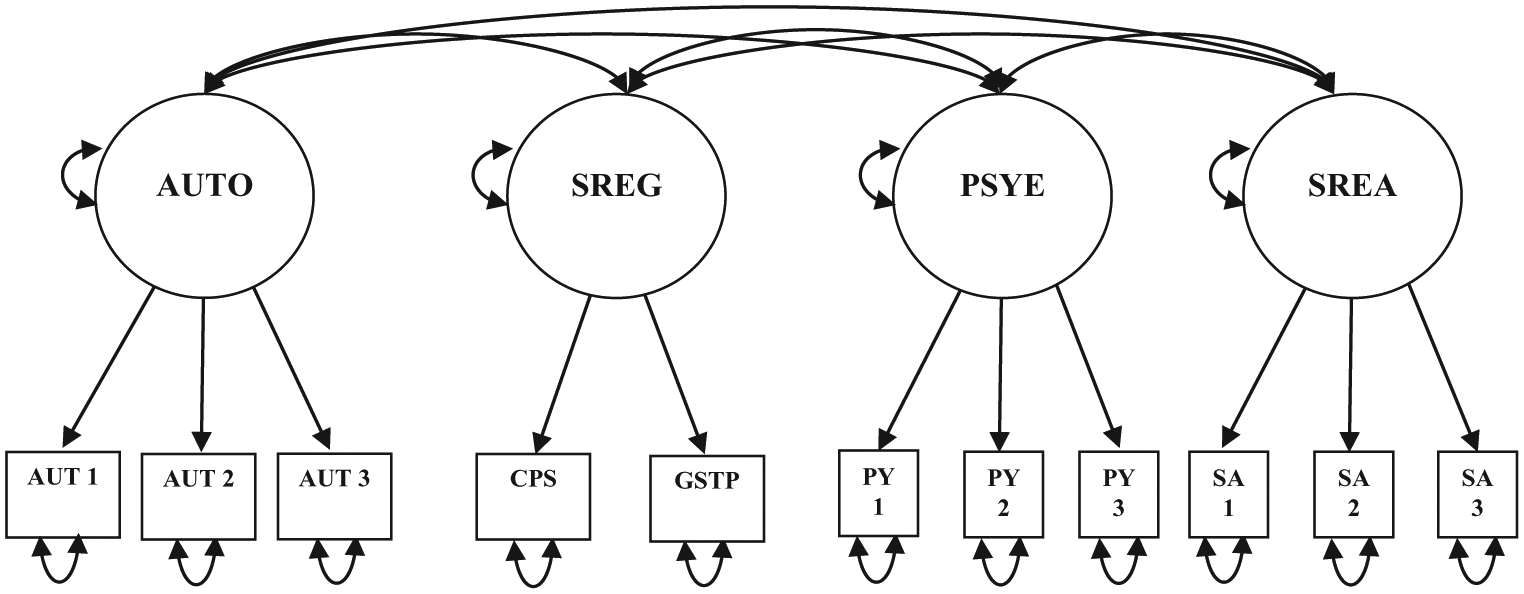
The measurement model for each group.
Missing data analysis
After parcels were created, there was a small amount of missing data on a number of variables for each group. The overall average percentages of missing data values were approximately 0.011% (ranging from 0%–0.017%) for both groups. Full-information maximum likelihood (FIML) estimation, which is a “state-of-the-art” approach that uses all information to inform the parameters’ values and standard errors, was used for the study with missing data and utilized by Mplus version 7.0 (Muthén & Muthén, 2012) to prevent the potential deleterious effects of not including all data (Little, 2013).
Effects coding
Prior to evaluating model invariance, the effects-coding method of scaling was used to provide an unbiased and optimal balance of the information (Little, 2013; Little, Slegers, & Card, 2006). To set the scale, we constrained the sum of the indicator’s loadings to the total number of indicators. We conducted this procedure with factor loadings and intercepts to estimate the construct’s latent variance and latent means by making comparable and non-arbitrary metrices in both groups (Little, 2013).
Measurement invariance testing (Research Question 1)
To establish construct comparability that enables researchers to compare latent means across the two groups, a series of measurement invariance testings were conducted as a first step in multiple-group CFA to test configural, weak, and strong invariance models. The following steps are recommended for multiple-group CFA invariance evaluation to establish measurement invariance (Brown, 2006): (a) null model, (b) test a model fit based on manifest variables (configural invariance), (c) test the equality of factor loadings (weak invariance), and (d) test the equality of indicator intercepts (strong factorial invariance). First, configural invariance testing was conducted to examine the same pattern of fixed and freed parameters across both groups. Second, the weak invariance testing was used by constraining the corresponding factor loadings for each construct across the groups at the same time. Third, strong invariance was examined to investigate the relative indicator means by constraining the corresponding intercepts for each construct across both groups simultaneously.
Measurement invariance constraints are considered tenable when the nested model of the root mean square error of approximation (RMSEA) value falls into the RMSEA confidence interval for the less constrained model or the changes in Comparative Fit Index (CFI) are less than .01 (Cheung & Rensvold, 2002; Little, 1997). For the invariance testing, the change in CFI guideline is considered as robust to model complexity and sample size (Cheung & Rensvold, 2002; Little, 2013).
Latent parameter invariance testing (Research Question 2)
When the strong factorial invariance was established, structural invariance models were conducted: (a) omnibus test of variances/covariances and (b) omnibus test of equal latent means across the groups. First, the homogeneity of factor variances and covariances was examined with the nested χ2 difference tests among latent variances and covariances based on the strong invariance model. If the homogeneity of variance–covariance matrices is accepted across students with ID and students with LD, it means that the same CFA model would fit equally across the groups (Little, 2013). If the homogeneity of variance–covariance matrices is not accepted in both groups, the researchers need to create phantom constructs to provide a comparable correlational matrix. Second, an omnibus test of homogeneity of latent means was conducted to examine true mean differences. If the latent means are not the same in both groups, follow-up comparisons need to be conducted to examine the mean-level differences across groups.
Results
The purpose of the current study was to test for measurement invariance to examine whether the SDS is assessing the same constructs of self-determination for students with ID and for students with LD. Each group provided a good fit for the CFA model. The group with LD presented χ2(38) = 51.047, CFI = .989, Tucker–Lewis Index [TLI] = .984, RMSEA = .031(.000 – .052), and standardized root mean residual (SRMR) = .037 and the group with ID showed χ2(38) = 56.608, CFI = .993, TLI = .990, RMSEA = .028 (.010 – .043), and SRMR = .031. The result section includes (a) model invariance testing (Research Question 1) and (b) latent parameter invariance testing (Research Question 2).
Model Invariance Testing (Research Question 1)
A series of multiple-group CFA were performed in a sequential procedure using models of measurement parameter comparison including configural invariance, weak invariance, and strong invariance with different restrictive constraints to examine the factorially invariant constructs across each group. This was done, ultimately, to compare latent parameters in the model. All goodness-of-fit and model comparison chi-square values were significant. First, the configural invariance model, a freely estimated measurement model derived by examining the identical factor structure, represents acceptable model fit, χ2(76) = 107.656, CFI = .992, TLI = .932, RMSEA = .030 (.015 – .042), and SRMR = .033. Second, the weak factorial invariance model was established to indicate the identical factor loadings across each group by constraining the factor loadings. Last, the strong factorial invariance model was accepted by equating the item intercepts across both groups. After these standard procedures were conducted to determine measurement, as shown in Table 2, we found no significant changes in fit. That is, both weak and strong invariance models were regarded as tenable by meeting one of these criteria: Does the RMSEA value of the less constrained model fall within the 90% RMSEA confidence interval for the comparison model (Little, 1997) and does the CFI changes less than 0.01 (Cheung & Rensvold, 2002). The results of establishing the strong factorial invariance and non-significant changes in the model fit support the same constructs that are being assessed between students with ID and students with LD. Table 3 provides parameter estimates for the strong factorial invariance model.
Invariance Testing Across Group.
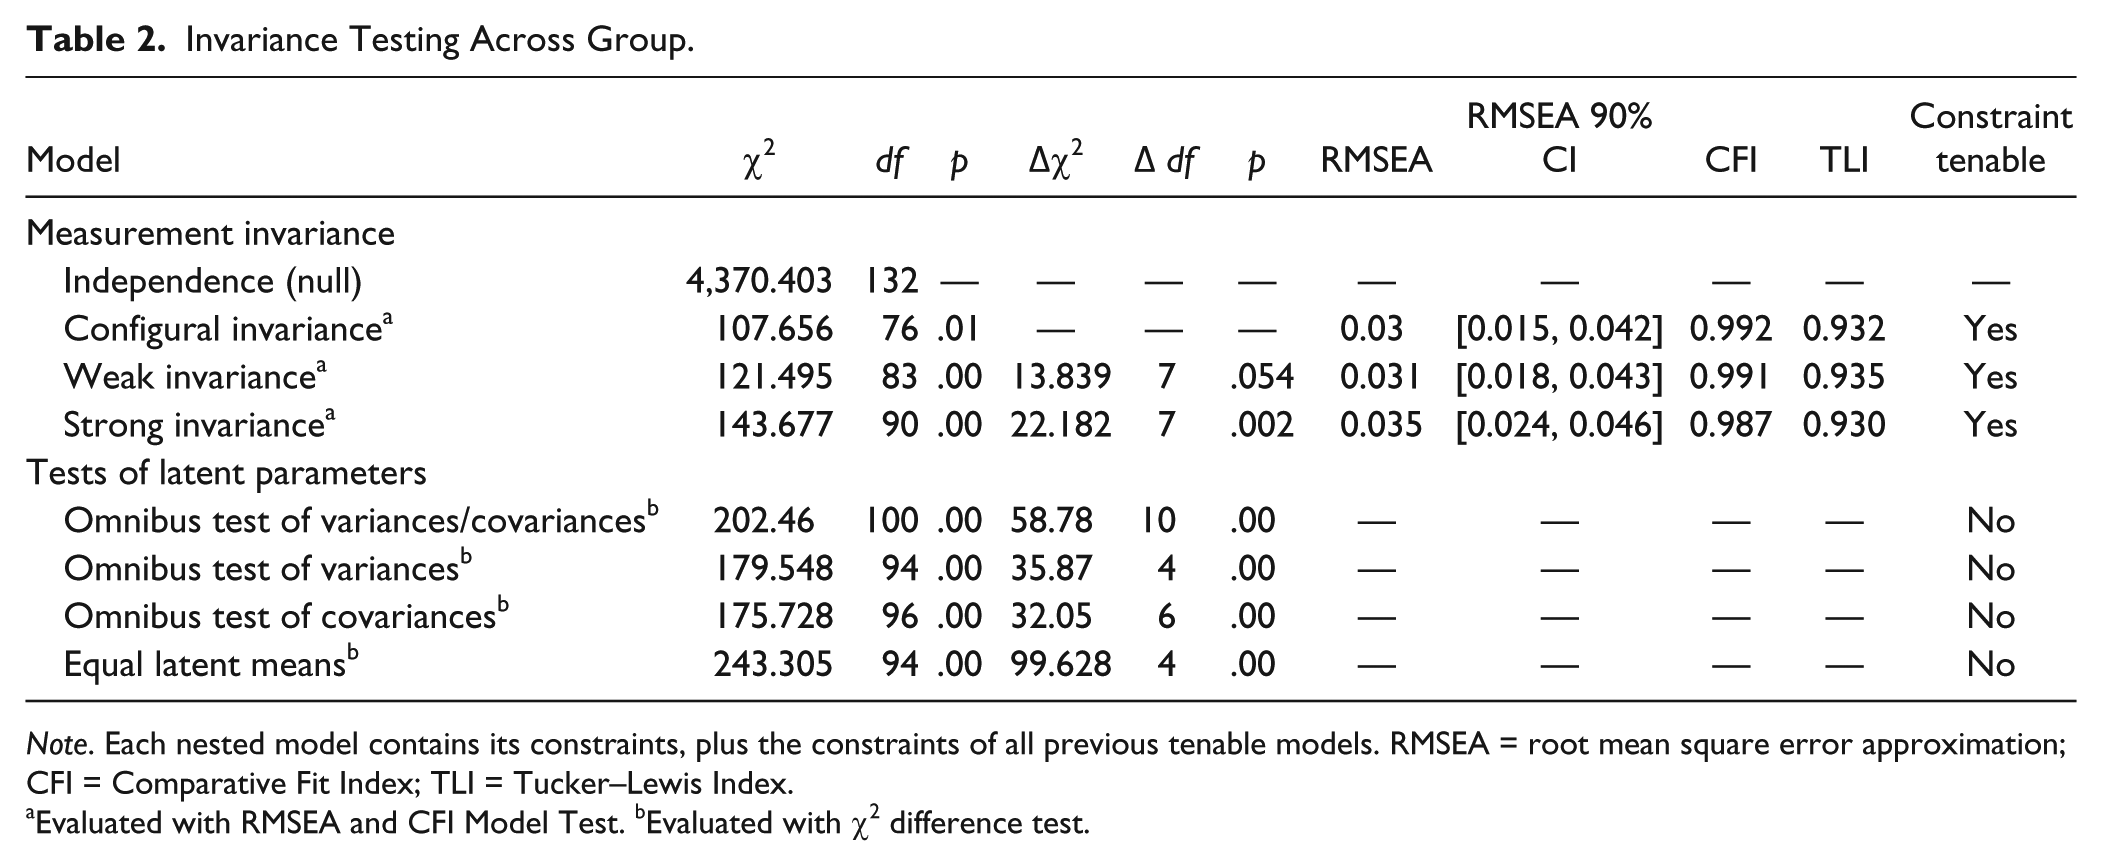
Note. Each nested model contains its constraints, plus the constraints of all previous tenable models. RMSEA = root mean square error approximation; CFI = Comparative Fit Index; TLI = Tucker–Lewis Index.
Evaluated with RMSEA and CFI Model Test. bEvaluated with χ2 difference test.
Parameter Estimates for the Strong Invariance Model.
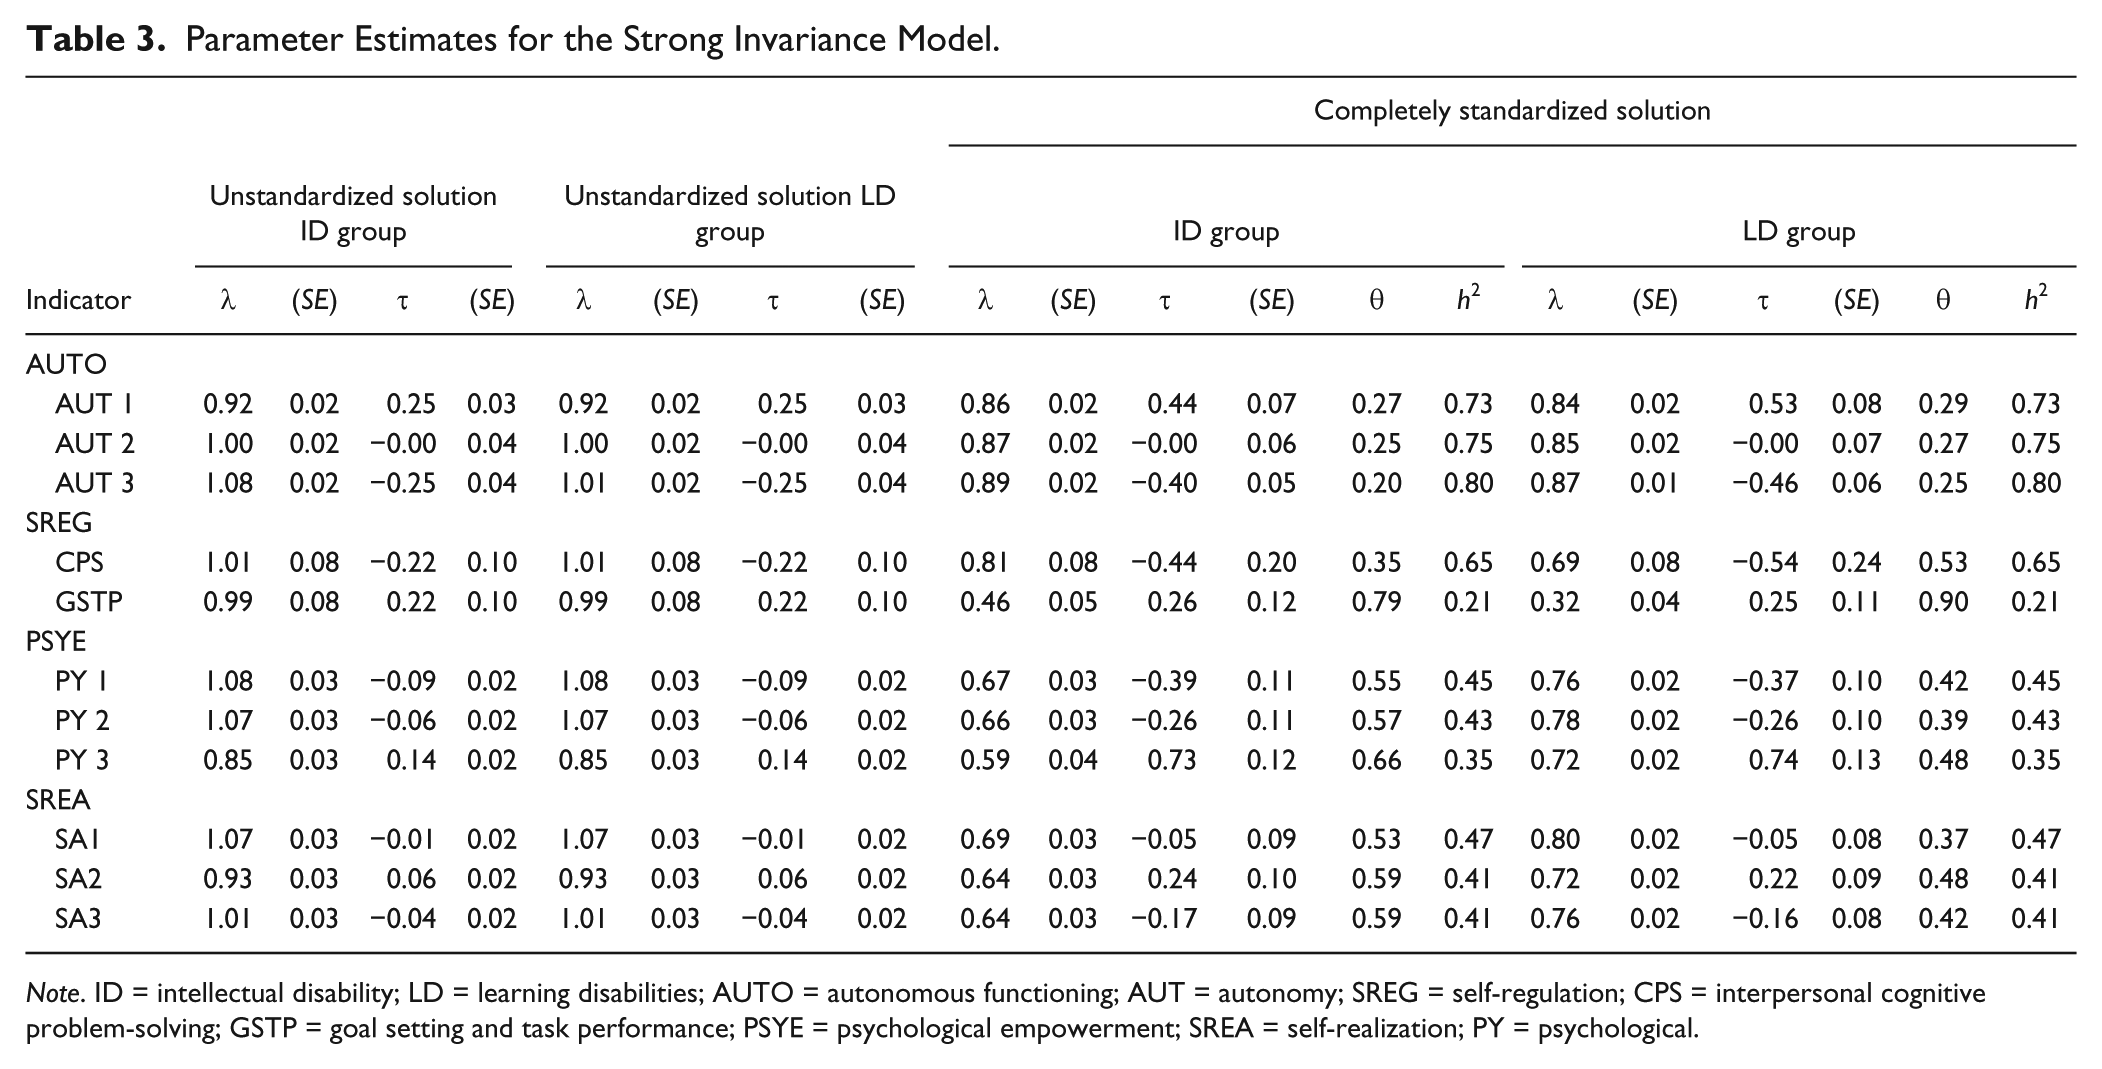
Note. ID = intellectual disability; LD = learning disabilities; AUTO = autonomous functioning; AUT = autonomy; SREG = self-regulation; CPS = interpersonal cognitive problem-solving; GSTP = goal setting and task performance; PSYE = psychological empowerment; SREA = self-realization; PY = psychological.
Latent Parameter Invariance Testing (Research Question 2)
As the configural, weak, and strong invariance models were established, researchers were able to provide comparisons of latent parameters. First, tests of the homogeneity of the variances and covariances of the latent constructs were conducted using the χ2 difference test. As shown in Table 2, the results showed significant differences in the variances and covariances of the latent constructs across students with ID and students with LD. This indicates that variances and patterns of covariances are variant across the two groups. As the differences in variance were found across both groups, phantom constructs were created to estimate the associations between the constructs as correlations in each group (Little, 2013). To provide comparable correlational metrics, we created phantom constructs for the strong invariant model by including all information about the constructs. In Table 4, phantom constructs converted the variance information into a standard deviation estimate and then estimated the association among the constructs in correlational metric. Second, we evaluated the latent means across both groups. Table 2 shows that the latent means were not invariant across the groups, Δχ2(94) = 243.305, p < .01. As shown in Table 5, we conducted follow-up mean difference tests across both groups and the latent means were presented in Table 6. After conducting nested χ2 difference tests among latent means, we found that there were significant differences in the latent constructs of autonomous functioning (AUTO), self-regulation (SREG), and psychological empowerment (PSYE) domains across the groups. Table 5 provides effect sizes to give the magnitude of the latent mean differences across two groups in those three domains. There was a large effect size for the significant difference in self-regulation (d = 0.92) and small effect sizes in autonomy (d = 0.36) and psychological empowerment (d = 0.32).
Correlation Coefficients Between Latent Constructs (Phantom Variables).
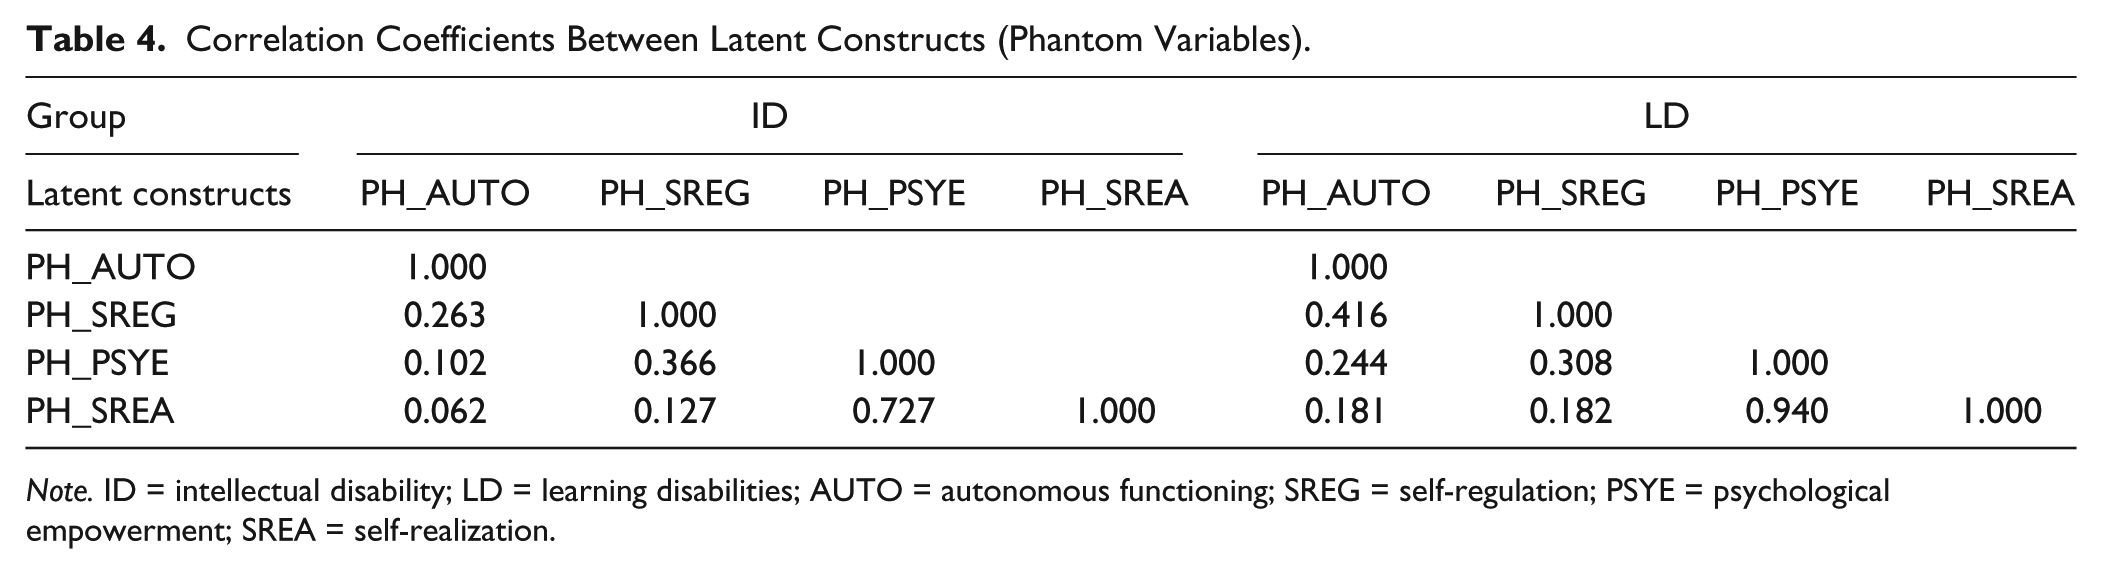
Note. ID = intellectual disability; LD = learning disabilities; AUTO = autonomous functioning; SREG = self-regulation; PSYE = psychological empowerment; SREA = self-realization.
Results of Nested Chi-Square Difference Tests for Latent Mean Differences.
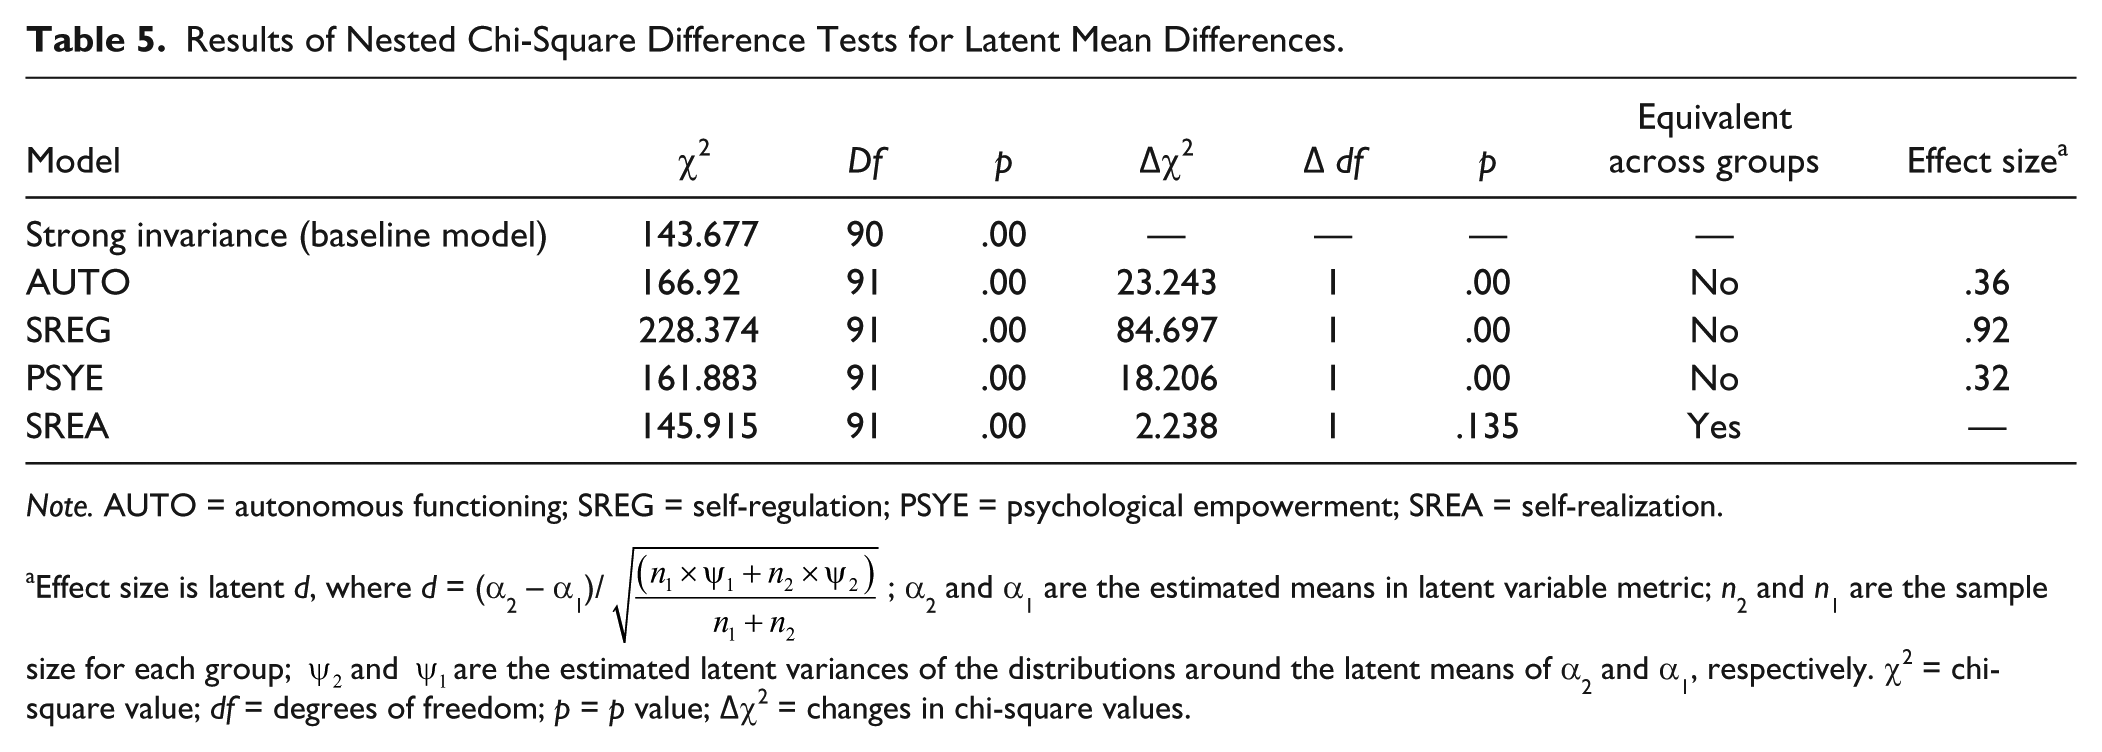
Note. AUTO = autonomous functioning; SREG = self-regulation; PSYE = psychological empowerment; SREA = self-realization.
Effect size is latent d, where d = (α2 – α1)/
Latent Means.
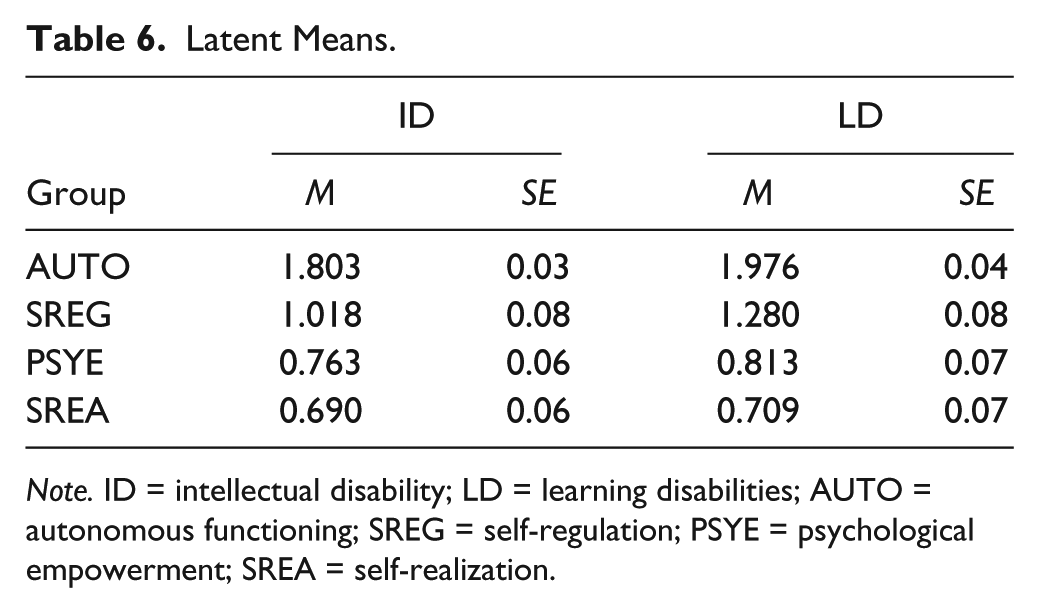
Note. ID = intellectual disability; LD = learning disabilities; AUTO = autonomous functioning; SREG = self-regulation; PSYE = psychological empowerment; SREA = self-realization.
Discussion
The purpose of this study was to examine the factorial structure of the construct of self-determination as measured by the SDS between students with ID and students with LD. Three subresearch questions were addressed in Research Question 1: (a) Are the constructs measured by the SDS for students with ID and students with LD similar? (i.e., configural factorial invariance); (b) Do latent constructs function similarly across students with ID and students with LD? (i.e., weak factorial invariance); and (c) Are the intercepts equal on corresponding factors between students with ID and students with LD? (i.e., strong factorial invariance). In addition, to answer Research Question 2, we conducted comparisons of variances, covariances, and latent means to test latent parameter invariance model across two groups. The following sections include (a) summary of findings, (b) limitations of the study, and (c) implications for practice.
Summary of the Findings
This study established measurement invariance of the four latent constructs across students with ID and students with LD. It is important to conduct this level of analysis to ensure that the items are measuring the desired construct (Little, 1997). First, the data indicated that the underlying construct frameworks of self-determination measured by the SDS displayed the same pattern of factor loadings for students with ID and for students with LD. Thus, the proposed theoretical structures of the SDS are similar for students with ID and students with LD. Second, underlying constructs measured by the SDS function similarly on corresponding domains for students with ID and for students with LD. Four latent constructs displayed the same factor loadings for both groups, providing evidence of weak factorial invariance. Third, the intercepts for the relationships between latent constructs and their corresponding factor were significantly similar across students with ID and students with LD. Once factorial invariance was established in the SDS between both groups of students, we can conclude that any differences in latent means reflects true score differences between students with ID and students with LD, not that the instrument is measuring different concepts in the two groups.
As a sizable array of research related to levels of self-determination measured by the SDS has been conducted with students with ID and with students with LD, it was important to note that factorial invariance was established in this study, which enables us to meaningfully interpret latent constructs. Having established the measurement invariance of the SDS across students with ID and students with LD, the constructs’ variance, correlation, and mean-level differences were examined as an extension of the initial CFA. As shown in Table 2, there were differences across the groups in the variances/covariances of the constructs, so phantom variables were created to provide a comparable correlational matrix. From the following procedure with creating phantom constructs, in Table 4, the pattern of correlations provides the magnitude of the correlations that each of the constructs was distinct in what it was measuring across both groups. Expectedly, distinct patterns of differences between students with ID and students with LD were found in the latent means. Latent means of self-realization were similar in both groups, however, students with LD showed significantly higher results in their self-determination scores in latent means of autonomous functioning, self-regulation, and psychological empowerment in the SDS than did students with ID and it most likely represents true disability differences.
Limitations of the Study
Several limitations must be taken into account when considering the implications of this study. First, in the sample of students with ID, students with mild/moderate and severe ID were merged into one group for evaluation. As the literature suggests that both groups have different characteristics in levels of intelligence, further research is needed to compare differences and examine that relationship before concluding the SDS is measuring the same concept even among students in the single ID category. Second, researchers collected demographic data of participants including students’ disability categories and intelligence scores by teacher report. The reported disability label was provided by teachers who had access to each student’s Individualized Education Program (IEP). The label was assigned on the IEP and described the eligibility of students for services. All participants were receiving special education services under the categorical label of ID or LD as per teacher report of IEP information. Third, as this study relied on student reporting, some bias or sampling errors may affect the self-reporting process, instead of collecting true responses. Fourth, although our study involved a large sample of students with ID and students with LD, this study can only be generalized within these two disability groups. Further studies are needed to investigate the self-determination of other disability categories such as autism spectrum or hearing loss and visual impairments which may present different concerns for measurement of self-determination.
Implications for Practice
As shown in the current study, practitioners can have greater confidence that the SDS adequately measures the same construct across students with ID and students with LD. Thus, the SDS can be used for both populations in practice to measure levels of self-determination. The invariance of the factor structure also holds implications for practice by providing a clearer understanding of how the similarities and differences in the subdomains, including autonomy, self-regulation, psychological empowerment, and self-realization, of the SDS are expressed in students’ lives and what educators can do to support higher levels of self-determination. With the confirmation of factorial invariance, latent means that showed differences across both groups were trustworthy. The study shows that basic constructs measured by SDS were invariant across both the responses of students with ID and LD. Given the support from these results, researchers compared latent means of each construct of the model across both groups and found that students with LD scored higher on the SDS, which was expected. This result expands our knowledge of the utility and feasibility for use of the SDS to quantify levels of self-determination for individuals with ID and LD. Specifically, the study results can inform teachers and families about student self-determination. Furthermore, the results confirm that teachers can use the SDS with confidence that this measure adequately assesses student self-determination for both groups of students-those with ID and LD. Using this information, they can then plan targeted interventions to help students become more self-determined.
Although the SDS has been used since 1995, the body of research regarding self-determination has been limited by low expectations for individuals with ID (Palmer, 2010; Wehmeyer, Sands, Knowlton, & Kozleski, 2002). According to Carter, Trainor, Owens, Sweden, and Sun (2010), students with LD have a higher likelihood of receiving their educational services in a general education environment that provides distinct opportunities to promote self-determination than students with ID. Specifically, teachers reported that youth with LD have greater access to the general curriculum receiving discrete instruction in the components of skills leading to improve self-determination. Skills to enhance self-determination include those related choice making, decision making, problem-solving, goal-setting and attainment, self-regulation/self-management, self-advocacy and leadership, positive perceptions of control, efficacy, and outcome expectations, self-awareness, and self-knowledge (Wehmeyer et al., 2003). Although some studies have found differences in self-determination as a function of level of intelligence between students with ID and students with LD, Wehmeyer and Garner (2003) suggested that IQ was not a significant primary predictor to determine the level of self-determination, and that lower scores for students with ID might be as much a function of the lack of opportunity to engage in activities promoting self-determination. For example, adolescents with cognitive disabilities, including ID, tend to have fewer opportunities to learn self-regulation skills (Martin et al., 2006; Shogren, Lopez, Wehmeyer, Little, & Pressgrove, 2006). Therefore, it is important to provide experiences and opportunities to individuals with disabilities to foster self-determination, such as goal setting and decision making.
As noted in the introduction, the literature in the area of ID and LD has long emphasized the importance of self-determination as an emerging concept promising successful academic, social, and employment outcomes in postsecondary services (Field, Sarver, & Shaw, 2003; LaChapelle et al., 2005; Shogren et al., 2013). In this study, adolescents with ID showed lower levels of self-determination than adolescents with LD. Interestingly, the latent mean differences across groups of ID and LD showed large effect size of differences in the self-regulation latent constructs compared with autonomy and psychological empowerment latent constructs. Related to the result, several studies have found that adolescents with ID tend to have less opportunity to learn skills improving self-determination, including self-regulated strategies (Carter et al., 2010; Wehmeyer & Garner, 2003). It seems evident that efforts are needed to support adolescents and young adults with ID to have expanded opportunities to demonstrate self-determined behaviors with adequate accommodations, when needed (Wehmeyer et al., 2003; Wehmeyer & Field, 2007). For example, adolescents with ID who want to get a job in the local grocery store will need more explicit instruction on self-regulation strategies, such as self-monitoring and self-evaluation, and additional opportunities to learn and practice skills to promote self-determination and self-determined behaviors. This is due to cognitive demands in skills to enhance self-determination. Moreover, more attention has been focused on the role of teachers, parents, and caregivers to promote skills that enhance self-determination to support adolescents with ID or LD and increase their quality and quantity of those instructional opportunities in postsecondary services. Given the evidence of the utility of the SDS across adolescents with ID and LD, future research can broaden these findings to various disability categories and examine how these constructs are similar or different across those groups including the practical implications.
Footnotes
Declaration of Conflicting Interests
The authors declared no potential conflicts of interest with respect to the research, authorship, and/or publication of this article.
Funding
The authors disclosed receipt of the following financial support for the research, authorship, and/or publication of this article: This work was supported by the U.S. Department of Education, Institute of Education Sciences, National Center for Special Education Research awarded to the University of Kansas [Grant PR Award No. R324B070159]; and the U.S. Department of Education, National Institute on Disability and Rehabilitation Research, also awarded to the University of Kansas [Grant PR Award No. H133A031727].