
Abstract
Much attention has been given to the development and validation of measures of growth mindset and its impact on learning, but the previous work has largely been focused on general measures of growth mindset. This research was focused on establishing the psychometric properties of a reading mindset (RM) measure among a sample of upper elementary school students and validating the measure through its relations with standardized measures of word reading and comprehension. The RM measure was developed to capture student’s beliefs about their ability, learning goals, and effort during reading. Item response theory was used to select items that optimally measured the RM measure from a pool of existing items from previous research. The final five-item RM measure predicted reading comprehension outcomes above and beyond the effects of word reading, indicating that this measure may be an important tool for diagnosing noncognitive areas of improvement for developing readers. The implications, limitations, and future directions for expanding upon the measure were discussed.
Skilled reading comprehension (RC), or proficient reading of connected text to derive meaning and understanding, is dependent on underlying component skills, such as word decoding and listening comprehension (Gough & Tunmer, 1986; Kim, 2017; Tunmer & Chapman, 2012). Studies investigating relations among these skills have provided mixed evidence. Some research has shown that 99% to 100% of the variance in RC is accounted for by these component skills (e.g., Foorman et al., 2015; Kim, 2017); however, other research has shown variance accounted for in RC to be between 50% and 75% (Joshi et al., 2012; Ouellette & Beers, 2010). Indeed, a recent large-scale meta-analysis of 155 studies indicated that reading component skills (e.g., vocabulary, listening comprehension, word reading (WR), and fluency) and cognitive factors (e.g., background knowledge, reasoning and inference, and working memory) accounted for 60% of the variance in RC, leaving the remaining variance to be explained by unmeasured noncognitive variables and measurement-related error (Quinn & Wagner, 2018).
In this study, the focus was on potential noncognitive variables that might account for unexplained variance in RC for students in upper elementary school. Comprehension, specifically reading to learn, becomes increasingly important in both English language arts and across content areas for students in upper elementary grades, by which time they are expected to have mastered earlier phases of learning how to read (e.g., Adams, 1990). Yet researchers’ findings from reading intervention studies indicate that it is challenging to improve RC skills for struggling readers once students reach the upper elementary grades, particularly when the assessments are standardized measures of comprehension, rather than near-transfer measures (e.g., Quinn & Wagner, 2018; Wanzek & Roberts, 2012). Thus, this is an important window of time as research has shown that students who struggle to read in upper elementary school are likely to remain struggling readers through high school (Brasseur-Hock et al., 2011; Francis et al., 1996; Moats, 1999; Vaughn et al., 2003), and subsequently are at higher risk for dropping out of school (Dynarski et al., 2008).
A variety of noncognitive factors that may affect RC could include behaviors and attitudes toward reading, motivation for reading, social–emotional learning, beliefs about effort, approaches to learning, and implicit theories of intelligence (e.g., Duckworth & Yeager, 2015; Sisk et al., 2018). Implicit theories of one’s own intelligence, or mindset, determine the relations between motivation and achievement or learning goals and their beliefs about whether intelligence is inherent or malleable (Dweck, 1986, 1999; Dweck et al., 1995). When a child has a fixed, or entity, mindset, they believe their intelligence and ability cannot be changed because it is outside of their control. These children tend to (a) hold performance-oriented goal beliefs, (b) are highly susceptible to others judgment of their learning (Baird et al., 2009), (c) are more likely to display a helpless learning or emotional response, and (d) avoid challenges and are more likely to make negative comments on their own abilities (Baird et al., 2009; Dweck, 1999). In turn, a child with a growth, or incremental, mindset believes that intelligence and academic ability can be developed and changed through perseverance, grit, and practice (Dweck, 1999).
Mindset has also been linked to self-regulation through a meta-analysis (e.g., Burnette et al., 2013). Children with growth mindsets tend to use mastery-oriented learning goals and have better self-regulation, such that they are more likely to seek out challenges and adapt to poor performance through additional effort (e.g., Sisk et al., 2018). In their large meta-analysis (n = 57,155, k = 43), Sisk and colleagues examined the effects of mindset interventions on academic achievement (i.e., grades or GPA, standardized assessments, school or course completion) and noted small but significant positive effects across all students, d = .08. Larger effects were found for high-risk students, d = .19, and for students from low socioeconomic backgrounds, d = .34; however, caution should be taken in extending these findings to elementary students as most of the included studies focused on adolescents or adults. Furthermore, despite growing interest in individual differences in mindset and other noncognitive abilities, researchers in the field (e.g., Duckworth & Yeager, 2015) have noted that there is a lack of agreement among scientists and the lay public about terminology, definition, and measurement. However, they argued that schools need to understand which sets of brief tasks can predict performance on academic behaviors and lead to school improvements (e.g., Bryk et al., 2015).
Within the reading domain, students with more negative behaviors toward reading, such as avoiding reading-related schoolwork, typically have worse reading outcomes, r = −.26 (Baker & Wigfield, 1999). Elementary-aged students with more positive attitudes toward reading, such as students who endeavor to read more and find reasons to enjoy reading, typically have higher reading achievement outcomes, r = .44 (Petscher, 2010). A more positive attitude toward reading moderates students’ motivation for reading (Petscher, 2010; Robinson & Weintraub, 1973), and students with higher motivation typically have better reading outcomes, r = .49–.51 (Taboada et al., 2009). In their study of good and poor readers, Logan et al. (2011) found that for students with poor RC, intrinsic motivation accounted for an additional 21% of the variance in RC above the effects of verbal IQ and decoding. However, for good readers, no additional significant variance was accounted for in their RC skills above and beyond the significant effects of verbal IQ and decoding (Logan et al., 2011). Social–emotional learning is dependent on emotional intelligence, indicated by self-regulation emotional expression (Salovey & Mayer, 1990). Better self-regulatory behaviors are significantly correlated with higher literacy (.18 ≤ r ≤ .23), vocabulary (.27 ≤ r ≤ .35), and math outcomes (.37 ≤ r ≤ .47; McClelland et al., 2007).
Where behavior, attitudes, motivation, and social–emotional learning have concurrent or predictive relations to reading, implicit theories have only recently been studied in the area of reading development. For example, Toste and colleagues (2017) tested the effects of an embedded motivation training within a multisyllabic word training for third- and fourth-grade students. Students were randomly assigned to the motivation plus WR, WR alone, or a business-as-usual (BAU) control condition. Students in the motivation plus WR condition demonstrated stronger sentence-level RC skills than students in the WR only or BAU condition. Authors of a more recent study of fourth- and fifth-grade students found that mastery and performance-avoidance achievement goals fully mediated the relation between global mindset (see Note 1) and RC achievement in struggling readers, even after controlling for WR and vocabulary (Cho et al., 2019).
If a reading-specific mindset exists uniquely from a global mindset, it is important to discover how this reading mindset (RM) manifests, if it can be specifically measured using reading-related mindset items, and if a reading-specific mindset measure can be used to predict reading outcomes. Although a reading beliefs inventory was recently created and validated in an undergraduate population, this measure focused more on a reader’s beliefs on how to approach the texts rather than measuring a mindset pertaining to their own reading skills as exemplified by the epistemological wording of some of the items (e.g., “Different types of text force one to learn new ways of reading,” “If a text is written correctly, everyone can understand it”; see Lordán et al., 2017). Petscher and colleagues (2017) developed a joint model of general and reading-specific mindset by administering a mindset survey, including two subsets of items to 195 fourth graders in a low performing sample who were participating in a larger study. The first subset included 13 items from the general mindset measure established by Blackwell et al. (2007) related to the theory of intelligence, learning goals, and effort beliefs. The second subset included 13 reading-specific mindset items developed to measure noncognitive information related to mindset, approaches to learning, effort beliefs, and attitudes and emotions about reading (Al Otaiba et al., 2020). This domain-specific measure was written particularly to focus on struggling readers in upper elementary grades. To obtain a final measure, the authors discarded 11 total items with a negative impact on reliability and then tested a series of competing models, including eight general growth mindset items and seven reading-specific mindset items (Petscher et al., 2017). The best model fit was for a bifactor model indicated by two separate, specific factors of general mindset and RM, and a single underlying general factor for global growth mindset (GGM). In a structural equation model (SEM), the authors found that the specific RM factor uniquely predicted RC and WR outcomes after controlling for general mindset and GGM. In an alternative model, GGM and RM accounted for statistically significant unique variance in RC (15%) beyond the unique variance accounted for by WR (67%).
Although measures have been developed for domain-specific tasks in math and history (Buehl et al., 2002) and for broader reading beliefs in undergraduate students (Lordán et al., 2017), little attention has been given to a reading-specific mindset measure for elementary students. Petscher and colleagues (2017) developed a joint measure of general and reading-specific mindset but did not examine the ability of the items of the reading-specific mindset measure to discriminate between the levels of RM across the trait continuum. Furthermore, there is evidence that an additive effect of including both WR and mindset training resulted in better sentence-level RC than a WR intervention alone (e.g., Toste et al., 2017), and poor readers benefited from higher intrinsic motivation in predicting their RC outcomes above the effects of decoding (Logan et al., 2011). However, no existing study has examined the interaction between RM and WR and testing this hypothesis could lead to a more informative model of RC, especially in lower achieving readers.
Present Study
The objective of this study was to establish a RM measure by examining the seven items from Petscher and colleagues (2017) that best measured the RM construct, replicate the statistically significant relations with WR and RC, and propose an alternative model featuring an interactive effect of RM and WR on RC outcomes. To reflect the broader approach to mindset for reading achievement (i.e., theory of intelligence, learning goals, and effort beliefs) and distinguish this measure from the traditional conception of growth mindset, the novel measure is henceforth referred to as RM. We sought to answer the following research questions:
Method
Participants
Sample participants consisted of 430 (male = 200; female = 194; no response = 36) fourth-grade students participating in a larger intervention study who were recruited from two states in the southern United States. This larger intervention study included two cohorts of fourth-grade students from 15 public schools located in three school districts (Petscher et al., 2017). Approximately, two thirds of the sample (n = 280) were at or below the 30th percentile on the RC subtest of the Gates-MacGinitie Reading Test (MacGinitie & MacGinitie, 2006). School districts provided demographic information for study participants. For ethnicity, 34.6% (n = 149) identified as Hispanic, 48.6% identified as non-Hispanic (n = 209), and ethnicity was not available for 16.7% (n = 72) of the sample. The racial composition of the sample was 37.9% (n = 163) Black, 24.4% (n = 105) White, 2.1% (n = 9) American Indian, and 1.9% (n = 8) Asian or Pacific Islander. Race was unavailable for approximately 33% (n = 145) of the sample. All schools provided instruction only in English, with about 16% (n = 71) of students identified as limited English proficiency or eligible for language support. Approximately, 66% (n = 282) of the sample were eligible for free or reduced-cost lunch. About 9% (n = 37) of the students had a disability (e.g., learning disability).
Measures
The RM measure, two measures of WR, and three measures of RC were administered to the sample.
RM
In the RM measure, items were written to reflect students’ beliefs of their ability, learning goals, and effort during reading (Al Otaiba et al., 2020). Some examples of the items included, “If a book is hard to read, I stop reading it,” and “I don’t like when my teacher corrects me when I am reading.” The items were originally scored on a six-point Likert-type scale representing agreement with the target phrase. Following the data collection, the items were reverse coded, such that low values corresponded to a fixed mindset and higher values corresponded to a growth mindset (1 = Agree a lot, 6 = Disagree a lot).
WR
Reading mindset was individually measured by two subtests from the Woodcock-Johnson III (WJ) Tests of Achievement: Letter–Word Identification (WJLW) and Word Attack (WJWA). In the WJLW subtest, students identified (i.e., read aloud) a list of letters and words that increased in difficulty. This task determines a student’s skills in recognizing letters and words. In the WJWA subtest, students read aloud from a list of increasingly difficult nonsense words, with the results indicating a participant’s usage of letter-sound correspondences to aid in pronouncing unfamiliar words. Content and concurrent validity were established using a representative sample; test–retest coefficients for the two subtests used were 0.95 for Letter–Word Identification and 0.83 for Word Attack. (Woodcock et al., 2001).
RC
Reading comprehension was assessed using the Woodcock-Johnson III Passage Comprehension subtest (WJPC), the Gates-MacGinitie Reading Test—Comprehension subtest (GMRTC; MacGinitie & MacGinitie, 2006), and the Test of Silent Reading Efficiency and Comprehension (TOSREC; Wagner et al., 2010). The WJPC subtest is a cloze task requiring a participant to supply missing words to sentences and passages. Split-half reliability is .88, and the WJPC is correlated highly with the Wechsler Individual Achievement Test (.70–.79) and the Kaufman Test of Educational Achievement (.62–.81; Woodcock et al., 2001).
The GMRTC is a multiple-choice assessment of a student’s ability to understand main ideas and draw inferences from the provided passages. Alternate form reliability ranges from .74 to .92 and test–retest reliability ranges from .88 to .92; validity estimates with other tests of language and reading ranges from .60 to .62 (MacGinitie & MacGinitie, 2006).
The TOSREC is a timed reading task (3-min time limit) where a student silently reads sentences of increasing length and complexity and assesses the truth of the sentence by answering true or false (Wagner et al., 2010). Alternate form reliability exceeds .85 across forms and grade levels; reliability with other measures of reading (e.g., Woodcock-Johnson Tests of Achievement, 3rd Edition) exceeds .70 (Wagner et al., 2010).
Procedure
The group-administered RM survey was distributed through SurveyMonkey to all participating students in the spring of the fourth grade (April/May). Trained research staff also administered the standardized WR and RC assessments individually to students more than a 2-week period. The measures were counterbalanced across students. All assessors were trained and required to demonstrate 100% reliability in administration and in scoring prior to conducting assessments in the field.
Data Analytic Plan
RM item selection
In accordance with the results from Petscher and colleagues (2017), seven items (see Table 1 for item content) that optimally measured the RM factor were specified in the current study. The items were specified on a unidimensional RM factor using an item response theory (IRT) graded response model for categorical items with multiple responses. A one-parameter logistic model (difficulty parameters estimated, slope parameters constrained to equality; 1PL) and a two-parameter logistic model (difficulty parameters and slope parameters estimated; 2PL) were compared using a likelihood ratio test to determine which model best fits the sample data. The difficulty and discrimination parameters (b and a, respectively) of the best model were then examined to select the fewest number of items where the selected items each provided unique information and discriminated well between different levels of the RM construct. Desirable a parameters were those that exceeded 1.0 in value and b values were examined to identify those that included unique information across the RM trait continuum. In addition, a reliability analysis was performed to determine the impact of the deletion of individual items on coefficient omega (Dunn et al., 2014). All IRT models and parameter estimates were performed and obtained using the mirt (see Note 2) package (Chalmers, 2012) in R.
Graded Response Model Item Threshold and Discrimination Parameters.
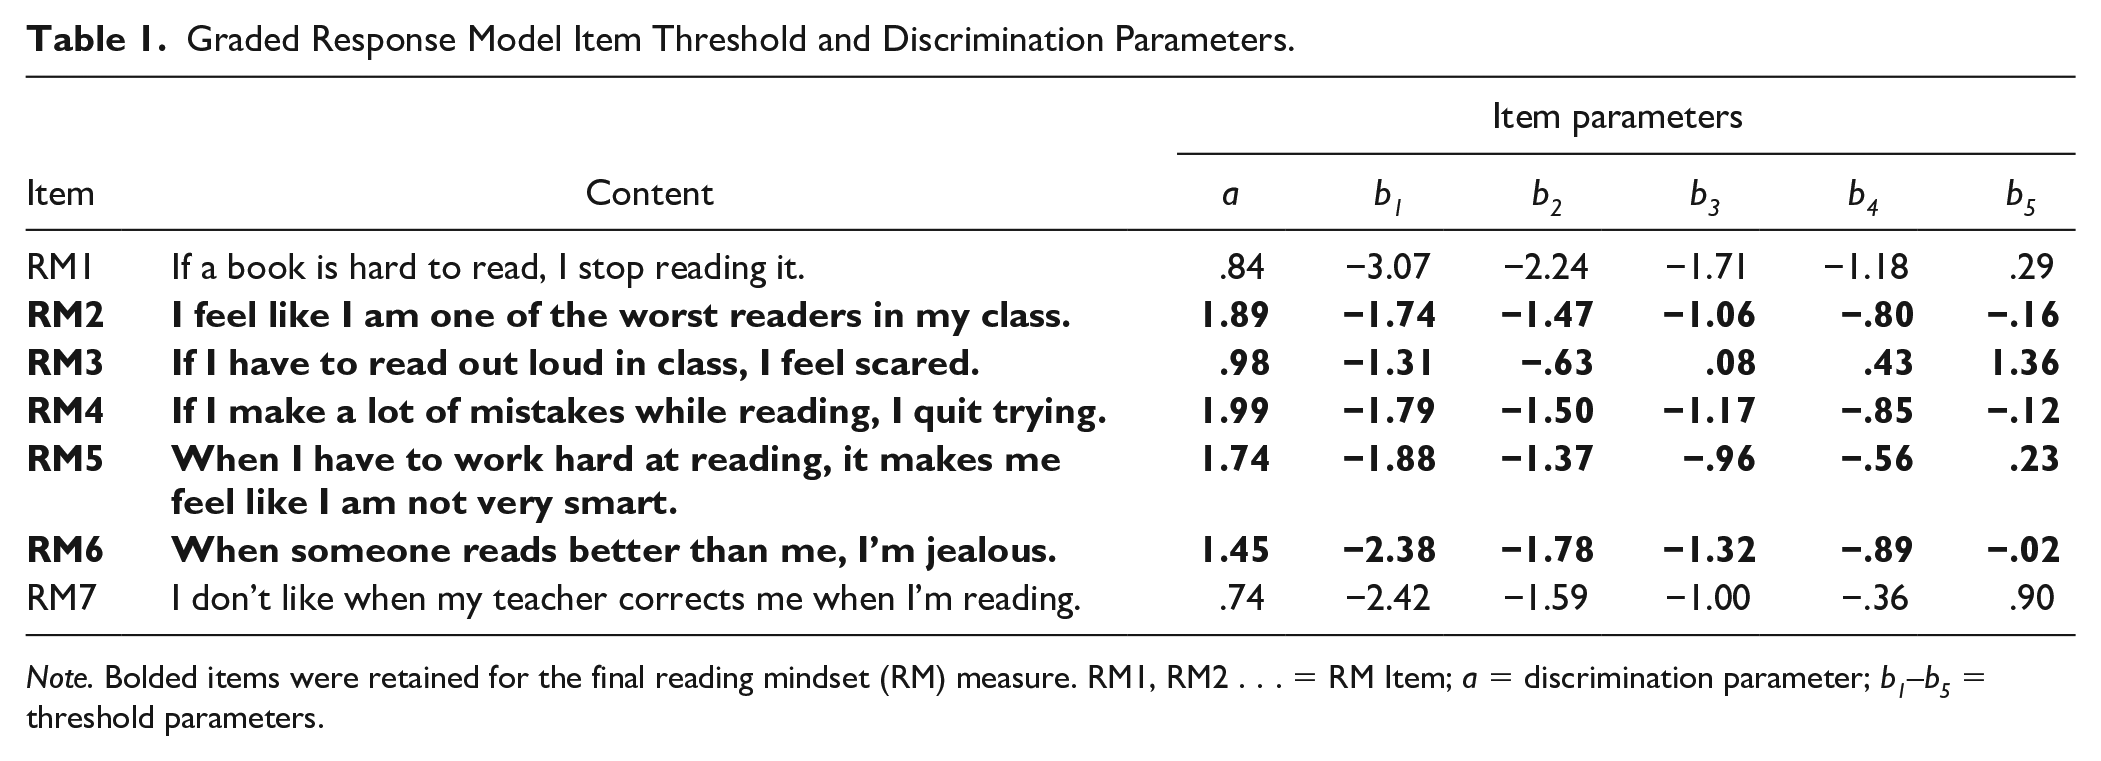
Note. Bolded items were retained for the final reading mindset (RM) measure. RM1, RM2 . . . = RM Item; a = discrimination parameter; b1–b5 = threshold parameters.
Item characteristic curve and test information function curve
The item characteristic curves (ICCs) and test information function curve (TIF) were reported for the final set of items. The ICCs visually display the relation between the ability of an individual and the probability of a response. In a 2PL model, the curves reflect two specific pieces of information pertinent to the interpretation of the RM items: (a) the conditional probability of a response whereby for a given threshold (i.e., the b value in a graded response model), the b is equal to where the probability for that threshold is equal to .50; and (b) how well the item discriminates between those who are higher on the measured attribute versus those who are lower on the measured attribute (i.e., the a parameter; De Ayala, 2013). The TIF is a sum of item information curves across the complete set of items and indicates the level of precision (i.e., reliability) in the measured attribute along levels of the attribute. In this way, the TIF may communicate for whom the scores are precise. Coefficient alpha thresholds of 0.70 and 0.80 were used as indicators of the precision of measurement for RM across the trait continuum. The ICC and TIF figures were plotted in the jrt package in R (Myszkowski & Storme, 2019) based on the estimation procedures from the mirt package (Chalmers, 2012).
Structural equation modeling
The validity of the final RM measurement model was examined through SEMs. The retained items were specified on a single RM latent factor. Two latent factors for WR and RC were composed by specifying the WJLW and WJWA observed variables on the WR latent variable and specifying the WJPC, GMRTC, and TOSREC observed variables on the RC latent variable.
Three structural models were fit to the data. The goal of Model 1 was to determine whether RM accounted for a significant amount of variance in RC and in WR by regressing WR on RM and RC on RM. In Model 2, an alternative specification was tested to determine whether RM could predict variance in RC above and beyond the effects of WR. Finally, in Model 3, an interaction model was performed where RC was regressed on RM, the interaction of RM and WR (RMWR), and the covariate WR to determine whether the interaction term accounted for a statistically significant amount of variance in RC above WR and RM. The interaction term for Model 3 was composed through the product indicator approach whereby pairs of manifest variables from the latent variables are multiplied to create a series of products (Kline, 2016). A significant interaction term in the SEM was plotted using 1 standard deviation (SD) thresholds on the focal (WR) and moderator (RM) variables to estimate RC as a function of higher or lower ability. Judgments on the quality of fit for all SEMs were based on recommendations by Kline (2016; TLI > 0.90; CFI > 0.90; root mean square error of approximation [RMSEA] between 0.05 and 0.08). All SEMs were estimated in the lavaan package in R (Rosseel, 2012) with the weighted least squares (WLSMV) estimator for categorical variables with robust standard errors.
Results
Descriptive Statistics
The descriptive statistics, including information about the means, SDs, distribution, data missingness, and correlation coefficients, are listed in Table S1 of the Online Supplemental Materials (OSM), while the item response proportions for the seven items are listed in Table S2. Data missingness for the RM items was extremely low, with a maximum of 2.10% missing data for individual items. The items ranged in mean from 3.47 to 4.87 and indicated no departures from normality for skewness (≤2) or kurtosis (≤7) as suggested by Curran et al. (1996). A closer look at the distribution of the items in Table S2 indicated five items (RM1, RM2, RM4, RM5, and RM6) had responses that were negatively skewed, with between 65% and 73% of the responses being a 5 (disagree) or 6 (disagree a lot), indicating a higher proportion of positive mindset-oriented responses. Among these items there were few low responses, with between 13% and 17% of the responses being a 1 (agree a lot) or 2 (agree), indicating a lower proportion of negative mindset responses. Items RM3 and RM7 had more balanced item responses, with 40% and 55% of the responses being a 5 or 6, and 38% and 26% of the responses being a 1 or 2, respectively.
The reading outcome measures indicated no violations of the standards for skewness or kurtosis and there were no missing data. The correlations between six of the RM items (RM1–RM6) and the reading outcome measures (WJLW, WJWA, GMRTC, TOSREC, and WJPC) were significant and positive (.12 ≤ r ≤ .40). RM7 was only significantly related to WJWA (r = .11), indicating a lack of relations between RM7 and the outcome variables. The WJLW and WJWA were highly correlated (r = .83), the correlations were moderate between the measures of WR and RC (.48 ≤ r ≤ .75), and the correlations among RC measures were moderate (.60 ≤ r ≤ .69).
Scale Establishment
A graded response model, including the seven items, was composed to determine which items optimally measured the RM construct. A comparison of the seven-item graded response model with equality constraints on the slope parameters (−2LL = 4,252.22; AIC = 8,576.44; BIC = 8,722.73) to the unconstrained seven-item model (−2LL = 4,220.59; AIC = 8,525.18; BIC = 8,695.86) indicated a clear preference for the unconstrained model (i.e., 2PL), suggested by the statistically significant likelihood ratio test (LRT, 6) = 63.25, p < .001.
The parameter estimates for the seven-item 2PL graded response model are listed in Table 1. The b parameter estimates ranged from −3.07 to 1.36, indicating considerable range in the location of responses across the trait continuum, whereas the a parameter estimates ranged from .74 to 1.99, indicating a considerable range of ability to discriminate among the set of items. Of the seven items, RM1 and RM7 were removed, given their lack of unique information along the reading achievement mindset trait continuum, content overlap, poor discrimination values relative to the other items at the same difficulty level, and that the reliability became larger when each of these items was dropped. RM3 was considered for removal given its modest discrimination value (.98), but ultimately retained given the unique information it provided at the higher end of the RM trait and its positive contribution to reliability. The RM2, RM4, RM5, and RM6 items were also retained given good discrimination values and contributions to the overall scale information. The coefficient omega for the five retained items (RM2, RM3, RM4, RM5, and RM6) was 0.73.
ICC and TIF
Figures pertaining to the ICCs (see Figure S1) and TIF (see Figure S2) are included in the OSM. The interpretation of the TIF indicated less information above zero and lower precision of measurement above trait levels of 1.25. More specifically, levels of precision exceeding a reliability of .70 were indicated for the range of RM from approximately −2.50 to 1.25, corresponding to 89% of individuals in a normal distribution, and levels of precision exceeding .80 were indicated for the range of RM from −1.75 to .25, corresponding to 56% of individuals in a normal distribution. Relatedly, the ICC indicated a relatively low threshold for the highest response options across the items, and a heavy concentration of item thresholds in a narrow range of the RM trait score between −1.50 and −.50, with some nonsequentially ordered item thresholds. The overlap of item thresholds indicates less value for the response options in the middle of the trait continuum (i.e., response options 2 through 5).
In response to the item overlap, a five-item post hoc RM model was composed with four response categories rather than six and is discussed in detail in the OSM (alternative model, including four response categories), with the parameter estimates listed in Table S3 in the OSM, and the ICCs and TIF depicted in Figures S3 and S4, respectively, of the OSM. Although the four-response model indicated less crowding of item thresholds, the six-response model was henceforth used to be consistent with the original coding and due to the lack of clear superiority for the four-response model.
SEMs
A series of SEMs were fit to investigate the relations between the five-item RM measure and the reading outcome measures WR and RC. In Model 1, WR and RC were regressed onto the RM latent factor (see OSM Figure S5). The model fit was acceptable, χ2(32) = 85.33, p < .001; RMSEA = 0.06, 90% CI = [0.05, 0.08], TLI = 0.94; CFI = 0.96. The five items loaded significantly on to the RM latent variable (.49 ≤ λ ≤ .84, p < .001). RM was positively related to WR, β = .44, p < .001, and RC, β = .48, p < .001, and accounted for approximately 20% of the variance in WR and 23% of the variance in RC.
In Model 2, RC was regressed on RM and WR (see OSM Figure S6). The model fit was acceptable, χ2(32) = 85.33, p < .001; RMSEA = 0.06, 90% CI = [0.05, 0.08], TLI = 0.94; CFI = 0.96. There was a significant path from the covariate WR to RC, β = .78, p < .001, and there was a small but significant path from RM to RC, β = .13, p < .01. A total of approximately 72% of the variance in RC was accounted for by the combination of WR and RM.
In Model 3, RC was regressed on RM, WR, and the interaction term, RMWR (Figure 1). The model fit approached acceptable fit, χ2(82) = 324.22, p < .001; RMSEA = 0.08, 90% CI = [0.08, 0.09], TLI = 0.90; CFI = 0.87. The covariate WR was significantly and positively related to RC, β = .80, p < .001. The path from RM to RC, β = .12, p < .01, and the path from the interaction term RMWR to RC, β = .12, p < .01, were statistically significant, indicating a significant effect of RM and the RMWR interaction term after controlling for variance related to WR. Approximately, 76% of the variance in RC was accounted for by RM, WR, and RMWR.
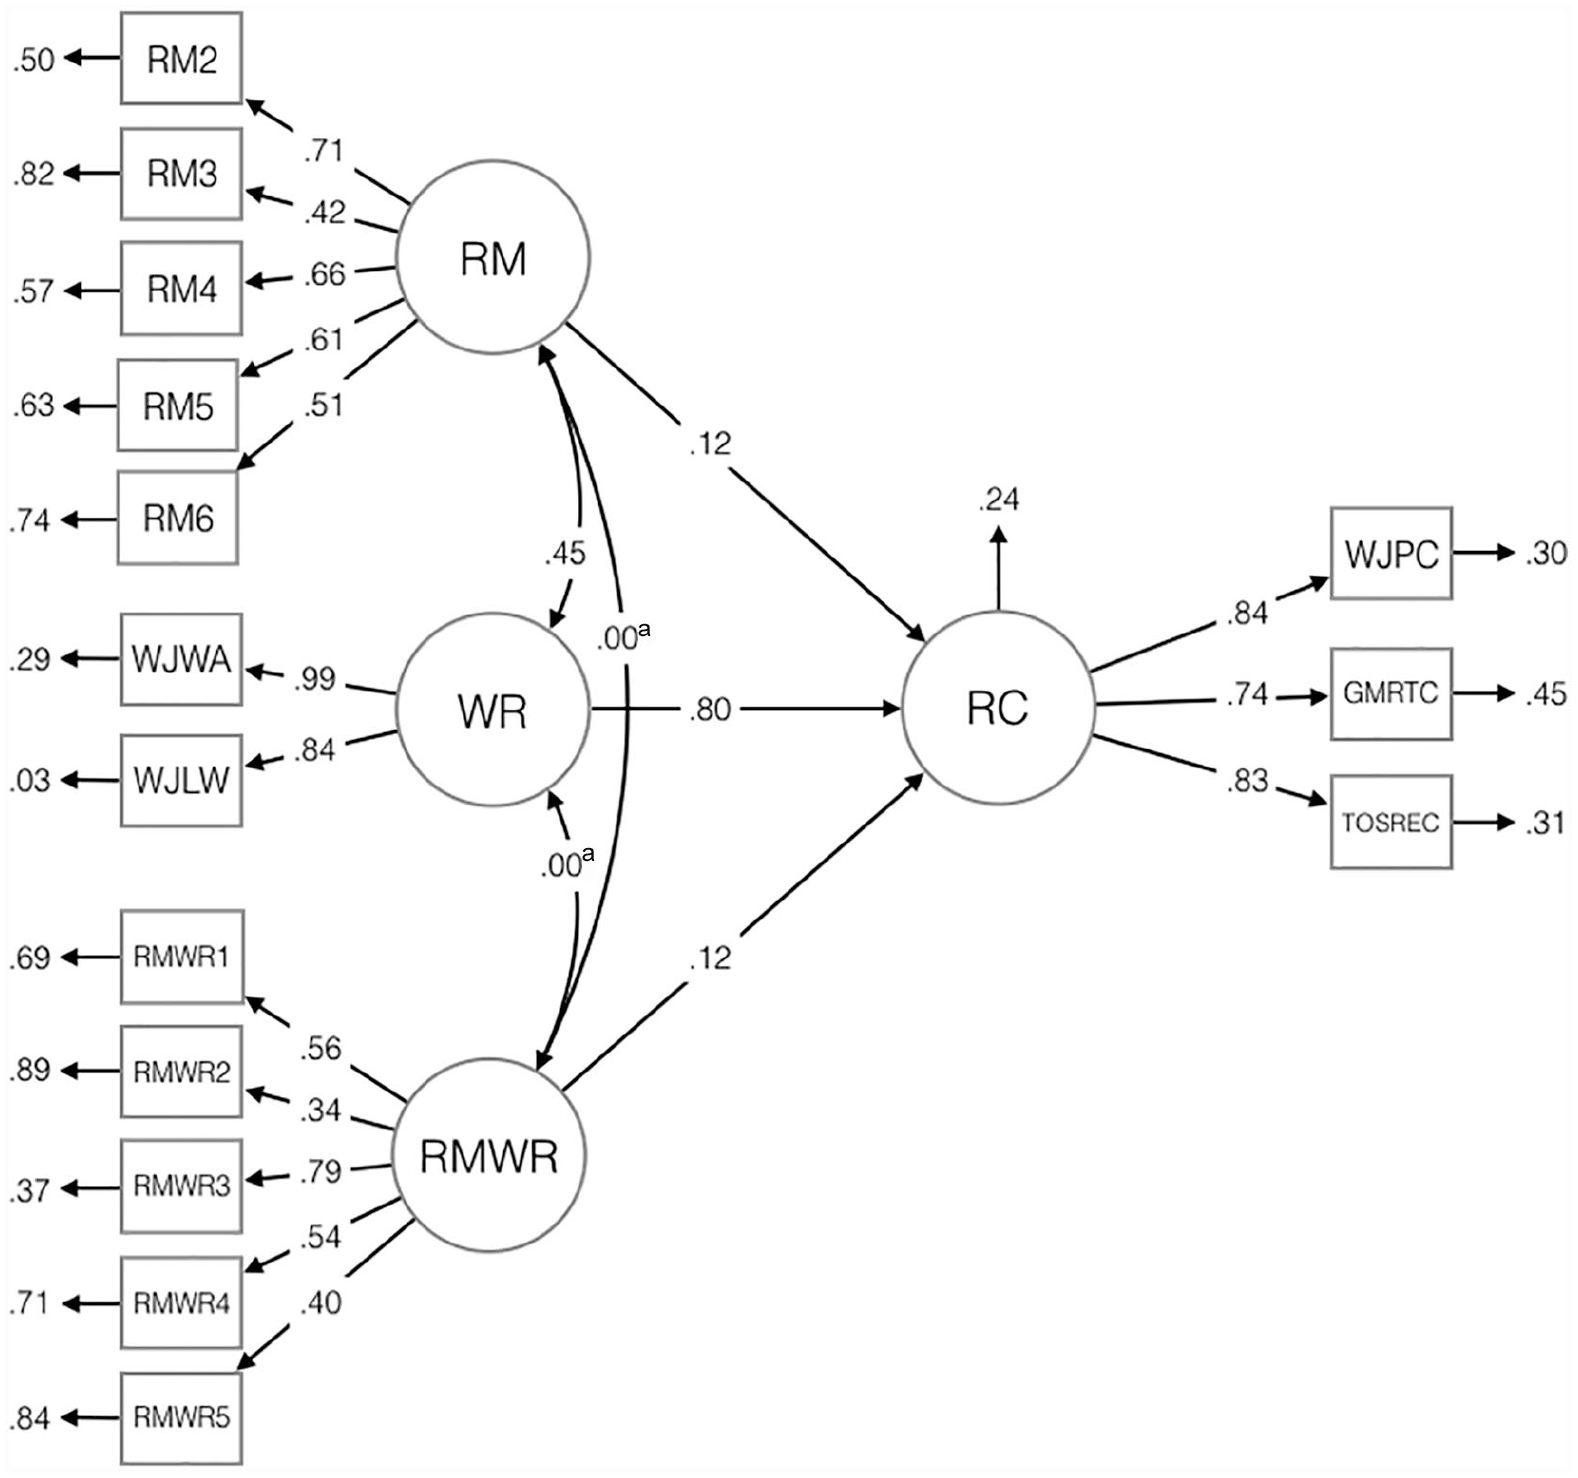
RC regressed on RM, WR, and the interaction of RM and WR.
The latent interaction plot (see OSM Figure S7) displayed the effect of the interaction on RC. For individuals with low WR (x-axis), the gap in RC between students with high (+1 SD) or low (−1 SD) levels of RM was moderate (i.e., approximately 0.50 SD). For students with high WR, the gap in RC between those with high and low RM was about 1.0 SD.
Discussion
The purpose of the current study was to use items related to implicit theories of intelligence, perceived effort, and learning goals, as related to reading and to examine how these items were related to RC and WR outcomes. The RM measure was scaled such that students with higher RM scores indicated a belief that their reading could improve with dedication and practice, were not discouraged when reading, and were more open to reading aloud in class, whereas students with lower scores on the RM measure indicated that they believed their reading could not be improved, experienced more anxiety while reading, or they were more discouraged while reading. The final five-item RM items covered a good range of difficulty while also discriminating well across the range of the latent RM trait. After establishing the optimal items for the RM measure with good psychometric properties, a series of SEMs were performed to examine the relations between the RM measure, WR, and RC. The results indicated unique predictive value of the RM measure in each of the models tested. Thus, the findings of the current study were consistent with the meta-analysis conducted by Sisk and colleagues (2018) while also extending upon those findings by focusing on upper elementary school students and the content domain of reading.
In the first SEM (Model 1), the RM measure positively predicted RC and WR skills. Students with a more positive mindset and outlook toward reading had better WR and RC outcomes, such that students who were less anxious and more motivated while reading difficult texts had better WR and RC outcomes. This model accounted for 20% and 23% of the variance in WR and RC, respectively. This finding was consistent with research describing other noncognitive constructs, such as the association of positive attitudes toward reading with higher reading scores (e.g., Petscher, 2010) and that motivation to read can account for additional variance in comprehension beyond decoding skills (Logan et al., 2011). As Quinn and Wagner (2018) discovered in their meta-analysis, up to two fifths (40%) of the variance in RC was unexplained after accounting for component skills and cognitive aspects of reading, such as vocabulary, WR, and reasoning and inference skills.
Because WR is one of the main components of RC (e.g., Gough & Tunmer, 1986; Joshi et al., 2012; Quinn & Wagner, 2018), it was also important to test an alternative model to determine whether the RM measure independently predicted RC outcomes while controlling for the effect of WR. The results of Model 2 indicated that the RM measure uniquely predicted RC outcomes while controlling for the effects of WR. The combined effects of WR and RM accounted for nearly three fourths of the variance in RC outcomes.
In a prior study, in comparing students who were subjected to WR training combined with mindset training versus those students who received WR training alone, the students in the combined condition had better sentence comprehension outcomes than students who received only WR training (Toste et al., 2017). Furthermore, Logan et al. (2011) found that intrinsic motivation was particularly important for poor readers in predicting their RC outcomes above the effects of decoding and verbal IQ. Building on these findings, an interactive effect between RM and WR was tested. The results of Model 3 indicated there was a significant, positive interaction between WR and RM that predicted RC outcomes above and beyond the main effects of WR and RM. For individuals with a high level of WR, those with a more positive mindset for reading had RC scores 1 SD higher than students whose mindset was more negative. This gap in RC scores was still apparent for children with low WR, whereby children who had more positive mindsets toward reading had RC scores approximately 0.5 SD higher than children with more negative mindsets toward reading. These interactive effects aligned with the results of Toste et al. (2017). Furthermore, students still benefit from having a better RM than similarly skilled students with a concurrently low RM, a finding that aligned to that of Logan and colleagues (2011) particularly for poor readers.
Why does RM matter more for students with good WR than for students with poor WR? We speculate that for students with poor WR and positive RMs, they believe that they can indeed improve their comprehension, but perhaps they also understand that they first need to improve their WR. This provides a protective effect in motivating them to improve their skills. For students with good WR and positive RMs, they do not have this additional barrier blocking their RC improvement, and as such, benefit more from having a better outlook on their reading. However, it is impossible to tell if this is the case from the current study. Future work could explore this relation in good and poor readers through combined interventions that target either children with low RMs or children with poor WR in an effort to improve their RC. These groups of children could be paired with either a mindset intervention or a WR intervention, modeled similarly to Toste and colleague’s (2017) study, in an effort to improve their RC outcomes.
The findings of the current study may have implications for teacher training, as teachers who believe students’ mindsets are malleable may provide more support when students struggle academically in the classroom (e.g., Gutschall, 2013). Scores on this brief RM measure may provide teachers with a better idea which of their students have more negative thoughts about their reading and who might therefore be less responsive or engaged if they do not believe their effort will lead to better performance and practice. For example, when students are anxious while reading in the classroom, and therefore are more likely to endorse “agree a lot” to RM3 (i.e., If I have to read out loud in class, I feel scared.), teachers could encourage practice, improve goal setting, and provide positive supports through personalized instruction. This is important for early intervention, as it is challenging to accelerate RC for struggling readers later in school (Wanzek et al., 2019; Wanzek & Roberts, 2012) and struggling readers are likely to remain poor readers through high school (e.g., Brasseur-Hock et al., 2011; Francis et al., 1996).
The establishment of the RM measure may be particularly useful as a tool to enhance and intensify reading interventions for vulnerable populations, such as the sample in the current study, which included typical readers and students with severe reading difficulties. Notably, 66% of these students were eligible for free and reduced lunch, and 9% had a disability. In fact, the meta-analysis by Sisk and colleagues (2018) indicated positive effects for students at academic risk, d = .19, and students from low socioeconomic backgrounds, d = .34.
Limitations and Future Directions
The current study was limited by the inability to make conclusions about the size of the relations between RM and RC outcomes that are independent of other important cognitive based measures, such as vocabulary knowledge, inference, background knowledge, or working memory (e.g., Cain et al., 2001, 2004; Quinn et al., 2015; Quinn & Wagner, 2018). The relation between RM and RC is apparent in the current study, but this relation might not be a direct relation if other predictors were included in the model, such as vocabulary knowledge. In addition, although Petscher and colleagues (2017) indicated the RM measure was independent of general growth mindset and had unique predictive value, the general growth mindset measure would still share variance with RM and should be included as a control variable in a future study.
The RM measure may have also been limited by the small number of items in the final specification. Given that only five items were specified in the final measure and the set of items lacked information at the higher end of the RM trait continuum, considerations should be made for writing additional items to enhance the psychometric properties of the measure. Although individuals most often endorsed the highest two response options of the RM measure, the results indicated that the least amount of information was available at higher levels of the RM trait. For example, Item RM4 (If I make a lot of mistakes while reading, I quit trying) indicated 75% of individuals endorsed a response of 5 or 6, but only needed to approach a theta level of zero for them to be most likely to endorse a response of 6, indicating this item would not be much value for discriminating between individuals at high levels of RM. Including additional items targeting higher levels of the RM trait would allow researchers to measure RM with equal precision across the trait continuum and have the secondary benefit of positively contributing to reliability, as the average inter-item correlation needed to improve scale reliability becomes smaller as the number of items increases (DeVellis, 2012). In addition, fewer response options may be better suited to the RM measure given the concentration of information and nonsequential ordering of some of the response options in the middle of the RM trait. Four response options (i.e., Strongly Agree; Agree, Disagree, and Strongly Disagree, see OSM) may be better suited to reflect the results indicated in the current study; however, the increase in response options came at a cost of measurement precision. In sum, adaptations to the current measure (e.g., adding items that measure the higher end of the RM trait continuum; including fewer response options) may optimize the psychometric properties of the RM measure.
Finally, the sample used to establish the RM in the current study was a mixed sample, consisting of typically developing readers and readers that were below the 30th percentile in RC. As a result, it is plausible that the RM measure may have operated differently across factor loadings or intercepts, depending on student RC level. Multiple group testing could test this possibility, and with an adequately sized sample, differential item functioning (DIF) analysis could also be performed. DIF would determine whether individual items or the full measure functions differently for different groups (i.e., race or gender). For example, girls are more motivated to read and tend to have better attitudes when reading (e.g., Logan & Johnston, 2009; McGeown et al., 2012) and certain items on the RM measure, therefore, might show differential patterns of responses based on the gender of the student.
Conclusion
The RM measure is a reliable measure of a child’s outlook and attitudes related to their reading. In addition to direct relations between the RM measure and WR and RC, RM also independently predicted RC above and beyond the effects of WR. Finally, there was an interaction between RM and WR, and this interaction in turn predicted RC outcomes. Authors of future research can use this reliable and valid measure of mindset, particularly as it relates to reading skills, to inform whether mindset interventions alone or mindset interventions embedded in reading interventions can accelerate student reading achievement.
Supplemental Material
Tock_OSM_A_REVISED – Supplemental material for Establishing a Reading Mindset Measure: A Validation Study
Supplemental material, Tock_OSM_A_REVISED for Establishing a Reading Mindset Measure: A Validation Study by Jamie L. Tock, Jamie M. Quinn, Stephanie Al Otaiba, Yaacov Petscher and Jeanne Wanzek in Assessment for Effective Intervention
Footnotes
Declaration of Conflicting Interests
The authors declared no potential conflicts of interest with respect to the research, authorship, and/or publication of this article.
Funding
The authors disclosed receipt of the following financial support for the research, authorship, and/or publication of this article: The research reported here was supported by the Institute of Education Sciences, U.S. Department of Education, through Grant R324A150269 and by the Eunice Kennedy Shriver National Institute of Child Health and Human Development of the National Institutes of Health under Award No. R01HD091232. The content is solely the responsibility of the authors and does not necessarily represent the official views of the funding agency.
Dataset
The dataset examined for the current study will be posted on the Open Science Framework website (osf.io) when the current set of manuscripts, including this dataset, is concluded.
Notes
References
Supplementary Material
Please find the following supplemental material available below.
For Open Access articles published under a Creative Commons License, all supplemental material carries the same license as the article it is associated with.
For non-Open Access articles published, all supplemental material carries a non-exclusive license, and permission requests for re-use of supplemental material or any part of supplemental material shall be sent directly to the copyright owner as specified in the copyright notice associated with the article.