
Abstract
The BASC-3 Behavioral and Emotional Screening System Student Form (BESS SF) is the latest iteration of a widely used instrument for identifying students at behavioral and emotional risk. Measurement invariance across race/ethnicity and gender for the latest BESS SF has not yet been established. Using a sample of 737 U.S. urban fourth- to eighth-grade students, we tested competing models of the BESS SF to determine the best-fitting factor structure. We also tested for measurement equivalence by race/ethnicity (i.e., White, Black, Latinx) and gender (i.e., boys, girls). Consistent with prior findings, we identified that a bifactor structure of the BESS SF best fit the data and supported measurement equivalence across race/ethnicity and gender. These findings provide further support for using the BESS SF to conduct universal behavioral and emotional screening among diverse students. More research is needed in schools serving students with greater racial/ethnic and socioeconomic diversity.
Schools have been challenged with identifying and evaluating students with behavioral and emotional problems and often serve as the primary mental health support system for racial/ethnic minority youth (Cauce et al., 2002; Farmer et al., 2003; U.S. Congress, 2004). However, traditional school-based methods of assessing behavioral and emotional risk among students (e.g., office discipline referrals) have been insufficient. For example, these traditional methods are subject to reporter biases that disproportionately over-refer male and racial/ethnic minority students, under-refer students with internalizing problems, and have little predictive validity (Girvan et al., 2017; Kauffman, 1999; Naser et al., 2018a; Skiba et al., 2011; Sullivan & Bal, 2013). This is particularly problematic, as racial/ethnic minority children and youth are at greater risk for impaired socioemotional development due to unique risk factors (e.g., experiencing racism) and are ultimately less likely to be linked to mental health interventions (Alegria et al., 2010; Berry et al., 2021). Improving how schools identify students at behavioral and emotional risk is imperative for addressing child mental health and treatment disparities.
One remedy for these shortcomings could be the implementation of school-based universal screening, which can more effectively and accurately identify students at behavioral and emotional risk compared with traditional methods and can link such students to targeted evidence-based interventions (Eklund & Dowdy, 2014; Miller et al., 2015; Naser et al., 2018a). Recent research has advocated for student-reported universal screening measures for social, emotional, and behavioral risk as a way to address inequity in mental health care access and the disproportionate use of punitive discipline practices and special education referrals with Black, Latinx, and Native American youth (Dever et al., 2016). Furthermore, integrating self-report screeners can more thoroughly identify students with emotional problems without solely relying on teachers’ report, which are more likely to identify and refer students that exhibit disruptive behaviors (Splett et al., 2019). To effectively address mental health treatment disparities, establishing self-report school-based screeners that adequately assess behavioral and emotional risk across race/ethnicity and gender is needed.
The Behavioral and Emotional Screening System
The original (BASC-2) Behavioral and Emotional Screening System Student Form (BESS SF) was developed as a universal screening tool for behavioral and emotional risk using items from the extensive Behavioral Assessment System for Children (BASC; Kamphaus & Reynolds, 2007). Prior psychometric testing of the original screener demonstrated measurement invariance across race/ethnicity (i.e., White, Black, Latinx) among a sample of high school students (Harrell-Williams et al., 2015). Nearly a decade later, the BASC-3 BESS SF was created to revise the previous form and assess behavioral and emotional risk using three factors (personal adjustment, self-regulation, and internalizing) and a series of miscellaneous school-related risk items (Reynolds & Kamphaus, 2015). The latest BESS SF was normed on a nationally representative sample; however, no known studies have tested whether this assessment assesses behavioral and emotional risk constructs equally across racial/ethnic groups.
Measurement invariance, or the determination that the psychometric properties of an instrument measure a construct equally across different subgroups, must be established to ensure the BESS SF does not have gender, racial/ethnic, and/or cultural biases. A systematic review identified that several child and adolescent self-report measures of psychopathology fail to demonstrate measurement invariance across cultures, particularly those measuring social, emotional, and behavioral problems (Stevanovic et al., 2017). Previous invariance research on the prior version of the BESS SF focused on high school students and demonstrated measurement invariance by race/ethnicity (Harrell-Williams et al., 2015) and partial metric and scalar invariance by gender (Kim & Kamphaus, 2018). However, without establishing measurement invariance for the latest BESS SF among other age groups, school psychologists may be unable to compare behavioral and emotional risk scores across groups.
Our study expands prior findings by testing for the best-fitting factor structure of the new BESS SF among a sample of fourth- through eighth-grade students. We also build upon extant literature by including the miscellaneous school-related items in the factor structure of the BESS SF, which are used to calculate the global risk score and had prior support for inclusion in the factor structure of the previous BESS SF (Dowdy et al., 2011). Although these school-related behavioral and emotional risk items are not a subscale available in the scoring software, these items provide useful information for school psychologists’ interpretation of behavioral and emotional risk within the school environment. For example, students with emotional and behavioral disorders are significantly more likely to have lower perceptions of school climate (Salle et al., 2018). Despite the predictive utility of BESS SF global risk scores on student outcomes (King et al., 2012), behavioral symptoms that contribute to elevations in global risk may differ across respondents. For example, one student may have higher risk due to elevated internalizing risk whereas another student may have higher risk due to elevated self-regulation risk. Therefore, prior studies have supported modeling previous versions of the BESS SF using a bifactor structure, as this structure accounts for both global risk and underlying sources of risk (Dowdy et al., 2011; Naser et al., 2018b). Even with empirical support for modeling the BESS SF using a bifactor structure, few studies have tested the factor structure of the BESS SF including miscellaneous school-related items as a latent construct. Therefore, identifying the best-fitting structure including these items is necessary to improve interpretation of these school-related risk items in tandem with the primary factors (i.e., internalizing, self-regulation, personal adjustment). In addition, specifying a theoretically supported, well-fitting model is needed before conducting invariance analyses (Van de Schoot et al., 2012).
The Current Study
In this study, we first identified the best-fitting factor structure of the latest BESS SF by testing competing models and tested measurement invariance across race/ethnicity, gender, and school using the best-fitting factor structure. Considering previous empirical support on the previous BASC-2 BESS SF for using a bifactor structure compared with other competing models (Dowdy et al., 2011; Naser et al., 2018b), we hypothesized that the bifactor model would provide the best fit compared with a non-hierarchical four-factor model and a second-order hierarchical model (Hypothesis 1). Next, as studies on the previous BESS SF (Harrell-Williams et al., 2015; Kim & Kamphaus, 2018) supported full and partial invariance across race/ethnicity and gender, respectively, we also expected the latest BESS SF to be invariant across White, Black, and Latinx students and across boys and girls (Hypotheses 2 and 3). Finally, we tested invariance across schools and expected invariance given the schools in our sample are all urban public schools in the same midwestern state (Hypothesis 4).
Method
Participants and Procedures
This study used archival data collected from prior BESS SF administrations to 737 U.S. elementary (i.e., fourth and fifth grades; n = 290) and middle school (i.e., sixth through eighth grades; n = 447) students at three separate urban schools in northeast Ohio. During the fall semesters between 2016 and 2018, schools administered the BESS SF for schoolwide screening purposes. Schools provided the authors a de-identified archival dataset with student ID numbers and race/ethnicity data for 601 students. When preparing the final dataset, we omitted duplicate students that could emerge when students happened to be tested twice in different years and included only the first BESS SF administration in analyses. As schools were unable to provide race/ethnicity data for all students in our sample, we conducted independent-samples t tests to determine whether behavioral and emotional risk scores differed between students with race/ethnicity data and those without. Results indicated there were no significant differences in risk scores across each subscale between students with race/ethnicity data and those without, ts(733–734) = −0.07 to 0.58, ps = .09–.78. All three schools shared similar characteristics as urban schools representing students diverse in socioeconomic status (i.e., high- and low-income families) and race/ethnicity. Most respondents identified as female (n = 381; 51.7%) and identified as White (34.6%), African American/Black (27.5%), Hispanic/Latinx (19.3%), Multiracial (15.8%), and Asian or Pacific Islander (2.8%). All demographic information is presented in Table 1. This study was exempt from review by the university’s Institutional Review Board.
Student Demographics by School for Study Participants.

Age did not differ by gender, t(735) = 1.91, p = .091. bGender distribution did not differ by race/ethnicity, with the exception of more girls (88%) than boys (12%) in the Asian/Pacific Islander ethnic group. cAll socioeconomic descriptive data are based on publicly available information for zip codes serving the schools and are presented to contextualize each school’s population. dPer estimates by schooldigger.com, academic year 2018–2019. eAs this is an independent school, estimates were provided by the school website, academic year 2020–2021. fPer estimates by National Center for Education Statistics, academic year 2018–2019.
Measure
The BESS SF is a 28-item universal screener used to assess behavioral and emotional risk among children and adolescents, ages 8 to 18 years 11 months (Reynolds & Kamphaus, 2015). The BESS SF is normed on a nationally representative sample, provides a global risk score, and is comprised of three scored subindices—internalizing risk, self-regulation risk, and personal adjustment risk—and a series of miscellaneous school-related behavioral and emotional risk items. Respondents rate items (e.g., “I have trouble sitting still,” “I get blamed for things I can’t help”) on a 4-point Likert-type scale from 1 (never) to 4 (almost always). Total raw scores are then converted to t-scores. Higher t-scores indicate greater behavioral and emotional risk and ranges of these t-scores are classified into three behavioral and emotional risk categories (i.e., 20–60 = normal risk, 61–70 = elevated risk, 71+ = extremely elevated risk; Kamphaus & Reynolds, 2007). Prior research on the BESS SF evidenced high internal consistency (α = .93–.94) and test–retest reliability (.88), as well as strong concurrent and predictive validity with measures of school climate (Naser & Dever, 2020; Reynolds & Kamphaus, 2015).
Data Analysis
First, positively worded items were reverse coded. Then, a series of confirmatory factor analysis (CFA) models were fit using Mplus, Version 8.4, specifying all items as ordered categorical (L. K. Muthén & Muthén, 2021). Research on the previous BESS SF determined a bifactor model provides the best model fit (Naser et al., 2018b). Therefore, this study compared the bifactor model (Model 1) with two competing models: a non-hierarchical four-factor model (Model 2) and a second-order hierarchical model (Model 3). Model 1 (i.e., bifactor model) has all items load on a general behavioral and emotional risk factor and also load on one of four factors (i.e., internalizing, self-regulation, personal adjustment, school problems; see Table 2). Items in Model 2 load on a four-factor structure without a general factor, whereas Model 3 has items loading on a four-factor structure of behavioral and emotional risk, with the latent factors explained by a second-order overall behavioral and emotional risk factor.
Standardized Factor Loadings for Bifactor Measurement Model of BASC-3 BESS SF.
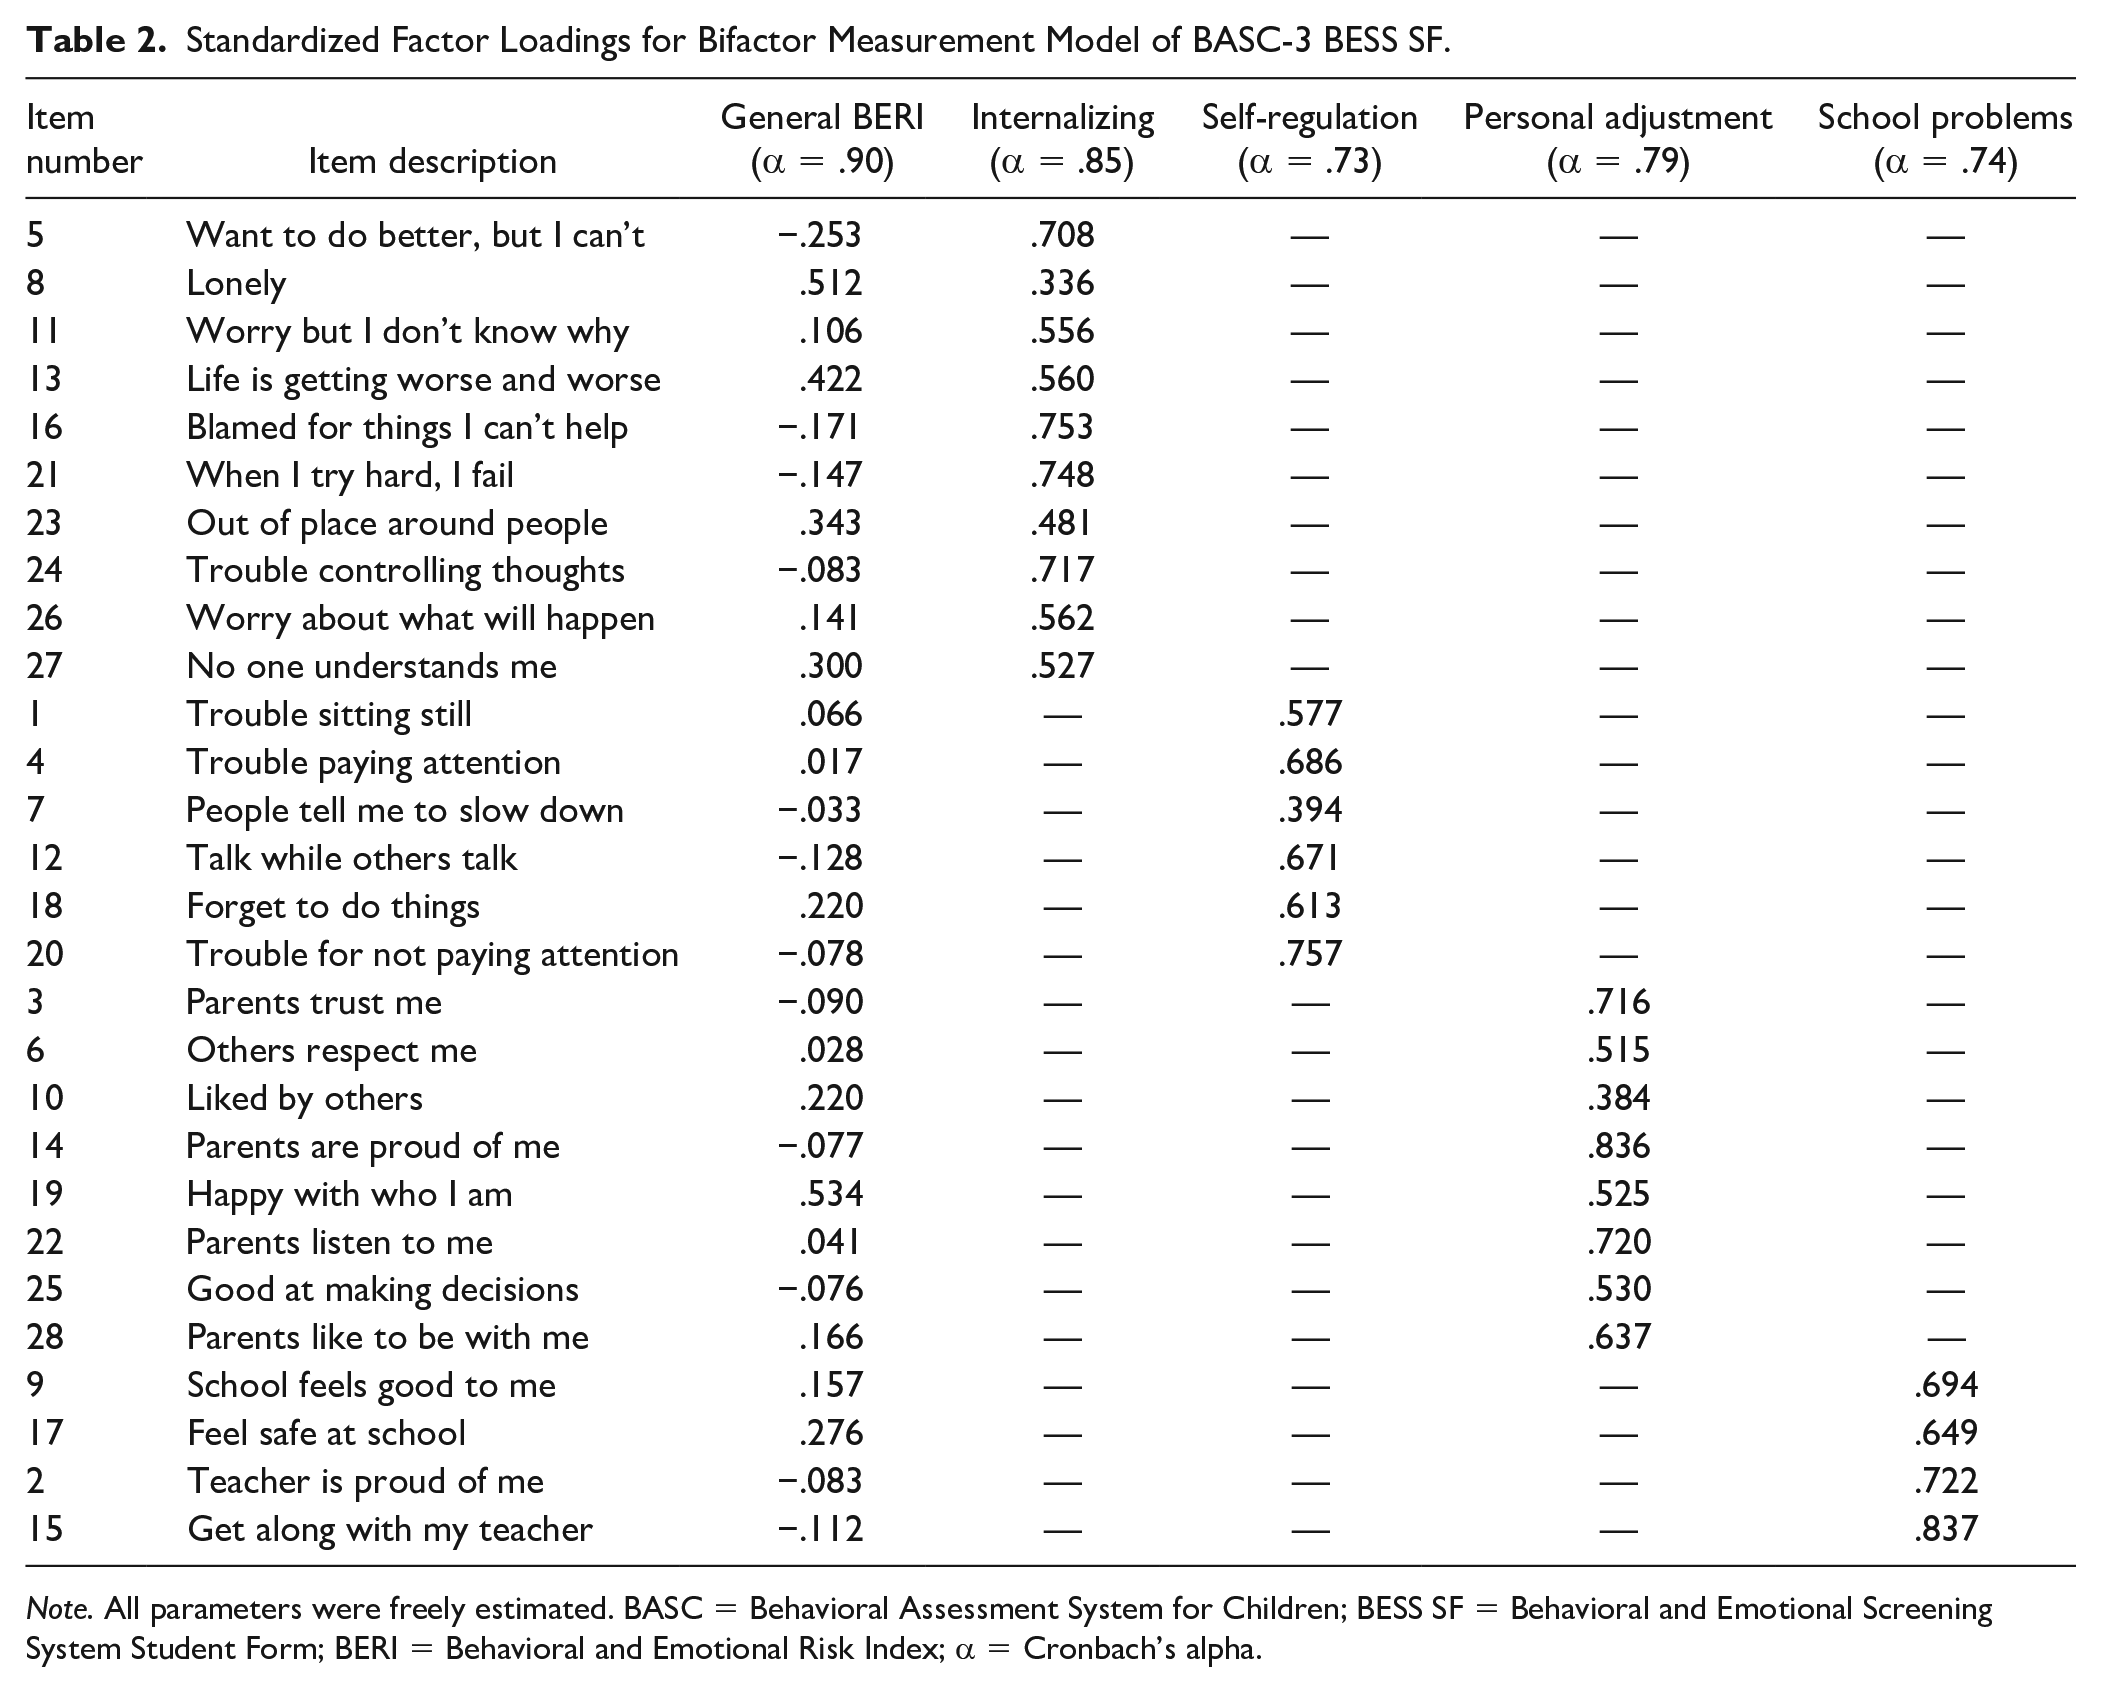
Note. All parameters were freely estimated. BASC = Behavioral Assessment System for Children; BESS SF = Behavioral and Emotional Screening System Student Form; BERI = Behavioral and Emotional Risk Index; α = Cronbach’s alpha.
As items were treated as ordered categorical, robust weighted least squares mean and variance-adjusted (WLSMV) estimation was used to estimate these models. The WLSMV estimator provides mean- and variance-adjusted chi-square test statistics appropriate for ordinal data. We used the chi-square test of model fit value to assess overall model fit (i.e., significant chi-square indicates poor-fitting model). Additional model fit indices were also examined including the root mean square error of approximation (RMSEA), comparative fit index (CFI), and Tucker–Lewis index (TLI). An RMSEA value ≤0.05 and CFI and TLI values above 0.95 indicate good model fit; however, RMSEA values ≤0.08 and CFI and TLI values above 0.90 evidence acceptable model fit (Brown, 2015). We compared these fit indices among the three models to determine the best-fitting model.
Once the best-fitting model was determined, measurement invariance analyses were completed following steps outlined by B. Muthén and Asparouhov (2002) for invariance using ordinal data. First, all models were fit for groups to be examined in the measurement invariance (i.e., girls and boys for gender invariance; White, Black, and Latinx for race/ethnicity invariance; each of the three schools for school invariance). Then, we compared an unconstrained (i.e., configural) with a constrained (i.e., scalar or strong invariance) model to test for measurement invariance by race/ethnicity, gender, and school. Model fit change scores were calculated by subtracting fit indices of the constrained model from the unconstrained model. In the unconstrained model, factor loadings and thresholds varied across groups (e.g., boys, girls) with factor variances fixed at one and factor means fixed at zero in three separate analyses (i.e., race/ethnicity, gender, school). Within the constrained model, factor loadings and thresholds were constrained to be equal across groups (e.g., boys, girls). When estimating these models with ordinal data, the factor loadings and thresholds are constrained in the same step rather than individually as both parameters influence the item probability curve simultaneously (L. K. Muthén & Muthén, 2021). The unconstrained and constrained models were compared based on chi-square difference tests using DIFFTEST. The DIFFTEST option is used with the WLSMV estimator to appropriately compare differences in the mean- and variance-adjusted chi-squares among models. Due to these adjustments made by the WLSMV estimator, the chi-square difference is not distributed as a chi-square. Therefore, the DIFFTEST option is a two-step process that (a) saves the derivatives of the unconstrained model needed for a chi-square difference test, and then (b) computes the chi-square difference comparing the unconstrained model and constrained model (L. K. Muthén & Muthén, 2021). This option in Mplus provides an estimate of chi-square difference test comparing the least restrictive model (i.e., unconstrained) to a model with more restrictions (i.e., constrained), rather than a simple difference test. A statistically significant p value (p < .05) indicates that the unconstrained model results in a significant improvement in fit. However, as the chi-square can be influenced by large sample sizes, such as ours, and thus can detect even minor improvements in model fit, we also examined whether freeing parameters improved model fit. If freeing parameters improved the overall model fit by at least 0.01 on the CFI and TLI and 0.015 on the RMSEA, the invariance assumption was rejected (Cheung & Rensvold, 2002).
Results
Among the final sample of respondents with race/ethnicity data, missing value analysis indicated the maximum percentage of BESS SF items missing was 1.1%. We used listwise deletion to handle missing data. Only three race/ethnicity categories had sufficient sample sizes for running invariance analyses per Meade (2005): White (n = 208), Black (n = 165), and Latinx (n = 116). For Items 3, 14, 15, and 28, there was insufficient representation of response Category 4 (almost always) across racial/ethnic categories. Specifically, no Latinx students selected Category 4 on Item 15, no Black students selected Category 4 on Item 3, and no students at School 1 selected Category 4 on Items 14 and 28. Due to the infrequent endorsement of Response Category 4, and because these zero frequencies create estimation problems using the WLSMV estimator, responses to Category 4 were collapsed into response Category 3 (often) across these four items. We also examined the item characteristic curves (ICCs) of individual items, which indicate the probability of selecting a response option. As all response options were monotonically increasing and otherwise of sufficient use, the remaining 4-point ordinal scales were retained for subsequent analyses.
To test our first hypothesis, a series of categorical CFAs using WLSMV estimation were computed for each model (see Table 3). Items that represented similar forms of behavioral and emotional risk (i.e., “I am liked by others” and “Others have respect for me”) were covaried across all models due to significantly high modification indices values (modification indices = 204.82, expected parameter change = 0.41), a significant correlation between the two items (r = .39, p < .05), and improvement in model fit after covarying these items. The bifactor model (Model 1) fit the data well and was retained for subsequent analyses (RMSEA = 0.055, TLI = 0.931, CFI = 0.942). The hierarchical model (Model 2) poorly fit the data based on absolute fit statistics (RMSEA = 0.143) and the four-factor model (Model 3) had acceptable absolute model fit (RMSEA = 0.075) but poor comparative and non-normed fit (CFI = 0.884, TLI = 0.872). Individual items, factor loadings, and factor internal consistency values are presented in Table 2.
Fit Indices and Tests of Measurement Invariance for Competing Models of BASC-3 BESS SF (N = 737).
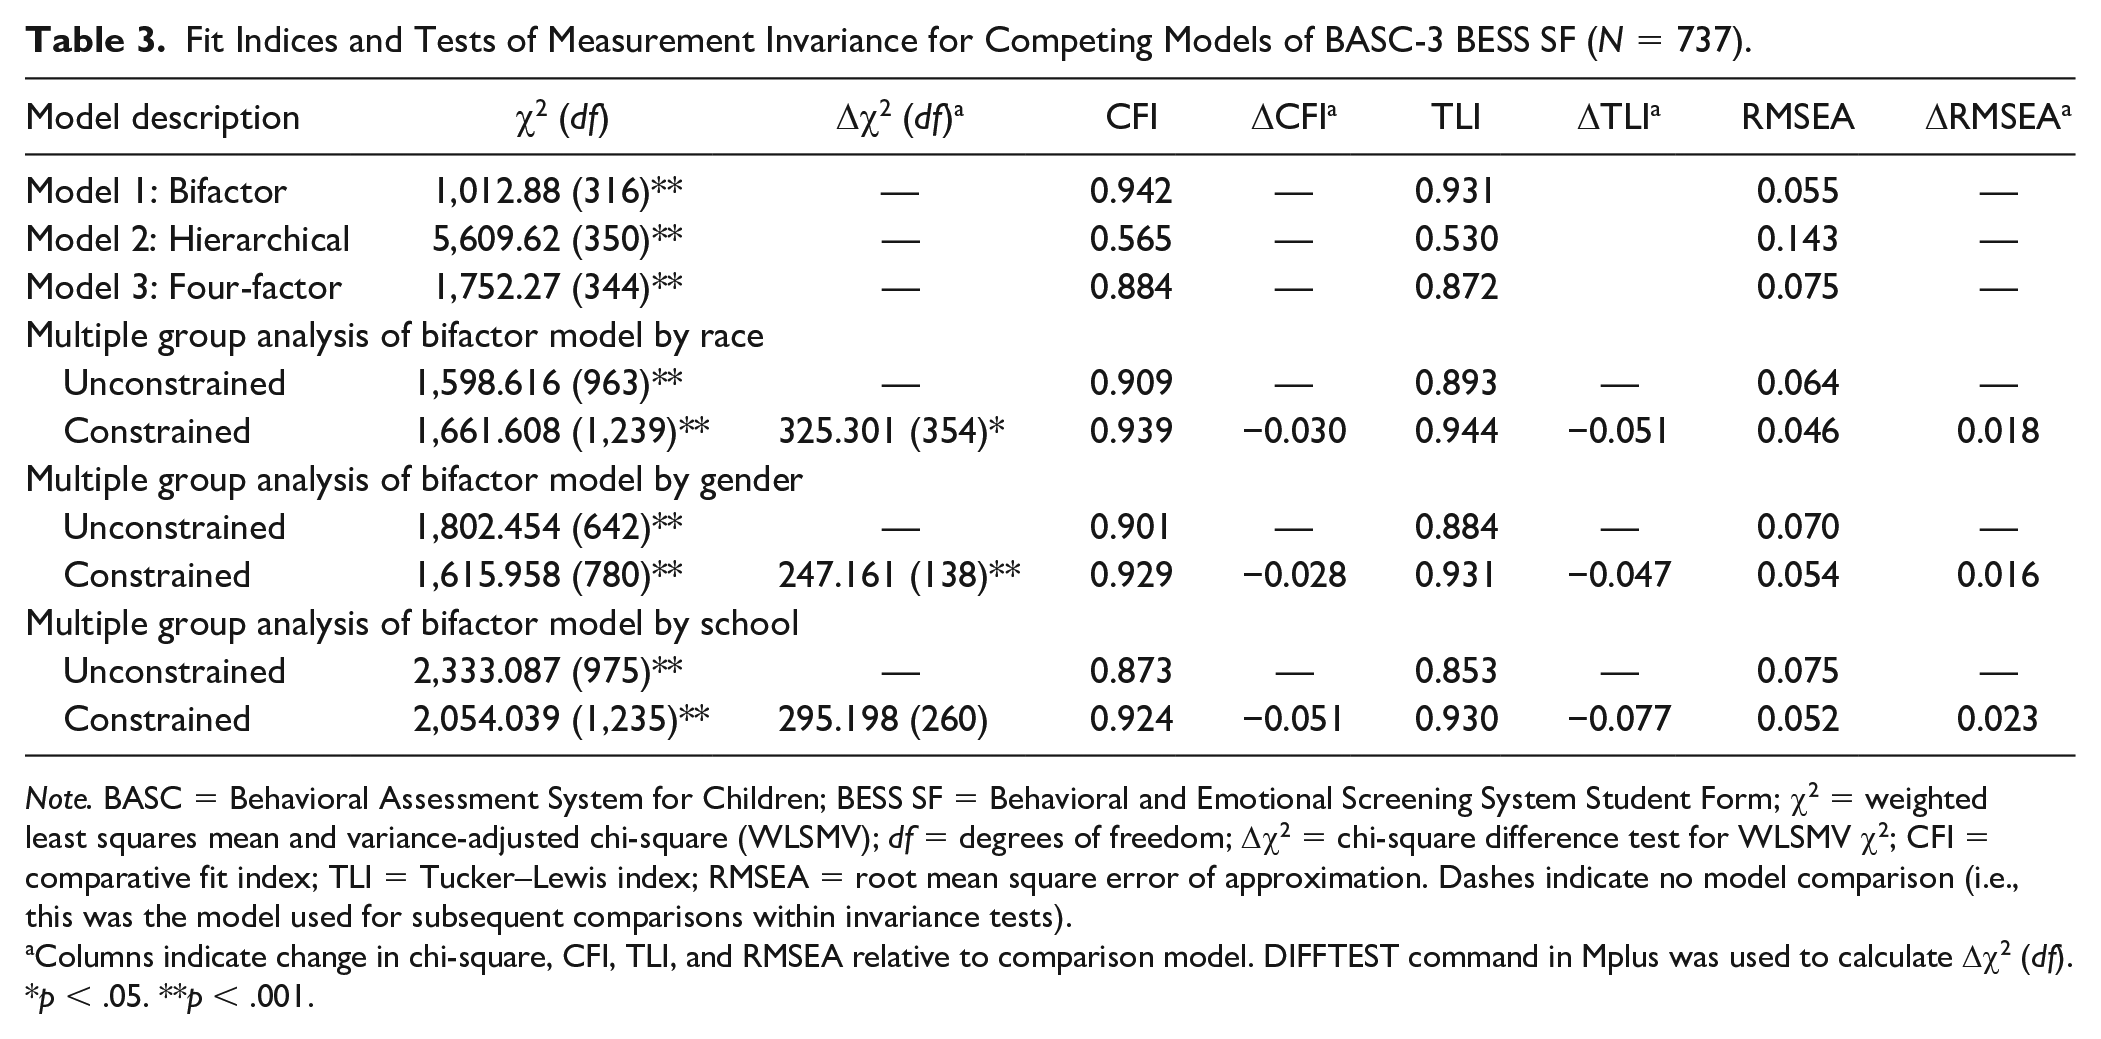
Note. BASC = Behavioral Assessment System for Children; BESS SF = Behavioral and Emotional Screening System Student Form; χ2 = weighted least squares mean and variance-adjusted chi-square (WLSMV); df = degrees of freedom; Δχ2 = chi-square difference test for WLSMV χ2; CFI = comparative fit index; TLI = Tucker–Lewis index; RMSEA = root mean square error of approximation. Dashes indicate no model comparison (i.e., this was the model used for subsequent comparisons within invariance tests).
Columns indicate change in chi-square, CFI, TLI, and RMSEA relative to comparison model. DIFFTEST command in Mplus was used to calculate Δχ2 (df).
p < .05. **p < .001.
The bifactor structure was individually tested and evidenced acceptable fit among subgroups across race/ethnicity (i.e., RMSEAs = 0.04–0.05, CFIs = 0.93–0.96, TLIs = 0.91–0.96), gender (i.e., RMSEA = 0.05, CFIs = 0.94–0.95, TLIs = 0.92–0.95), and school (i.e., RMSEAs = 0.05–0.06, CFIs = 0.93–0.95, TLIs = 0.92–0.94). Measurement invariance by race/ethnicity (Hypothesis 2), gender (Hypothesis 3), and school (Hypothesis 4) was tested using multigroup categorical CFA with the bifactor model (see Table 3). For race/ethnicity, the unconstrained model (i.e., configural) displayed acceptable model fit (CFI = 0.909, TLI = 0.893, RMSEA = 0.064). When constraints were imposed on the loadings and thresholds across races/ethnicities (i.e., scalar), model fit improved (ΔCFI = −0.030, ΔTLI = −0.051, ΔRMSEA = 0.018). Across gender, the unconstrained model also acceptably fit the data (CFI = 0.901, TLI = 0.884, RMSEA = 0.070) and constraining the factor loadings and thresholds across genders showed improved model fit (ΔCFI = −0.028, ΔTLI = −0.047, ΔRMSEA = 0.016). To rule out measurement variability between schools, we tested for invariance across schools. For school, the unconstrained model evidenced acceptable absolute fit (RMSEA = 0.075) and poor comparative and non-normed fit (CFI = 0.873, TLI = 0.853), but the constrained model improved model fit (ΔCFI = −0.051, ΔTLI = −0.077, ΔRMSEA = 0.023). Consistent with our hypotheses, these findings support measurement equivalence for boys and girls and among White, Black, and Latinx fourth- to eighth-grade students attending urban schools.
Discussion
Our findings support using the latest BESS SF to identify diverse at-risk students. By allowing students to self-report their risk levels via screeners such as the BESS SF, school psychologists can identify students at behavioral and emotional risk directly from the source, which is especially important considering the racial/ethnic and gender biases associated with relying on other informants (e.g., teachers, parents) to gauge a child’s risk level. These results support the efficacy of using the BESS SF to detect behavioral and emotional risk without the gender and racial/ethnic biases that often accompany relying solely on outside informants. By reducing the influence of gender and racial/ethnic biases, BESS SF risk scores can be more confidently interpreted and compared across gender and race/ethnicity. Moreover, as teachers are more likely to identify students with externalizing compared with internalizing symptoms (Splett et al., 2019), this self-report screener can comprehensively assess students’ social, emotional, and behavioral risk. Students’ global risk scores on the BESS SF can provide schools with an early indication of their overall risk and their scores on each risk subscales can help schools determine what school supports best fit the students’ needs. These scores on the BESS SF can then be used to link at-risk students to appropriate interventions based on their risk level while being less likely to lead to disproportionate over-referrals of male and racial/ethnic minority students.
Consistent with prior research on the factor structure of its predecessor (Naser et al., 2018b), among a diverse sample of fourth- to eighth-grade students, these findings also supported the bifactor solution for the BESS SF as the best-fitting model. In practice, the general risk score is the most salient indicator of behavioral and emotional risk and the subscales are used to potentially inform the type of risk. A supported bifactor structure supports the existence of these subscales as uniquely interpretable information in addition to the general risk factor. In contrast with the previous study, we estimated these models with ordered categorical indicators, rather than as continuous items. This suggests that student responses to the BESS SF may be best modeled as ordered categorical, which is supported by previous guidance to use categorical estimation for measures with fewer than five response categories (Rhemtulla et al., 2012).
In addition, as school psychologists often use the miscellaneous school-related risk items for further examination of behavioral and emotional risk, we extended prior findings by supporting an invariant factor structure across race/ethnicity and gender using these items as a unique factor. Often these miscellaneous school-related risk items are portrayed as less informative given their lack of inclusion in BESS SF scoring software; however, our findings support the stability of this factor across race/ethnicity and gender. Given the associations between perceptions of school climate and behavioral and emotional risk (Salle et al., 2018), these items provide novel information not assessed by the other primary factors. Therefore, school psychologists can more confidently use all items of the BESS SF, including the school-related risk items, among diverse elementary and middle school students.
Despite the relatively large sample size, we found that specific demographic groups did not select certain response categories for some items. For example, no Latinx student reported that they “almost always” get along with their teacher. In addition, zero Black students responded with “almost always” when rating whether their parents trust them. These findings indicate that Black and Latinx students may, respectively, perceive these items differently than their peers with other racial/ethnic identities. More research is needed to understand what underlies these differences. Furthermore, future iterations of the BESS SF should consider these differing response patterns when labeling response categories to ensure more inclusive and accurate assessment of behavioral and emotional risk. Our findings should be replicated to determine whether these behaviors are less frequently occurring or observed among racial/ethnic subgroups. If our findings are consistently replicated, the next BESS SF should consider three response categories rather than four. Beyond this, results indicate that the factor structure of the latest BESS SF was invariant across White, Black, and Latinx students, which replicates prior psychometric evidence with the previous BESS SF (Harrell-Williams et al., 2015).
Limitations and Future Directions
These analyses did not represent students of all racial, ethnic, and gender identities, nor were they representative of students who attend schools in suburban or rural areas. More research is needed to determine whether the BESS SF is invariant across students of other racial (e.g., Multiracial, Asian) and ethnic (e.g., Middle Eastern, North African) identities, as well as across diverse gender identities and experiences (e.g., genderqueer, non-binary, transgender). Future replication of these findings among larger samples is needed, as results could change with larger subgroup samples (Meade, 2005). Another limitation of this study was the substantial amount of missing student race/ethnicity data (i.e., 18.5%) in the larger sample. It is possible that there was variability by race/ethnicity we did not measure by omitting these students from analyses. In addition, replicating these findings would be beneficial to verify that these results are not school-specific. As there were items that needed to be covaried due to their similar nature, researchers should independently verify whether these items are indeed considered similar among children and youth using strategies such as cognitive interviewing. Finally, as this study used cross-sectional data from similar schools in one midwestern state, future research should assess for measurement invariance of the BESS SF among students attending nationally representative urban, rural, and suburban schools and using longitudinal data.
Conclusion
This study provides further evidence that the latest BESS SF assesses behavioral and emotional risk among elementary and middle school students with reduced racial/ethnic, gender, and school biases. Using this tool, school psychologists can more confidently compare risk scores across Black, White, and Latinx male and female students. These screening results can be used to detect students at behavioral and emotional risk and ultimately link them to appropriate interventions without the biases that accompany traditional methods of socioemotional risk assessment. Notably, these findings do not refute the utility of multi-informant assessment approaches, as considering teacher and parent perspectives are likely more informative than relying solely on child self-report when conducting universal screening (von der Embse et al., 2019). Although our findings support invariance, further research is needed on the latest BESS SF to identify factors that may underlie the differing response patterns across racial/ethnic groups that were identified in this study. Even still, this investigation of the psychometric properties of a widely used school-based social, emotional, and behavioral health screener provides a more accurate picture of what this tool can tell us and how screening results from this tool can inform programming.
Footnotes
Declaration of Conflicting Interests
The author(s) declared no potential conflicts of interest with respect to the research, authorship, and/or publication of this article.
Funding
The author(s) received no financial support for the research, authorship, and/or publication of this article.