
Abstract
Tristetraprolin (TTP) is an RNA-binding protein which downregulates multiple cytokines that mediate progression of head and neck squamous cell carcinoma (HNSCC). We previously showed that HNSCC cells with shRNA-mediated knockdown of TTP are more invasive than controls. In this study, we use control and TTP-deficient cells to present a novel subsurface non-linear optical molecular imaging method using a three-dimensional (3D) organotypic construct, and compare the live cell imaging data to histology of fixed tissue specimens. This manuscript describes how to prepare and image the novel organotypic system that closely mimics HNSCC in a clinical setting. The oral cancer equivalent (OCE) system allows HNSCC cells to stratify and invade beyond the basement membrane into underlying connective tissue prepared from decellularized human dermal tissue. The OCE model was inspired by tissue engineering strategies to prepare autologous transplants from human keratinocytes. Advantages of this method over previously used in vitro cancer models include the simulation of the basement membrane and complex connective tissue in the construct, in addition to the ability to track the 3D movement of live invading cells and quantify matrix destruction over time. The OCE model and novel live cell imaging strategy may be applied to study other types of 3D tissue constructs.
Introduction
Head and neck cancer is the sixth most common cancer globally, affecting about 600,000 individuals per year. 1 Over 90% of the lesions are head and neck squamous cell carcinomas (HNSCC). New treatments are required since current regimens have not improved survival in over five decades. Due to the complexity of the many structures and tissues involved in HNSCC progression, researchers struggle to accurately replicate the disease process in an in vitro setting. Development of models that more closely simulate human HNSCC will enhance translation of preclinical studies into successful novel-targeted therapies.
Invasion of transformed epithelial cells beyond the basement membrane and into the connective tissue is the defining event that differentiates precancerous oral lesions from HNSCC. The basement membrane separates epithelial cells from the underlying connective tissue and is identified histologically by expression of collagen IV. 2 Destruction of the basement membrane and invasion with subsequent regional spread and distant metastases contribute to the lethality of HNSCC. Since invasion is the key event of tumour progression, a sophisticated model that replicates the basement membrane and connective tissue stroma is necessary to study invasion in HNSCC and many other cancers.
To address the limitations of existing in vitro models of invasion, our laboratory developed the oral cancer equivalent (OCE) model using human HNSCC cells and human connective tissue. Recent advances in tissue engineering have provided xenografts or autologous grafts for humans based on stratification of keratinocytes on human decellularized cadaveric dermis.
3
To facilitate studies on the invasive phenotype of HNSCC, we adapted the procedure for creating normal oral tissue grafts to generate the OCE. In the adapted protocol, decellularized human dermal tissue is coated with collagen IV and seeded with human HNSCC cells, which are allowed to stratify and invade. This novel in vitro model simulates invasion of human HNSCC including the complexity of connective tissue and the histopathology. Figure 1(a) shows a HNSCC lesion that presented as a leukoplakia (white patch) on the lateral surface of the tongue. Figure 1(b) shows a similar ‘clinical’ appearance of the OCE construct. In both Figure 1(c),(d), arrows indicate invading cells and arrowheads highlight the location of the basement membrane on tissue sections of a HNSCC tumour and an OCE construct. The pattern of rete ridge formation and islands of invasive cells in HNSCC (Figure 1c) are closely simulated by invasion of HNSCC cells in the connective tissue stroma of the OCE (Figure 1d).
Histological Comparison of HNSCC and OCE model. A lesion that presented clinically as a leukoplakia was subsequently diagnosed as HNSCC (a). OCE tissue in culture is shown (b). Histology of human HNSCC (c) and of an OCE (d) shows invasion in both specimens. Arrowheads point out the basement membrane and arrows show invading cancer cells. (A color version of this figure is available in the online journal)
In our recent publication describing the role of the RNA-binding protein tristetraprolin (TTP) in HNSCC progression, we used the OCE model to quantify HNSCC invasion. 4 The OCE method allowed us to quantitatively compare invasion of cells with short-hairpin RNA-mediated knockdown of TTP (shTTP) with control cells (treated with scrambled shRNA, shSCR) on fixed tissue sections. Our initial data showed that cells with TTP-knockdown were more invasive than control cells. The analysis in our previous study was limited to quantification of invasive cells in fixed tissue sections at a single timepoint.
In this study, we demonstrate the feasibility of using non-linear optical molecular imaging to image subsurface live cells on the OCE constructs. With this method, green fluorescent protein (GFP)-tagged cells are used for the OCE constructs, and invasion can be traced at multiple timepoints and at multiple locations on the constructs. In addition, decay of the collagen matrix by the cancer cells can be quantified through obtaining a second harmonic generation (SHG) signal from the connective tissue matrix. We used shTTP-treated cells that we previously showed to be more invasive compared to shSCR-treated control cells to validate and optimize the novel imaging method presented in this manuscript. 4 We also compared our live cell imaging results with histological data of fixed tissue sections at multiple time points. Overall, subsurface non-linear optical molecular imaging of the OCE confirmed histological quantification of invasion of fixed tissue sections from OCE constructs. The live cell imaging method provided additional levels of analysis by providing a 3D view of cells interacting with the connective tissue matrix in addition to quantification of collagen decay on the OCE constructs.
Materials and methods
Overview of the OCE method
The overview of the OCE protocol is shown (Figure 2). Circular fragments of decellularized human dermis were hydrated and coated with human collagen IV. Cells expressing GFP were seeded on the tissue and allowed to stratify over several days. Invasion of cancer cells and decay of connective tissue matrix were observed and quantified using subsurface non-linear optical microscopic molecular imaging over two days, after which the constructs were fixed for histopathological studies.
Overview of OCE Protocol. HNSCC cells are plated on hydrated decellularized human cadaveric tissue coated with collagen IV on day 1. On day 3, the OCE is brought to the liquid–air interface and invasion of HNSCC cells occurs through day 5, when subsurface imaging of live cells is performed. The OCE tissues are then fixed, paraffin-embedded and processed for histopathological and protein expression studies. (A color version of this figure is available in the online journal)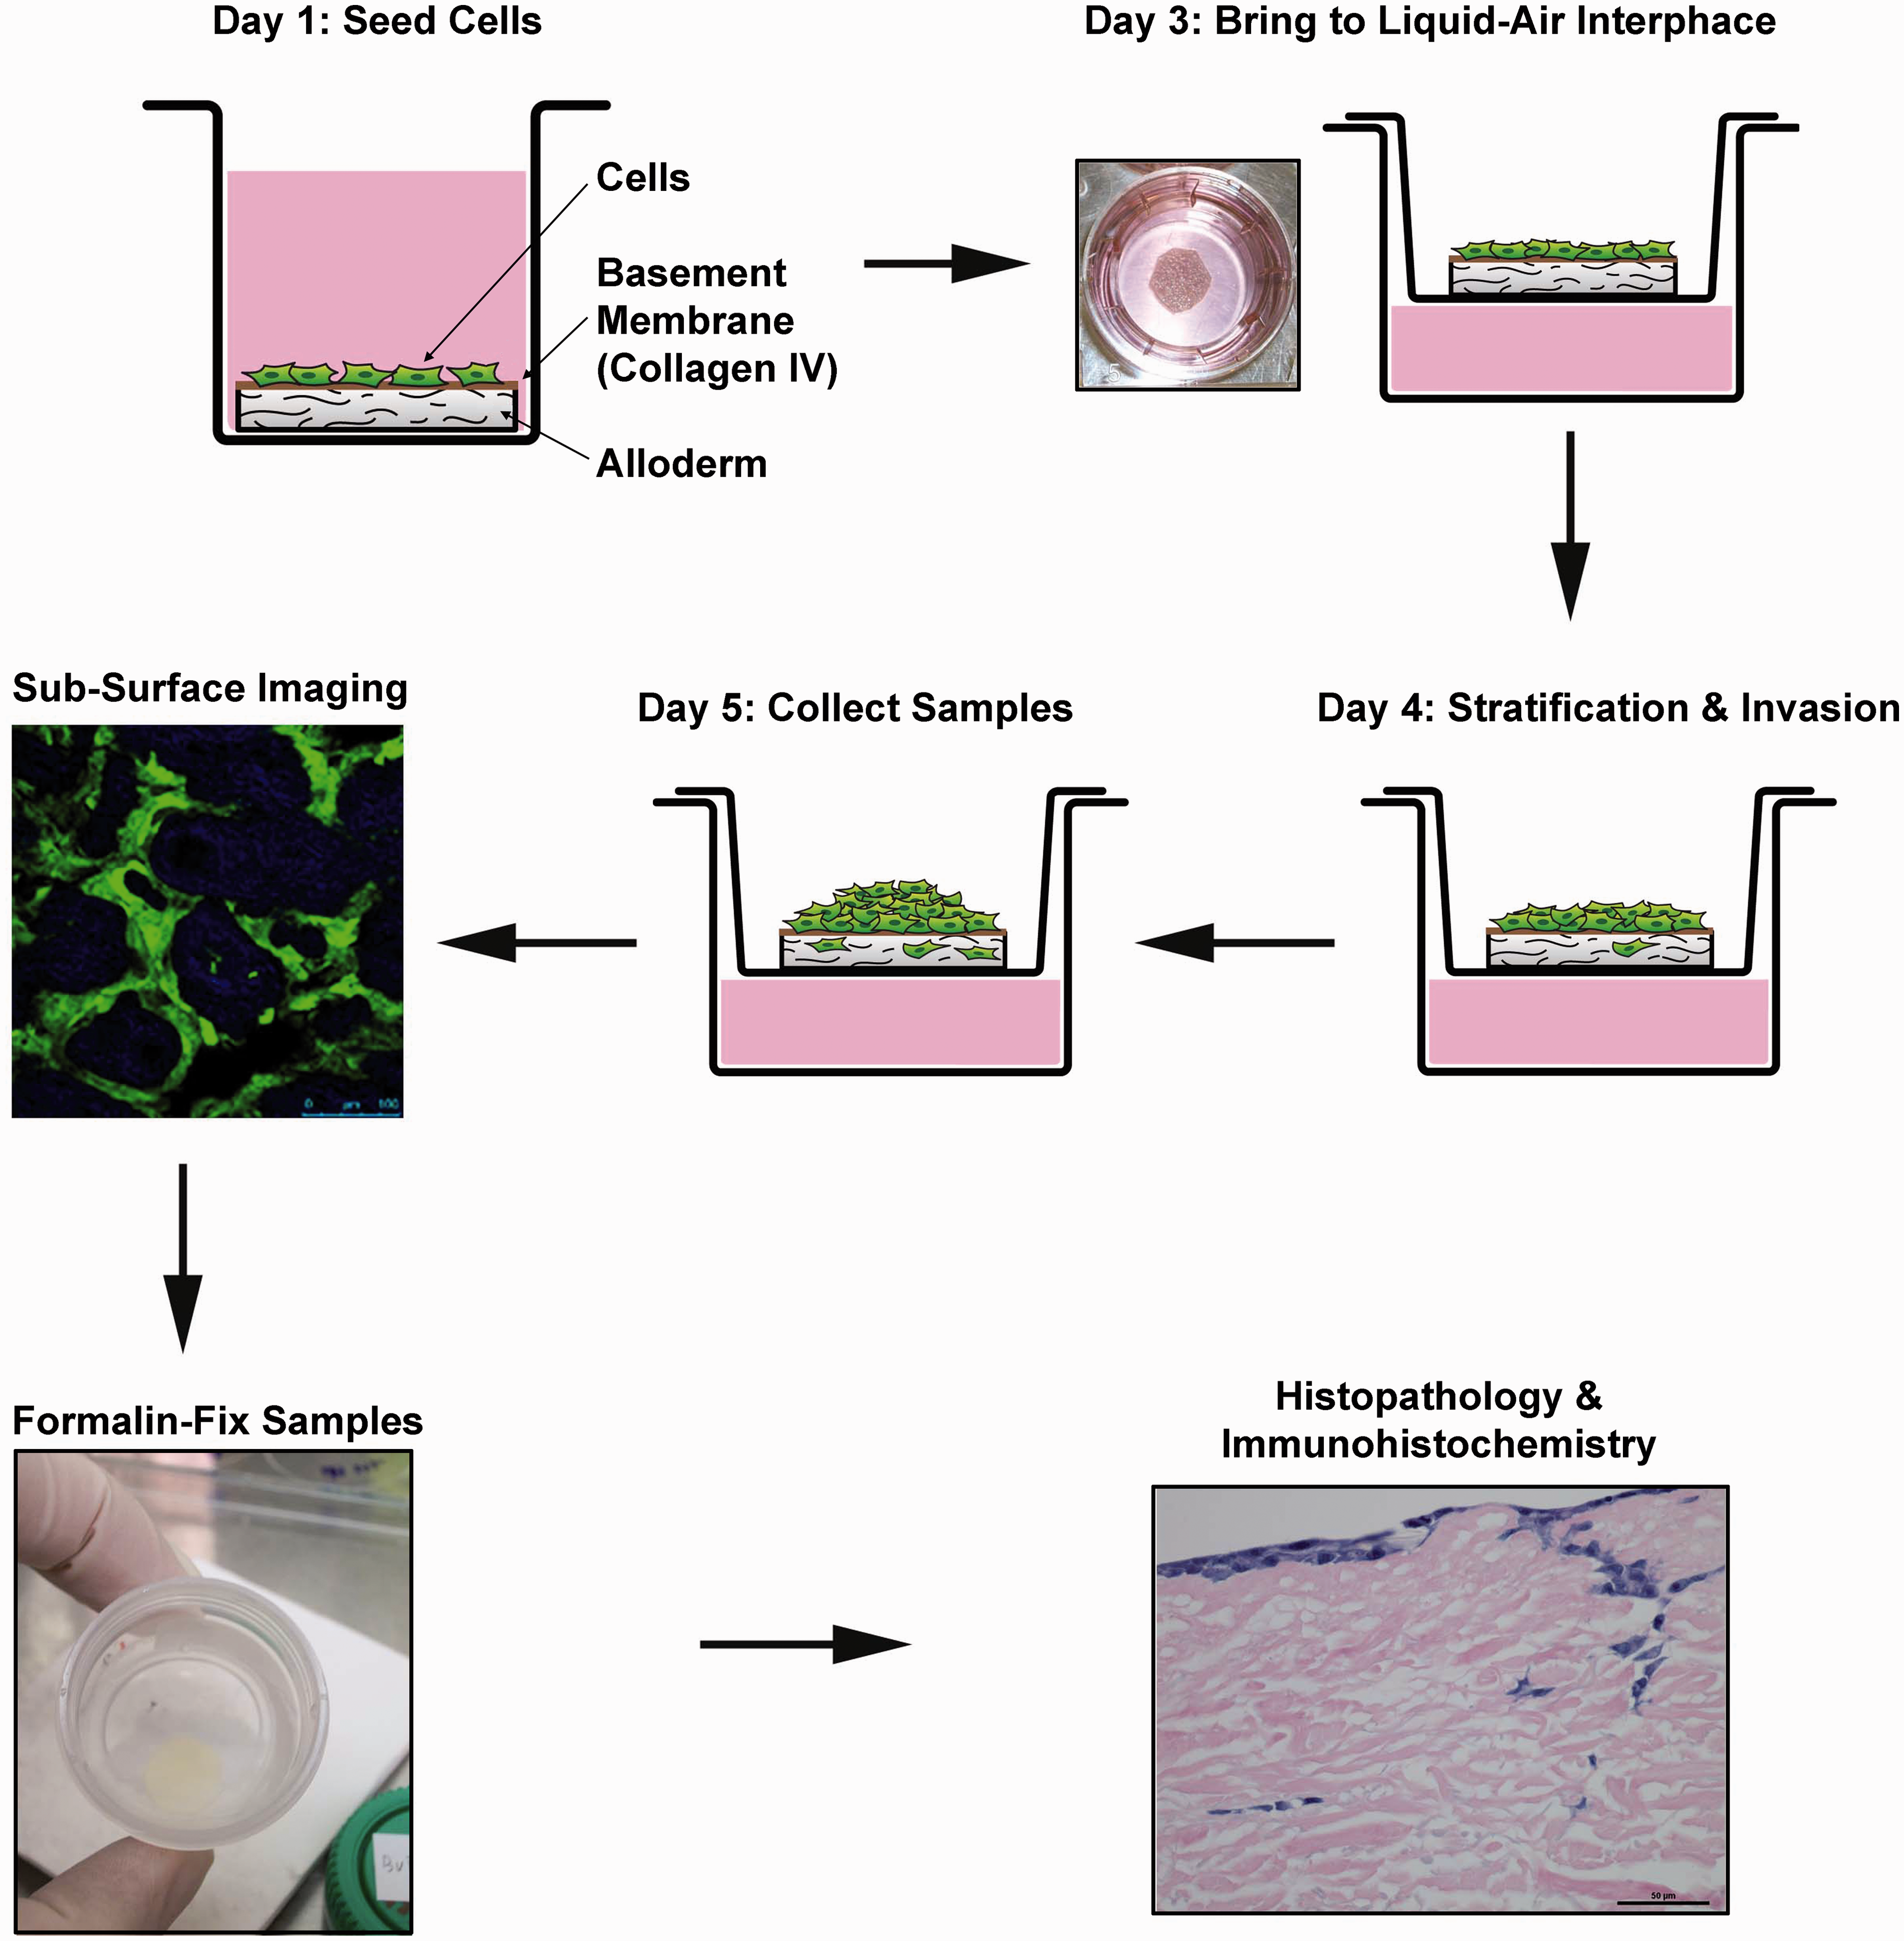
Cell culture
A HNSCC cell line, UM-SCC-1 (from Thomas Carey, University of Michigan), was used for these studies. HNSCC cells were transduced with short hairpin RNA (shRNA) constructs with a vesicular stomatitis virus glycoprotein (VSVG) backbone and a GFP tag in lentiviral particles. A scrambled shRNA (designated shVSVG) was used for the control and shTTP was used for TTP knockdown (Open Biosystems, Catalog No. RHS4430-99139230, Sequence 5′TATTAGAATAAATAAAGTC 3′). UM-SCC-1 cells (35 × 104) were transduced with 1000 multiplicity of infection of control and TTP knockdown vectors in serum-free medium for 3 h prior to adding 10% FBS. Puromycin (10 µg/ml, Santa Cruz Biotechnology, Inc, Dallas, TX, USA) was used to establish stable cell lines over four weeks. Protein knockdown was confirmed by immunoblot analysis.
Preparation of human dermal tissue
Decellularized dermal tissue (AlloDerm®, LifeCell Corporation, Branchburg, NJ, USA) was cut into disks that fit into the individual wells of a 48-well plate. Dermal tissue was placed in a 100 mm cell culture dish and rehydrated with 15 mL Dulbecco’s phosphate-buffered saline (DPBS, Invitrogen, Grand Island, NY, USA), which was changed every 15 min for 90 min. Forceps were used to aseptically remove the dermal tissue from its commercial packaging. The tissue was gently rinsed with DPBS to determine orientation of the tissue (DPBS added to the epidermal side with the basement membrane easily drains off of the tissue, whereas DPBS added to the dermal side is retained). The dermal tissue was transferred, epidermal side facing up, into a well of the 48-well microplate. The tissue was gently pressed into the microwell plate to ensure there were no bubbles beneath the tissue. One hundred microlitres of DPBS was added to each of the wells with tissue. Five microlitres of human type IV collagen (Fluka, 5 µg/μl suspended in acetic acid) was added to the middle of the DPBS covering the dermal tissue. Human collagen IV was added to enhance HNSCC cell attachment to the decellularized dermal tissue.5,6 The plate was sealed with Parafilm (BioExpress) and refrigerated overnight at 4℃.
Seeding and cultivating cancer cells on hydrated dermal tissue (day 0)
UM-SCC-1 cells transduced with shVSVG or shTTP were grown to 60% confluence. The 48-well microplate containing hydrated dermal tissue coated with type IV collagen was warmed in a cell culture incubator (37℃, 5% CO2) for 30 min. Five hundred microlitres of complete Dulbecco's Modified Eagle Medium (DMEM) culture media containing 10% fetal bovine serum (FBS) and 1% Pen Strep (10,000 Units/mL Penicillin and 10,000 µg/mL Streptomycin) was added to the wells of the 48-well microplate containing the prepared dermal tissue. The complete media provided the nutrients for the HNSCC cells. The HNSCC cells were seeded onto dermal tissue at a density of 5 × 10⁵ cells in 100 µl of DMEM. Cells were incubated in a cell culture incubator at 37℃ and 5% CO2 for four days, and the medium was changed every two days.
Transferring the OCE to the air–liquid interface (day 5)
Transwell carrier inserts (3.0 µm pore size, Costar, Corning Inc.) were placed in a six-well cell culture dish, and 500 µL of complete DMEM culture medium with 10% FBS and 1% Pen Strep was pipetted below the insert. Using sterile forceps, the OCE constructs were lifted by the edge of the dermal tissue and transferred with the epidermal side facing up onto one of the inserts. The constructs were incubated at 37℃ in a 5% CO2 incubator for two or three days, and the medium in the lower chamber was changed every day.
Non-linear optical microscopic molecular imaging (days 7 and 8)
Instrumentation and data acquisition
Non-linear optical microscopic molecular imaging was performed on a Leica TCS SP5 microscope in epi-illumination mode. The images were collected with a 25 × water immersion objective lens (0.95 NA, 2.5 mm working distance). A tunable Ti:sapphire laser (Mai Tai, Spectra-Physics), providing excitation wavelengths ranging from 690 to 1040 nm, was employed to deliver 100 fs pulses with a 80 MHz repetition rate. A 900 nm excitation wavelength was employed to simultaneously excite GFP fluorescence and collagen SHG. For GFP detection, the emitted fluorescence was coupled through a band pass filter from 475 to 575 nm, and collected with a non-descanned photomultiplier tube positioned in close proximity to the sample to increase collection efficiency. For SHG detection, an internal tunable photomultiplier was tuned with a narrow bandwidth, 440–460 nm, to selectively collect collagen SHG emission. En-face images were acquired with raster scanning in the lateral plane and cross-sectional images were acquired with line scanning in the transverse plane. The scanning speed was 200 lines per second, for a total image acquisition time of approximately 40 s for the entire field-of-view. To reduce background noise, each line was acquired eight times, and averaged. The microscope, laser and image capture were under computer control.
Specimen preparation
OCE specimens were placed on a glass-bottom 35 mm Petri dish, and wet with a few drops of DPBS to preserve cell viability during the imaging procedure. The Petri dish was placed on the microscope, and en-face images were taken at incremental z-steps of either 3, 5 or 10 µm at four sites of the TTP-knockdown assay, and three sites of the control assay. Vertical cross-sectional images were taken at one site for each of the TTP-knockdown constructs and for the control OCE. All measurements were made in less than 1 h after removing specimens from incubation conditions.
Image analysis
Two-photon excited fluorescence images of GFP-expressing cells and SHG images of collagen from the Alloderm® scaffold were pseudo-colored green and blue, respectively, and then merged in 8-bit RGB color format using NIH ImageJ software.
Data analysis
Cell invasion was assessed by using MATLAB software to analyse z-stack en-face SHG channel images to count the number of pixels with intensity values above a certain threshold over the entire field-of-view. The intensity threshold,
Histopathological studies
OCE constructs were fixed overnight in phosphate buffered formalin (Fisher Scientific, Pittsburgh, PA, USA). Hematoxylin and eosin staining was performed on tissue sections prepared from fixed OCE constructs, and invasive areas were identified.
Results
Enhanced invasion of HNSCC cells with TTP knockdown is observed with both subsurface imaging and analysis of fixed samples
Pro-inflammatory mediators, including cytokines and matrix metalloproteinases, contribute to progression of HNSCC.7–9 TTP is an RNA-binding protein that induces decay of multiple pro-inflammatory mediators. 10 We previously showed that downregulation of TTP leads to increased production of pro-inflammatory mediators and increased invasion of cancer cells. 11 In the data presented, HNSCC cells were stably transduced with a shRNA construct to downregulate TTP (shTTP) and a control construct (shVSVG). These cells were used to investigate the subsurface non-linear optical molecular imaging method to monitor invasion on the OCE constructs and compare the results to parallel histopathological analysis.
HNSCC cells stratified to two to four layers, similar to normal keratinocytes, and developed rete ridges (Figure 1d). Invasive islands beyond the basement membrane were observed on hematoxylin and eosin-stained tissue sections. The increased invasion of cells with downregulated TTP was visualized by hematoxylin and eosin staining of paraffin embedded tissues (Figure 3) and cross-sectional non-linear optical microscopic molecular imaging of live cells. Control cells formed a generally uniform layer that sits on the OCE scaffold (Figure 3(a) and Video 1), whereas TTP-knockdown cells invaded below the OCE scaffold, forming nests of GFP-expressing cells beneath the surface of the OCE (see arrow heads in Figure 3(b) and Video 2).
Comparison of OCE histology produced via hematoxylin-eosin staining and non-linear optical microscopic molecular imaging. The vertical cross-sectional image of the OCE with control HNSCC cells (a) shows cells forming a layer on top of the tissue scaffold with little invasion below the surface, whereas the OCE with HNSCC cells with downregulated TTP (b) shows cells invading below the surface, forming nests of cells within the connective tissue. The quality of vertical cross-sectional images is degraded as compared to en-face images, due to the inherent poorer resolution of non-linear optical microscopy in the axial dimension, and scattering effects when imaging deep below the tissue surface. Scale bars = 50 µm. (A color version of this figure is available in the online journal)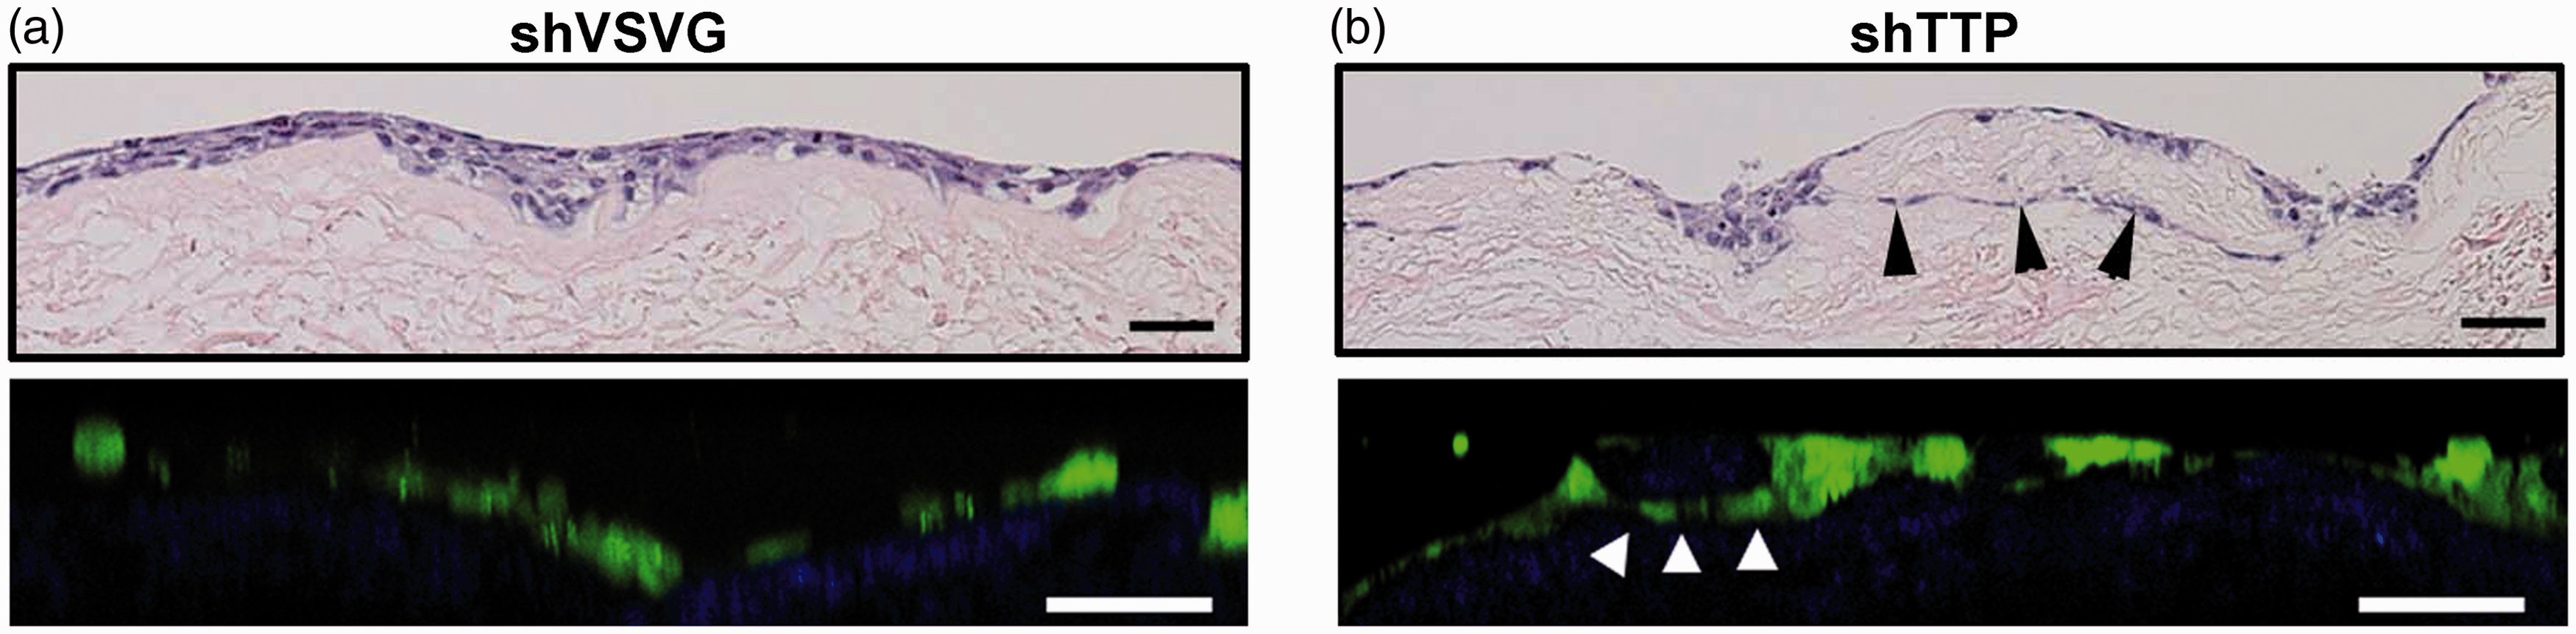
Two photon-excited fluorescence images of GFP-expressing cells and SHG images of collagen from the OCE scaffold were pseudo-colored green and blue, respectively, and then merged in 8-bit RGB color format using NIH Image J software. GFP channel images taken near the surface of the assay show a high number of cells in cell lines with or without downregulation of TTP. At 24 µm, control cells are no longer visible (Video 3) while TTP-knockdown cells are still visualized (Video 4), suggesting increased deeper invasion of the TTP-knockdown cells below the surface of the OCE scaffold. A montage of en-face images of the TTP-knockdown OCE from depth 0 to 24 µm revealed islands of GFP-expressing cells invading below the specimen surface, visualized as circular rings apparent deep under the surface of the OCE up to 24 µm (Figure 4).
En-face image montage of UM-SCC-1-shTTP cells in the OCE at 3 µm depth increments below the surface of the OCE. GFP-expressing cells form strings of cells invading below the surface of the assay, visualized as green rings that are apparent in all en-face images from the surface to a depth of 24 µm. Scale bars = 100 µm. (A color version of this figure is available in the online journal)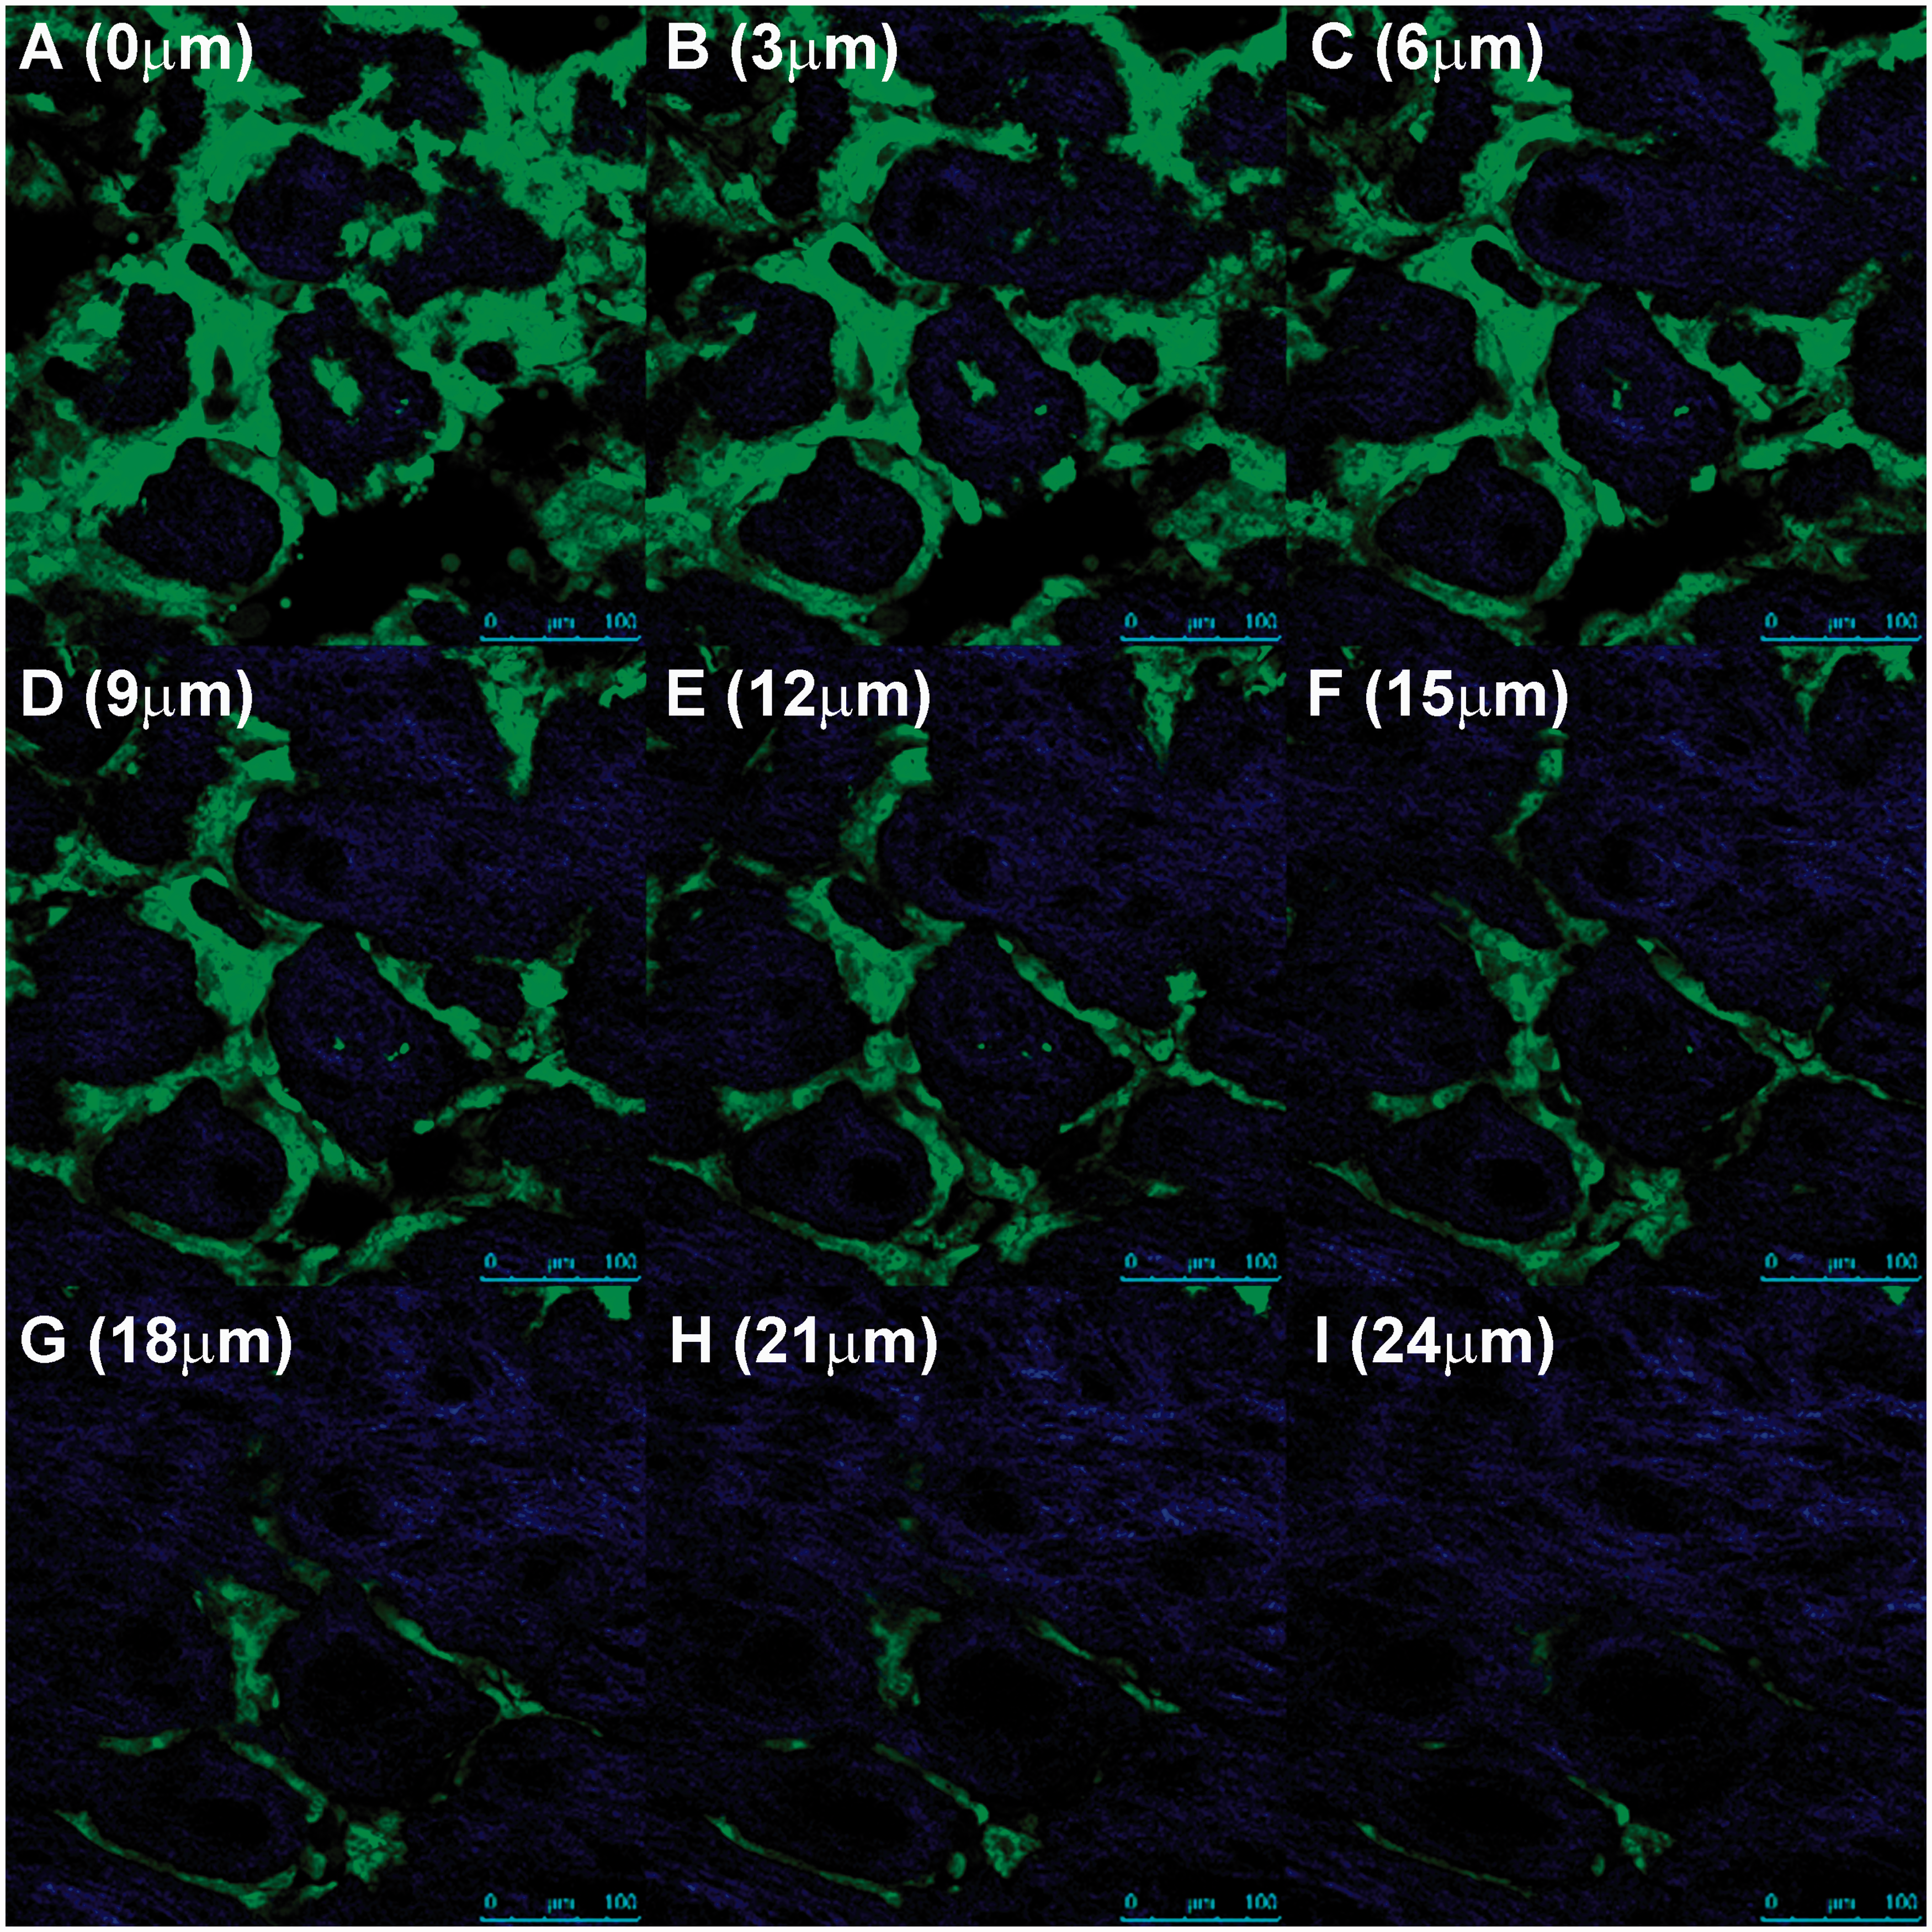
Enhanced invasion and basement membrane destruction by HNSCC cells with TTP knockdown is quantified with subsurface imaging
Non-linear optical microscopic en-face images of control and TTP-knockdown assays, imaged on day 7 post-seeding, are shown (Figure 5a). The white arrow highlights a cell of interest that appears at depth 24 µm in the TTP-knockdown OCE, but is not present in the same region of the OCE at depth 9 µm. By contrast, in the control OCE many GFP-expressing cells are present in the superficial layers, but GFP fluorescence rapidly decreases with increasing depth below the specimen surface, and no cancer cells are observed in the deep layers.
Vertical stack of depth-resolved en-face non-linear optical microscopic molecular images of OCE immunofluorescence assays, and quantification of SHG pixel counts as a function of depth. Representative data cube of a 3D stack of en-face images taken of control and TTP-knockdown OCE assays seven days post-seeding are shown (a). Green color indicates two-photon excited fluorescence from GFP-expressing UM-SCC-1 cells. Blue color shows SHG from collagen, in decellularized human cadaveric dermis scaffold of the OCE. While the control cells (left) are no longer visible in the deeper tissues of the dermis, cells with downregulated TTP (right) are still visible at 24 µm below the surface, indicating that these cells are invading through the tissue scaffold. The white arrow highlights a region of interest where an invading cell is present at a depth of 24 µm, but is not present in the same region of the OCE at a depth of 9 µm. Scale bars = 50 µm. The number of SHG pixel counts over the entire field-of-view of the en-face images, as a function of depth below the surface, was quantified for three TTP-knockdown data cubes and two control data cubes of OCE assays imaged eight days post-seeding (b). TTP-knockdown assays have higher SHG content in superficial layers than control assays, but rapidly lose SHG signal in the deeper layers compared with control assays, suggesting decay of the collagen matrix by invading cancer cells. (A color version of this figure is available in the online journal)
Figure 5(b) shows the number of SHG pixel counts over the entire field-of-view of the en-face images, as a function of depth below the surface. The pixel counts are averaged at each depth for three TTP-knockdown data cubes and two control data cubes, acquired on day 8 post-seeding, and error bars are equal to one standard deviation of the mean. More SHG is present in the top 20 µm of the TTP-knockdown OCE assays than the control assays. From 20 to 40 µm below the surface, SHG levels in the TTP-knockdown assays drop below that of the control assays, and SHG rapidly decreases in the TTP-knockdown assays deeper than 40 µm below the surface. This indicates the increased decay of the collagen matrix by TTP-knockdown cancer cells compared to control cells. Furthermore, the higher level of SHG in the superficial layers of TTP-knockdown assays suggests increased cell invasion, compared to controls assays where a thick layer of cancer cells stack on the surface of the OCE.
Discussion
Comparison of the OCE with other methods
Both two-dimensional (2D) and 3D approaches have been utilized to investigate cancer progression in vivo. An example of a 2D migration model is the scratch assay, where cancer cells growing in a tissue culture dish migrate into an area devoid of cells. 11 Cancer cells in 2D culture lack cell–matrix interactions that influence the phenotype and protein expression of these cells, and therefore 3D approaches are preferred to study invasion. 12
Some 3D culture approaches use a collagen matrix composed of proteins derived from an extracellular matrix to create a structure to simulate invasion. In addition, an in vitro cell-layering approach to development of 3D tissues has been described. 13 Synthetic matrix-based invasion assays are useful in vitro for preliminary studies to evaluate changes in the invasive phenotype after manipulating proteins of interest in cells, but have significant limitations including the absence of a basement membrane structure and lack of the structural complexity of the connective tissue. In addition to the inadequacy of many in vitro approaches, most mouse models of human HNSCC are also inadequate to investigate invasion because tumour cells are injected directly into the connective tissue, thereby bypassing the basement membrane of the surface epithelium.
Some 3D cancer models emphasize the aggregation of cells and have a variety of advantages and disadvantages. 14 A number of models depend on spontaneous aggregation of cells, 15 but can only be adapted to study a limited array of cancer types. Microcarrier beads are inexpensive and support 3D structures grown in cell culture, 16 but the spheroids generated are mostly made up of beads. Engineered scaffolds are expensive and difficult to use in culture, but are biodegradable and can be used in both in vivo and in vitro settings. 17
The OCE model is advantageous because commercially available human-derived dermal matrix is used. As demonstrated, live imaging and histopathological studies are feasible with the OCE model. A heterogeneous population of cells can be introduced in the OCE system. The system can be adapted to a wide variety of cell types, and AlloDerm® grafts can be used for both in vivo and in vitro studies.
Potential applications of the OCE method
The OCE model described in this protocol provides an exciting opportunity to evaluate the invasive phenotypes of individual cancer cell lines in a 3D assay and to evaluate the impact of altered protein expression on invasion. Virtual histopathology of live cells on an OCE construct can be derived through subsurface non-linear optical microscopy to observe and quantify invasion of cancer cells.18,19 Subsequently, the constructs can be fixed for light microscopy, including immunohistochemistry studies. The OCE model can be adapted to study the progression of many tumour types by altering the cell lines and culture conditions used.
Three-dimensional culture systems that preserve cell–matrix interactions are indicated for regenerative tissue applications because they preserve stem cell phenotypes 20 and facilitate epithelial-mesenchymal transition (EMT), 21 which has been shown to mediate invasion of HNSCC cells. 22 Application of this imaging technique will be useful to optimize previously described protocols that generate 3D constructs to replicate normal tissue, such as normal oral 23 and airway 24 mucosa. In addition, adaptation of the imaging methodology described in this protocol may be an interesting application to view cellular changes in a recently published protocol describing viral infection of human tissue explants. 25
Limitations of the OCE method
The main advantages of the OCE method over other in vitro methodologies include the invasion of cancer cells in the connective tissue stroma after disruption of the basement membrane, thereby simulating intraoral HNSCC. In addition, the procedure allows for stratification of cultured cells and growth of the cells in a 3D setting with complex cell–cell and cell–matrix interactions. However, the OCE model has some limitations. HNSCC involves multiple epithelial–stromal interactions, including interactions between cancer cells and fibroblasts, blood vessels, immune cells and nerves. Although the OCE construct described here does not contain other cell types involved in the disease process, the model can be modified to add different cell types. Because the OCE method takes several days, it is necessary to transfect cells with a GFP tag rather than use a fluorescent dye, which will degrade over the duration of the experiment. The model also requires significant optimization. The number of cells, cell culture conditions, concentration of chemoattractant used and the time of harvesting all must be determined during optimization studies. Subsurface imaging on sequential days helps to determine optimal timepoints for harvesting the OCE for histopathological studies.
In summary, the OCE method is a novel approach of preparing an in vitro model of HNSCC using human cancer cell lines and decellularized human cadaveric dermis. Furthermore, the in vivo imaging method described here and the comparison to histology from paraffin-embedded tissue sections will be useful to monitor many types of 3D tissue constructs.
Footnotes
Author contributions
NJD designed the OCE protocol, contributed intellectually to novel imaging concepts, completed optimization experiments and contributed to writing and editing the manuscript. EAV completed shRNA transfections of cell lines. CSS and EAV contributed to preparation of OCE samples, imaging the samples, writing the manuscript and compiling figures. CSS edited and submitted the manuscript. L-CC and SFE completed subsurface non-linear optical microscopic molecular imaging of OCE specimens and imaging analysis, contributed sections to the manuscript about imaging and edited the manuscript. SK and SF provided intellectual contributions to the development of the OCE method and provided some reagents. M-AM provided intellectually to development of novel imaging concepts, provided guidance with subsurface non-linear optical microscopic molecular imaging technique and helped to edit the manuscript. All of the authors read and approved the manuscript.
Acknowledgments
The authors would like to thank Mr John Westman for his assistance in preparation of histological specimens and Dr Paul C. Edwards for providing the clinical photo of HNSCC. We also thank Mrs Nickole Russo for her assistance in compiling figures. This study was financially supported by National Institute of Dental and Craniofacial Research grants DE018512 and DE019513 (NJD), DE021293 (CSS), DE021305 (EVT) and DE019431 (SEF and M-AM).