
Abstract
Caloric restriction (CR) prevents or delays a wide range of aging-related diseases possibly through alleviation of oxidative stress. The aim of our study was to examine the effect of CR on oxidative and nitrosative cardiac damage in rats, induced by acute ethanol intoxication. Male Wistar rats were divided into following groups: control; calorie-restricted groups with intake of 60–70% (CR60–70) and 40–50% of daily energy needs (CR40–50); ethanol-treated group (E); calorie-restricted, ethanol-treated groups (CR60–70 + E, CR40–50 + E). Ethanol was administered in five doses of 2 g/kg every 12 h, while the duration of CR was five weeks before ethanol treatment. Malondialdehyde level was significantly lower in CR60–70 + E and significantly higher in CR40–50 + E vs. control. Nitrite and nitrate level was significantly higher in CR40–50 + E compared to control group. Activity of total superoxide dismutase (SOD) and its isoenzyme, copper/zinc-SOD (Cu/ZnSOD), was significantly higher in CR60–70 + E and lower in CR40–50 + E vs. control. Activity of manganese-SOD (MnSOD), that is also SOD isoenzyme, was significantly lower in CR40–50 + E compared to control group. Plasma content of sulfhydryl (SH) groups was significantly higher in CR60–70 group vs. control. Plasma concentration of total cholesterol, triacylglycerol, low-density lipoproteins and high-density lipoproteins was significantly lower in CR60–70 group compared to control values. Food restriction to 60–70% of daily energy needs has a protective effect on acute ethanol-induced oxidative and nitrosative cardiac damage, at least partly due to alleviation of ethanol-induced decrease in SOD activity, while restriction to 40–50% of energy needs aggravates lipid peroxidation and nitrosative stress.
Introduction
Caloric restriction (CR) is defined as a reduction in calorie intake below the usual ad libitum intake without malnutrition. 1 CR prevents or delays a wide range of chronic diseases, including autoimmune diseases, cardiomyopathy, kidney, and respiratory diseases.2–6 In addition, CR is capable of decreasing neurodegeneration in the brain and enhancing neurogenesis in animal models of Alzheimer’s disease, Parkinson’s disease, Huntington’s disease, and stroke.3,7,8 More recent studies suggest that reducing calorie intake can also increase the lifespan in nonhuman primates. 9 In humans, CR with adequate nutrition protects against obesity, type 2 diabetes, dyslipidemia, hypertension, inflammation, and atherosclerosis, which are major risk factors for myocardial infarction, stroke, heart failure, and chronic kidney disease.2,4,10–12 Also, preliminary data suggest that CR with adequate nutrition may protect against cancer.5,13
Analyses of heart tissues of old rodents and humans have shown evidence of elevated levels of oxidative damage to proteins, lipids, and deoxyribonucleic acid (DNA).14–16 Oxidative stress is involved in the pathogenesis of myocardial ischemia-reperfusion injury, 17 cardiac remodeling after myocardial infarction, 18 left ventricular hypertrophy, and heart failure. 19 Furthermore, oxidative damage plays a central role in endothelial dysfunction both during aging 20 and in the setting of cardiovascular disease. 21 Although the fundamental mechanisms of aging are still unclear, a growing body of evidence involves mitochondria and the continuous generation of reactive oxygen species (ROS) in the mitochondrial inner membrane. Most studies conducted, to date, have found attenuation of cardiac oxidative damage and/or mitochondrial oxidant generation with CR.16,22–25 Namely, CR has been shown to enhance DNA repair systems, promote the removal of damaged proteins and oxidized lipids and upregulate endogenous enzymatic and nonenzymatic antioxidative defense mechanisms. 5 CR also increases bioavailability of antiatherogenic nitric oxide (NO) and improves endothelial function. 26 Additionally, CR exerts beneficial effects on a range of systemic cardiovascular risk factors 1 and improves diastolic function, a marker of primary aging of the heart.27,28
As a small molecule, ethanol has the property of being soluble both in lipid and water environment. It can easily be absorbed and distributed to heart tissue that is in reach of water and blood flow. 29 The oxidative stress caused by ROS produced during extensive ethanol metabolism is suggested as one of the main important mechanisms underlying the toxicity.30,31 Besides, acute ethanol administration is reported to convert rat heart xanthine dehydrogenase to xanthine oxidase which uses acetaldehyde as substrate and contribute to the generation of ROS. 32 Except generating ROS, ethanol and its metabolites are considered to contribute to cardiac dysfunction directly by enhancing catecholamine levels, forming protein-aldehyde adducts and altering mitochondrial function.32,33
Despite the number of studies on CR and alcoholic heart disease (AHD), the impact of CR and acute ethanol intake on cardiac oxidative and nitrosative stress is not fully described. Therefore, the aim of the present study was to investigate the effect of CR on oxidative and nitrosative cardiac damage in rats, induced by acute ethanol intoxication.
Materials and methods
Animals
The experiment was performed on adult, 10 weeks old male Wistar rats weighing 200–220 g, raised at Military Medical Academy, Belgrade. Animals were kept under standard laboratory conditions (temperature 22 ± 2℃, relative humidity 50 ± 10%, 12/12 h light/dark cycle with lights turned on at 9.00 a.m.) and had free access to tap water and received 17 g/daily standard pelleted LM2 food (Veterinary Institute “Subotica”, Subotica, Serbia). The diet, which had metabolizable energy of the least 11.5 MJ/kg, was composed of a maximum of 7% cellulose and a minimum of 19% protein. On the day prior to the sacrifice, the rats were fasted overnight. All experimental procedures were in full compliance with Directive of the European Parliament and of the Council (2010/63/EU) and approved by The Ethical Committee of the Faculty of Medicine, University of Belgrade.
All animals (n = 42) were randomly divided into following groups: (1) control group, treated with distilled water (C; n = 7); (2) ethanol-treated group (E; n = 7); (3) calorie-restricted groups with intake of 40–50% (CR40–50; n = 10) and 60–70% of daily energy requirements (CR60–70; n = 7); (4) calorie-restricted groups treated with ethanol: CR40–50 + E (n = 10) and CR60–70 + E (n = 7). The duration of CR was five weeks and allowed food intake was calculated according to daily energy requirements of 10 weeks old rats being 17 g of standard pelleted LM2 food. Body weight of investigated animals was registered, and in a case of loss over 20% of its initial value, experiment was interrupted. Ethanol was administered in five single doses of 2 g/kg every 12 h by oral route (orogastric tube). For oral administration, ethanol (Sigma Aldrich Chem. Co., St. Louis, Missouri, USA) was dissolved in distilled water in concentrations of 30% v/v. This dose was chosen since it has been proven to induce oxidative stress in liver in our previous studies.34,35 Ethanol was administered for last three days of CR in CR40–50 + E and CR60–70 + E groups. Following ethanol administration, the animals were bled from the tip of the tail for later determination of blood alcohol levels (BALs). Rats were sacrificed by cervical dislocation 12 h after last dose of ethanol administration. Blood samples were collected from the right side of the heart, and heart tissues were excised and stored as described below.
Sample preparation
Heart samples for biochemical analysis were homogenized on ice, in 0.25 M cold-buffered sucrose medium (Serva, Feinbiochemica, Heidelberg, New York, USA), 10 M phosphate buffer (pH 7.0), and 1 mM ethylenediaminetetraacetic acid (EDTA) (Sigma Aldrich Chem. Co.). The homogenates were centrifuged at 2000 g for 15 min at 4℃. Crude sediments were dissolved in a sucrose medium and centrifuged. The supernatants were transferred into the tubes and centrifuged at 3200 g for 30 min at 4℃. Obtained sediments were dissolved in deionized water. After 1 h of incubation, the samples were centrifuged at 3000g for 15 min at 4℃ and supernatants were stored at −70℃. Proteins were determined by the Lowry method using bovine serum albumin as the standard. 36
Biochemical analysis
Tissue markers
Lipid peroxidation in the heart homogenates was measured as malondialdehyde (MDA) production and assayed in the reaction with thiobarbituric acid as described by Girotti et al. 37 The results are expressed as micromoles per milligram (µmol/mg) of proteins in heart homogenates.
The concentration of nitrites and nitrates (NOx), markers of NO production, was determined by using Griess reagent. After reduction of nitrates, total nitrites react with sulfanilamide and N-(1-naphtyl)-ethylenediamine to produce an azo dye, which can be measured spectrophotometrically at 492 nm. 38
Activity of total superoxide dismutase (SOD) (EC1.15.1.1; SOD) in the heart was measured spectrophotometrically, as an inhibition of epinephrine autooxidation at 480 nm. 39 After the addition of 10 mM epinephrine (Sigma Aldrich Chem. Co.), analysis was performed in the sodium carbonate buffer (50 mM, pH 10.2; Serva, Feinbiochemica, Heidelberg, New York, USA) containing 0.1 mM EDTA (Sigma Aldrich Chem. Co.). Samples for manganese-SOD (MnSOD) were previously treated with 8 mM potassium cyanide (Sigma Aldrich Chem. Co.) and were then analyzed as described. 39 Activity of copper/zinc-SOD (Cu/ZnSOD) was calculated as a difference between the activities of total SOD and MnSOD.
Plasma markers
Total plasma concentration of sulfhydryl (SH) groups was measured spectrophotometrically at 412 nm in phosphate buffer (0.2 mol + 2 mmol EDTA, pH 9) by using 5,5’-dithiobis-2-nitrobenzoic acid (DTNB; 0.01 M, Sigma Aldrich Chem. Co.). 40
Lipid concentrations in plasma (total cholesterol, TC; triacylglycerol, TAG; low-density lipoproteins, LDL; and high-density lipoproteins, HDL) were measured by enzymatic colorimetric method. Plasma TC concentration was determined with enzymatic colorimetric test. 41 An enzymatic colorimetric test from “Lighthing” (Yu Medica) was employed to measure plasma TAG concentration according to the method described by Trinder. 42 Plasma LDL concentration was calculated using the formula by Friedewald et al. 43 Plasma HDL concentration was determined according to the method by “Lighthing” (Yu Medica). In the presence of double positively charged anions, the HDL fraction was measured after selective LDL precipitation by polyanion sulfates. In our experimental protocol, dextran sulfate and magnesium sulfate were used in accordance with USA Center of Disease Control – Lipid reference section. After centrifugation, HDL fraction was suspended in the supernatant. Subsequently, supernatant was separated and the HDL fraction was determined directly from the supernatant by the PAP method.
BALs
Blood was collected from the tip of the tail (0.25 mL) following previously described ethanol administration. There was no volume replacement during the experiment. Immediately after tail blood collection, samples were centrifuged and plasma alcohol levels were determined using the Analox micro-stat GM7 (Analox Instr. Ltd.; Lunenberg, MA).
Pathohistological analysis
Heart tissue was incubated in 10% formalin solution at room temperature. After the fixation, the heart samples were processed by the standard method. Tissues were incorporated in paraffin, sectioned at 5 µm and then stained with Hematoxylin & Eosin. Then, they were prepared for light microscopy analysis. All samples were evaluated by an experienced pathohistologist who was blinded to the experiment. Preparations were analyzed and photographed by means of a combined photo-binocular light microscope Olympus BX51 equipped Artcore 500 MI Artray, Co. Ltd. Japan Camera.
Statistical analysis
Results are expressed as means ± SEM. As the normal distribution of parameters was confirmed by Kolmogorov–Smirnov test, two-way analysis of variance (ANOVA) with Tukey’s post hoc test was used for testing the difference among groups. Computer Software Statistica 7.0 was used for analysis and the difference was considered statistically significant if P < 0.05.
Results
Body weight
CR60–70 and E group had no significant weight loss during the five-week experimental period (215 ± 2.5 g; 216 ± 2.9 g, respectively), compared to control (218 ± 3.0 g) (P > 0.05), while in CR40–50 and CR40–50 + E (183 ± 2.4 g and 179 ± 3.1 g), a significant decrease in body weight was evident vs. control (P < 0.01). Two animals in each group (CR40–50 and CR40–50 + E) have lost more than 20% of their body weight and were excluded from the experiment.
Biochemical analysis
Cardiac MDA level
Our study has shown a significant increase in cardiac MDA level in CR40–50 (12.15 ± 2.84 µmol/mg prot.) and E group (13.67 ± 2.80 µmol/mg prot.) in comparison with control group (2.17 ± 0.44 µmol/mg prot.; P < 0.01). Moreover, when compared to control values, the highest increase in MDA level was observed in CR40–50 + E group (18.76 ± 1.62 µmol/mg prot.) (P < 0.01). Additionally, MDA level in CR40–50 + E group was significantly higher than in E and CR40–50 group (P < 0.01). In contrast to, cardiac MDA level has shown a significant fall in CR60–70 + E group (3.85 ± 0.49 µmol/mg prot.) in comparison with E group (P < 0.01). No significant change in MDA level was found in CR60–70 group (2.13 ± 0.47 µmol/mg prot.) vs. control (P > 0.05) (Figure 1).
The effects of calorie restriction (CR) and ethanol on heart malondialdehyde (MDA) level. The duration of CR was five weeks, while ethanol was administered in five doses of 2 g/kg every 12 h during the last three days of CR. Heart sections were collected 12 h after the last dose of ethanol. Significance of the difference was estimated by using two-way ANOVA with Tukey’s post hoc test (*P < 0.01 vs. control, ‡P < 0.01 vs. E group, •P < 0.01 vs. CR40–50 group).
Cardiac NOx concentration
Cardiac NOx concentration was significantly higher in CR40–50 (19.17 ± 2.29 µmol/mg prot.), E (15.55 ± 2.96 µmol/mg prot.) and CR40–50 + E group (23.55 ± 2.13 µmol/mg prot.) in comparison with control group (3.72 ± 0.98 µmol/mg prot.; P < 0.01). The lowest increase was evident in E group, while the highest increase was detected in CR40–50 + E group. In addition to, no significant change in NOx concentration was found in CR60–70 (4.03 ± 0.70 µmol/mg prot.) and CR60–70 + E group (4.62 ± 1.10 µmol/mg prot.) vs. control (P > 0.05). Besides, NOx concentration in the heart was significantly reduced in CR60–70 + E (4.62 ± 1.11 µmol/mg prot.) and significantly increased in CR40–50 + E group (23.55 ± 2.13 µmol/mg prot.) when compared to E group (15.55 ± 2.96 µmol/mg prot.; P < 0.01). Additionally, cardiac NOx concentration was significantly higher in CR40–50 + E group in comparison with CR40–50 group (P < 0.05) (Figure 2).
The effects of calorie restriction (CR) and ethanol on heart nitrates + nitrites (NOx) level. The duration of CR was five weeks, while ethanol was administered in five doses of 2 g/kg every 12 h during the last three days of CR. Heart sections were collected 12 h after the last dose of ethanol. Significance of the difference was estimated by using two-way ANOVA with Tukey’s post hoc test (*P < 0.01 vs. control, ‡P < 0.01 vs. E group, •P < 0.01 vs. CR40–50 group).
Concentration of plasma SH groups
While the concentration of SH groups in the plasma was significantly higher in CR60–70 group (0.463 ± 0.108 mmol/L), its concentration was significantly lower in CR40–50 + E (0.234 ± 0.012 mmol/L) compared to control group (0.277 ± 0.022 mmol/L; P < 0.01). No significant difference in SH groups concentration was found between CR40–50 (0.267 ± 0.036 mmol/L), E (0.295 ± 0.006 mmol/L) and CR60–70 + E (0.266 ± 0.045 mmol/L) and control group (P > 0.05). On the other hand, plasma level of SH groups was significantly lower in CR60–70 + E group than in CR60–70 group and significantly higher in E group when compared to CR40–50 + E group (P < 0.01) (Figure 3).
The effects of calorie restriction (CR) and ethanol on plasma concentration of sulfhydryl (–SH) groups. Blood samples were collected from the right side of heart 12 h after the last dose of ethanol. Significance of the difference was estimated by using two-way ANOVA with Tukey’s post hoc test (*P < 0.01 vs. control, ‡P < 0.01 vs. E group, †P < 0.01 vs. CR60–70 group).
Cardiac total SOD activity
Total SOD activity in the heart was significantly elevated in CR60–70 group (234.13 ± 10.03 U/mg prot.) in comparison with control group (195.64 ± 9.12 U/mg prot.; P < 0.01). In contrast to, activity of this enzyme was significantly decreased in CR40–50 group (119.32 ± 6.71 U/mg prot.), as well as in all ethanol-treated groups/E (91.23 ± 6.19 U/mg prot.), CR60–70 + E (164.01 ± 7.18 U/mg prot. mg prot.) and CR40–50 + E (86.61 ± 5.28 U/mg prot.), respectively/compared to control group (P < 0.01). Total SOD activity was significantly higher in CR60–70 + E group in comparison with E group (P < 0.01). In addition to, activity of this enzyme was significantly lower in CR40–50 + E than in CR40–50 group (P < 0.01) (Figure 4).
The effects of calorie restriction (CR) and ethanol on total superoxide dismutase (SOD) activity in heart. Significance of the difference was estimated by using two-way ANOVA with Tukey’s post hoc test (*P < 0.01 vs. control, ‡P < 0.01 vs. E group, •P < 0.01 vs. CR40–50 group).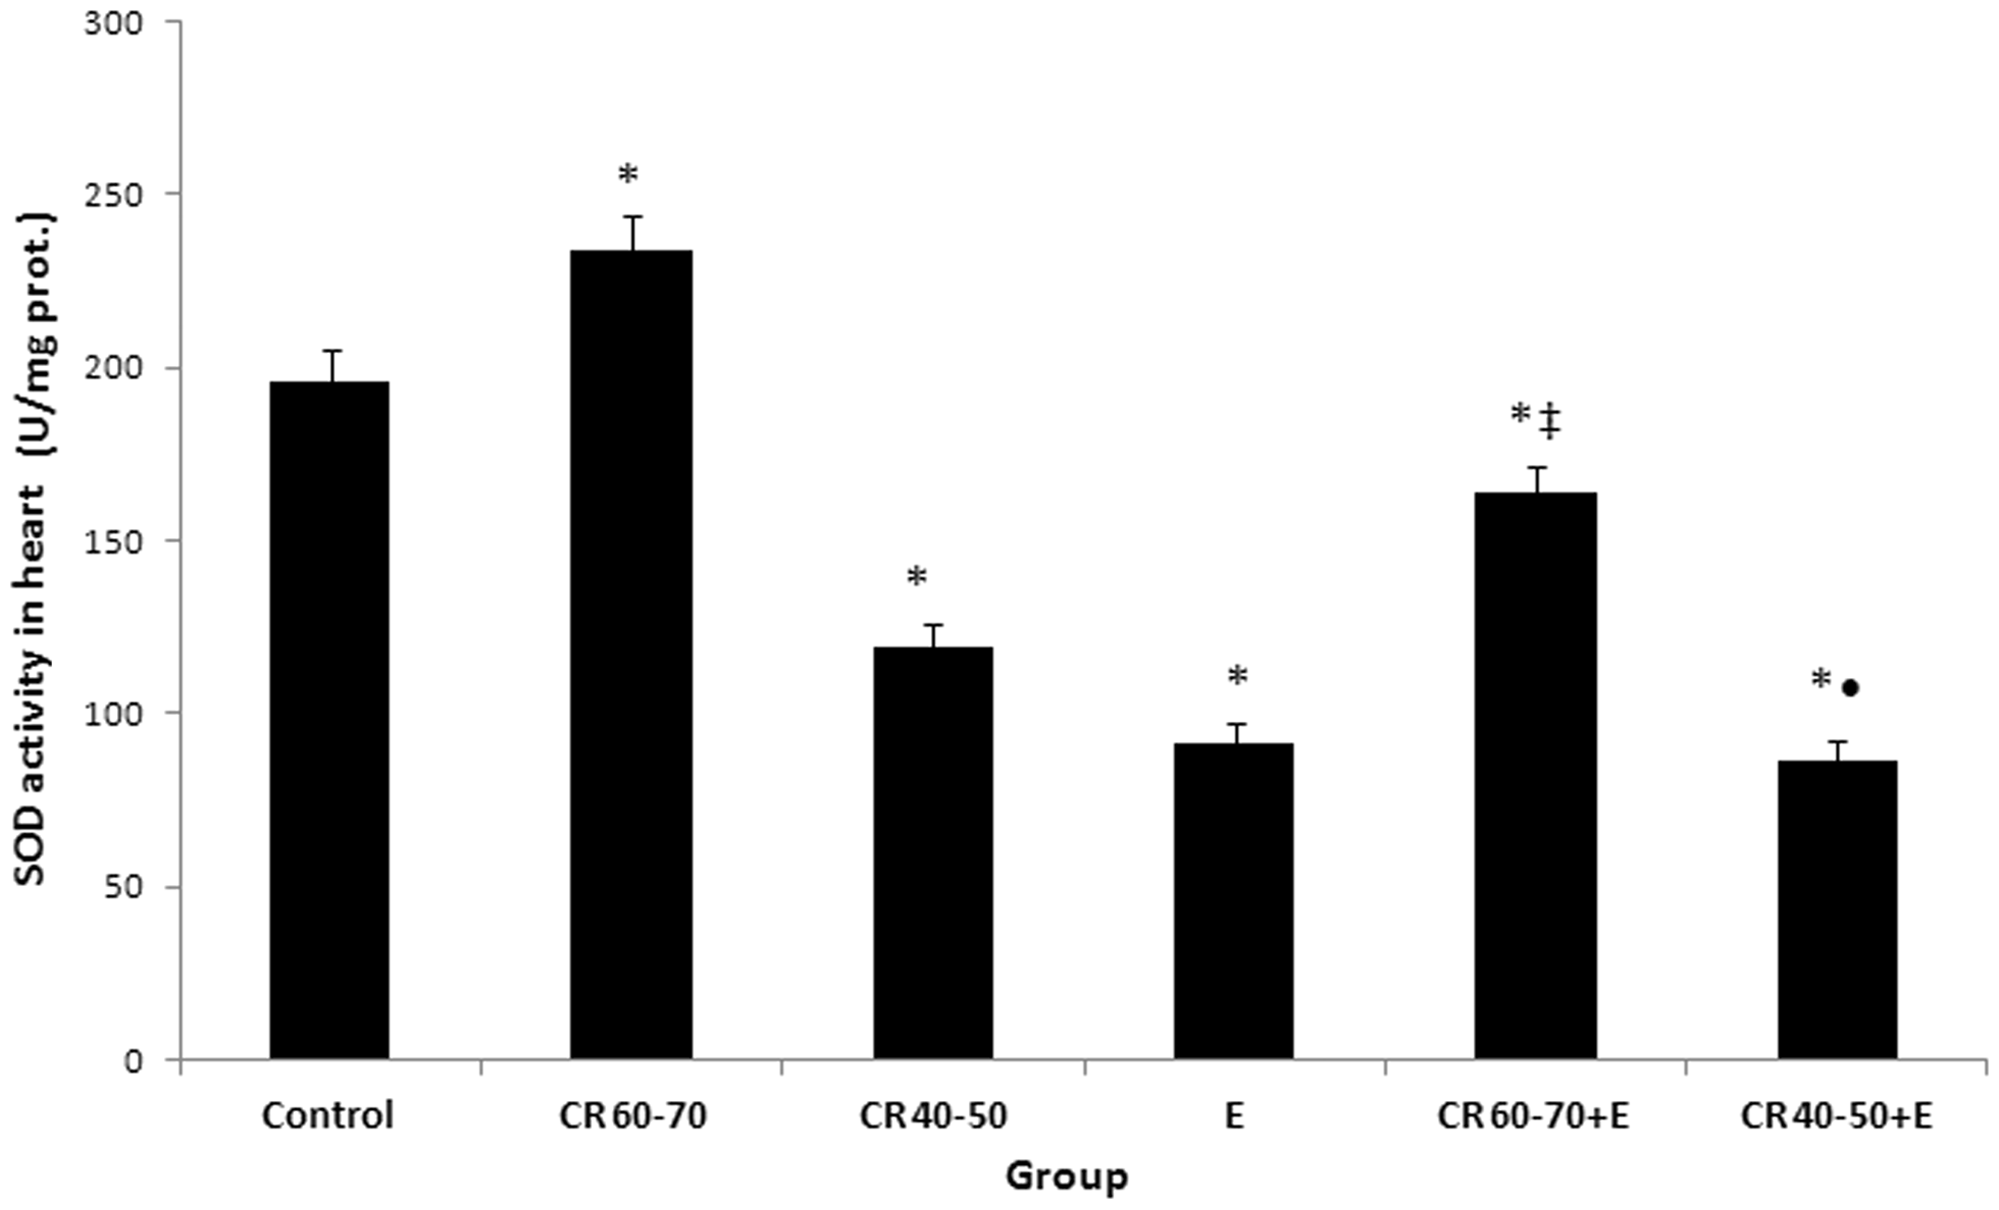
Cardiac Cu/ZnSOD activity
Except in CR60–70 group, in which no significant difference was found in cardiac Cu/ZnSOD activity (153.06 ± 7.61 U/mg prot.) in comparison with control value (149.78 ± 9.84 U/mg prot.) (P > 0.05), in other groups the activity of this enzyme was significantly lower than in control group (P < 0.01). However, cardiac Cu/ZnSOD activity has shown a significant rise in CR60–70 + E group (120.85 ± 6.18 U/mg prot.) vs. E group (65.82 ± 5.64 U/mg prot.) (P < 0.01), as well as in CR40–50 group (89.80 ± 7.13 U/mg prot.) vs. CR40–50 + E group (67.20 ± 5.05 U/mg prot.) (P < 0.01) (Figure 5).
The effects of calorie restriction (CR) and ethanol on cuprum/zinc superoxide dismutase (Cu/Zn SOD) activity in heart. Significance of the difference was estimated by using two-way ANOVA with Tukey’s post hoc test (*P < 0.01 vs. control, ‡P < 0.01 vs. E group, •P < 0.01 vs. CR40–50 group).
Cardiac MnSOD activity
Cardiac MnSOD activity was significantly higher in CR60–70 group (81.07 ± 5.96 U/mg prot.) in comparison with control (45.86 ± 2.18 U/mg prot.; P < 0.01). Except CR60–70 + E group, in which no significant difference was found in MnSOD activity (43.17 ± 2.96 U/mg prot.) when compared to control value (P > 0.05), in other groups the activity of this enzyme was significantly lower than in control group (P < 0.01). However, MnSOD activity was significantly higher in CR60–70 + E group (P < 0.01) and significantly lower in CR40–50 + E group (19.41 ± 1.54 U/mg prot.; P < 0.01) in comparison with E group (25.41 ± 3.03 U/mg prot.). Besides, cardiac MnSOD activity has shown a significant decline in CR40–50 + E group when compared to CR40–50 group (29.52 ± 2.75 U/mg prot.; P < 0.01) (Figure 6).
The effects of calorie restriction (CR) and ethanol on mangane superoxide dismutase (MnSOD) activity in heart. Significance of the difference was estimated by using two-way analysis of variance (ANOVA) with Tukey’s post hoc test (*P < 0.01 vs. control, ‡P < 0.01 vs. E group, •P < 0.01 vs. CR40–50 group, §P < 0.01 vs. CR60–70 + E).
Plasma TC content
The effects of calorie restriction (CR) and ethanol on cholesterol, triglyceride (TG), low-density lipoprotein (LDL) and high-density lipoprotein concentration (HDL) in serum of experimental animals

The duration of CR was five weeks, while ethanol was administered in five doses of 2 g/kg every 12 h during the last three days of CR. Significance of the difference was estimated by using two-way analysis of variance (ANOVA) with Tukey’s post hoc test (*P < 0.05 and †P < 0.01 vs. control; **P < 0.05, §P < 0.01 vs. CR60–70; ‡‡P < 0.05 vs. CR40–50; ‡P < 0.01 vs. E; ††P < 0.0 1 vs. CR60–70 + E).
E: ethanol-treated group; CR60–70: calorie-restricted group with intake of 60–70% of daily energy requirements; CR40–50: calorie-restricted group with intake of 40–50% of daily energy requirements; CR60–70 + E: calorie-restricted group with intake of 60–70% of daily energy requirements, treated with ethanol; CR40–50 + E: calorie-restricted group with intake of 40–50% of daily energy requirements, treated with ethanol.
The concentration of plasma TAG
The concentration of TAG in the plasma was significantly decreased in CR60–70 group in comparison with control group (P < 0.01). In addition to, in other investigated groups plasma TAG level has shown increase when compared to control group. Moreover, significant difference was found in plasma TAG content between E and CR60–70 + E group vs. control group (P < 0.01, respectively). Besides, plasma content of TAG was significantly higher in E group than in CR60–70 + E and CR40–50 + E group (P < 0.01). On the other hand, plasma level of TAG was significantly lower in CR40–50 + E group when compared to CR60–70 + E group (P < 0.01) (Table 1).
Plasma LDL concentration
While plasma LDL concentration was significantly higher in E and CR40–50 + E group, concentration of this lipid fraction was significantly lower in CR60–70 in comparison with control group (P < 0.01, respectively). Additionally, plasma LDL level has shown a significant increase in E group when compared to CR60–70 + E and CR40–50 + E group (P < 0.01, respectively) (Table 1).
Plasma HDL concentration
Except E group, in which significant decrease was found in plasma HDL concentration compared to control value (P < 0.01), in other groups there was no significant difference in concentration of this lipid fraction vs. control (P > 0.05). Plasma HDL content was significantly lower in E group than in CR60–70, CR60–70 + E and CR40–50 + E group (P < 0.01). However, plasma HDL level was significantly higher in CR40–50 + E group when compared to CR40–50 group (P < 0.05) (Table 1).
BALs
Effects of different levels of calorie restriction and ethanol on blood alcohol level (BAL) in rats on the third day of ethanol exposure

Values are mean ± standard deviation; one-way analysis of variance (ANOVA) followed by Tukey’s post hoc test was used (*P < 0.01 vs. ethanol-treated group/E/; †P < 0.01 vs. E group; ‡P < 0.01 vs. CR40–50 + E).
Pathohistological findings
In CR40–50 group, undulation, attenuation and fragmentation of cardiomyocytes, and interstitial edema were noticed (Figure 7(a)), while in CR40–50 + E group, increased number of cardiomyocytes without nuclei was found (Figure 7(d)). In E group, mild edema and undulation of cardiomyocytes were evident (Figure 7(c)). On the other hand, no pathological changes in the myocardium were found in CR60–70 and CR60–70 + E groups (Figure 7(b) and (e)). The histological appearance of the heart was normal in the control group (Figure 7(f)).
Histological findings of heart tissue (Hematoxylin & Eosin).
Discussion
Our study showed that CR may have diverse effects on acute ethanol-induced cardiac damage, depending on the severity of CR. While moderate CR (intake of 60–70% of daily energy needs) prevented morphological changes in the heart after ethanol intake, ethanol and severe CR (restriction of food intake up to 40–50% of daily energy needs) separately caused cardiac damage. The most pronounced pathohistological changes were observed after severe CR in combination with ethanol (Figure 7(d)).
The modulatory effect of CR on ethanol-induced cardiac injury may be, at least partly explained by its effects on oxidative and nitrosative stress. Lipid peroxidation and increased NOx levels were detected in the heart after ethanol treatment (Figure 2). Prooxidant effects of ethanol were confirmed in various models of acute and chronic ethanol intoxication.29–31,33,44 It is, also, well known that oxidative metabolic challenge to mitochondria due to ethanol-induced lipoperoxidation, precipitates cell injury.33,45–48
Nitrosative stress (overproduction of NO, NO-modified cysteine thiols in amino acids, peptides and proteins and other reactive nitrogen species; RNS) may lead to nitrosylation reactions that can alter the structure of proteins and so inhibit their normal function. 48 The key role in the development of nitrosative stress in ethanol-induced cardiac injury is attributed to high concentration of NO in the heart.30,31,49 Under these conditions, NO and superoxide anion may react together to produce significant amounts of a much more oxidatively active molecule, peroxynitrite anion (ONOO−), which can cause DNA fragmentation and lipid peroxidation. In relation to, these oxidants contribute to the functional impairment of many cellular enzymes and also disturb mitochondrial function. Moreover, NO diminishes catalase activity and reduces GSH level, thus reducing the antioxidative cellular mechanisms. 50
In contrast to, CR may have various effects on lipid peroxidation and nitrosative stress, depending on the degree of restriction. While moderate restriction of food intake had no significant effect on MDA level, severe CR caused lipid peroxidation in the heart (Figure 1). Various investigations suggest that inhibition of lipid peroxidation may be an important mechanism of lifespan prolonging effect of moderate CR.5,25 The protective effect of CR on lipid peroxidation during aging may be mediated by an increase in 17-beta estradiol level 51 or by lowering of complex I assembly and complex IV activity in the electron transport chain. 52 Additionally, CR was found to alter fatty acid composition of membrane lipids in rats and mice and to make them more peroxidation-resistant. 53 The correlation between caloric intake and lipid peroxidation is confirmed in obese people, 54 and cardiac patients.55–57
In contrast to lipid peroxidation, both moderate and severe CR caused an increase in heart NOx level, although to a lesser extent in CR60–70 group (Figure 2). CR (30% food restriction) was found to reduce the cardiac production of NO. 16 This indicates that heart is more susceptible to nitrosative stress than to lipid peroxidation in CR. In relation to, ROS are known to contribute to cardiac injury both by oxidizing cellular constituens and by diminishing NO bioactivity. 48 In the physiological state, the concentration of NO is higher than the concentration of superoxide and favors protein S-nitrosylation, that has been established as a route through which NO can modulate diverse cellular processes, including cardiac excitation-contraction coupling, endothelial/vascular function and tissue oxygen delivery. However, NO/superoxide disequilibrium favors oxidation reactions. In addition, NO reactions with superoxide anions produce nitrosating reagents, that react preferential with thiols. Thus, controlled production of RNS and ROS not only preserves an antioxidant environment, but may also serve as a mechanism of channeling NO to cysteine substrates. Conversely, when NO and/or superoxide anions are elevated, both the nature of target modification and the specificity of targeting are impaired. In other words, superoxide/ROS production may facilitate protein S-nitrosylation at basal conditions, but disrupts this signaling mechanism at higher concentrations. 48
Abnormally large concentrations of ROS/RNS may lead to permanent changes in signaling mechanisms, that respond to alterations in the thiol/disulfide redox state. 48 While ethanol and severe CR separately induced no changes in plasma SH concentration, severe CR (40–50% of daily energy needs) in combination with ethanol induced a decline in SH concentration in the plasma (Figure 3). This decline reflects oxidation-induced systemic toxic damages of plasma proteins caused by combined effects of ethanol and severe CR. 35 Moreover, oxidative modifications of plasma proteins are accompanied by increased lipid oxidative damage and taken together confirmed the existence of systemic oxidative stress in rats treated with ethanol in combination with severe CR. Similar decrease in plasma SH groups was observed by Belch et al., 58 whereas Yucel et al. 59 have demonstrated decrease in level of SH groups in red blood cell membranes in chronic heart failure patients with dilated cardiomyopathy. In contrast to, moderate CR induced an increase in plasma SH concentration (Figure 3). This finding is compatible with the documented data which reports that SH groups of plasma proteins might act as “sacrificial” antioxidants in plasma and extravascular spaces by intercepting chain reactions of radical production in plasma. 58
One of the most consistent effects of CR is the reduction in oxidative damage in animals subjected to moderate CR. Among potential mechanisms that could explain the protective effect of CR on oxidative damage is an increase in antioxidant defenses. 22 Given the role of SOD, as a major defense system against superoxide, in present study, it is possible that increase in its activity upon the action of moderate CR is an adaptive phenomenon in response to increased substrate concentration in mild oxidative stress. The protective effect of moderate CR on ethanol-induced oxidative stress in the heart was evident on both SOD izoenzymes. An explanation to this may be partly related to alleviation of ethanol-induced decline in SOD activity. Moreover, in present study, moderate CR alone induces a significant increase in cardiac total SOD activity (Figure 4), due to an increase in MnSOD (Figure 6). These findings correspond to literature data, too.1,6,16,25,26,28,60 Having in mind that it is not completely known how the mitochondrial anti-aging protein, SIRT3, responds to changes in mitochondrial nutrient and redox status, including MnSOD activity,15,23 possible significant correlations refer to activity of SOD izoenzymes in CR conditions should be further investigated. However, in our investigation, severe CR caused a decline in MnSOD and Cu/ZnSOD and further aggravated ethanol-induced decrease in the activity of these enzymes. These findings indicate that the effects of CR on ethanol-induced decline in SOD depend on the degree of CR. It is, also, in agreement with findings of other studies that reported an increase in cardiac SOD activity in aged rats after moderate CR16,28,61 and a decline in the activity of this enzyme after short-term food restriction.1,22,25
On the other hand, the effects of CR on ethanol-induced changes in SOD activity may, also, depend on the ethanol administration regimen 29 and the duration of the intervention. 16 Namely, there seems to be a little doubt that the effects of ethanol consumption on cardiovascular system disease follow a dose-dependent relationship. 33 Low amounts of ethanol intake have been shown to increase cardiac SOD activity,29,46 whereas at higher doses, ethanol has detrimental effects on cardiac tissue, as revealed by the dimunition of SOD and other antioxidant compounds.62,63 Our previous studies found a significant decline of hepatic Cu/ZnSOD activity under the influence of ethanol.34,35 Besides, in the same investigations, we observed a significant increase in MnSOD activity in the liver in acute ethanol intoxication.34,35 Judging from the data of present study, SOD may contribute to the cardioprotective effects of moderate CR in acute high-dose ethanol intoxication.
Lipids and the degree of fatty acid unsaturation have been proposed to play an important role in the aging process and longevity. 22 It is found that restriction of calorie intake is effective in controlling lipid profile in obese rats. 12 In our investigation, TC content in moderate calorie-restricted rats was significantly decreased compared to control values. This finding is compatible with the documented data, which reports a significant decrease of this lipid particle in the plasma of calorie-restricted animals. 12 In contrast to, our finding indicate that plasma content of TC in rats treated with ethanol was significantly increased in comparison with control values and CR60–70 group, as well as in CR60–70 + E group compared to CR60–70 group. This finding may be related with the augmentation of ROS production after ethanol intake.
Our study showed that the concentration of TAG in the plasma was significantly decreased in moderate calorie-restricted animals, as a result of a possible protective function of moderate CR. 22
In this experimental model, the significantly higher plasma LDL concentration in calorie-restricted animals (40–50% of daily energy needs) treated with ethanol, as well as in animals that separately received ethanol, may be related with augmentation of ROS production. In contrast to, our investigation demonstrated that LDL concentration in the plasma of moderate CR treated animals was significantly decreased compared to control values. It is an expected finding, that could be explained with protective effect of CR. 56
In our study, significant decrease in plasma HDL concentration was found in rats treated with ethanol. This finding is compatible with the documented data, which reports a significant decrease of this lipoprotein particle in the plasma after long-standing ethanol consumption.64,65
Our results regarding BAL in ethanol-treated animals is in agreement with the recent study, which indicated that ethanol level decrease in blood of Wistar rats between 6 h and 24 h after acutely peroral alcohol consumption because ethanol is rapidly disappearing from the blood and is formed acetaldehyde. 66 Additionally, it is stated that the aldehyde is a reactive molecule that can be oxidized by acetaldehyde dehydrogenase into acetate. In such condition, higher acetaldehyde level in the body exerts toxic effects to various organs and tissues, including the heart. 67 Besides, in our study, the significantly higher BAL in calorie-restricted animals (40–50% of daily energy needs) treated with ethanol, may be related with oxidative liver injury. 68 On the other hand, the significantly lower BAL in CR60–70 + E group compared to E and CR40–50 + E group, is probably due to hepatoprotective effect of moderate CR. 68
Based on the obtained results, it can be concluded that moderate CR (restriction of food intake to 60–70% of daily energy needs) has a protective effect on acute ethanol-induced oxidative and nitrosative cardiac damage, at least partly due to maintainance of normal plasma lipid profile and alleviation of ethanol-induced decrease in SOD activity. The present study indicates that moderate CR may potentially be used for reducing cardiovascular disease risk and as a supportive method in the treatment and prevention of AHD progression. Reducing energy intake by controlled CR increases lifespan and protects various tissues against diseases, in part, by hormetic mechanisms that increase cellular stress resistance, 69 that is a highly regulated process controlled by a complex network of intracellular signaling pathways (vitagenes involved in preserving cellular homeostasis during stressful conditions). 70 Oxidative stress may be a potential mechanism of hormetic effects of CR on acute ethanol-induced cardiac injury. On the other hand, severe CR (restriction of food intake to 40–50% of daily energy needs) aggravates lipid peroxidation and nitrosative stress in the heart after acute ethanol intoxication and potentiates acute ethanol-induced cardiac damage. From the cellular point of view, oxidative stress leads to increase of NOx, which may be associated with lower NO bioavailability and increased production of peroxynitrite. This effect of severe CR is mediated partly by its synergistic effect with ethanol on decline of SOD activity and plasma concentration of SH groups.
Author contributions
DV, DM: writing the article (introduction, materials, discussion) and carrying out the experiment; MN: determination of oxidative/nitrosative stress parameters in the heart sample and describing methodology; VA: pathohistology findings and taking part in experiment; MS, RJV: biochemical analysis and methodology, and taking part in experiment; MNS, BJ: evaluation of statistical data; TR: corresponding author and project coordinator, and supervision of the research group.
Footnotes
ACKNOWLEDGEMENTS
This work was supported by the Ministry of Education and Science of Republic of Serbia, Grant No. 175015.