
Abstract
The effect of moderately extended, intermittent-hypoxia (IH) on cerebral perfusion during changes in CO2 was unknown. Thus, we assessed the changes in cerebral vascular conductance (CVC) and cerebral tissue oxygenation (ScO2) during experimental hypocapnia and hypercapnia following 14-day normobaric exposures to IH (10% O2). CVC was estimated from the ratio of mean middle cerebral arterial blood flow velocity (transcranial Doppler sonography) to mean arterial pressure (tonometry), and ScO2 in the prefrontal cortex was monitored by near-infrared spectroscopy. Changes in CVC and ScO2 during changes in partial pressure of end-tidal CO2 (PETCO2, mass spectrometry) induced by 30-s paced-hyperventilation (hypocapnia) and during 6-min CO2 rebreathing (hypercapnia) were compared before and after 14-day IH exposures in eight young nonsmokers. Repetitive IH exposures reduced the ratio of %ΔCVC/ΔPETCO2 during hypocapnia (1.00 ± 0.13 vs 1.94 ± 0.35 vs %/mmHg, P = 0.026) and the slope of ΔCVC/ΔPETCO2 during hypercapnia (1.79 ± 0.37 vs 2.97 ± 0.64 %/mmHg, P = 0.021), but had no significant effect on ΔScO2/ΔPETCO2. The ventilatory response to hypercapnia during CO2 rebreathing was significantly diminished following 14-day IH exposures (0.83 ± 0.07 vs 1.14 ± 0.09 L/min/mmHg, P = 0.009). We conclude that repetitive normobaric IH exposures significantly diminish variations of cerebral perfusion in response to hypercapnia and hypocapnia without compromising cerebral tissue oxygenation. This IH-induced blunting of cerebral vasoreactivity during CO2 variations helps buffer excessive oscillations of cerebral underperfusion and overperfusion while sustaining cerebral O2 homeostasis.
Introduction
Ventilation-related changes in arterial PCO2 affect cerebral blood flow, 1 since systemic arterial CO2 readily crosses the blood-brain barrier and alters pH of cerebral-spinal fluid.2–4 Altered cerebral pH causes vascular contraction or relaxation.2–4 The sensitivity and magnitude of cerebrovascular reactivity to changes in arterial PCO2 serve as a vital homeostatic function by blunting further changes in cerebral pH, and in turn play a pivotal role in central chemoreceptor control of ventilation. 1 Intermittent-hypoxia (IH) exposures which produce cyclic, intermittent decreases in cerebral tissue oxygenation 5 are known to enhance cerebral blood flow6,7 associated with an increase in metabolic rate. 8 Meanwhile, the hypoxia-stimulated ventilatory response decreases arterial CO2 9 and causes respiratory alkalosis,10,11 which may counteract the effect of hypoxia-evoked increase in cerebral blood flow. 12 Therefore, we postulated that the cerebral hemodynamic response to changes in CO2 or hypoxia could be altered as a result of adaptation to repetitive cyclic IH exposures.
The effect of IH on the cerebral blood flow response to hypoxia has been studied, but with disparate results.7,13,14 Kolb et al. 14 observed an augmented increase in cerebral blood flow velocity (CBFV) in the middle cerebral artery of healthy men during graded hypoxia with clamped CO2 immediately after continuous hypoxic exposure (∼13.8% O2) for 8 hours/night for five nights. However, when Ainslie et al. 13 evaluated the effect of 12-day cyclic 5-min exposure to 12% O2 intermittent with 5-min normoxia repeated for 90 min or 12-day continuous hypoxic exposure, they found that CBFV response to poikilocapnic-hypoxia was decreased. Querido et al. 7 exposed healthy humans to cyclic IH exposures: six bouts of inhalation of 12% O2 for 5 min followed by 5-min normoxia daily for 10 days. They found that 10-day IH exposures diminished the isocapnic-hypoxic stimulated increase in CBFV. 7 While these different findings may result from different hypoxic regimens (continuous vs intermittent exposures) or CO2 variations (poikilocapnic vs isocapnic hypoxia), the possibility that hypoxic exposures per se alter cerebrovascular sensitivity to CO2 variations must also be considered. Furthermore, the question remained as to what extent cerebral tissue oxygenation, in response to changes in arterial CO2 during hypocapnia and hypercapnia, might be altered following chronic hypoxic exposures.
Reduced cerebral vasoreactivity to hypercapnia is accompanied by an augmented ventilatory response,15,16 presumably resulting from an underperfusion-related decrease in cerebral tissue oxygenation 15 or a decrease in cerebral pH. 16 Consistent with this presumption, it was reported that the slope of ventilatory response to hypercapnia was increased in dogs after 2-week IH exposures. 17 These data suggested that cerebrovascular reactivity during hypocapnia and hypercapnia could be important in maintaining cerebral homeostasis, and that this cerebrovascular reactivity might be altered as a result of adaptation to repetitive, cyclic IH exposures. We hypothesized that changes in cerebral tissue oxygenation and cerebrovascular reactivity during variations in arterial CO2 would be diminished as a result of adaptation to repetitive IH exposures. The present study compared the sensitivity of cerebral vasoreactivity and cerebral tissue oxygenation in response to hypocapnia and to hypercapnia before and after 14 days of cyclic, moderate, normobaric-poikilocapnic IH exposures. Since arterial blood pressure was also affected by hypocapnia and hypercapnia, analysis of cerebral vasoreactivity was based on changes in cerebral vascular conductance index (CVC), as estimated from the ratio of mean CBFV to mean arterial blood pressure (MAP). Changes in CVC were then analyzed as ratios to changes in end-expired CO2, and index of arterial CO2.
Methods
Participants
Eight healthy non-smokers (5 men and 3 women, 24.8 ± 1.2 years old, 24.1 ± 1.1 kg/m2 BMI) voluntarily participated in the study. Both the study protocol and informed consent were reviewed and approved by IRB at UNT Health Science Center. All subjects underwent and passed a graded exercise stress test on a cycle ergometer (SCIFIT® Tulsa, OK) that confirmed them to be free of cardiovascular or pulmonary diseases, and they signed the informed consent. No subject had previously participated in any hypoxia or IH study or lived in an area ≥3000 feet above sea level. Prior to the experiment, all subjects were familiarized with the experimental procedures and measurements of the study. They were tested for a clear CBFV signal and ability to perform paced-hyperventilation at 1 Hz for 30 s.
Measurements
All measurements were made with the subject in the supine position and wearing a disposable face mask (VacuMed, Ventura, CA, USA). During the experiment, the subject’s heart rate (HR) was monitored from an electrocardiogram (BIOPAC, Santa Barbara, CA). Systolic and diastolic blood pressures (SBP and DBP) of the radial artery were measured continuously by tonometry (Colin Model 7000 tonometer, San Antonio, TX); these pressures were averaged electronically to provide MAP. Arterial blood pressure (ABP) measured in this manner in our laboratory has been found to be highly correlated with the pressure monitored by an intra-radial arterial catheter. 18 Systemic arterial O2 saturation (SaO2) and partial pressure of trans-cutaneous CO2 (PTCCO2) was continuously monitored from the subject’s earlobe by a radiometer sensor (TOSCA 500, Radiometer America Inc., Westlake, OH). CBFV in the middle cerebral artery was determined by transcranial Doppler (TCD) sonography using a 2 MHz probe (EZ-Dop DWL System, Singen, Germany) placed on the left temple. CVC was estimated from the ratio of mean CBFV to MAP. Regional cerebral tissue O2 saturation (ScO2) of the prefrontal cortex was monitored by near-infrared (NIR) spectroscopy (Somanetics, 4100 INVOS Cerebral Oximeter, Troy, MI) by a sensor placed on the right side of the forehead. These combined measurements of TCD sonography with NIR spectroscopy have been applied in our previous studies.19,20,21 Breath-by-breath partial pressures of end-tidal O2 and CO2 (PETO2 and PETCO2) were monitored by a mass spectrometer (Perkin-Elmer, 1100 Medical Gas Analyzer, St Louis, Missouri). Breathing frequency (fB) and tidal volume (VT) were measured by a Universal Ventilation Meter (UMV VacuMed). Analog data were continuously digitized online at 250 Hz by a computer interfaced with a data acquisition system (BIOPAC MP150).
Cyclic hypoxic exposures
The 14-day IH program was initiated with 5-min inhalation of 10.0 ± 0.2% O2 interspersed with inhalation of room air for 4 min for five cyclic hypoxic exposures on day 1. The 5-min hypoxia and 4-min normoxia cycles of intermittent hypoxia were increased one cycle daily through day 5, i.e. to 9 cyclic hypoxic exposures per session (or day). On day 6, the duration of hypoxic exposure was increased to 6 min without change in the duration for inhalation of room air. This 6-min cyclic hypoxia was increased to 10 exposures on day 7, which were maintained for the remainder IH program without change in the intermittent duration for inhalation of room air. The cumulative duration of IH exposures over 14 days was 11 h and 49 min. All subjects tolerated 14-day IH exposures with no adverse effects. This protocol was adopted because it was shown to be safe and effective in earlier IH animal and human studies.22–25
Hypo-/hypercapnia protocol
These experimental protocols were carried out during morning ≥ 24 h before exposures to IH on day 1 and 18–24 h after exposure to IH on day 14. All subjects were instructed to have a restful sleep and to avoid strenuous physical exercise and alcohol for a day and to avoid coffee ≥4 h before the testing. The subject remained relaxed and awake throughout the experiment. After ≥15 min of supine rest following instrumentation, the subject’s baseline HR, ABP, CBFV, SaO2, PTCCO2, ScO2, PETCO2, and PETO2 were continuously recorded for ∼3 min followed by the paced-hyperventilation and CO2-rebreathing procedures (see Figure 1). Paced-hyperventilation was performed by inspiring room air as deeply as possible at 1 Hz for ≥30 s. After recovery from this 30-s hyperventilation, CO2-rebreathing was performed for ≥6 min by breathing into and out of a 10 -L airbag pre-filled with ≤4% CO2, ≤40% O2, and balance N2. The initial 40% O2 in the airbag insured that the inhaled O2 was ≥21% throughout the CO2-rebreathing protocol.
21
Paced-hyperventilation and CO2-rebreathing protocol from one representative subject. From top to bottom, the analog data show tidal volume (VT), CO2, O2, middle cerebral arterial blood flow velocity (CBFV), regional cerebral tissue oxygenation (ScO2), arterial oxygen saturation (SaO2), arterial blood pressure (ABP), and heart rate (HR). Paced-hyperventilation at 1 Hz increases VT and decreases PETCO2. This hypocapnia induces a reactive cerebral vasoconstriction as indicated by a decrease in CBFV along with a fall in ABP. CO2 rebreathing causes a ramp increase in PETCO2 and hyperventilation. This hypercapnia causes a reactive cerebral vasodilation as indicated by increases in CBFV and ABP. During CO2 rebreathing, the fraction of inspired O2 is maintained above 21%, indicating an isolated hypercapnic stimulus without hypoxia. The beginning and the end of paced-breathing and rebreathing are marked by the gray bars at the top of the figure
Data analyses
Baseline data were averaged over 2 min prior to the hypo-/hypercapnia protocols. During hypocapnia, continuous data from the last 15 s of the 30 s paced-hyperventilation were averaged to produce one value for each variable. Ratios of %ΔCBVF/ΔPETCO2, %ΔCVC/ΔPETCO2, and %ΔScO2/ΔPETCO2 were assessed as indications of the cerebral vasoconstrictive response to decreased PETCO2. Responses before and after 14-day IH exposure were examined with paired t-tests. During hypercapnia, continuous data were averaged for the last 30 s of each minute during 6-min CO2-rebreathing. The slopes of CBFV, CVC, and ScO2 during this ramp-hypercapnia were analyzed using linear regression to assess the sensitivity of cerebral vasodilation in response to increased PETCO2. Differences in these slopes before and after 14-day IH exposure were compared using a general linear model procedure for analysis of covariance. Statistical analyses were performed using the software program Statistical Analysis System (SAS Version 9.1, Cary, NC). All data were reported as group mean and standard error (SE). Significance level was set at P ≤ 0.05.
Results
Baseline data
Data before and after 14-day intermittent hypoxic exposures

HR: heart rate; MAP: mean arterial pressure; SBP: systolic blood pressure; DBP: diastolic blood pressure; CBFV: mean cerebral flow velocity; CVC: cerebral vascular conductance; ScO2: cerebral tissue oxygenation; PETCO2: partial pressure of end tidal CO2; SaO2: arterial O2 saturation.
*Significant difference before and after 14-day IH exposure at P ≤ 0.05.
† and ‡Significant response at P ≤ 0.05 and P ≤ 0.01, respectively.The baseline values accurately reflected values prior to respective exposures to hypocapnia and to hypercapnia, i.e. variables returned to these respective baseline values after paced-breathing and prior to rebreathing.
Response to hypocapnia
Cerebral hemodynamic responses to hypocapnia and hypercapnia

Note: Response to hypocapnia is the ratio data during 30-s paced-hyperventilation. Response to hypercapnia is the slope data during 6-min CO2-rebreathing. CBFV: cerebral blood flow velocity; CVC: cerebral vascular conductance; ScO2; cerebral tissue oxygenation. P values indicate the group difference before and after based on paired t-test.
*Indicates a woman subject.
Response to hypercapnia
The progression of ramp-hypercapnia (i.e. the rate of increase in arterial CO2 associated with time) during 6-min CO2-rebreathing was similar before (2.25 ± 0.17 mmHg/min, R2 = 0.94) and after (2.37 ± 0.20 mmHg/min, R2 = 0.92) 14-day IH exposure (P = 0.592). As expected, minute ventilation and VT were significantly increased during CO2-rebreathing. The slopes of minute ventilation/PETCO2 and VT/PETCO2 were significantly diminished following repetitive IH exposures (Figure 2). Although breathing frequency was not correlated with increases in PETCO2, it was consistently less (P = 0.001) after 14-day IH exposure (Figure 2). Hypercapnia during CO2-rebreathing stimulated both HR and MAP (Table 1). This augmented tachycardia, along with a hypertensive response during CO2-rebreathing, was stimulated by the hypercapnia-mediated chemoreflex and by the volitionally augmented activity of respiratory muscles. The magnitude of tachycardia was smaller (P = 0.016, Table 1) after repetitive IH exposures, and the slope of HR/PETCO2 (before vs after: 0.92 ± 0.12 vs 0.55 ± 0.13 bpm/mmHg) was less steep (P = 0.049) after 14-day IH exposure. This difference was probably related to the reduced ventilatory effort resulting from the adaptation (Figure 2). The increased MAP, however, was not affected by IH exposures; the slopes of MAP/PETCO2 were not different (P = 0.353) before and after IH exposures (0.30 ± 0.04 vs 0.39 ± 0.08 mmHg/mmHg).
Ventilatory response to ramp-hypercapnia during 6-min CO2 rebreathing (n = 8). Increases in tidal volume (VT) and minute ventilation are significantly correlated with hypercapnia; however, breathing frequency is not increased with PETCO2. Chronic IH exposures significantly diminish the responses of VT and ventilation during ramp-hypercapnia – the slopes are 0.075 ± 0.004 (R2 = 0.97) vs 0.058 ± 0.005 (R2 = 0.93) L/mmHg for VT (P = 0.007) and 1.14 ± 0.09 (R2 = 0.94) vs 0.83 ± 0.07 (R2 = 0.93) L/min/mmHg for minute ventilation (P = 0.009) before vs after 14-day IH exposures. In addition, breathing frequency is consistently lower (P = 0.001) after than before chronic IH exposures. Solid line and dash line indicate the regression lines before and after IH exposures, respectively
Hypercapnia stimulated cerebral vasodilation, as indicated by significant increases in CBFV, CVC, and ScO2 (Table 1). These changes were similar before and after 14-day IH exposure. However, the relative increases in CBFV and CVC per unit hypercapnia were significantly less after 14-day IH exposure (Table 2), indicating that adaptation to repetitive IH exposures blunted the cerebral vasodilatory reaction to hypercapnia. As with hypocapnia, the responses of ScO2 per unit increase in PETCO2 were not significantly different before and after IH exposures (Table 2). Nonetheless, the slopes of the increases in ScO2 per unit increase in CBFV or CVC during hypercapnia were significantly greater (P = 0.001) following 14-day IH exposure, suggesting an enhanced cerebral tissue oxygenation in terms of unit cerebral vasodilation (Figure 3).
Correlation of increases in cerebral tissue oxygenation (ScO2) with cerebral vasodilation during 6-min CO2 rebreathing (n = 8). Chronic IH exposures significantly increase both the slopes of ScO2/CBFV and ScO2/CVC during ramp-hypercapnia – after vs before: the slopes of ScO2/CBFV 0.46 ± 0.02 vs 0.30 ± 0.01 (P = 0.001), and the slopes of ScO2/CVC 0.54 ± 0.03 vs 0.36 ± 0.02 (P = 0.001). Solid line and dash line indicate the regression lines before and after IH exposures, respectively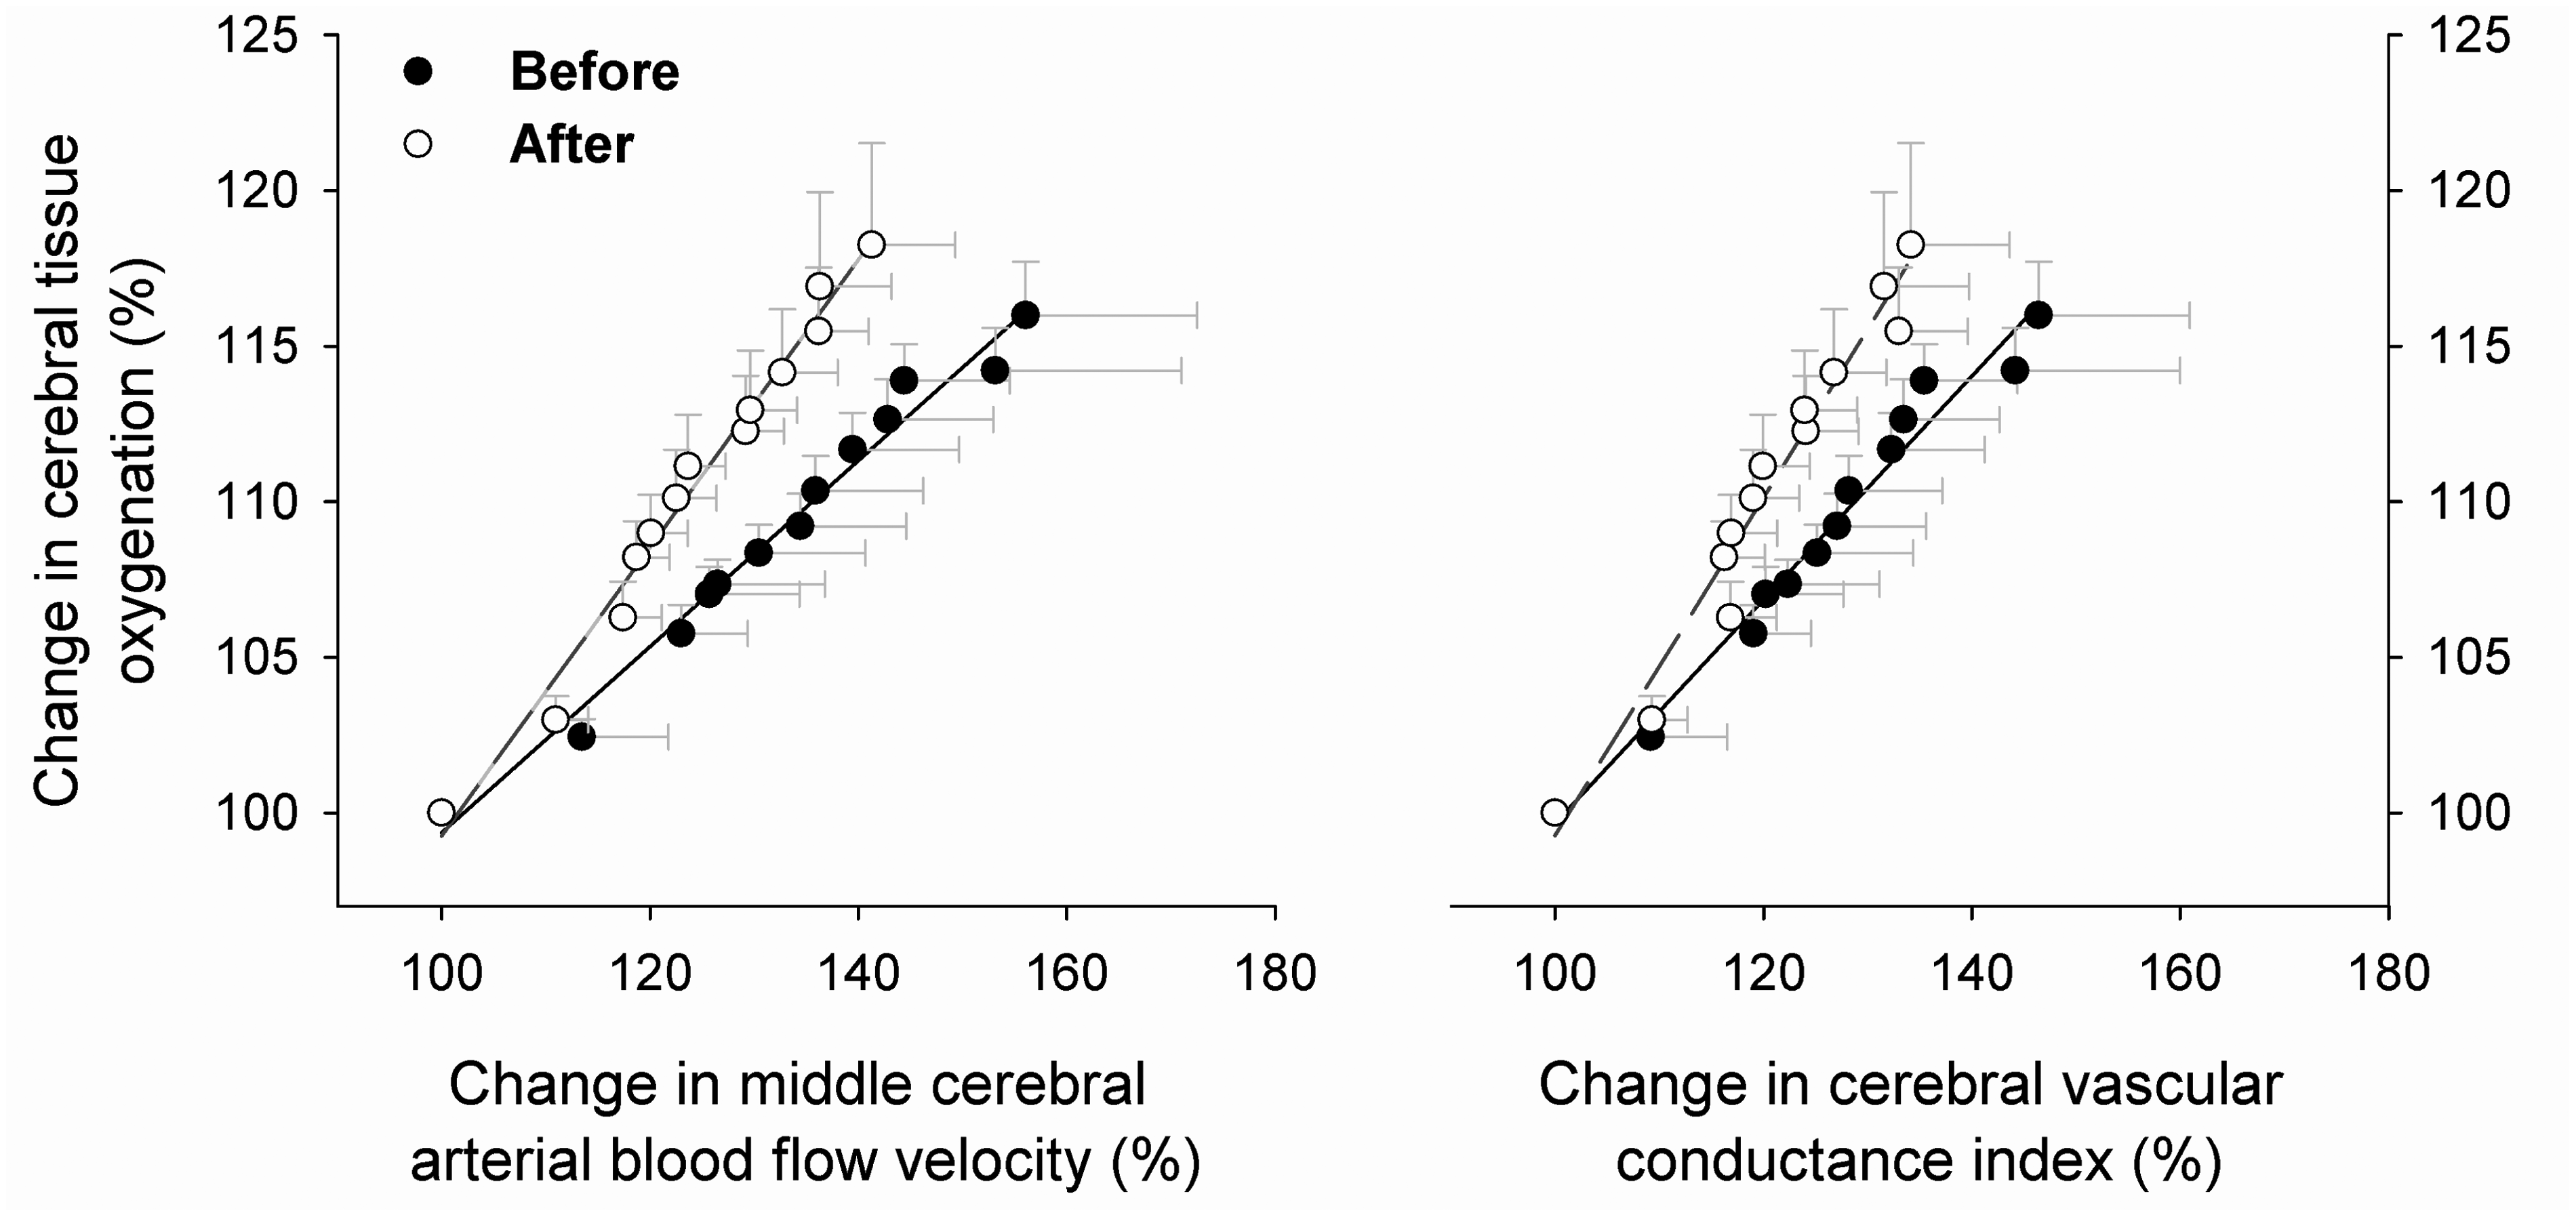
Discussion
The major finding of the present study is that variations of cerebral perfusion in response to hypocapnia and hypercapnia are diminished after 14-day normobaric IH exposures, whereas the responses of cerebral tissue oxygenation are not altered. Furthermore, the ventilatory response during ramp-hypercapnia was significantly attenuated along with the reduced tachycardia after IH adaptation. CVC data indicate that 14-day IH exposures blunt excessive fluctuations of cerebral perfusion to variations in CO2 despite changes in arterial blood pressure.
Cerebral vasoreactivity to changes in CO2 is impaired by endothelial dysfunction, 26 metabolic syndrome, 27 and cerebral microangiopathy. 28 The effect of intermittent hypoxia on this vasoreactivity is controversial. Previous studies reported that cerebral vasodilation in response to hypercapnia was diminished in patients with obstructive sleep apnea (OSA).29,30 However, later studies showed that cerebral vasodilation was not significantly different between OSA patients and healthy subjects in response to step-elevation of CO2 for 2 min 31 or 10 min. 32 Therefore, reduced cerebral vasodilation in response to elevated CO2 does not necessarily diminish cerebrovascular functional reserve. The current observations support this view. Although variations of cerebral perfusion to both hypocapnia and hypercapnia were reduced following 14-day IH exposures, changes in cerebral tissue oxygenation were not diminished, demonstrating well-maintained cerebral O2 homeostasis. By reducing cerebral vasoreactivity without compromising cerebral functional reserve, adaptation to IH provided protection against excessive cerebral hypoperfusion and hyperperfusion associated with CO2 variations. 33
Since a decrease in cerebrovascular response to CO2 may diminish the capacity for cerebral perfusion necessary to maintain normal pH in the central nervous system, ventilatory overshoots and undershoots may accompany diminished cerebrovascular reactivity.16,34 However, Foster et al. 32 observed that neither the hypercapnia-stimulated cerebrovascular response nor the hypercapnia-stimulated ventilatory response was significantly different between OSA patients and healthy subjects. Querido et al. 7 reported that the diminished sensitivity of CBFV to a hypoxic stimulus following 10-day IH exposure was not associated with significant changes in the hypoxic ventilatory response. Somogyi et al. 11 showed that the slope of the hypercapnia–hyperventilation stimulus–response relationship during rebreathing was not different in healthy subjects before and after 5 days at 3480 m altitude, although the threshold of hypercapnia-stimulated hyperventilation was shifted to a lower PETCO2 level. These previous findings indicated that a diminished cerebrovascular response to CO2 following hypoxic exposures was not obligatory for augmentation of the ventilatory response. Furthermore, the present study showed that hypercapnia-stimulated hyperventilation was actually attenuated after repetitive IH exposures (Figure 2), even though cerebrovascular-CO2 reactivity was reduced. Collectively, these data suggest that the reduced variations of cerebral perfusion in response to CO2 fluctuations after 14-day IH exposures do not cause unstable ventilatory control in healthy subjects. This observation provides additional support for the hypothesis that reduced variations of cerebral perfusion following adaptation to IH does not disturb cerebral homeostasis.
The primary factors that influence cerebral blood flow include systemic blood viscosity, sympathetically mediated systemic and cerebral vasomotor tone, pH, and metabolites in the cerebrospinal fluid. An increase in hematocrit augments blood viscosity, which might decrease CBFV by increasing resistance. Data are inconclusive with regard to the effect of IH exposures on hematocrit in healthy humans. Some studies indicated that hematocrit and hemoglobin concentration were increased following 14 days 35 or 14 nights 36 of cyclic IH exposures. In a protocol more similar to that of the present study, Gracia et al. 37 found no significant change in hematocrit following 2-h daily hypoxic exposure with 13% O2 for 12 days. Since baseline CBFV was not significantly changed after 14-day IH exposures (Table 1), any hypoxia-induced increase in blood viscosity in the present study was minimal or was counteracted by other regulatory mechanisms.
Although vasomotor response to norepinephrine was diminished in rat blood vessels after 14-day IH exposures, 38 cyclic IH has no significant influence on muscle sympathetic nerve activity in healthy humans. 39 In the present study, neither baseline ABP nor ABP responses were different before and after 14-day IH exposures (Table 1). Thus, any difference in sympathetic influence on cerebral vasomotor tone (i.e. CVC) before and after repetitive IH exposures was most likely insignificant in the present study.
Maintenance of normal pH in the cerebral tissue is critically dependent on buffer mechanisms and on regional perfusion. Similar changes in ScO2 during hypocapnia and hypercapnia before and after 14-day IH exposures suggested that chronic IH exposures did not compromise mechanisms that regulate cerebral tissue perfusion and oxygenation. In contrast, a small but statistically significant increase in baseline ScO2 was observed after 14-day IH exposure (Table 1), consistent with the notion that chronic hypoxia may cause microvascular angiogenesis 12 and improve perfusion-related oxygen-carrying capacity or cerebral tissue oxygenation (Figure 3). This factor may explain the very modest decreases in ScO2 observed during hypocapnia despite larger decreases in CBFV. Therefore, we conclude that reduced cerebral vasoreactivity in response to paced-hyperventilation-induced hypocapnia and CO2-rebreathing-induced hypercapnia after 14-day IH exposures provides less volatile fluctuations of cerebral perfusion without compromising cerebral tissue oxygenation homeostasis.
Although TCD sonography has been used extensively to measure CBFV by our laboratory19–21 and by others,6,7,14,32,40 it must be recognized that alterations of vascular diameter would affect this estimation of cerebral blood flow. However, the cross-sectional area of the human middle cerebral artery has shown no significant changes with variations in arterial O2 or CO2.41,42
Hypocapnia induced mild systemic hypotension and hypercapnia induced mild hypertension (Table 1). By an autoregulatory mechanism, these changes in MAP could have affected cerebral conductance during hypocapnia and hypercapnia independent of effects of CO2. However, differences in MAP during hypocapnia and hypercapnia were only ∼1 mmHg before and after 14-days IH (Table 1). Thus, it seems unlikely that the significant differences in cerebral conductance as functions of ΔPETCO2 during hypocapnia and hypercapnia after 14-days IH (Table 2) could be attributed to significant differential autoregulatory responses of CVC. Thus, we conclude that the significant changes in %ΔCVC/ΔPETCO2 observed after 14-day IH exposure (Table 2) reflect altered cerebral vasoreactivity to CO2.
Conclusion
In conclusion, our data indicate that 14-day normobaric IH exposures significantly reduce the fluctuations of cerebral perfusion to variations in arterial CO2 without change in the response of cerebral tissue oxygenation. Since cerebral tissue O2 homeostasis was not compromised by diminished cerebral vasoreactivity, this cerebrovascular adaptation to chronic IH exposures would be beneficial by protecting against excessive cerebral overperfusion and underperfusion during hypocapnia and hypercapnia. Furthermore, as a result of adaptation to chronic IH exposures, this cerebrovascular hypo-reactivity to changes in arterial CO2 is associated with a diminished ventilatory response along with reduced tachycardia during hypercapnia.
Footnotes
Authors’ contributions
PZ, XS, and HFD designed the experiments. PZ and XS conducted the experiments. PZ and XS analyzed the data. HFD and XS wrote the manuscript.
Acknowledgements
We sincerely thank our volunteer subjects for their cheerful cooperation. This study was supported in part by the University of North Texas Health Science Center Foundation and by a Government Scholarship from People’s Republic of China to Dr. Peizhen Zhang.