
Abstract
This study evaluated the effects of moderate regular physical exercise on lipid peroxidation, inflammation and renal function and structure in streptozotocin (STZ)-induced ovariectomized diabetic rats. Twenty-four Wistar rats were anesthetized and submitted to bilateral ovariectomy. The rats were divided into four experimental groups: ovariectomized control (OC), ovariectomized trained control (OTC), ovariectomized diabetic (OD), ovariectomized trained diabetic (OTD). The OTD and OTC groups were submitted to treadmill running for four weeks before to diabetes mellitus (DM) induction with STZ (40 mg/kg, i.v) or vehicle injection, respectively, and continued the training for another eight weeks after the injections. Urine samples were collected 24 h after the last training session, and blood samples and kidneys were collected after euthanasia. Our results showed that physical exercise attenuated the loss of body weight and postprandial glucose and improved physical capacity in the OTD group. Lower serum creatinine levels, glycosuria, and proteinuria were also observed in this group. There was no difference in 17β-estradiol levels between the experimental groups. The glomerular and tubulointerstitial changes were attenuated in the OTD group. Expressions of macrophages, lymphocytes, fibronectin, TGF-β1, and NF-κB were reduced in the glomeruli of OTD group. Exercise also reduced macrophages, lymphocytes, and TGF-β1 expression in the tubulointerstitial compartment of the renal cortex of this group. In addition, increased levels of TBARS in the renal cortex of diabetic rats were prevented by exercise in the OTD group. In conclusion, our study shows that physical exercise exerted a renoprotective effect against the progression of diabetic kidney disease in ovariectomized rats.
Impact statement
To date, no studies have been found evaluating the effects of physical exercise on renal function and structure changes in ovariectomized rats with type 1 diabetes. Therefore, this work emerges with an important tool for strengthening and expanding innovative research on exercise with potential for the prevention of renal diseases in ovariectomized diabetic rats, and future development of studies that seek to increase scientific knowledge about the beneficial effects of physical exercise on renal diseases in humans.
Introduction
Diabetic kidney disease (DKD) is a microvascular complication considered as one of the main causes of end-stage renal disease.1,2 The first sign of DKD is microalbuminuria, 3 which without specific interventions may progress to proteinuria, or nephrotic syndrome, and decline in renal function. 4 During the progression of DKD, histopathological features such as glomerular basement membrane thickening, extracellular matrix (ECM) protein accumulation, glomerulosclerosis and structural changes in the tubulointerstitial compartment are observed, which may lead to fibrosis in the renal parenchyma.5–7
Multiple factors has been implicated in the development and progression of DKD, including the action of profibrotic cytokines, oxidative stress, and infiltration of inflammatory cells. 8 Hyperglycemia caused by DM increases the production of reactive oxygen species (ROS), which drive the development of DKD and are associated with signs that lead to progression of renal complications.9,10 Thus, high levels of ROS contribute to the lipid peroxidation of cell membranes, 11 causing abnormalities in the vascular endothelium, 12 stimulating the expression of genes involved in inflammatory pathways such as TGF-β19 and being related to the activation of NF-κB. 13 NF-κB is an important pro-inflammatory transcriptional regulator considered as a key mediator for the infiltration of inflammatory cells and increased expression of TGF-β1 in the diabetic kidney.14,15 On the other hand, the TGF-β1 enhances the inflammatory response, stimulates the proliferation of fibroblasts and the synthesis of various ECM proteins, including fibronectin and colagens. 16
Evidence suggests that the reduction of female sex hormones seems to play an important role in the susceptibility and progression of DKD. Thus, studies demonstrated that ovariectomy was associated with the development of albuminuria, mesangial expansion, accumulation of ECM, glomerulosclerosis, and tubulointerstitial fibrosis in rats with type 1 DM,17,18 whereas 17β-estradiol replacement reduced the lesions in these animals. 17β-estradiol replacement was also beneficial in the treatment of DKD and hypertension.17,19 However, non-pharmacological interventions have gained increasing attention in recent years, such as physical exercise, in order to prevent and/or delay the progression of DKD.
Moderate-intensity exercise appears as an important intervention in managing diabetes, since studies have shown its benefits related to the attenuation of microvascular complications, increased insulin sensitivity, improved renal function 20 and oxidative stress control.21,22 Studies demonstrate also that exercise reduced the number of lymphocytes and the expressions of NF-κB and TGF-β1 in kidneys of rats with DKD.23,24 Recent studies have also shown that physical preconditioning was effective in reducing renal damage in a model of acute 25 and chronic 26 renal injury. Furthermore, Ranjbar et al. 27 demonstrated that exercise improved renal and hepatic damage in rats with myocardial infarction. Additionally, Souza et al. 28 showed that exercise improved autonomic function and reduced mortality in ovariectomized diabetic rats. 28 Conti et al. 29 demonstrated that exercise training attenuated the metabolic alterations induced by fructose overload in ovariectomized spontaneously hypertensive rats. In this perspective, since there are few studies investigating the relationship between diabetes, renal lesions and physical exercise, especially in conditions of decreased levels of ovarian hormones, we aimed to evaluate the effects of moderate exercise training on the DKD in STZ-induced ovariectomized diabetic rats.
Materials and methods
Animals and ovariectomy surgery
A total of 24 Wistar rats with 12 week old, weighing 180–200 g, were housed under controlled environmental conditions (12-h light/dark cycle and 23 ± 3°C) with food and water ad libitum. The rats were anesthetized with xylazine (6 mg/kg) and ketamine (40 mg/kg) and submitted to bilateral ovariectomy. 17 Two weeks after surgery, the animals were divided into four groups, diabetic (yes/no) and trained (yes/no). In this manner, the animals were randomly assigned in the following groups (n = 6/each): ovariectomized control (OC), nondiabetic and sedentary animals; ovariectomized trained control (OTC), nondiabetic and trained animals; ovarectomized diabetic (OD), diabetic and sedentary animals; and ovariectomized trained diabetic (OTD), diabetic and trained animals. The experimental protocol of this study was approved by the Ethics Committee on Animal Experimentation of the IMS/UFBA (Protocol No. 008/2013). All experimental procedures were conducted according of the National Institutes of Health Guide for the Care and Use of Laboratory Animals.
Diabetes mellitus induction
The animals of the OD and OTD groups received a single intravenous injection of STZ (Sigma-Aldrich, USA), at the dose of 40 mg/kg, diluted in 0.1 M citrate buffer for induction of type 1 diabetes mellitus. Control group animals received intravenous injection of 0.1 M citrate buffer. One week after STZ injection, diabetes was confirmed by fasting blood glucose using a digital glucometer (Accu-Check Active glucose strips, Roche-Mannheim, Germany). Animals with glycemia equal to or greater than 250 mg/dL were considered diabetic.
Maximal running test
The animals have been kept on a stop motorized treadmill (AVS Projetos – SP, Brazil) for 5 min for three days for adaptation purposes, and climatization for five days at 5 m/min. After this period, the animals were submitted to a maximum running test (1 m/min increments every 3 min up to the rat achieve exhaustion) on three alternate days to determine the exercise training intensity and the aerobic capacity. This test was performed at the beginning, at the end of the fourth week, and at the end of the training protocol. 23
Exercise training protocol
In the fifth month of life, the OTD and OTC groups started the previous exercise training for four weeks prior to STZ or vehicle injections, respectively (Figure 1). The previous exercise training consisted of running on a treadmill with a volume of 20 min in the first week, and increments of 10 min per week until the animal reach the maximum volume of 1 h at the end of the fourth week. Exercise intensity was progressively increased from 55 to 70% of the maximum capacity reached by the animal in the maximum running test. 20 This protocol was performed at 0% inclination of the treadmill for five consecutive days per week, which is considered as an exercise of moderate intensity for diabetic rats.20,22 Then, the OTC and OTD groups started the experimental post-induction diabetes period, which consisted of eight weeks of exercise for 60 min, five days a week (Figure 1).23,24,30 Forty-eight hours after the last exercise session, the animals were placed in metabolic cages for 24-h for urine collection. Subsequently, the animals were euthanized by decapitation to collect blood samples. The left kidney was removed, weighed, and fixed in methacarn solution for histological and immunohistochemical studies. The right kidney was frozen in liquid nitrogen and stored at −80°C to determine protein expression of TGF-β1, thiobarbituric acid reactive substances (TBARS) levels and activity of the enzyme glutathione peroxidase (GPx).
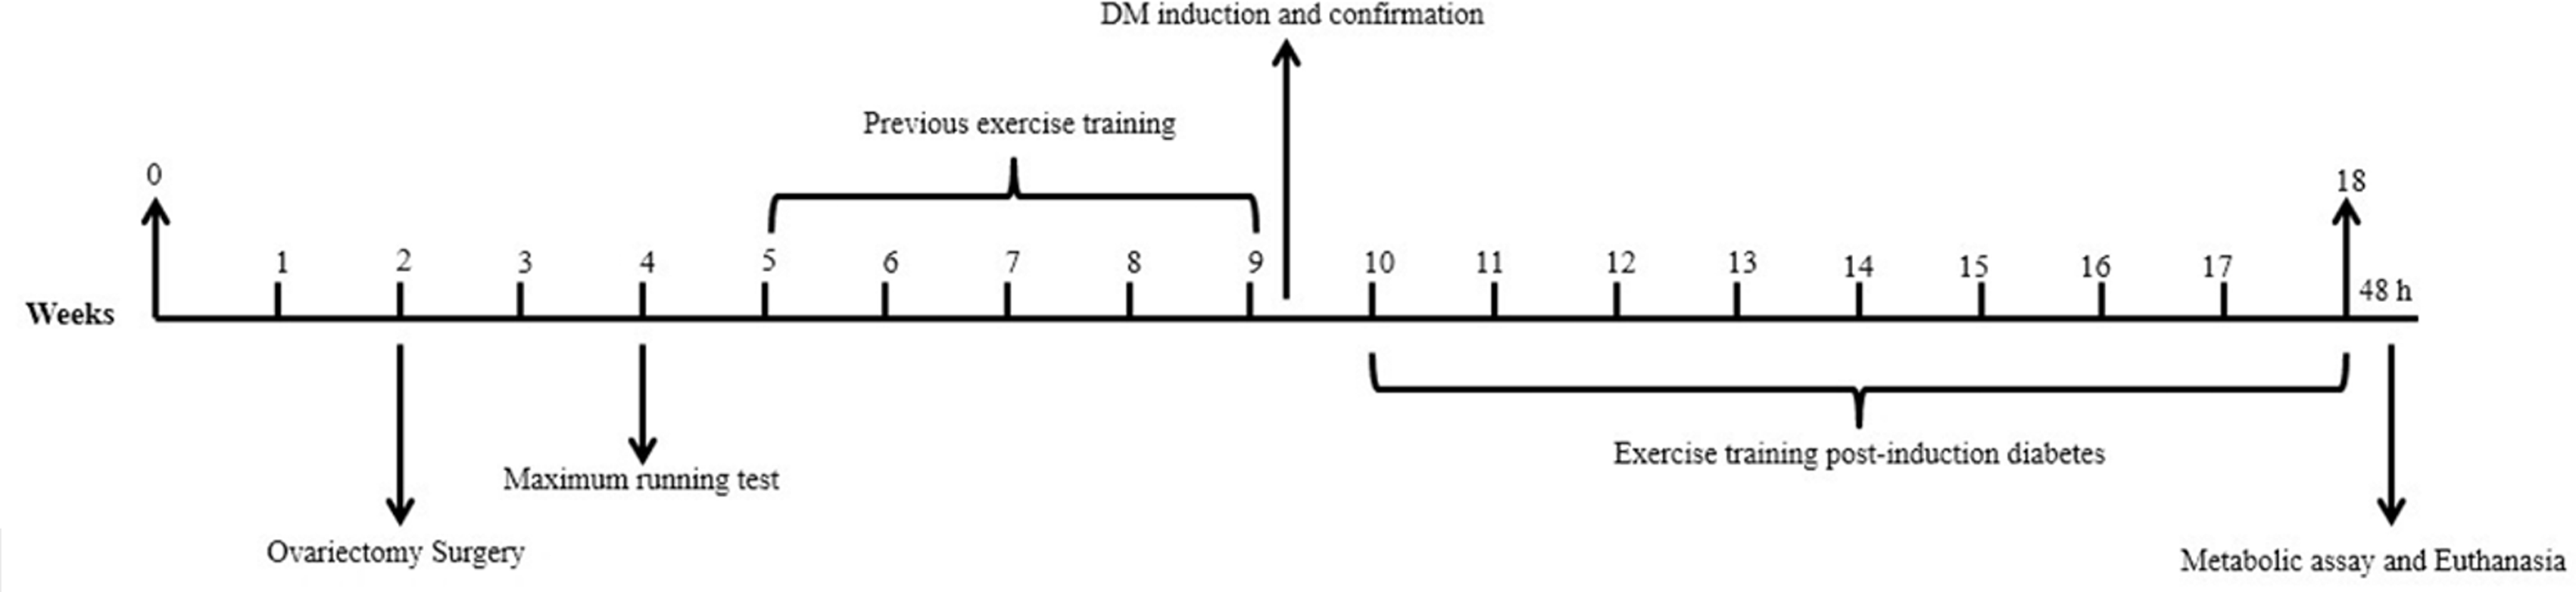
Experimental design. 0–2, acclimation; 2, ovariectomy surgery; 2–4 surgical recovery; 5, maximum running test; 5–9 previous exercise training in the OTD and OTC groups (4 weeks); 9–10, DM induction and confirmation in diabetic groups; 10–18, continuation of exercise training in the OTD and OTC groups (8 weeks); 48 h, metabolic assay and euthanasia.
Body weight and kidney weight
The body weight was measured weekly (Acculab®). Immediately after euthanasia, the kidneys were removed, decapsulated, and weighed in analytical balance. The kidney’s weight was calculated by the mean of right and left kidneys weights corrected for body weight.
Postprandial glycemia, glycosuria, and serum levels of 17β-estradiol
Postprandial glycemia and 17β-estradiol levels were evaluated in serum samples collected after euthanasia. Glycosuria was determined in urine samples collected in metabolic cages 48 h after the last exercise session. Glycemia and glycosuria were measured by colorimetric method using an automated biochemical analyzer (Beckman Coulter AU480) and serum 17β-estradiol levels by chemiluminescence using an automated immunoassay (Beckman Coulter DXI 680).
Renal function
Creatinine analysis was performed in serum and urine samples and the glomerular filtration rate (GFR) was calculated by creatinine clearance. Sodium and potassium measurements were performed by photometry for the determination of the fractions of excretion of these ions. Urinary flow was determined from total volume of urine in 24 h. Proteinuria and urinary and serum creatinine were measured by colorimetric method. These renal function parameters were analyzed using an automated biochemical analyzer (Beckman Coulter AU 480).
Renal morphology
Glomerulosclerotic index
The renal tissue was parafinized, sliced 4 μm thickness, and stained with Periodic Acid Shift (PAS) for evaluation of glomerulosclerosis through light microscopy (Olympus BX51 - Japan). Focal segmental glomerulosclerosis (FSGS) was evidenced by segmental increases in glomerular matrix and segmental obliteration or dilation of the glomerular capillary lumen. One hundred glomeruli per section were randomly selected for analysis and the FSGS was classified according to Saito et al. 31 on a scale of 0 to 4 (grade 0 = normal glomeruli; grade 1 = sclerotic area up to 25%; grade 2= sclerotic area 25–50%; grade 3 = sclerotic area 50–75%; grade 4 = sclerotic area 75–100%). The glomerulosclerotic index (GSI) was calculated using the following formula: GSI=(1xn1)+(2xn2)+(3xn3)+(4xn4)/nT, where nx is the number of glomeruli in each grade of glomerulosclerosis, and nT is the sum of glomeruli evaluated. The analysis of all the procedures was performed with the observer blinded to the treatment groups.
Glomerular morphometry
To analyze the area of the glomerular tuft, histological sections of 4 μm were stained with PAS and 70 glomeruli (50 cortical and 20 juxtamedullary) per section were photographed through a microscope-coupled camera (Olympus BX51 – Japan). The outer borders of each glomerular tuft were delimited manually on a video screen. The encircled areas were determined by computerized morphometry through the ImageJ 1.44p program (National Institute of Health, USA).
Glomerular fibrosis
For evaluation of glomerular fibrosis, histological sections of 4 μm were stained with Masson's Trichrome. Seventy glomeruli (50 cortical and 20 juxtamedullary) per section were photographed through a camera coupled under the microscope (Olympus BX51 – Japan), and the areas marked with Masson's Trichrome were identified and quantified by ImageJ 1.44p program (National Institute of Health, USA). The marked area was corrected for the total area of the glomerular tuft and the results were expressed as percentage.
Tubulointerstitial lesions
To evaluate the tubulointerstitial lesions, 4 µm histological sections were stained with hematoxylin-eosin (HE). The tubule interstitial damages were characterized as tubular lumen dilation, hydropic degeneration, brush border loss, tubular necrosis, and inflammatory cell infiltrate. We analyzed 30 grid fields (0.087 mm2 each) per section of the kidney cortex and the damages were graded according to Shih et al. 32 on a scale of 0 to 4 (0 = normal; 0.5= small focal areas; 1= involvement of less than 10% of the cortex and outer medulla; 2 = 0–25% involvement of the cortex and outer medulla; 3 = 25–75% involvement of the cortex and outer medulla; 4 = extensive damage involving more than 75% of the cortex and outer medulla). After this analysis, a stratified quantification was performed in which the number of tubules with each of the changes was divided by the total number of tubules per field and multiplied by 100. The data were presented as percentage of lesioned tubules. 33 These changes were quantified by computerized method through ImageJ 1.44p program (National Institute of Health, USA). The analysis of all the procedures was performed with the observer blinded to the treatment groups.
Immunohistochemical studies
Histological sections of renal tissue were incubated for 1 h at room temperature with the monoclonal anti-ED1 antibody (1:1000) (Santa Cruz Biotechnology, Santa Cruz, CA, USA) and overnight at 4°C with the following antibodies: anti-vimentin (1:100) (Santa Cruz Biotechnology, Santa Cruz, CA, USA; sc-6260); anti-TGF-β1 polyclonal (1:50) (Santa Cruz Biotechnology, Santa Cruz, CA, USA; sc-146); polyclonal anti-fibronectin (1:500) (Chemicon, Temecula, CA, USA; AB1954); anti-CD43 (1:100) (Santa Cruz Biotechnology, Santa Cruz, CA, USA, sc-53044) and polyclonal anti-NF-κB (p65) (1:100) (Abcam, Cambridge, UK, ab7970). The product of the reactions was detected with the avidin-biotin-peroxidase complex (Vector Laboratories, Burlingame, CA, USA) and the color reaction was developed with 3,3-diaminobenzidine (Vector Laboratories, Burlingame, CA, USA). Nonspecific protein binding was blocked by incubation with 20% goat serum for 30 min. Negative controls were performed by replacing the primary antibodies with equivalent concentrations of normal rabbit IgG. The quantification of immunoreactivity for ED-1, CD43, and NF-κB p65 was performed by the number of cells with positive labeling in glomeruli and the cortical tubulointerstitial compartment of the renal cortex. To quantify the immunoreactivity for vimentin, TGF-β1, fibronectin, and NF-κB p65, we evaluated 70 glomeruli (50 cortical and 20 juxtamedullary) and 30 tubulointerstitial compartment fields of the renal cortex (0.245 mm2) per section through the ImageJ 1.44p program (National Institute of Health, USA), and we express the results as percentage. The analysis of all the procedures was performed with the observer blinded to the treatment groups.
Western blot analysis
Renal tissue samples were homogenized in isolation solution (200 mM mannitol, 80 mM HEPES and 41 mM KOH, pH 7.5) containing a cocktail of protease inhibitors (Sigma Chemical Company, St. Louis, MO, USA) using the homogenizer (Polytron-PT 10–35, Brinkmann Instruments, Westbury, NY, USA). The homogenates were centrifuged at 2000g for 15 min at 4°C for removal of nucleus and cell debris. The supernatants were isolated and the protein was determined by the Bradford assay (Bio Agency Laboratories, São Paulo, Brazil). The proteins were separated according to the molecular weight in polyacrylamide gels by electrophoresis and transferred to a nitrocellulose membrane (PVDF, GE Healthcare Limited, Little Chanfont, UK) using transfer buffer (Tris/Glycine/metanol20%). The membrane was blocked for 60 min with 5% skim milk (Molico®) in TBS-T (24.2 g Trisbase, 29.2 g NaCl, 3.36 g EDTA/L, and 0.1% Tween-20, pH 7.4). Primary incubation was done with anti-TGF-β1 (1:200) antibody in TBS-T solution, overnight at 4°C (Santa Cruz Biotechnology, CA, USA; sc-52892). To determine the equivalence of protein loading, the membranes were incubated with anti-α-actin antibody (1:5000) (Santa Cruz Biotechnology, CA, USA; sc-32251). Blots were washed and incubated with the anti-rabbit secondary antibody, 1:1000 (Santa Cruz Biotechnology, Santa Cruz, CA, USA) for 1 h at room temperature. The immunoreactive proteins were visualized by chemiluminescence by Alience 4.7 Uvitec gel (Cambridge, Cambs, UK). Densitometry was used to quantitatively analyze protein levels, normalizing the bands by actin expression. 34
Thiobarbituric acid reactive substances assay
Lipid peroxidation was evaluated by the measurement of thiobarbituric acid reactive substances (TBARS) in the homogenate of the renal cortex, using the method of Draper et al. 35 and following the TBARS Assay kit instructions (TCA Method, Cayman Chemical, USA). Renal cortex of the right kidney was homogenized in RIPA buffer (Sigma-Aldrich) and centrifuged at 1600g for 10 min at 4°C. Renal cortex homogenates (100 μL) were mixed in 100 μL of 10% trichloroacetic acid and 800 μL of thiobarbituric acid. The reaction mixture was incubated for 1 h in water bath and the tubes were transferred to an ice bath in order to stop the reaction. After 10 min, the samples were centrifuged (1600g, 10 min at 4°C) and the supernatant was read in a spectrophotometer (BEL Photonics®) at wavelength of 532 nm. TBARS levels were calculated based on the curve made with the malondialdehyde standard (Cayman Chemical, USA). Protein concentration in the renal homogenate was determined by Braford assay (Sigma-Aldrich, USA). Finally, the TBARS (μM) concentration of the renal cortex was normalized by the protein concentration (mg/mL) and expressed in μM/mg/mL.
Activity of the enzyme glutathione peroxidase (GPx)
The measurement of GPx enzyme activity was done according to method proposed by Paglia and Valentine
37
with adaptations. The method is based on GPx catalyzed oxidation of reduced glutathione (GSH) coupled with the recycling of oxidized glutathione (GSSG) through the reaction catalyzed by the enzyme glutathione reductase (GR) using NADPH as a cofactor. The decrease in absorbance measured at 340 nm during oxidation of NADPH is indicative of GPx activity. Kidney tissue was homogenized in 50 mM Tris HCL buffer, pH 7.0 (assay buffer) at a ratio of 100 mg/mL. After centrifugation at 10,000g for 15 min at 4°C (Z 36 HK, Hermle-Labortechnik, Germany), the supernatant was removed and used in the assay; 300 μL of assay buffer, 250 μL of homogenate diluted in assay buffer (1:10), and 400 μL of the reaction mix (0.25 mM NADPH, 2.1 mM GSH, 0.5 U/mL GR and 1 mM sodium azide). Sodium azide was added to the medium to inhibit catalase which also uses hydrogen peroxide as the substrate. The reaction was initiated by the addition of 50 μL of 0.2 mM H2O2, used as the reaction substrate. The decomposition of NADPH was monitored in a spectrophotometer (SP 2000 UV, BEL® Photonics, Brazil) at 340 nm. Consecutive readings were taken every 15 s for 6 min. The GPx activity was calculated using the formula described:
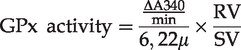
ΔA340 is the absorbance delta per minute;
6.22 is the molar extinction coefficient of NADPH in units of μmol−1 cm−1;
RV is the reaction volume in mL;
SV is the sample volume in mL.
An enzyme unit is defined as the amount of enzyme that causes the oxidation of 1 μmol of NADPH per minute at 25°C. The specific activity was expressed in units per mg of protein (U/mg protein).
Statistical analysis
The results were expressed as mean ± standard deviation (SD) or with medians and percentile 25 and 75. The data were compared with two-way and one-way analysis of variance with Bonferroni and Newman–Keuls post hoc analysis, respectively. For data that did not present normal distribution, Kruskal–Wallis non-parametric test was used followed by the Dunn post-test. The significance level was established as P < 0.05. The statistical program used was Graph Pad Prism, version 5 (Graph Pad Software, San Diego, CA, USA).
Results
Maximum running test, body weight, and kidney weight
The physical exercise increased the physical capacity in the OTD rats when compared to the OD group (P = 0.02) (Table 1). The training also improved the physical capacity of the OTC group compared to the OC group (P = 0.02) (Table 1). The physical exercise attenuated the reduction of the body weight induced by diabetes in the animals of the OTD group (interaction between diabetes and exercise, P = 0.0003). All ovariectomized animals of the OD and OTD groups presented increased relative weight of the kidneys when compared to their respective controls (P < 0.0001) (Table 1).
Maximum running test, body weight, kidney weight, postprandial glycemia and glycosuria of ovariectomized control (OC), ovariectomized trained control (OTC), ovarectomized diabetic (OD), ovariectomized trained diabetic (OTD).
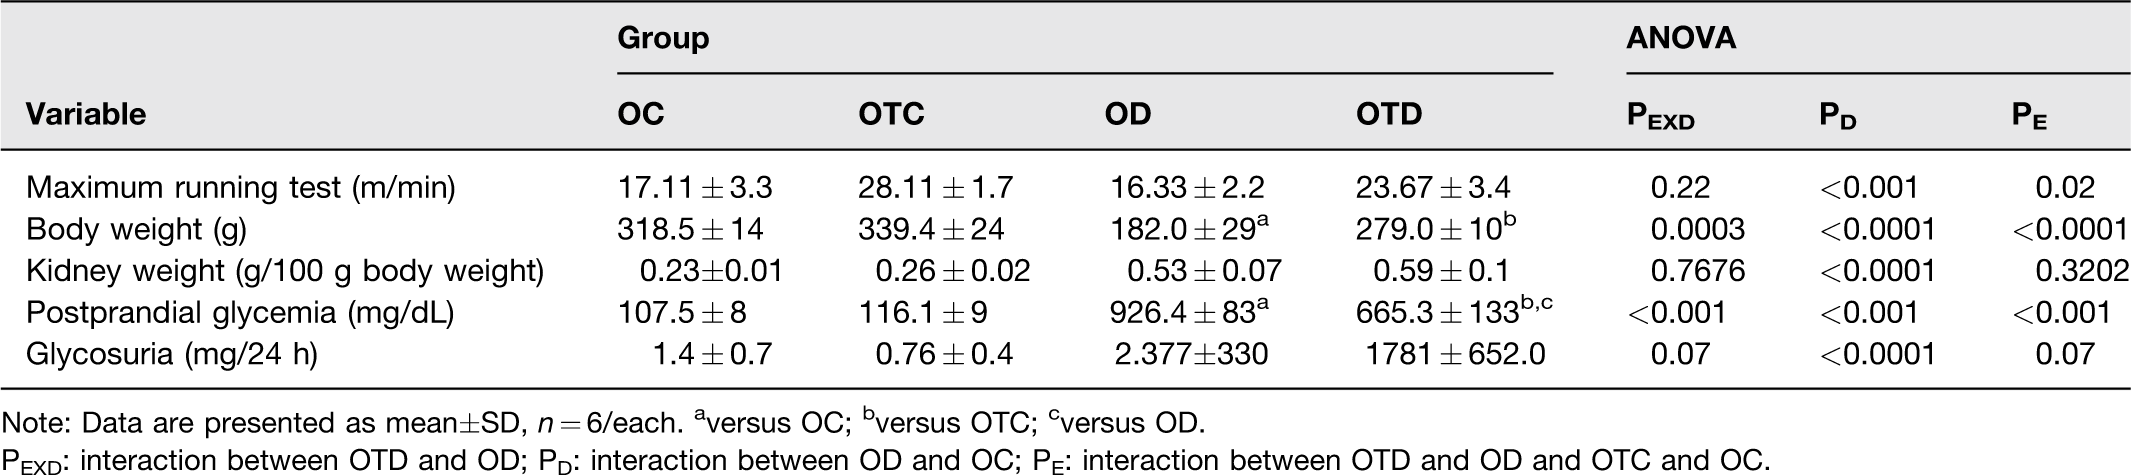
Note: Data are presented as mean±SD, n = 6/each. aversus OC; bversus OTC; cversus OD.
PEXD: interaction between OTD and OD; PD: interaction between OD and OC; PE: interaction between OTD and OD and OTC and OC.
Postprandial glycemia, glycosuria, and serum concentration of 17β-estradiol
The rats of the OTD group presented a significant reduction in postprandial glycemia induced by diabetes compared to OD group (interaction between diabetes and exercise, P < 0.001) (Table 1). This increase was not associated with dietary intake, since there was no difference in water and chow intake between the experimental groups (data not shown). Furthermore, diabetes increased glycosuria in diabetic animals when compared to their respective controls (P < 0.0001) (Table 1). As expected, there was no differences in serum 17β-estradiol concentrations between the experimental groups (OC, 37.83 ± 0.9; OTC, 35.33 ± 2.1; OD, 32.67 ± 1.2; OTD, 41.67 ± 4.8, data in pg/mL), confirming the efficiency of ovariectomy.
Renal function
The increase in serum creatinine concentrations induced by diabetes was reduced in the animals of the OTD group compared to the OD group (interaction between diabetes and exercise, P = 0.03) (Table 2). All ovariectomized diabetic rats, sedentary or trained, presented elevation of GFR (P < 0.0001), urinary excretion of urea (P = 0.0004), urinary flow (P < 0.0001), and Na+ excretion fraction (P = 0.01) compared to their respective controls, and there was no influence of the exercise on these parameters (Table 2). The increase in proteinuria induced by diabetes in OD group was reduced by exercise in OTD group (interaction between diabetes and exercise, P = 0.02) (Table 2).
Renal function data of ovariectomized control (OC), ovariectomized trained control (OTC), ovarectomized diabetic (OD), ovariectomized trained diabetic (OTD).
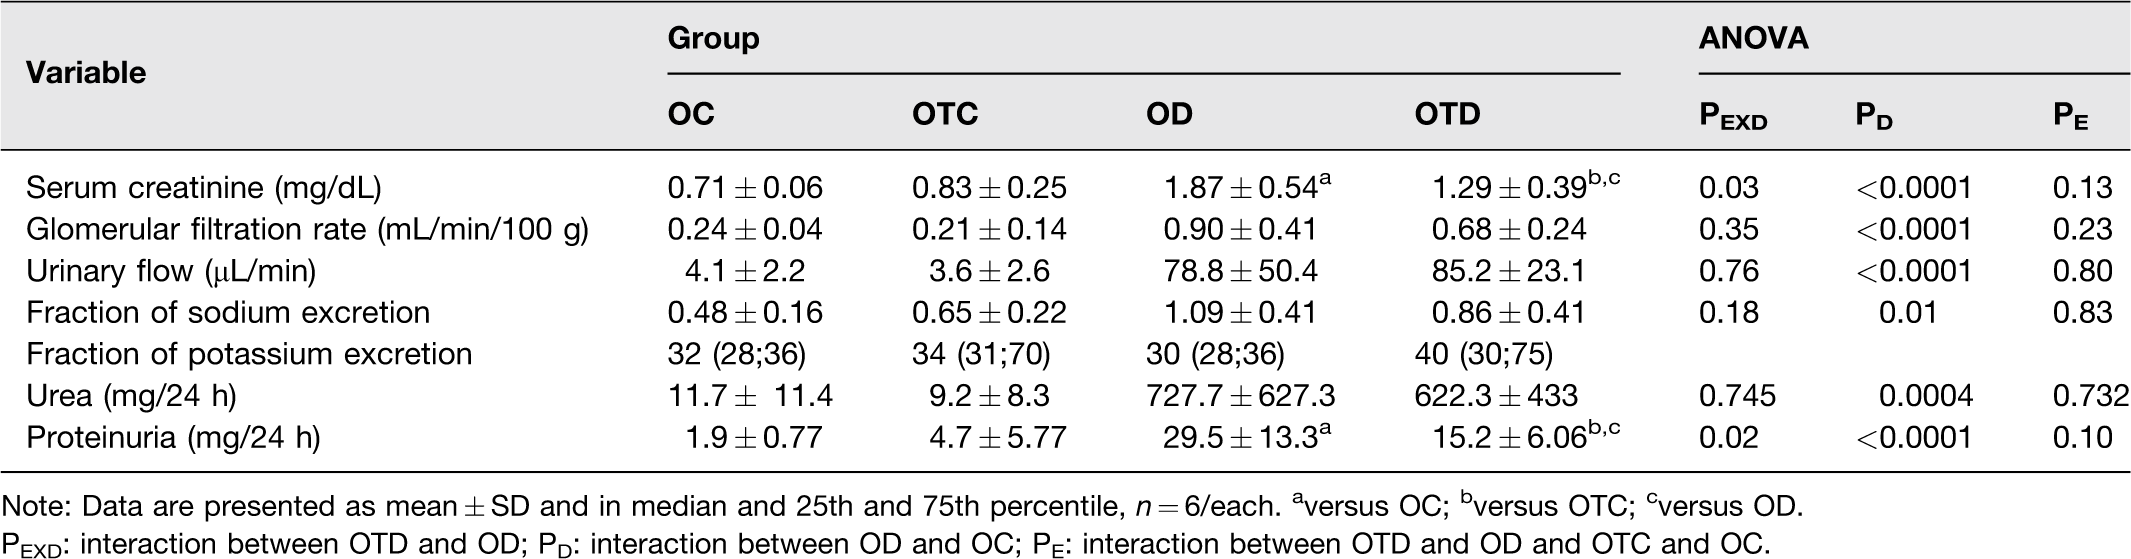
Note: Data are presented as mean ± SD and in median and 25th and 75th percentile, n = 6/each. aversus OC; bversus OTC; cversus OD.
PEXD: interaction between OTD and OD; PD: interaction between OD and OC; PE: interaction between OTD and OD and OTC and OC.
Renal morphology
The diabetes increased glomerulosclerotic index in the diabetic groups compared to their respective controls (P < 0.0001). However, the exercise attenuated the FSGS in the OTD group in relation to the OD group (interaction between diabetes and exercise, P = 0.02) (Table 3, Figure 2). The diabetes induced an increase in the area of glomerular fibrosis in the OD group compared to OC group (P = 0.0017). However, the exercise reduced the fibrosis in the OTD group compared to the OD group (interaction between diabetes and exercise, P = 0.0004) (Table 3, Figure 2). The results of the histological studies of the renal cortex showed that diabetes induced a higher interstitial tubule lesions score in the diabetic groups than control groups (P < 0.0001). The exercise attenuated these lesions in the OTD group compared to the OD group (interaction between diabetes and exercise, P < 0.0001) (Table 3, Figure 2). The stratified quantification of these lesions showed that diabetes induced in diabetic groups higher percentages of tubules with hydropic degeneration (P < 0.0001), dilation of the tubular lumen (P < 0.0001), brush border loss (P = 0.01) and epithelial necrosis (P < 0.0001) in relation to their respective controls (P < 0.05). However, the hydropic degeneration and tubular dilatation were attenuated by exercise in the OTD group compared to the OD group (interaction between diabetes and exercise, P = 0.002 and P = 0.01, respectively) (Table 3, Figure 2).
Histology and renal morphometry data of ovariectomized control (OC), ovariectomized trained control (OTC), ovarectomized diabetic (OD), ovariectomized trained diabetic (OTD).
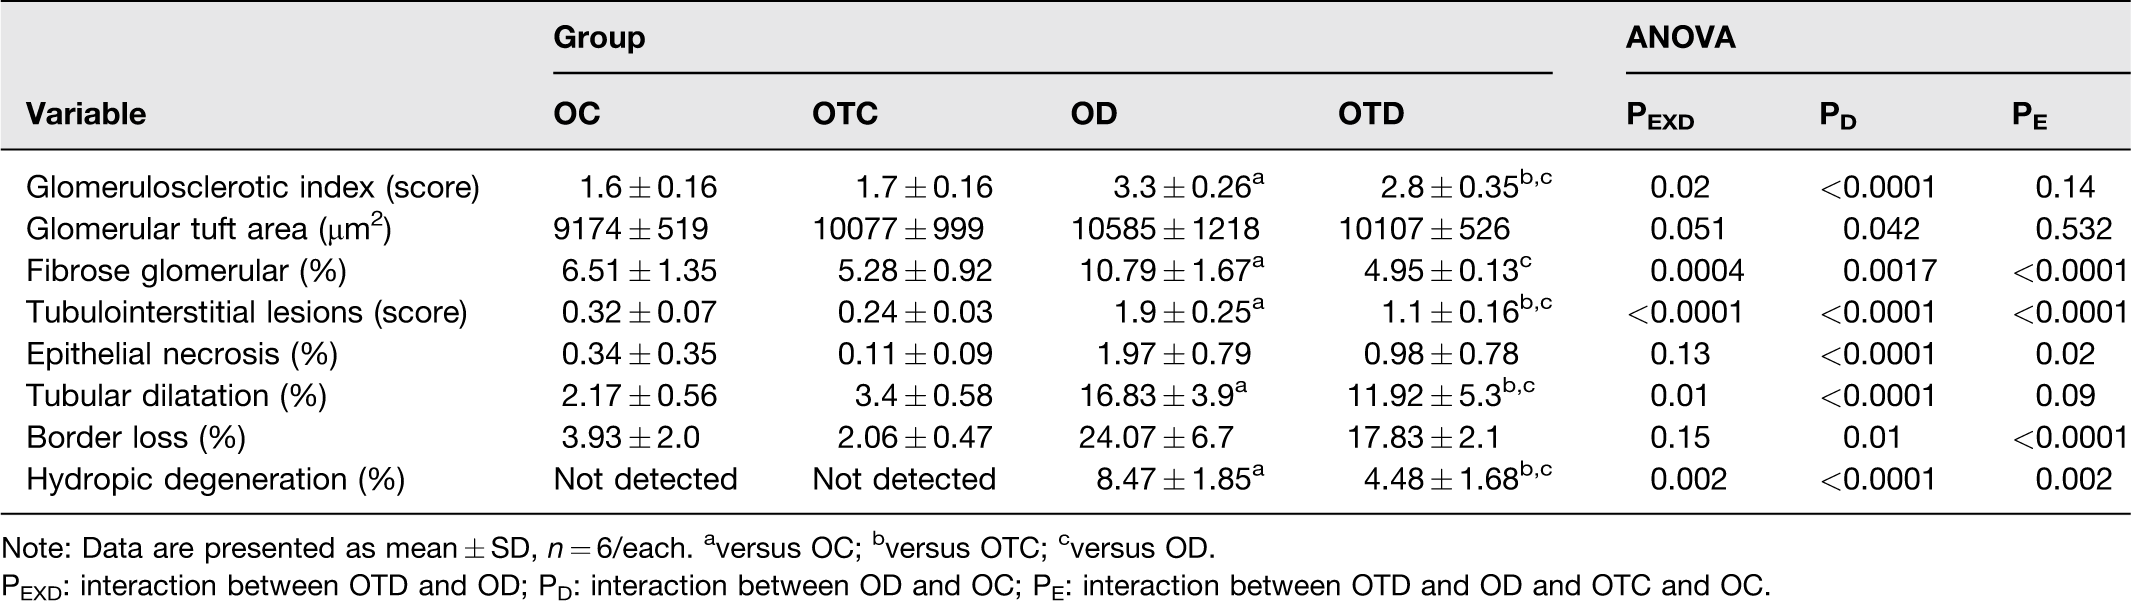
Note: Data are presented as mean ± SD, n = 6/each. aversus OC; bversus OTC; cversus OD.
PEXD: interaction between OTD and OD; PD: interaction between OD and OC; PE: interaction between OTD and OD and OTC and OC.
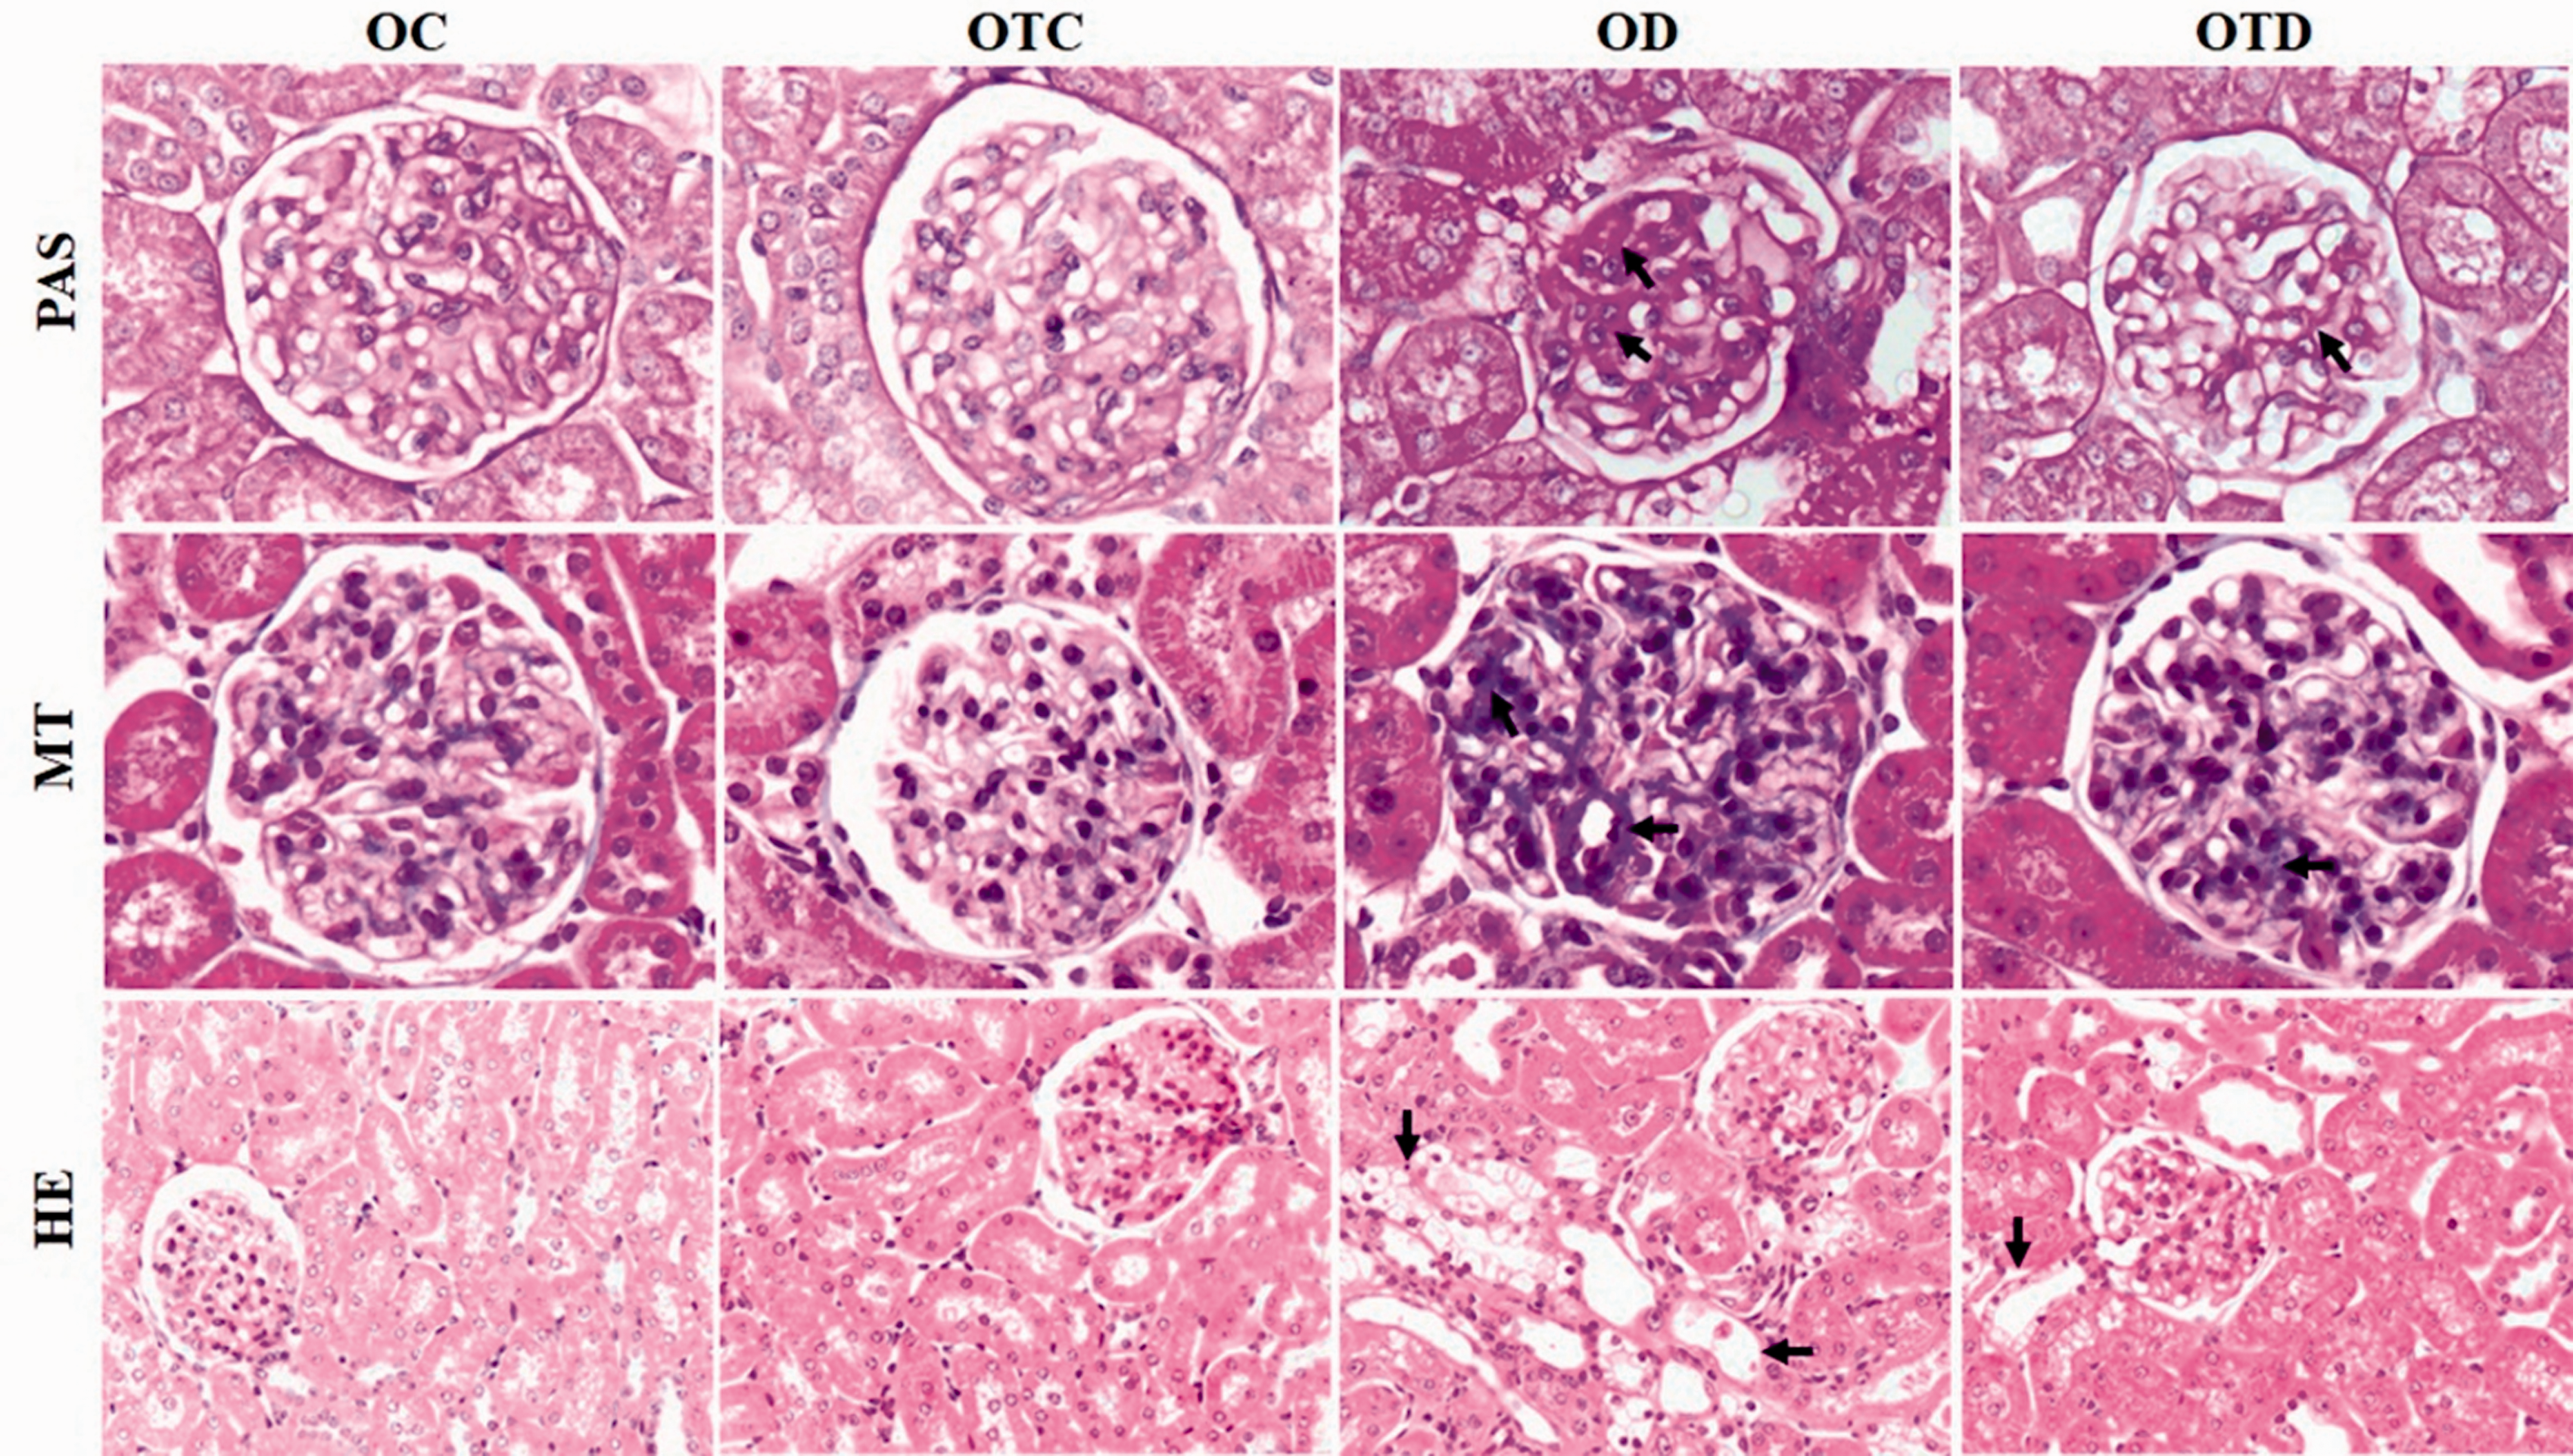
Representative photomicrographs of glomerular histological changes (PAS and MT staining) and tubulointerstitial lesions (HE staining) of OC, OTC, OD, and OTD groups. Note in OTD groups reductions in glomerular histological changes and tubulointerstitial lesions (arrow). Original magnification ×400 in PAS and MT and ×200 in HE. (A color version of this figure is available in the online journal.)
Immunohistochemical studies
Diabetes increased glomerular expression of fibronectin in the OD group when compared to the OC group (P < 0.0001) (Table 4, Figure 3). The exercise reduced this expression in the OTD group compared to the OD group (interaction between diabetes and exercise, P < 0.0001) and in the OTC group compared to the OC group (P < 0.0001) (Table 4, Figure 3). No immunostaining for fibronectin was observed in the tubulointerstitial compartment of the renal cortex. The increased immunostaining for TGF-β1 in the glomeruli and in the tubulointerstitial compartment of the renal cortex induced by diabetes was reduced by exercise in the OTD group compared to the OD group (interaction between diabetes and exercise, P = 0.04 and P = 0.001, respectively) (Table 4, Figures 3 and 4). The diabetes also increased the number of ED-1 and CD43-positive cells in the OD group both in the glomeruli and in the tubulointerstitial compartment of the renal cortex compared to the OC group and the exercise reduced the number of these cells in the glomeruli (interaction between diabetes and exercise, P = 0.002 and P = 0.05, respectively) and in the tubulointerstitial compartment (interaction between diabetes and exercise, P = 0.001 and P = 0.02, respectively) in the OTD group (Table 4, Figure 3). The exercise also reduced immunostaining of NF-κBp65-positive cells in the glomeruli of the OTD group induced by diabetes compared to the OD group (interaction between diabetes and exercise, P = 0.05). In addition, the data showed that diabetes induced increase in immunostaining for NF-κBp65 in the tubulointerstitial compartment of the all ovariectomized diabetics groups when compared to their controls (P = 0.002) (Table 4, Figure 3). In addition, no effect of diabetes and exercise on immunostaining for fibronectin was observed (Table 4).
Immunomarcation of vimentin, fibronectin, TGF-β1, ED-1, CD43, and NF-κB(p65) in the glomeruli (G) and tubulointerstitial compartment (TC) of ovariectomized control (OC), ovariectomized trained control (OTC), ovariectomized diabetic (OD), ovariectomized trained diabetic (OTD).
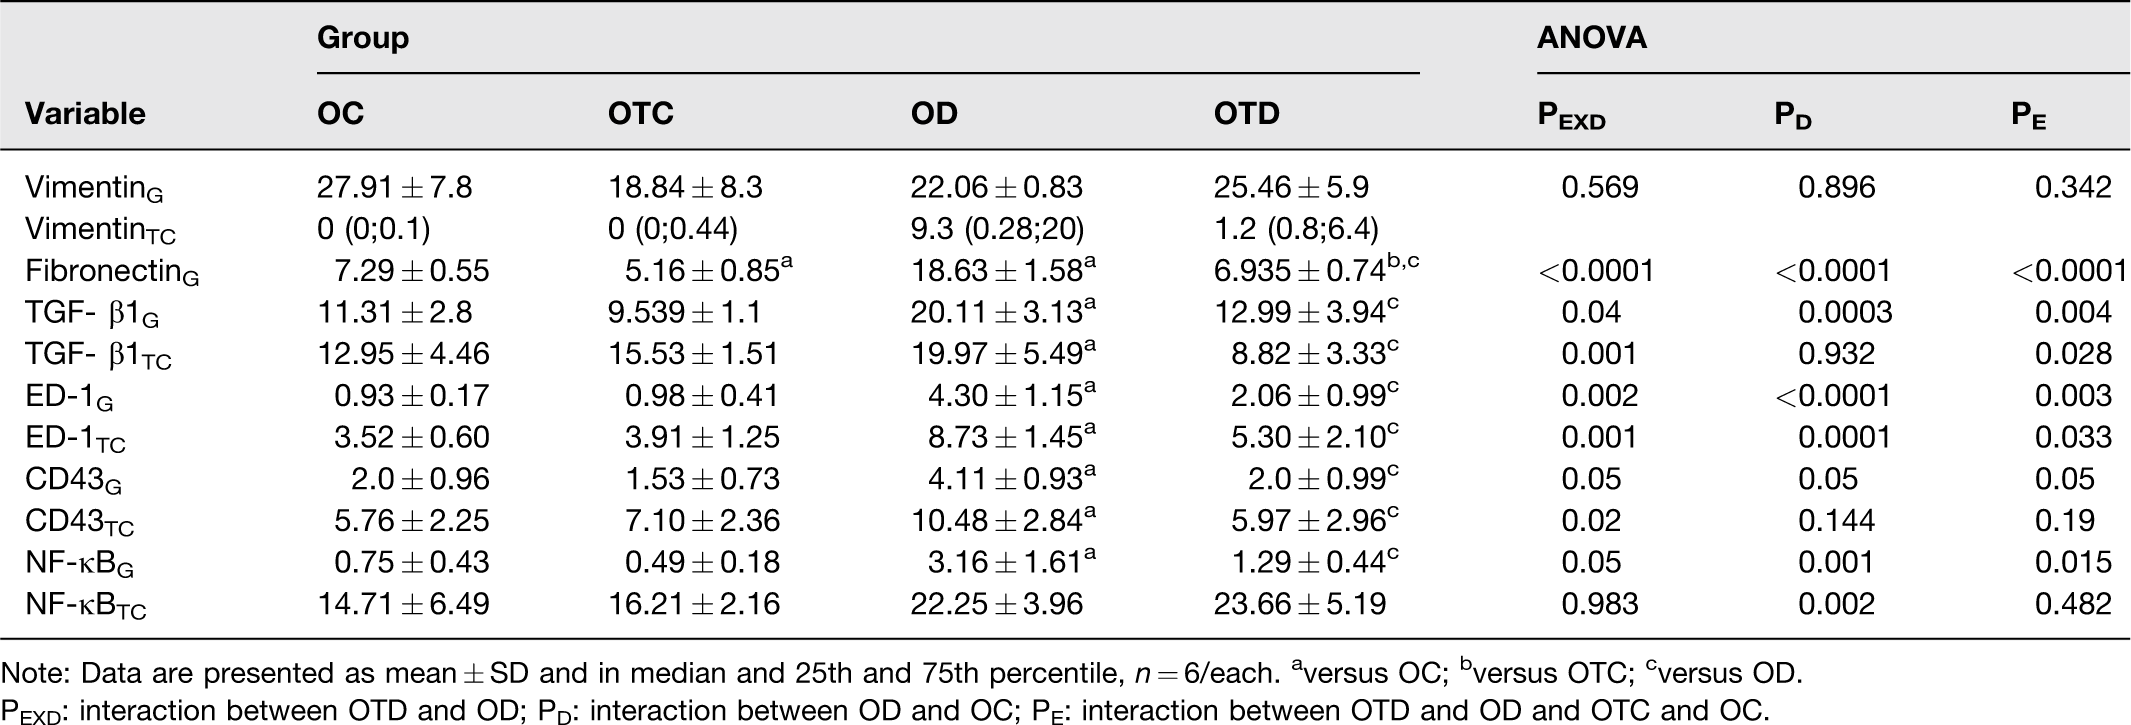
Note: Data are presented as mean ± SD and in median and 25th and 75th percentile, n = 6/each. aversus OC; bversus OTC; cversus OD.
PEXD: interaction between OTD and OD; PD: interaction between OD and OC; PE: interaction between OTD and OD and OTC and OC.
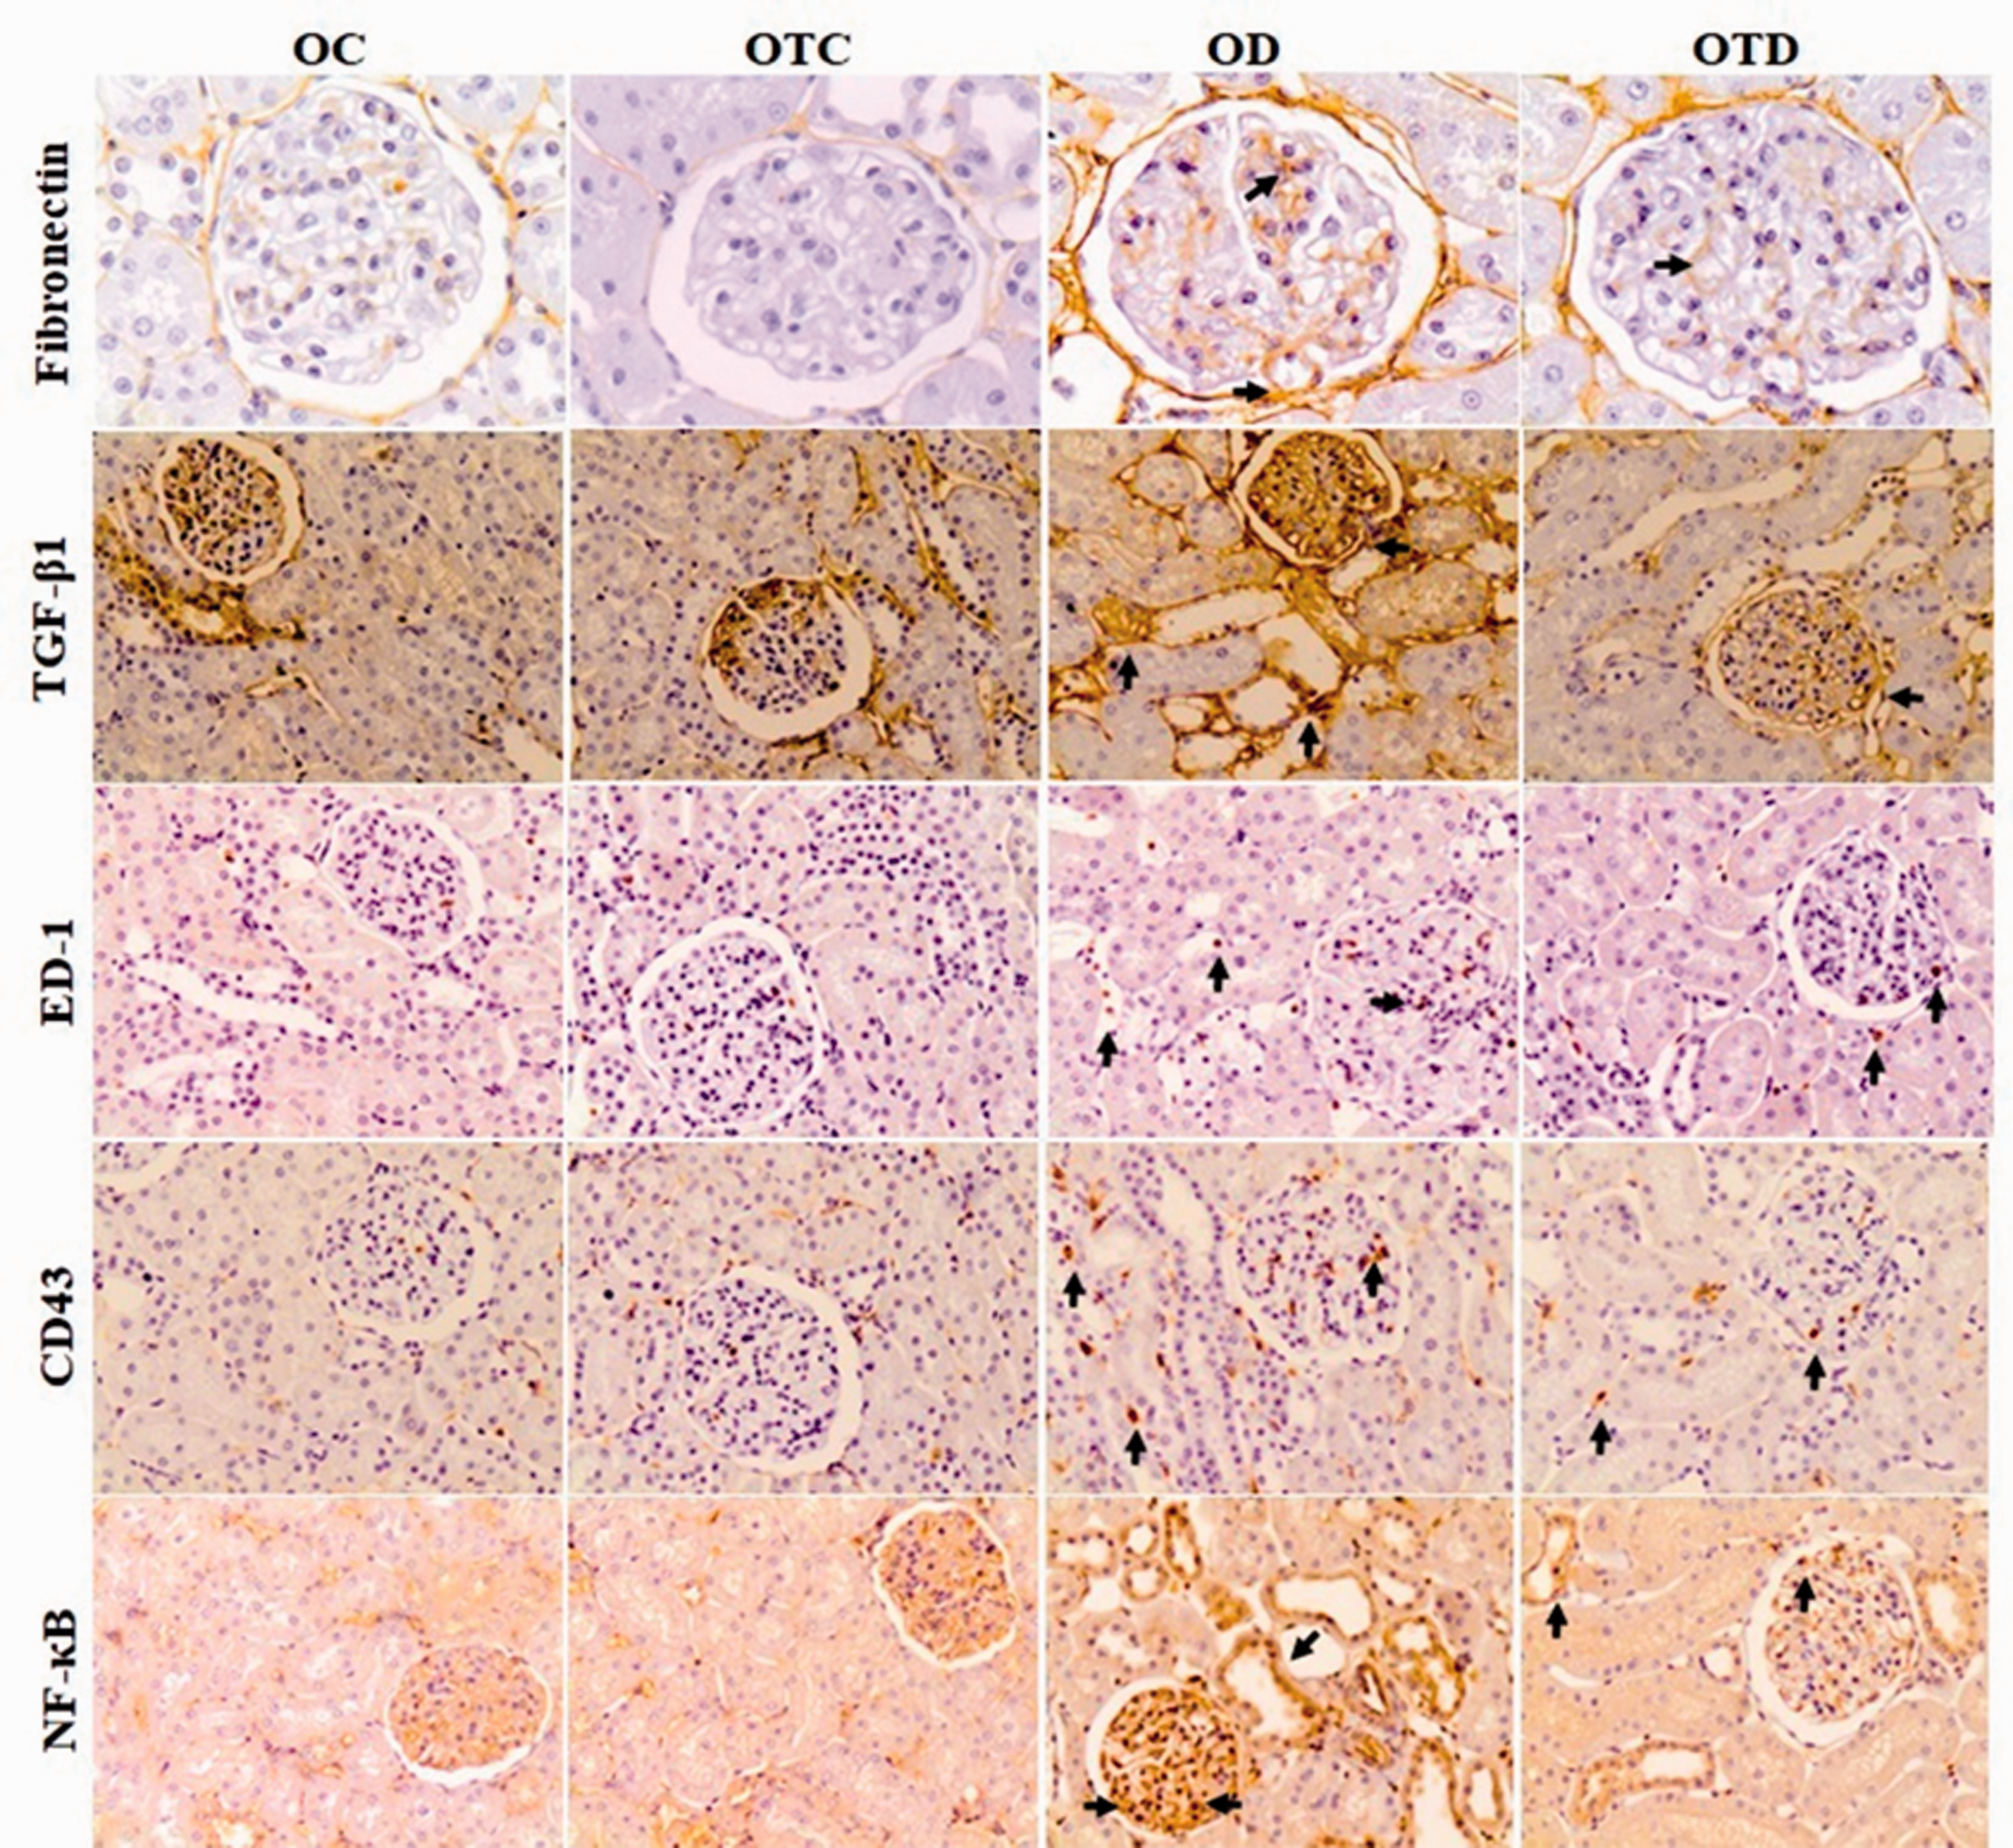
Immunolocalization for fibronectin, TGF-β1 and ED-1, CD43 and NF-κB(p65)-positive cells in the glomeruli and tubulointerstitial compartment of the renal cortex of OC, OTC, OD, and OTD groups. Note in OTD group reductions in immunostaining of fibronectin, TGF-β1, ED-1, CD43 and NF-κB(p65). Original magnification ×400 in fibronectin and ×200 in TGF-β1, ED-1, CD43 and NF-κB(p65). (A color version of this figure is available in the online journal.)
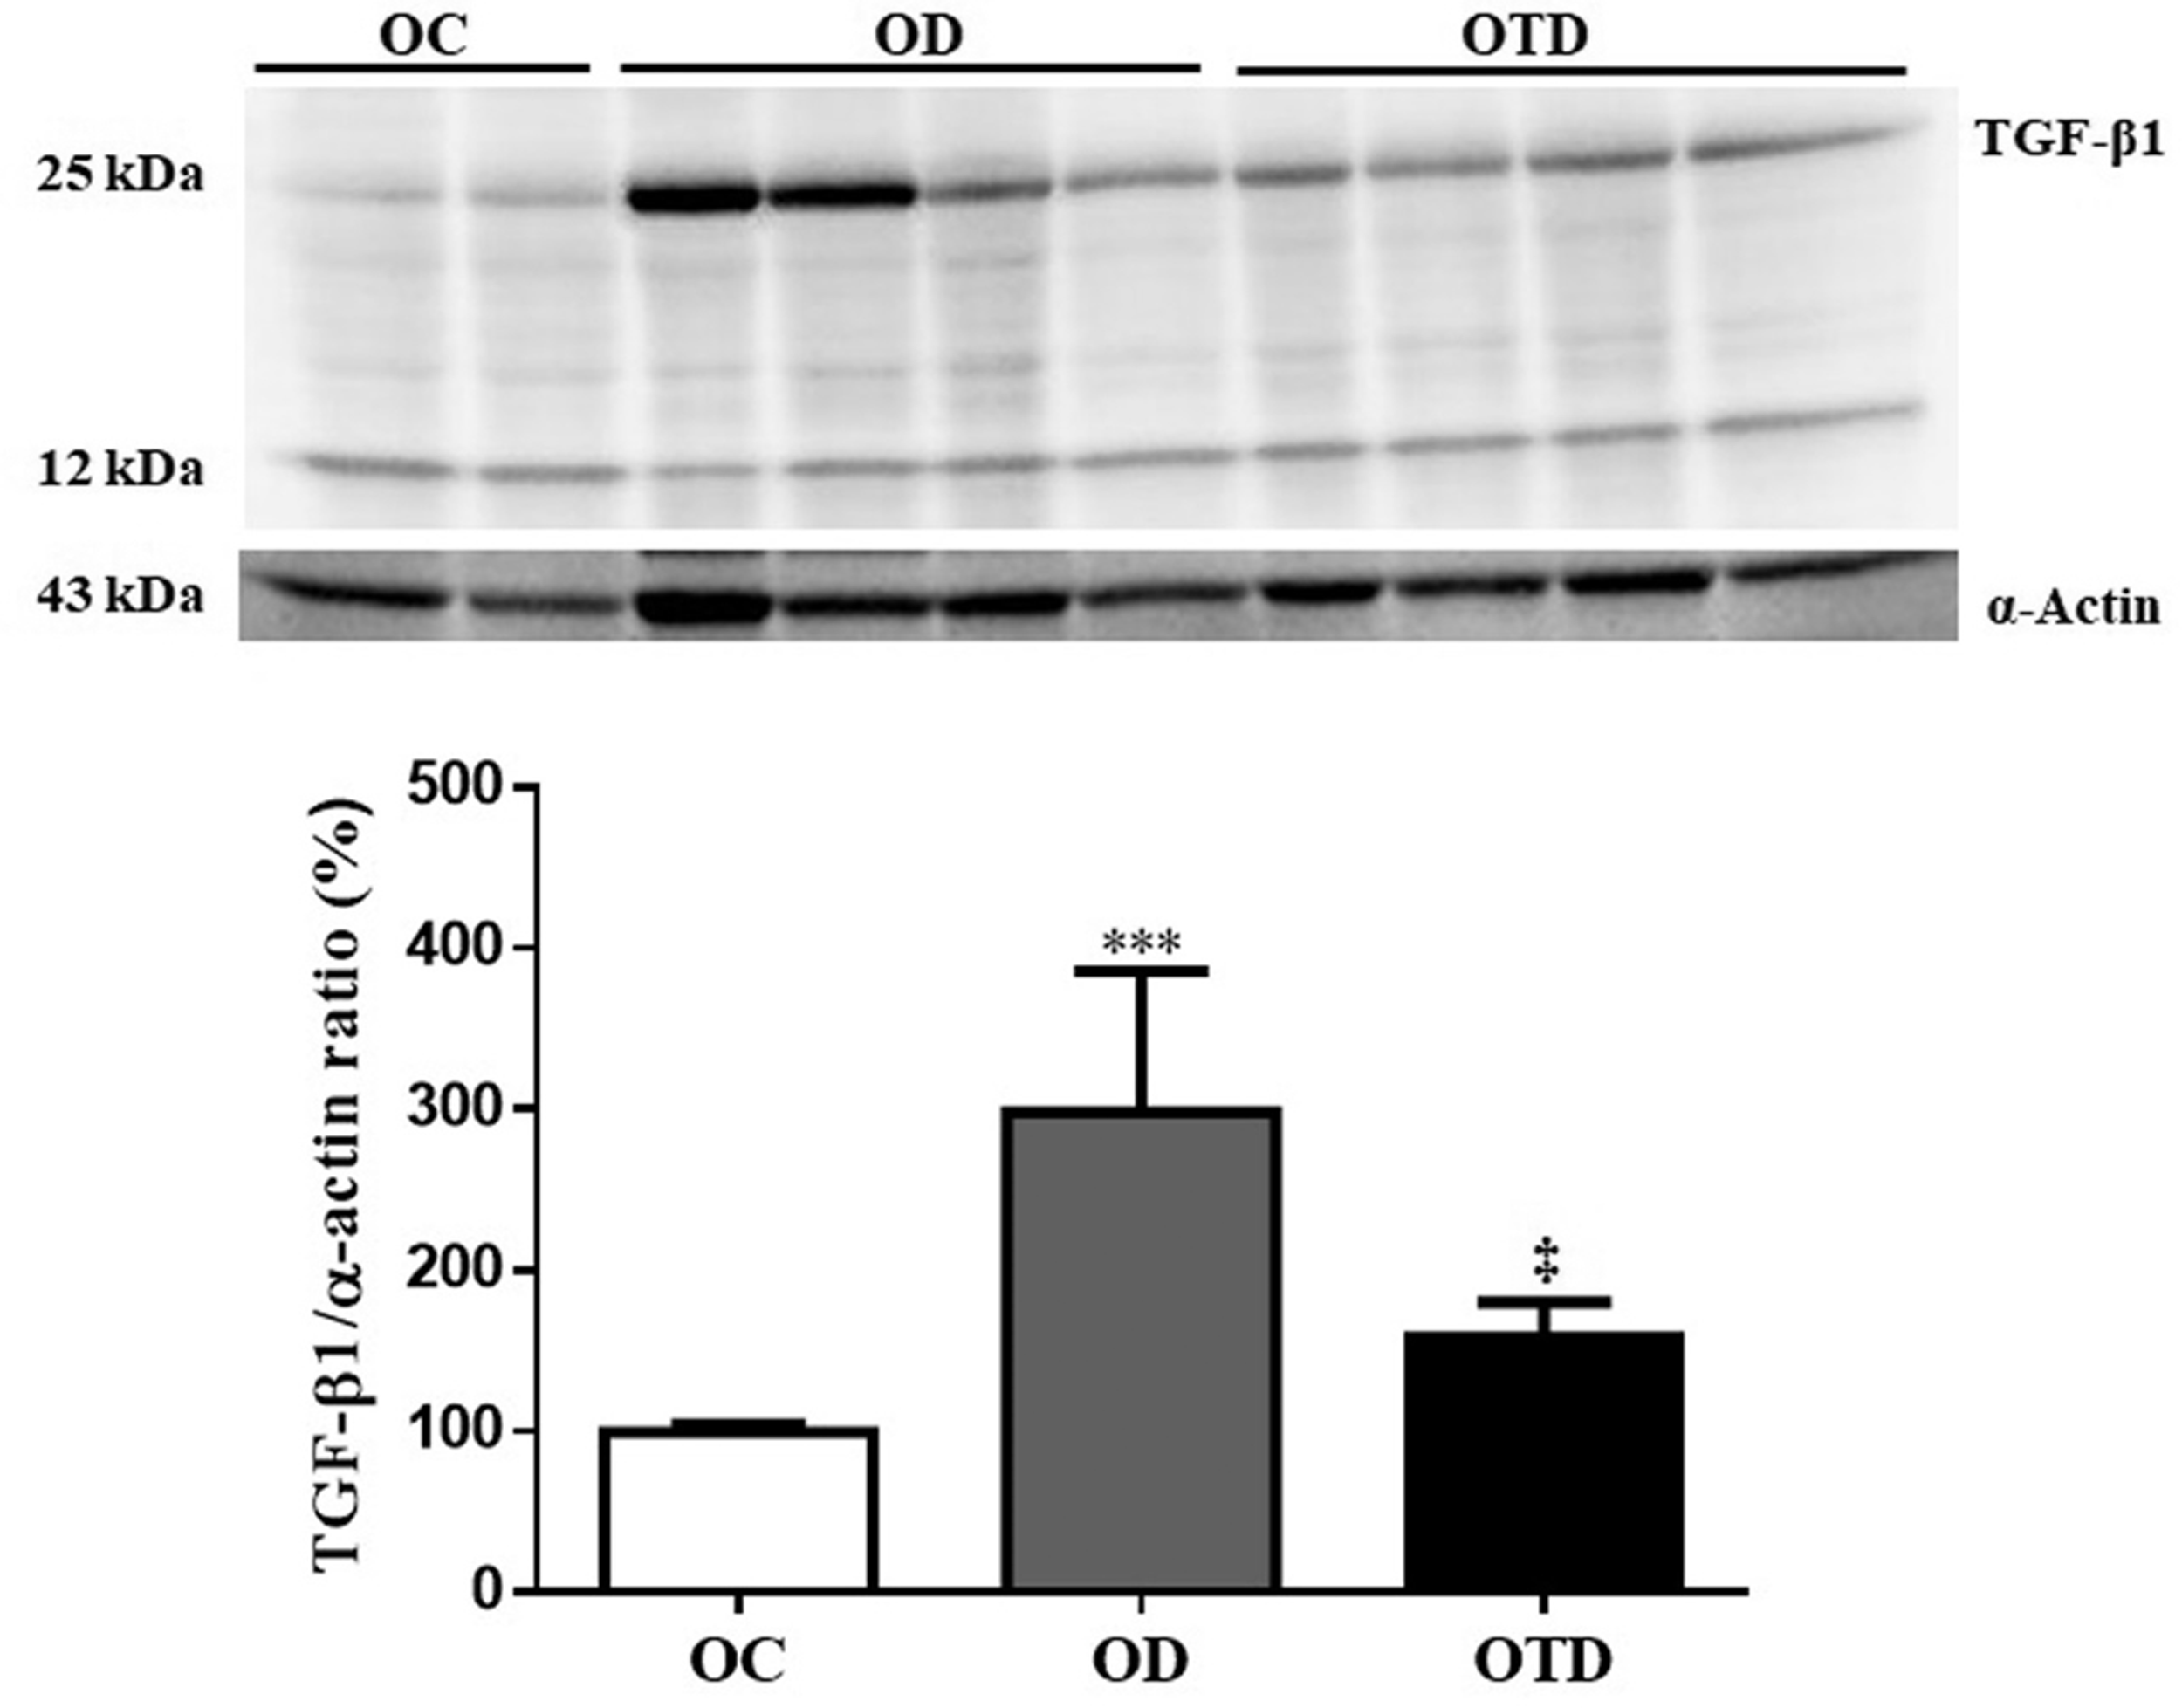
Protein expression of TGF-β1 in the renal cortex of OC, OD, and OTD groups, n = 6/each. Data are expressed as mean±SD.
Protein expression of TGF-β1
The rats of the OD group showed higher TGF-β1 protein expression in the renal cortex compared to the rats of the OC group (P < 0.001). The physical exercise prevented this increase in the rats of the OTD group (P < 0.001) (Figure 4). Protein expression of TGF-β1 was not performed in the OTC group due to similarities with other results of OC group.
TBARS and GPx levels
The diabetes induced an increase in the TBARS levels in the renal cortex in the OD group compared to the OC group (P < 0.001). However, exercise reduced these levels in the OTD group (interaction between diabetes and exercise, P < 0.001). In addition, exercise also reduced the levels of TBARS in the animals of the OTC group compared to the OC group (P < 0.001) (Figure 5(a)). In relation to GPx levels, our data demonstrated that physical exercise increased the activity of this enzyme in OTC and OTD groups compared to OC and OD groups, respectively (P < 0.0001) (Figure 5(b)).
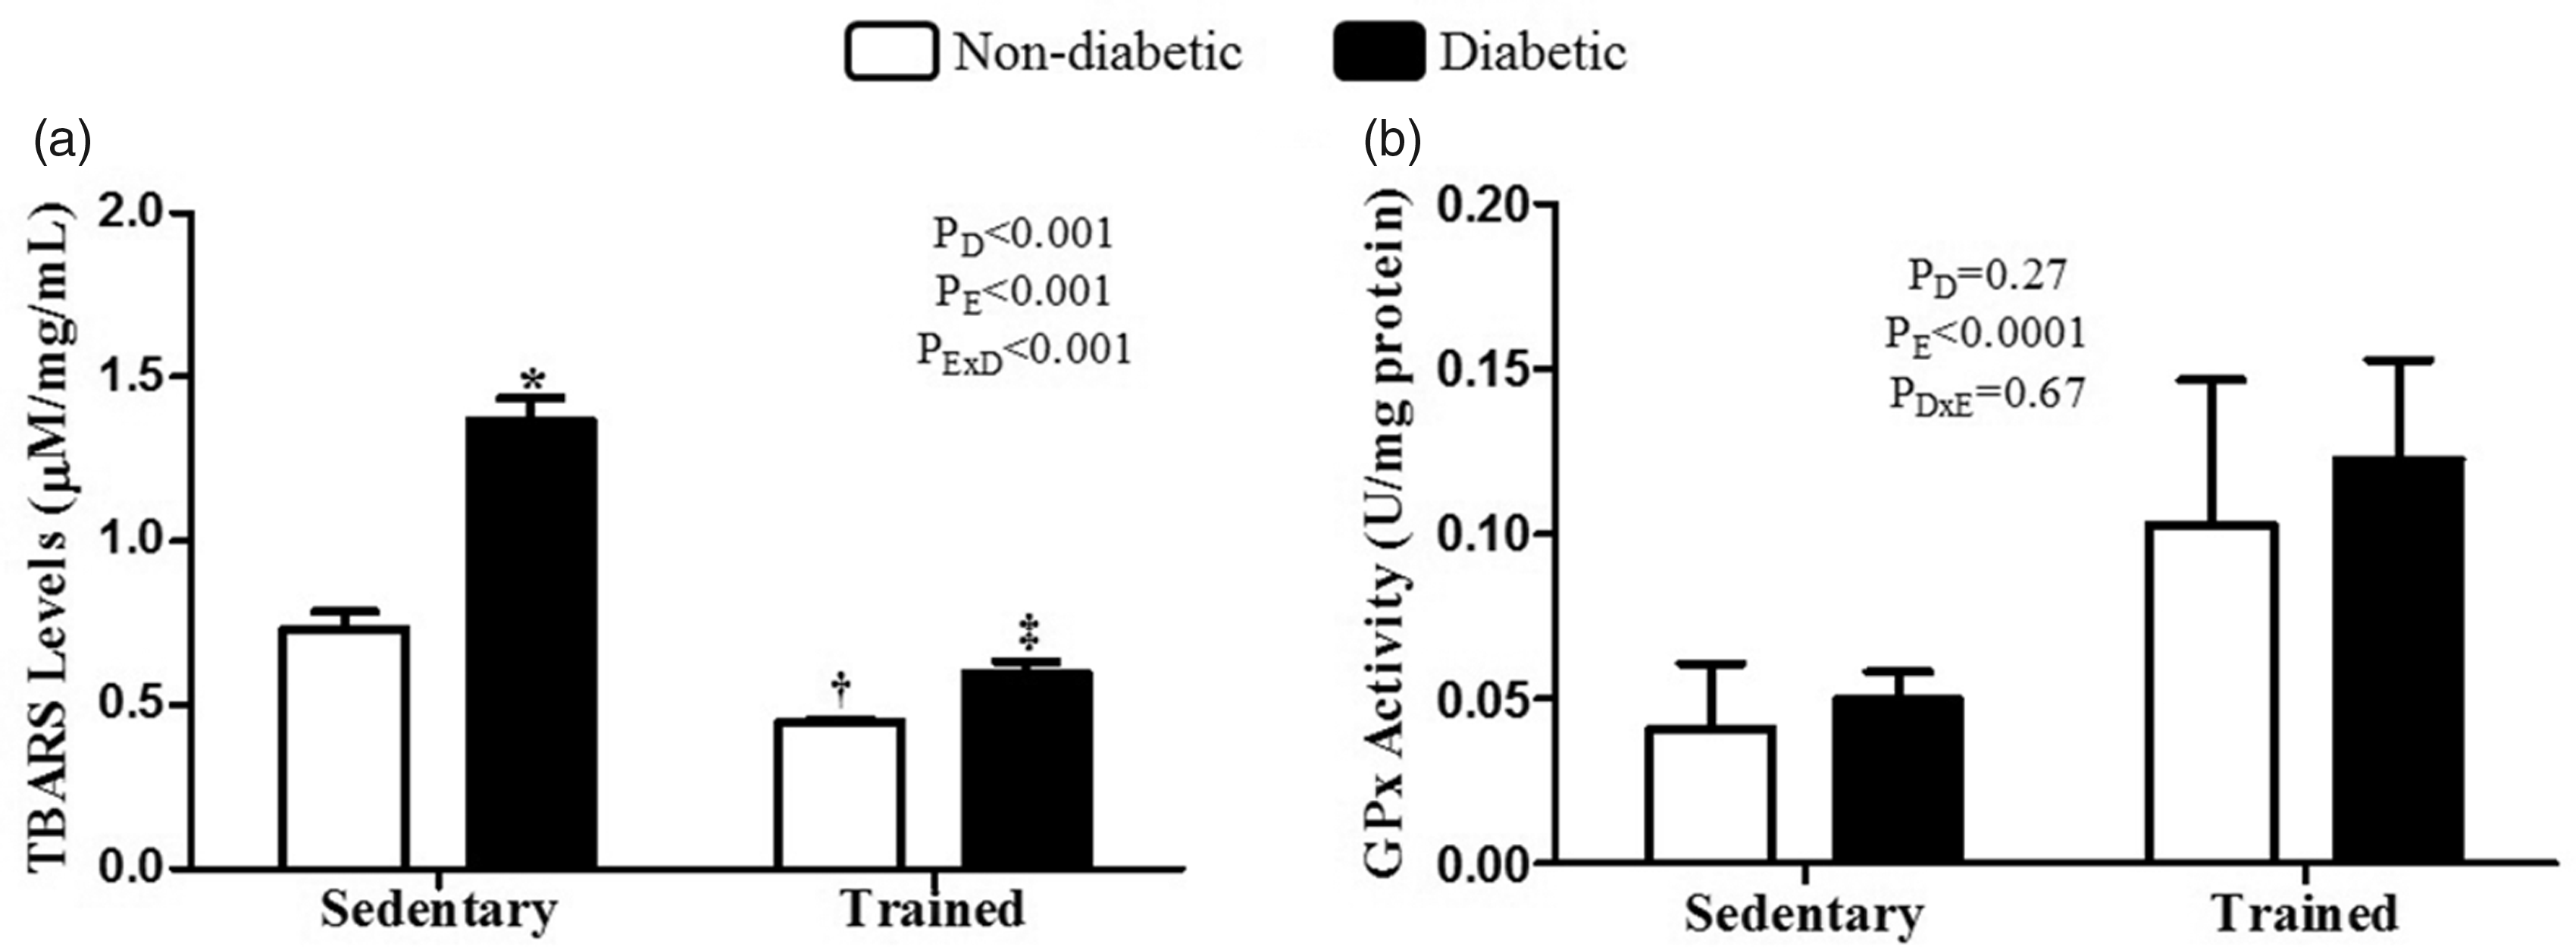
TBARS (a) and GPx (b) levels in the renal cortex of OC, OTC, OD, and OTD groups, n = 6/each. Data are expressed as mean±SD. *versus nondiabetic sedentary;
Discussion
This study investigated the impact of moderate aerobic exercise on lipid peroxidation, inflammation and renal structure and function in ovariectomized Wistar rats. Our results demonstrate that physical exercise improved the weight loss, glycemic levels, physical performance and reduced proteinuria, and serum creatinine concentrations in the animals of OTD group. In addition, exercise also reduced histopathological changes, inflammation and ECM markers, and lipid peroxidation in OTD rats.
The efficacy of ovariectomy in our study was confirmed by the low concentrations of 17β-estradiol in all rats of the different experimental groups. Aerobic physical exercise attenuated the loss of body weight and glycemic levels, in addition to increasing the physical capacity of the animals in the OTD group. There was no difference in dietary intake between OC and OTD groups (data not shown), confirming the efficacy of exercise in the reduction of postprandial glycemia in OTD animals. In agreement with our findings, studies also demonstrated that exercise training attenuated glycemia, weight loss, and increased physical capacity in animals with STZ-induced DM.20,23,24 The mechanisms by which exercise mediates these effects are not fully understood. However, studies have shown that moderate intensity aerobic training increases energy capacity in skeletal muscle mitochondria of diabetic rats 38 and mitochondrial function in the kidneys of spontaneously hypertensive rats, 39 improves insulin sensitivity in ovariectomized spontaneously hypertensive rats with fructose overload, 29 and stimulates the uptake of glucose in the muscle of ovariectomized obese diabetic Zucker rats. 40
Changes in renal function were evidenced by increased serum creatinine, GFR, sodium excretion fraction, urea clearance, and proteinuria in OD rats. Increased proteinuria and albuminuria in diabetic animals are associated with structural protein impairment and glomerular permeability induced by hyperglycemia.41,42 However, physical exercise prevented the increase of proteinuria and serum creatinine in the rats of the OTD group. In a prior study from our laboratory, aerobic exercise performed pre and post-induction of DM reduced proteinuria in non-ovariectomized diabetic rats. 23 Additionally, studies have shown that exercise reduced serum creatinine and proteinuria in male rats with kidney disease4,22,26 and reduced serum urea in animals with kidney disease induced by acute myocardial infarction with significant improvement in renal function. 27 The beneficial effects of physical exercise can be attributed to the reduction of hyperglycemia, oxidative stress, and improved bioavailability of nitric oxide in diabetic animals.20,22,24,41 In this sense, Francescato et al. 25 demonstrated that physical preconditioning animals exhibited increased expression of pp-eNOS and eNOS, possibly indicating preserved endothelial function, and increased NO levels in renal tissue, which may have contributed to the reduction of the vasoconstrictor effect and of the inflammatory process in a model of cisplatin-induced acute renal injury. 25
Despite the reduction of estrogen is associated with the development of glomerulosclerosis in postmenopausal women and in ovariectomized rats,18,43,44 the condition of hyperglycemia and the establishment DKD are also determinants for the development of glomerular lesions. 45 Our histopathological studies demonstrated that DM induced structural damage in the glomeruli compatible with FSGS; however, the exercise attenuated such changes in the OTD group. Similarly to our findings, studies have shown that exercise can exert its renoprotective effects by reducing glomerular volume in doxorubicin-induced chronic kidney disease (CKD), 46 attenuating mesangial expansion in diabetic male rats, 22 and reducing glomerulosclerotic index and EMC in STZ-induced non-ovariectomized diabetic rats. 23 Mankhey et al. 17 demonstrated that DM-induced interstitial and tubular changes in ovariectomized rats were attenuated by 17β-estradiol replacement. 17 However, in our study, tubulointerstitial lesions were reduced by physical exercise in OTD group. The aerobic physical exercise promoted reduction of the tubular vacuolar degenerative changes in diabetic male rats, 22 tubulointerstitial lesions in a model of CKD, 47 and the staining for α-SMA in Zucker rats with DKD. 41 In addition, it has been shown that exercise training reduced tubulointerstitial compartment lesions in the renal cortex of non-ovariectomized diabetic rats. 23
The expansion of the mesangial matrix in the early phase of DKD is associated with excessive accumulation of matrix proteins, such as fibronectin and type IV collagen. 48 Fibronectin is the first protein to be deposited in fibrotic renal diseases, constituting a support for the deposition of other proteins as well as acting as a fibroblast chemoattractant. 49 Our results demonstrated increased expression of fibronectin and fibrosis in the glomeruli in OD rats. The increase in ECM deposition in our study may be contributing to the development of glomerular changes, with consequent proteinuria and renal dysfunctions in OD rats. However, exercise training reduced fibronectin expression and glomerular fibrosis in the rats of the OTD group. Our data are consistent with other studies that also demonstrated that aerobic exercise attenuated the accumulation of fibronectin in glomeruli,23,26 reduced collagen deposition in the interstitial tissue of the kidney 46 and delayed the development of structural damage in CKD rats. 47 In our study, the increase in TGF-β1 protein expression in renal cortex induced by diabetes in the OD group was reduced by the exercise in the OTD group. TGF-β1 is considered to be one of the main cytokines mediating the accumulation of ECM, mesangial expansion, and development of tissue fibrosis in DKD.50,51 Studies have shown that TGF-β1 stimulated the production of elastin, fibronectin, and collagens types I, III and IV, and these effects are related to inhibition of matrix metalloproteinases and activation of protease inhibitors in rats with type 1 diabetes.52,53 Amaral et al. 23 demonstrate reduced expression of TGF-β1 in the glomeruli and decreased glomerular lesions in non-ovariectomized diabetic rats submitted to exercise. 23 The effect of exercise on the expression of TGF-β1 in diabetic rats is still poorly documented, especially related to physical exercise under conditions of decrease of female sex hormones.
DKD is characterized by a subclinical and low-grade inflammation. 54 The accumulation of monocytes/macrophages, lymphocytes and fibroblasts, and products derived from these cells are responsible for inflammation in the diabetic kidney. 55 Our data show increase in the number of ED-1 and CD43-positive cells in glomeruli and tubulointerstitial compartment and higher NF-κB immunostaining in glomeruli in the OD group. However, exercise attenuated the infiltration of immune cells, as well as expression of NF-κB in the OTD group, which may have contributed to the decrease in renal damage observed in this study. In concordance with our findings, studies have shown that exercise training reduced macrophage number in the tubulointerstitial area of the renal cortex in acute 25 and chronic renal disease, 26 reduced macrophages number in lung tissue in an animal model of acute infection 56 and renal tissue in a model of diabetic atherosclerosis, 57 reduced lymphocyte number in the tubulointerstitial compartment of the renal cortex of non-ovariectomized rats with STZ-induced DM, 24 reduced the infiltration of macrophages, T lymphocytes and activation of NF-KB in a model of arterial inflammation and aging 58 and reduced of infiltration of macrophages into the glomeruli and interstitial and tubular area in rats with type 2 diabetes mellitus. 59 All these evidences reinforce the hypothesis that the exercise is capable of conferring renoprotection, at least in part, by exerting an anti-inflammatory effect.
Hyperglycemia is strongly associated with increased production of ROS, which contribute to lipid peroxidation in cell membranes and activation of NF-κB. 11 Lee et al. 60 demonstrated accumulation of ROS and increased activation of NF-κB and TGF-β1 in glomeruli and proximal renal tubules in diabetic rats. In our study, high levels of TBARS, a marker of lipid peroxidation, are suggestive of oxidative stress in the renal cortex of the OD group, whereas exercise training was able to prevent this effect in the OTD group. In recent studies, it was demonstrated that aerobic exercise improved the bioavailability of nitric oxide and reduced TBARS renal levels in rats with STZ-induced DM,22,24 and in rats with acute renal injury induced by gentamicin. 61 Exercise also increased eNOS staining in the aorta and reduced neutrophil accumulation and lipid peroxidation in rats with renovascular hypertension. 62 Furthermore, it was demonstrated that aerobic exercise ameliorated kidney 27 and liver 63 dysfunction via reduction of malondialdehyde levels.
Our study demonstrated that exercise increased GPx levels in the OTC and OTD groups, indicating a possible antioxidant effect in the trained animals. Berzosa et al. 64 also demonstrated that acute exercise is capable of increasing serum GPx levels in healthy humans untrained. Furthermore, studies also demonstrated increase in GPx activity in trained rats with doxorubicin-induced FSGS62 and in liver tissue in atherosclerosis model, 65 suggesting the protective effect of aerobic exercise in oxidative stress in these experimental models. GPx together with superoxide dismutase and catalase form the main line of defense against ROS. 66 Increased activity of these enzymes has been associated with inhibition of NFκB activation, via ROS elimination, thus suppressing inflammation.
Therefore, reduction of TBARS levels associated with increased GPx activity may have contributed to decreased expression of NF-κB, TGF-β1, and inflammation in OTD group with consequent improvement in renal function and structure parameters analyzed in this study.
In conclusion, our data demonstrate that moderate-intensity physical exercise may delay the progression of diabetic nephropathy, preserving renal structure and function, by reducing lipid peroxidation and inflammatory process in ovariectomized trained diabetic rats.
The present study presented limitations on the non-performance of some techniques, which made it impossible to better explore the experimental model and to extrapolate to the scientific community. However, the techniques used in the study are validated and widely used and the experimental protocol was developed under the strictest control, which allowed us to conclude that the results are considerably relevant.
Footnotes
Authors’ contributions
All authors participated in the design, interpretation of the studies and analysis of the data and review of the manuscript. CSS, LSBA and TJS conceived and designed the experiments; CSS, LSBA, TMLC, BSSO, GNO, ACB, DC and MVO performed the experiments; CSS, LSBA, TJS, ACMM and RAV analyzed the data; ACMM and RAV contributed reagents/materials/analysis tools; CSS, LSBA and TJS contributed to the writing of the manuscript.
DECLARATION OF CONFLICTING INTERESTS
The author(s) declared no potential conflicts of interest with respect to the research, authorship, and/or publication of this article.
FUNDING
The author(s) disclosed receipt of the following financial support for the research, authorship, and/or publication of this article: This work was funded by the Fundação de Amparo à Pesquisa do Estado da Bahia (FAPESB); Coordena¸ão de Aperfeiçoamento de Pessoal do Nível Superior (CAPES); and Conselho Nacional de Desenvolvimento Científico e Tecnológico (CNPq).