
Abstract
Quantitative assessment of physiological condition of retinal photoreceptors is desirable for better detection and treatment evaluation of eye diseases that can cause photoreceptor dysfunctions. Functional intrinsic optical signal (IOS) imaging, also termed as optoretinography (ORG) or optophysiology, has been proposed as a high-resolution method for objective assessment of retinal physiology. Fast IOS in retinal photoreceptors shows a time course earlier than that of electroretinography a-wave, promising an objective marker for noninvasive ORG of early phototransduction process in retinal photoreceptors. In this article, recent observations of fast photoreceptor-IOS in animal and human retinas are summarized, and the correlation of fast photoreceptor-IOS to five steps of phototransduction process is discussed. Transient outer segment conformational change, due to inter-disc space shrinkage correlated with activation phase of phototransduction, has been disclosed as a primary source of the fast photoreceptor-IOS.
Impact statement
As the center of phototransduction, retinal photoreceptors are responsible for capturing and converting photon energy to bioelectric signals for following visual information processing in the retina. This article summarizes experimental observation and discusses biophysical mechanism of fast photoreceptor-intrinsic optical signal (IOS) correlated with early phase of phototransduction. Quantitative imaging of fast photoreceptor-IOS may provide objective optoretinography to advance the study and diagnosis of age-related macular degeneration, retinitis pigmentosa, diabetic retinopathy, and other eye diseases that can cause photoreceptor dysfunctions.
Keywords
Introduction
Retinal photoreceptors are responsible for capturing and converting photon energy to bioelectric signals for following visual information processing in the retina. It is known that eye diseases, such as age-related macular degeneration (AMD),1–3 retinitis pigmentosa (RP),4,5 and diabetic retinopathy (DR),6,7 can cause photoreceptor dysfunctions. Early detection and therapeutic assessment are essential steps to prevent vision loss due to eye diseases.
Electrophysiological measurements such as electroretinography (ERG) have been used for objective measurement of photoreceptor dysfunctions.2,6,7 However, the spatial resolution of the electrophysiological measurement is limited. Moreover, the electrophysiological recording provides an integral signal over the whole thickness of the retina. In principle, different components of ERG, such as a-wave and b-wave which reflect outer and inner retinal responses, respectively, can be separately evaluated. 8 However, pathological conditions of any individual retinal layer may affect the electrical loop for electrophysiological recording, which makes clinical interpretation complicated.
Early receptor potential (ERP) has been also detected in the retina when a very bright light flash is used to stimulate the eye.5,9,10 ERP occurs almost immediately with the onset of the bright light flash, followed by ERG a-wave. Because the ERP magnitude is linearly proportional to the stimulus intensity and rhodopsin concentration in the photoreceptor outer segment (OS), it can serve as an objective functional biomarker of retinal photoreceptors. ERP measurement has been occasionally used for assessing photoreceptor function in RP patients. 8 However, the ERP magnitude is relatively small, compared to ERG a-wave, and the very bright flash is required to evoke detectable ERP, which makes the patient uncomfortable. Thus, the clinical deployment of the ERP has been so far limited.
Functional intrinsic optical signal (IOS) imaging, also termed as optoretinography (ORG) or optophysiology, 11 promises a high-resolution method for objective assessment of retinal physiology. 12 In analogy to ERG which records stimulus-evoked bioelectronic signal, ORG maps stimulus-evoked IOS. Stimulus-evoked IOS changes have been first observed in photoreceptor OS suspensions13–15 and isolated retinas.16–18 Near infrared (NIR) light was typically used for recording IOS evoked by a visible light flash. These early studies revealed a close relationship between the transient IOS changes and early phases of phototransduction process. 19 Since phototransduction abnormalities have been consistently reported in AMD,20–22 DR,7,23,24 and RP,25–27 functional imaging of IOS changes correlated with phototransduction process promises a new method for objective ORG assessment of photoreceptor dysfunctions with high resolution.
Recently, functional imaging of stimulus-evoked IOS changes in the retina has been actively explored.12,28,29 In addition, IOS changes in both retinal vascular layers and inner retinal layers have been also observed, which can reflect neurovascular coupling effect in the retina. 30 In this article, we will primarily focus on the summary of observations of fast photoreceptor-IOS and discuss its relationship to early phase of phototransduction process at the photoreceptor OSs.
In vitro imaging of photoreceptor-IOS
Time-lapse NIR light microscopy was initially used to image transient IOS changes in freshly isolated retinas.31–34 Technical details of the experimental setup and sample preparation have been reported in previous publications.33–35 Figure 1 shows representative NIR imaging of transient IOS changes in a freshly isolated frog retina. 34 As shown in Figure 1(b) and (d), the fast photoreceptor-IOS occurred almost immediately after the visible light stimulus, and the IOS magnitude and time course were found to be dependent on the stimulus strength. 36 In addition, the time-lapse microscopic observation of retinal slices, which allowed simultaneous observation of individual retinal layers, confirmed the fast IOS change at the retinal photoreceptor layer and relatively slow IOS change at the inner retina. 37 Dynamic differential IOS processing, which works as a high-pass filter, indicated that the early phase of the fast IOS can track retinal flicker stimulation tightly.38,39
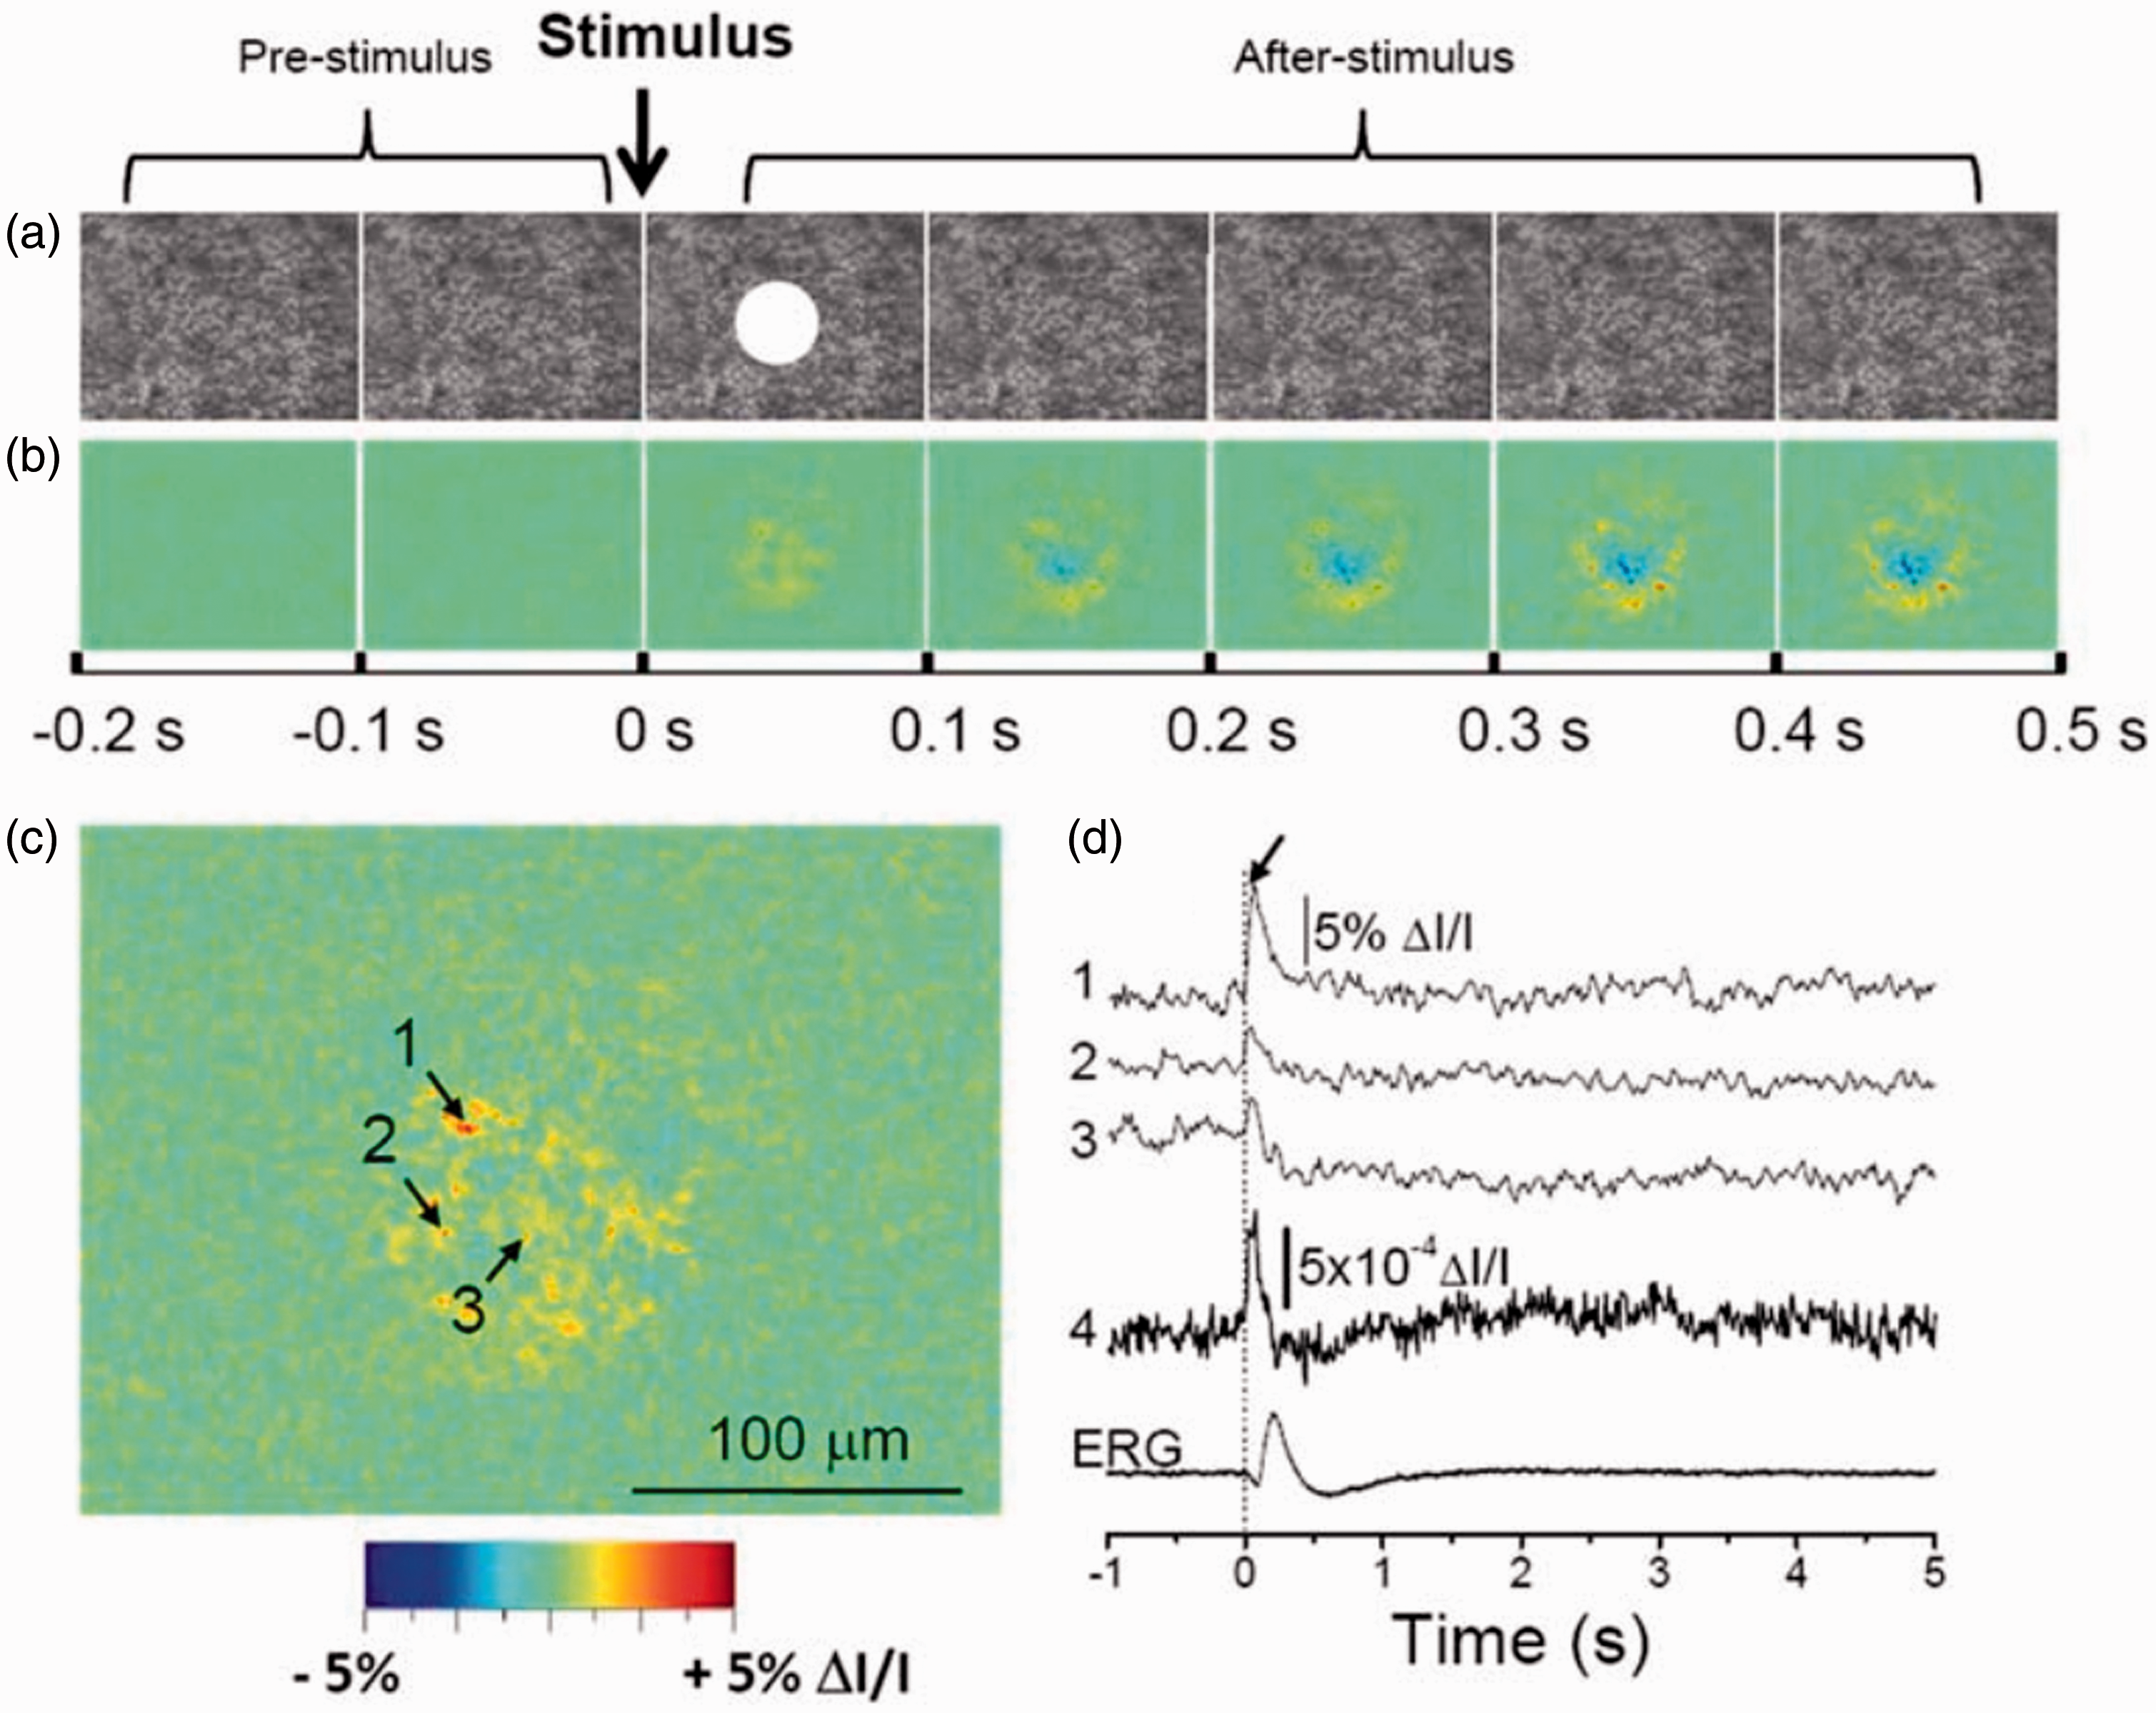
IOS imaging of a freshly isolated frog retina (Rana pipiens). (a) Representative raw image sequence of the retina. The images were recorded with a CCD camera at a speed of 80 frames/s. The white spot in the third frame shows the visible stimulus pattern. (b) Corresponding IOS images. Each frame is an average over a 100 ms interval (8 frames). 200 ms prestimulus and 500 ms poststimulus images are shown. (c) Enlarged image of the third frame shown in (b). (d) Temporal profiles of IOS change. Tracings 1 to 3 are representative IOS of individual pixels, corresponding to three points of arrows in (c). Tracing 4 represents the averaged optical response of the whole image area. The vertical line indicates the stimulus onset. ERG: electroretinography. Reprinted with permission from Yao and Zhao. 33 (A color version of this figure is available in the online journal.)
Transient photoreceptor movement was also observed in both amphibian (frog) and mammalian (mouse) retinas.40,41 The transient movement was shrinkage-induced and predominantly observed in rod photoreceptors that could rapidly shift toward the direction of the visible light stimulus (onset time: 10 ms for frog and 5 ms for mouse). Figure 2 illustrates representative time-lapse microscopy of transient photoreceptor movement in one freshly isolated mouse retina. As shown in Figure 2, transient photoreceptor movement was observed to occur almost immediately after the onset of the visible light stimulation (Figure 2(c)). Dynamic confocal microscopy and optical coherence tomography (OCT) study suggested that the photoreceptor OS is the anatomic source of the transient photoreceptor movement. 42 Indeed, stimulus-evoked OS conformational change was directly observed in retinal slices with a localized visible light stimulus. 43 This study further supports that the OS conformational change may correlate with phototransduction process, and inhomogeneous rhodopsin bleaching over the lateral dimension, i.e. the OS disc plane, may alter orientation of retinal photoreceptors. As shown in Figure 3, time-lapse microscopy revealed vertical shrinkage of rod OSs by a visible light stimulation. 44 The shrinkage of rod OSs occurred almost immediately after the onset of the visible light stimulation (Figure 3(c)). Transmission electron microscopy (TEM) further confirmed shortened inter-disc spacing in light-adapted rod OSs compared to that in dark-adapted rod OSs. 44 Since both fast IOS and transient OS conformational change occurred almost immediately after light stimulus, it is reasonable to speculate that the stimulus-evoked inter-disc narrowing can be a primary source of the fast IOS in retinal photoreceptors.
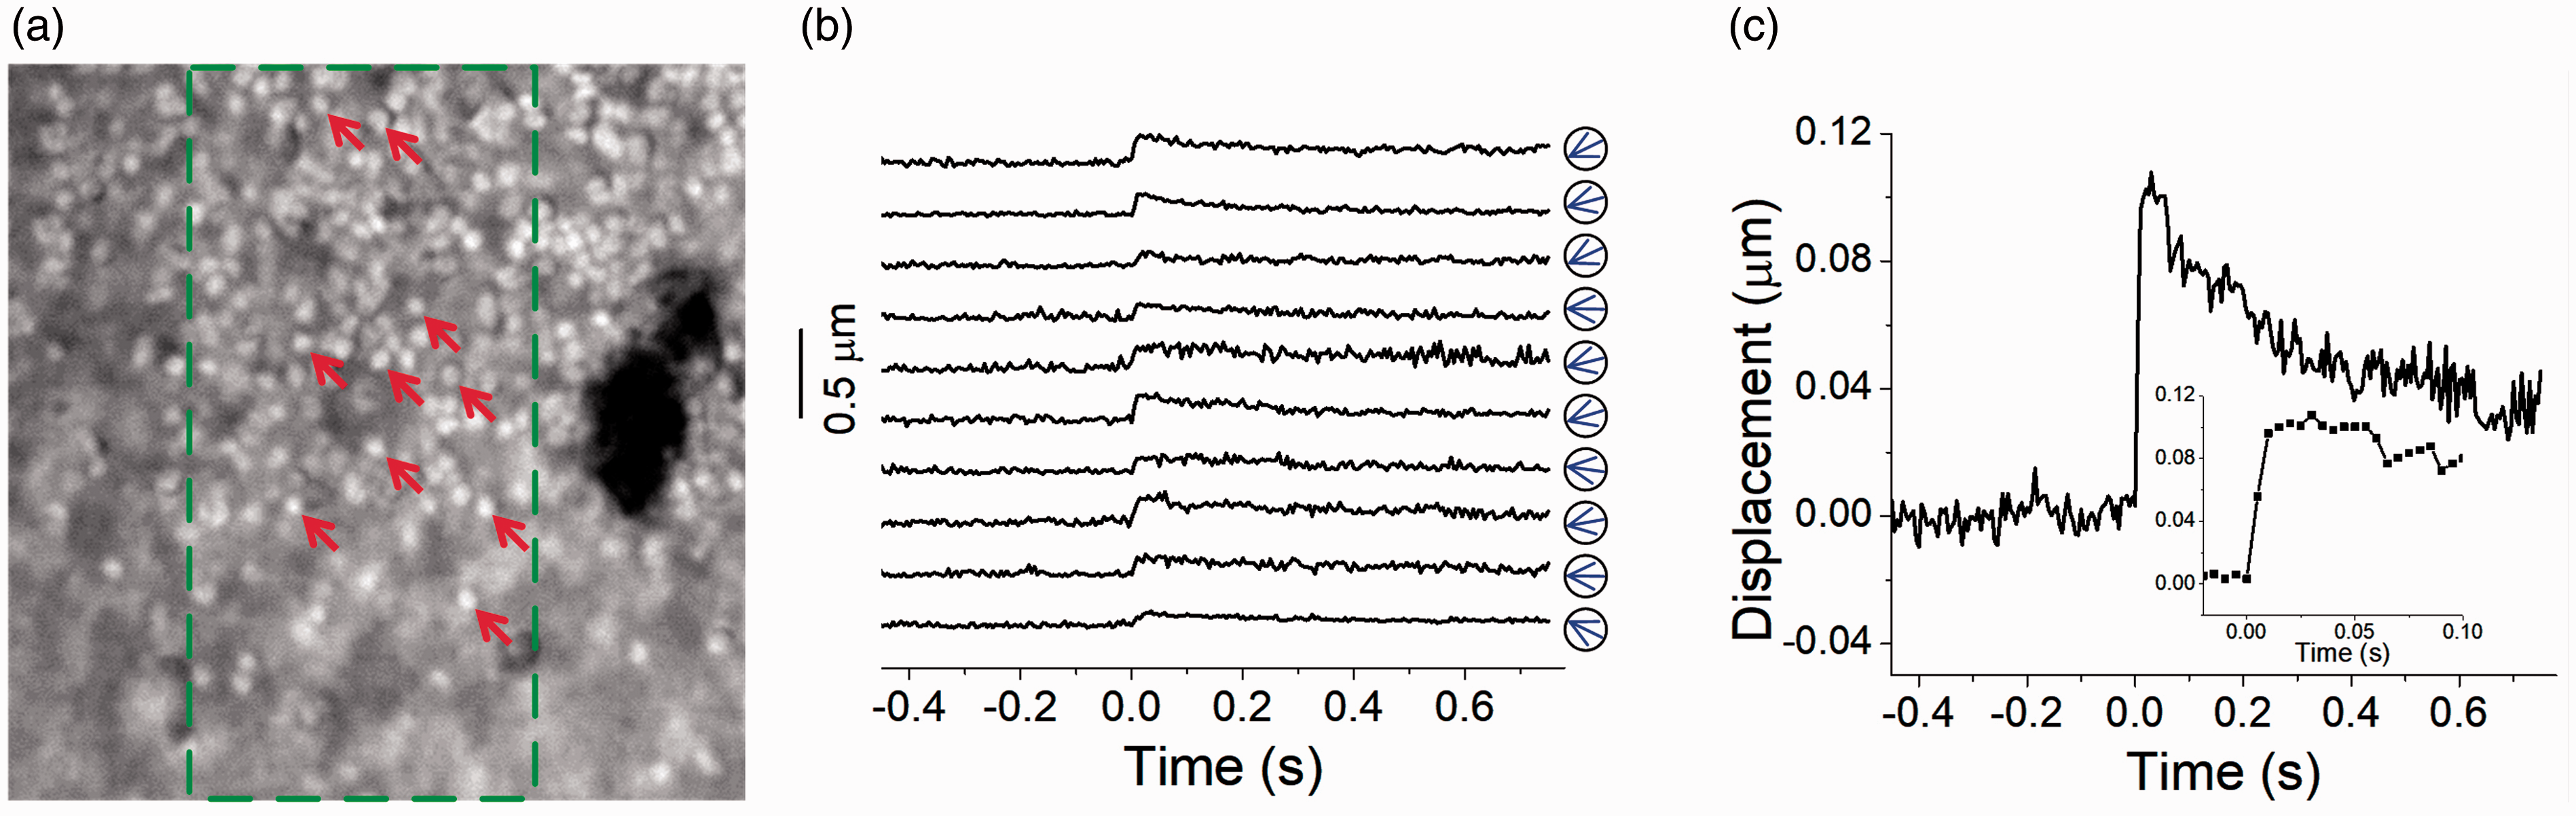
Stimulus-evoked photoreceptor movement in a mouse retina (Mus musculus). (a) NIR microscopic image of mouse photoreceptor mosaic. A 40× objective with 0.75 NA was used. The image size corresponds to a 60 × 60 µm2 area on the retina. The green dashed rectangle indicates the oblique stimulation area. (b) Displacements of 10 photoreceptors over time. The stimulus was delivered at time 0 s. These 10 photoreceptors were specified by arrows in (a). Blue arrows in circles indicate the direction of the displacement at 30 ms after light stimulus. (c) Averaged displacement of 10 photoreceptors. The inset panel shows the same data within the period from −0.02 to 0.1 s. Reprinted with permission from Lu et al.40 (A color version of this figure is available in the online journal.)
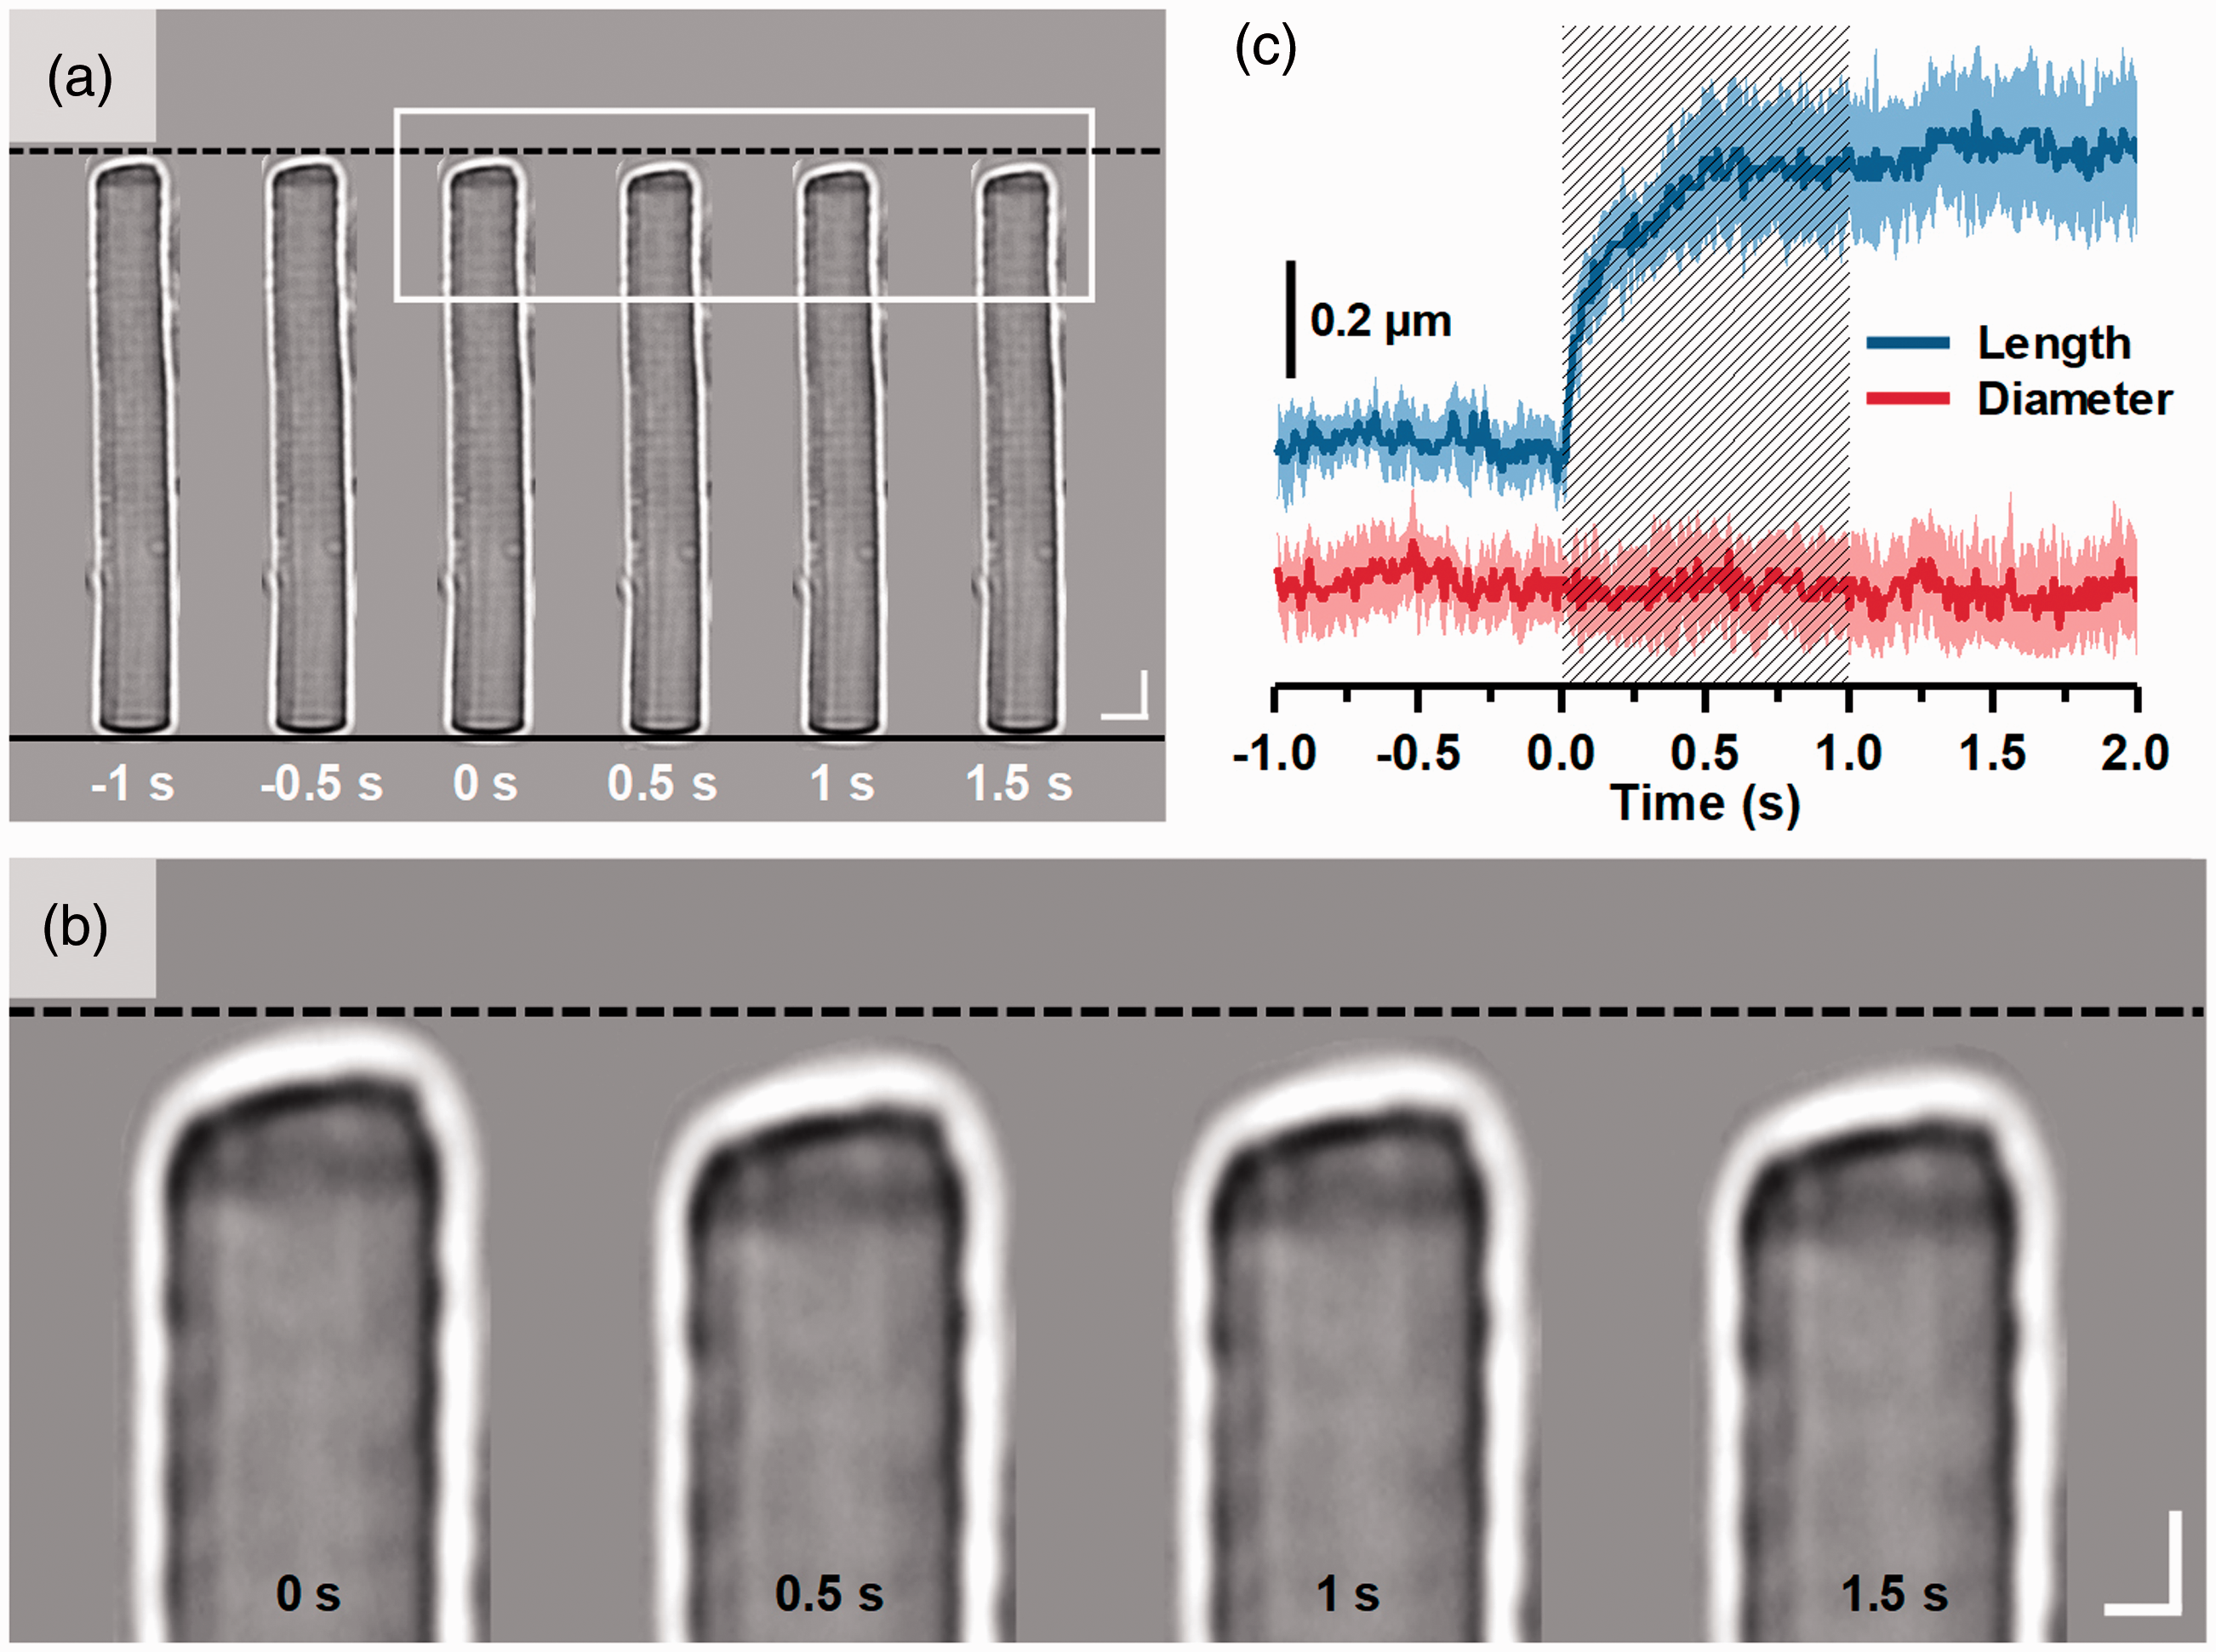
Stimulus-evoked OS length shrinkage of frog rod photoreceptor (Rana pipiens). (a) Representative microscopic images of a single isolated rod OS acquired at intervals of 0.5 s. To better show the light-evoked OS shrinkage, the base of the rod OS in each image is aligned horizontally following the black solid line at the bottom. The black-dash line at the top represents the position of the rod OS tip at time −1 s. Scale bars represent 5 µm. (b) Enlarged picture of the white rectangle in (a). Scale bars represent 2 µm. (c) Normalized OS length and diameter changes from 8 different rod OSs. A shaded area indicates the 1 s stimulation period. Reprinted with permission from Lu et al.44 (A color version of this figure is available in the online journal.)
To better understand the physiological mechanism of the fast IOS, comparative measurements of OS movement and ERG were conducted (Figure 4). It was consistently observed that the conformational change of OSs occurs earlier than the onset of the ERG a-wave that reflects the hyperpolarization of retinal photoreceptors. 45 Moreover, substitution of normal superfusing medium with low-sodium medium reversibly blocked the photoreceptor ERG a-wave, but largely preserved the stimulus-evoked rod OS movements as shown in Figure 5. 45 This observation provides a solid evidence to support that the fast IOS in retinal photoreceptors does not depend on cyclic guanosine monophosphate (cGMP) gated ion channel closure, which is the source of ERG a-wave. Rather, fast IOS and rod OS conformational changes are tied directly or indirectly to the early phase of phototransduction process that involves the sequential activation of rhodopsin, transducin, and cGMP phosphodiesterase (PDE). A recent comparative study of wild-type (WT) and retinal degeneration 10 (rd10) mice demonstrated that fast photoreceptor-IOS occurs even earlier than PDE activation. 46
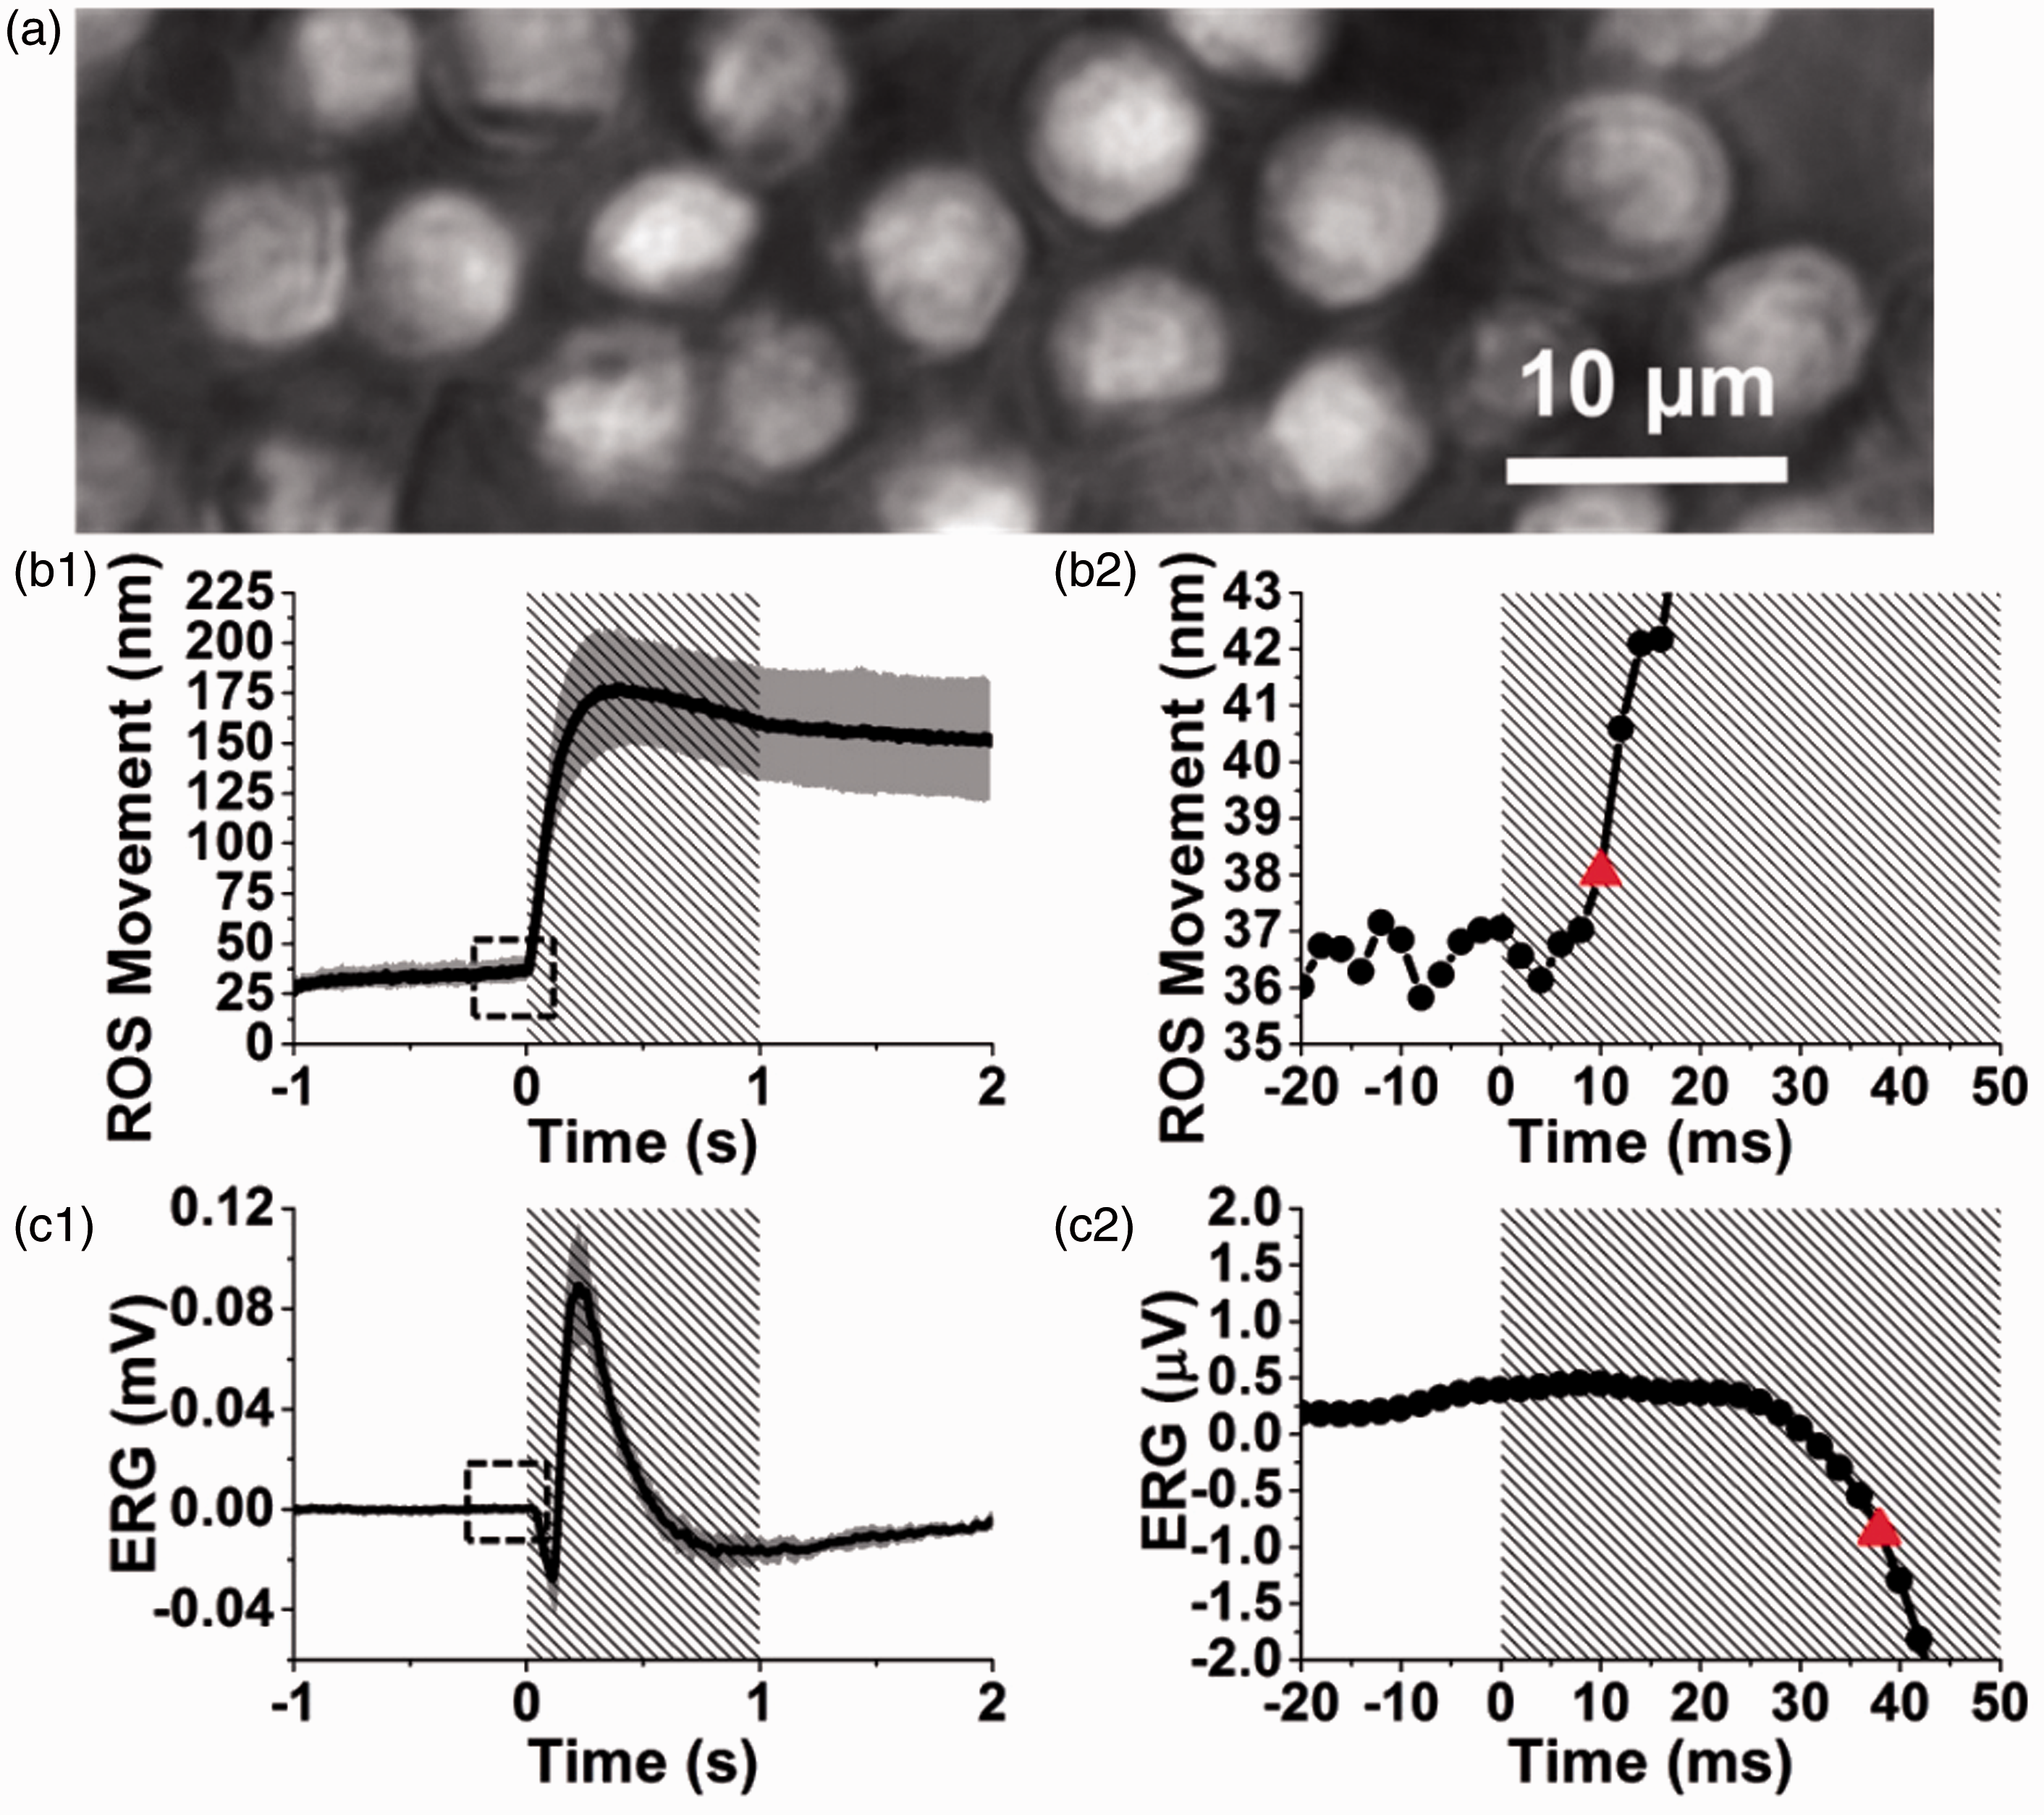
Comparative measurement of stimulus-evoked ROS movement and ERG of frog retina (Rana pipiens). (a) Representative image of ROS acquired at a frame speed of 500 fps. Temporal profiles of (b1) averaged ROS movement and (c1) averaged ERG response from 10 different retinal locations. (b2) Enlarged picture of the dashed square in (b1). (c2) Enlarged picture of the dashed square in (c1). The red triangles in (b2) and (c2) indicate the onset times determined by the 3-δ threshold of ROS movement and ERG a-wave, respectively. Shaded areas in (b1), (b2), (c1), and (c2) represent stimulation periods. ERG: electroretinography; ROS: rod outer segment. Reprinted with permission from Lu et al.45 (A color version of this figure is available in the online journal.)

Comparative measurement of stimulus-evoked ROS movements and ERGs acquired from frog retinas (Rana pipiens) with (a) control Ringer’s medium, (b) low sodium medium, and (c) recovery groups. Shaded areas represent stimulation periods. Modified with permission from Lu et al.45 ERG: electroretinography; ROS: rod outer segment. (A color version of this figure is available in the online journal.)
In vivo imaging of photoreceptor-IOS
Modified fundus camera,47–50 adaptive optics,51,52 confocal,53,54 and OCT30,55–61 systems have been explored for in vivo retinal IOS imaging of anesthetized animals30,47–50,53,54,57–59 and awake humans.51,52,55,60,61
A high-speed (200 frames/s) line-scan confocal ophthalmoscope has been used to demonstrate in vivo IOS imaging of intact frog eyes. 54 Comparative ERG measurement was implemented. As shown in Figure 6, fast photoreceptor-IOS occurs almost immediately after the onset of visible light stimulus, which is consistent with early observations with isolated retinas. 33 IOS imaging of laser-injured frog eyes demonstrated that the confocal IOS can clearly detect localized (30 µm) functional lesions in the retina before morphological abnormality is detectable. 53
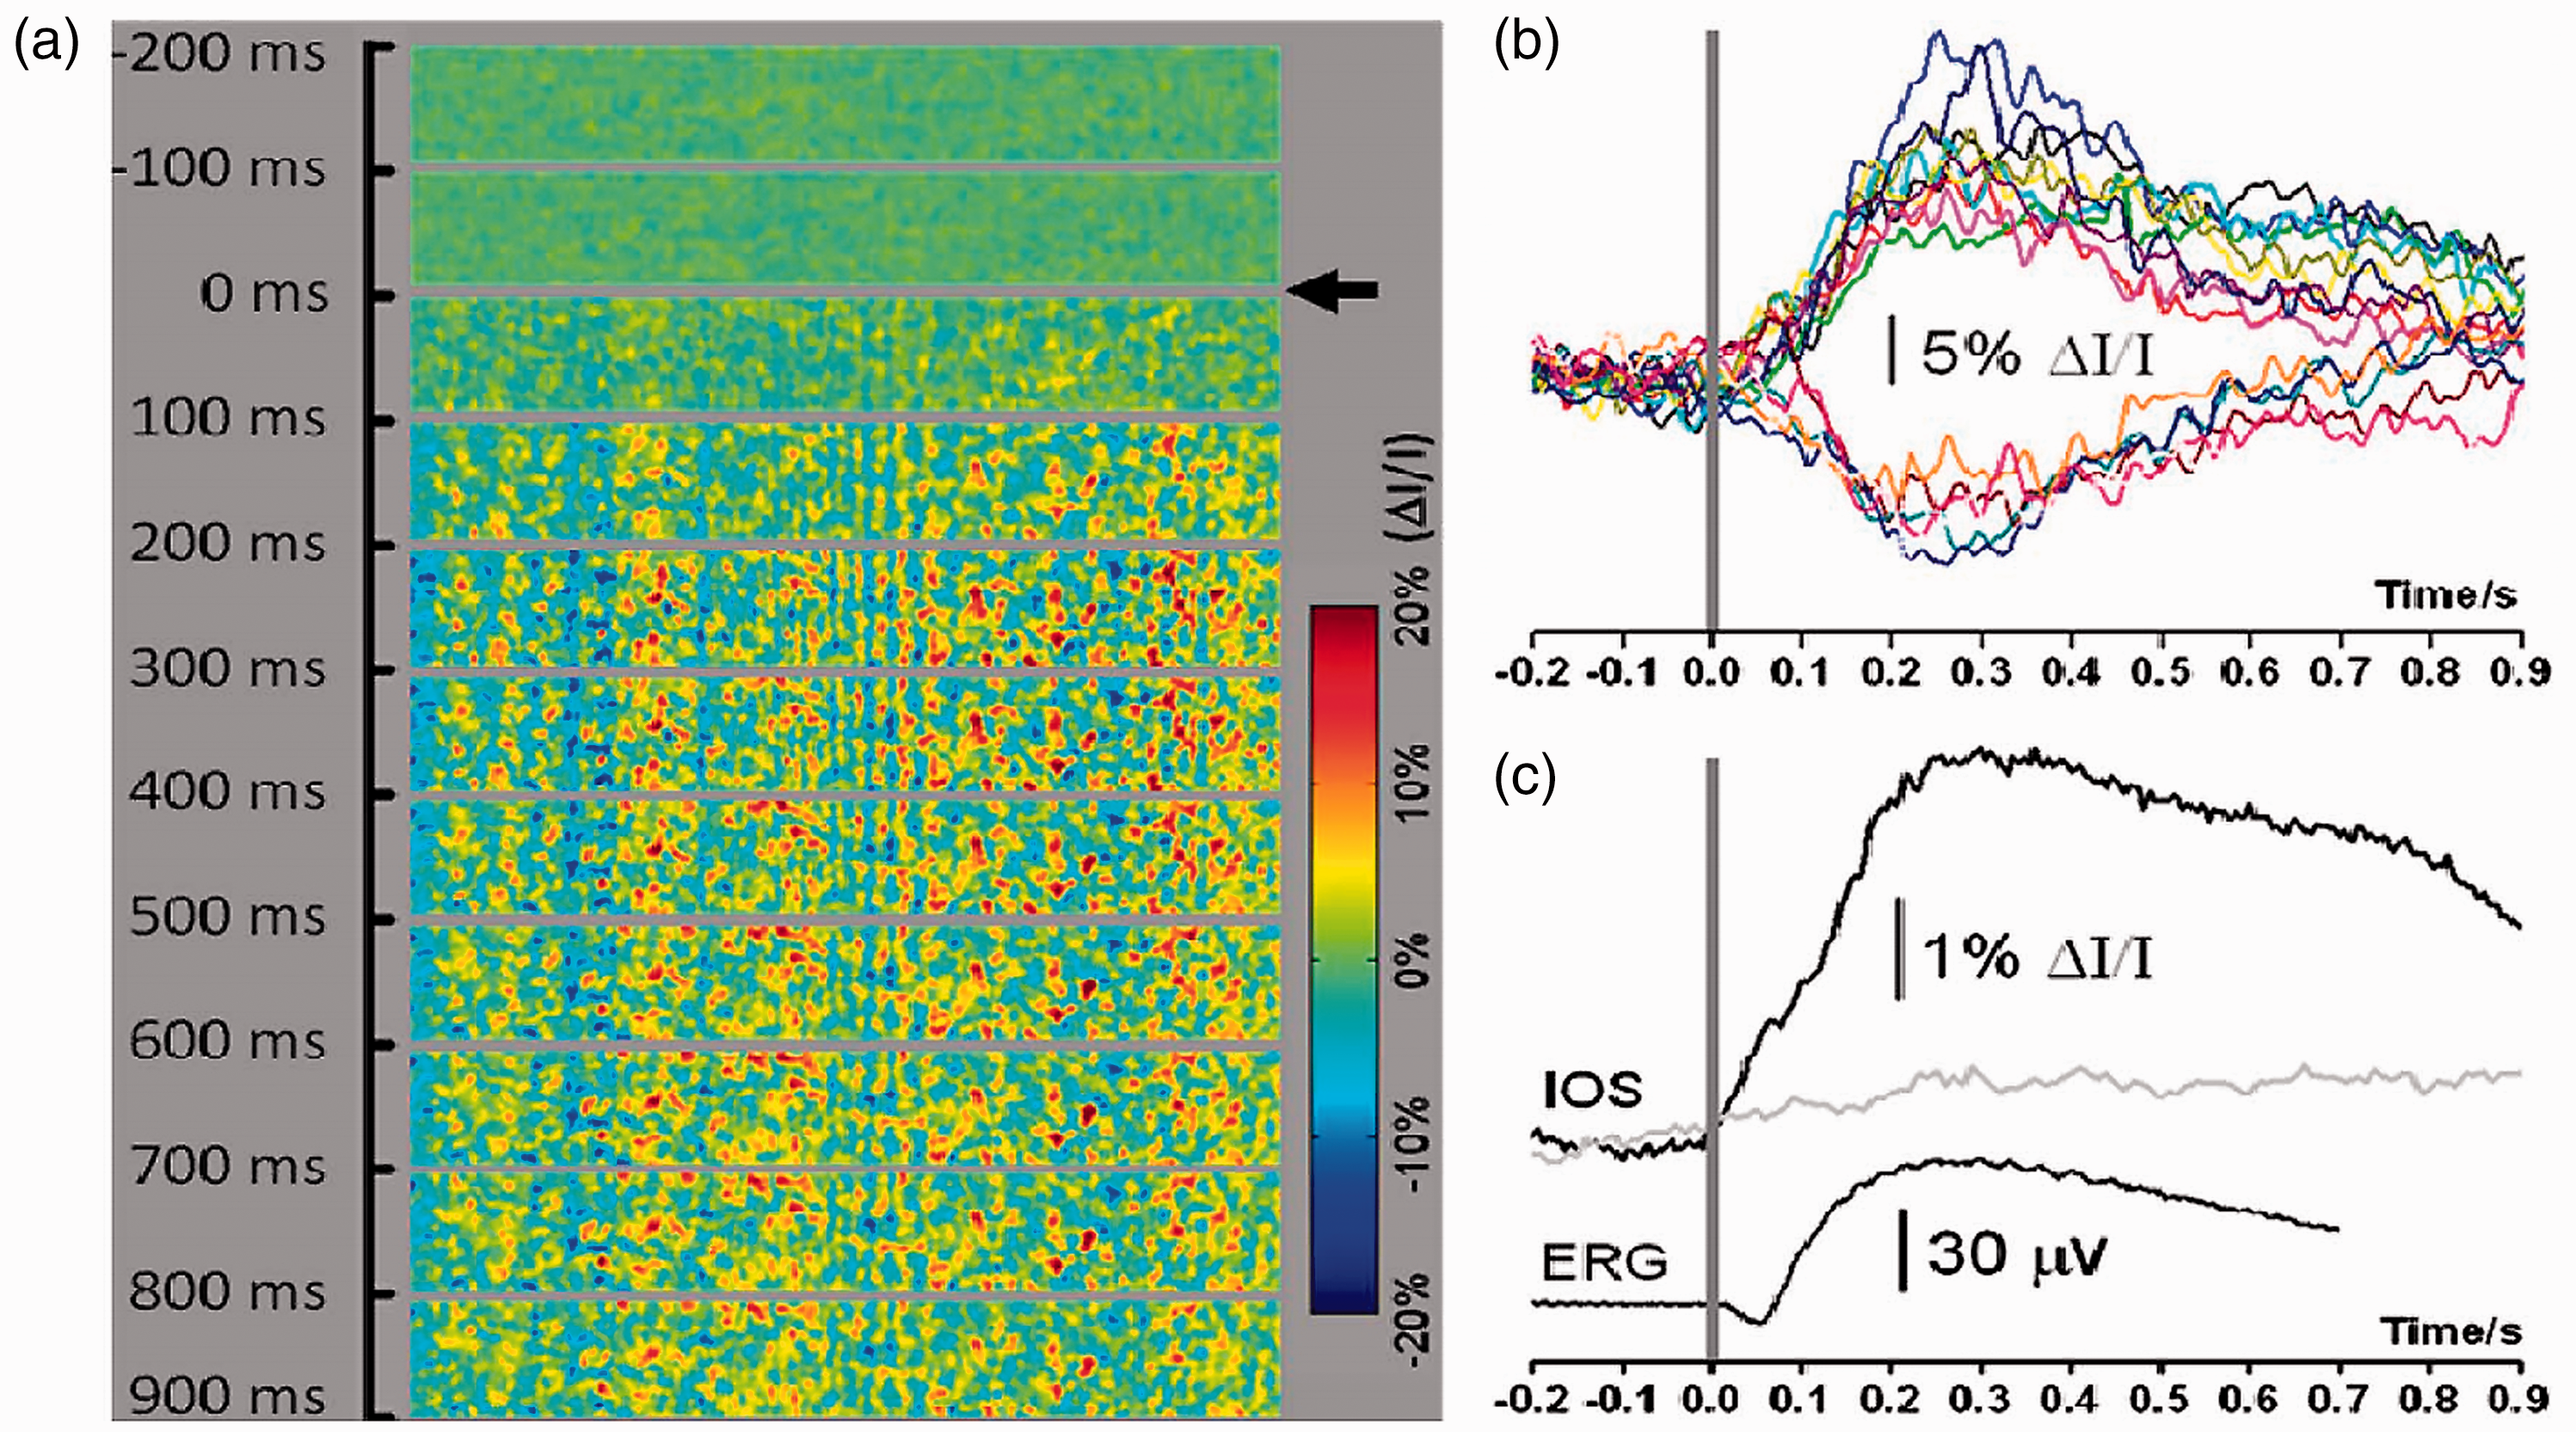
(a) In vivo IOS imaging and ERG measurement of frog retina (Rana pipiens). Each illustrated frame is an average over 100 ms interval (20 frames). The black arrowhead indicates the onset of the 10 ms green flash stimulus. 200 ms pre-stimulus baseline and 900 ms post-stimulus IOS recordings are shown. (b) Representative IOS responses of individual pixels randomly selected from the image area. The gray bar indicates the stimulus onset and duration. (c) The top black trace shows the IOS magnitude (i.e. absolute value of the IOS) averaged over the whole image area, corresponding to the image sequence shown in (a). The gray trace shows one control experiment without stimulation. The black trace below shows concurrent frog ERG. The gray bar indicates the stimulus onset and duration. ERG: electroretinography; IOS: intrinsic optical signal. Reprinted with permission from Zhang et al.54 (A color version of this figure is available in the online journal.)
Depth-resolved in vivo OCT imaging of stimulus-evoked IOS changes in frog 58 and mouse30,57 retinas further showed that the fast IOS changes were primarily observed at the photoreceptor layer, particularly the OS region. With increased stimulus duration or repeated flash stimuli, IOS changes were also detected in the inner retinal layers. Figure 7 illustrates representative OCT imaging of transient IOS changes in a mouse retina. 28 As shown in Figure 7(a2), fast IOS change consistently occurred right after the onset of light stimulation; while, relatively slow IOS changes were observed in the inner retinal layers (Figure 7(a2)), and corresponding hemodynamic changes were detected in trilaminar vascular plexuses in the retina (Figure 7(b2)).
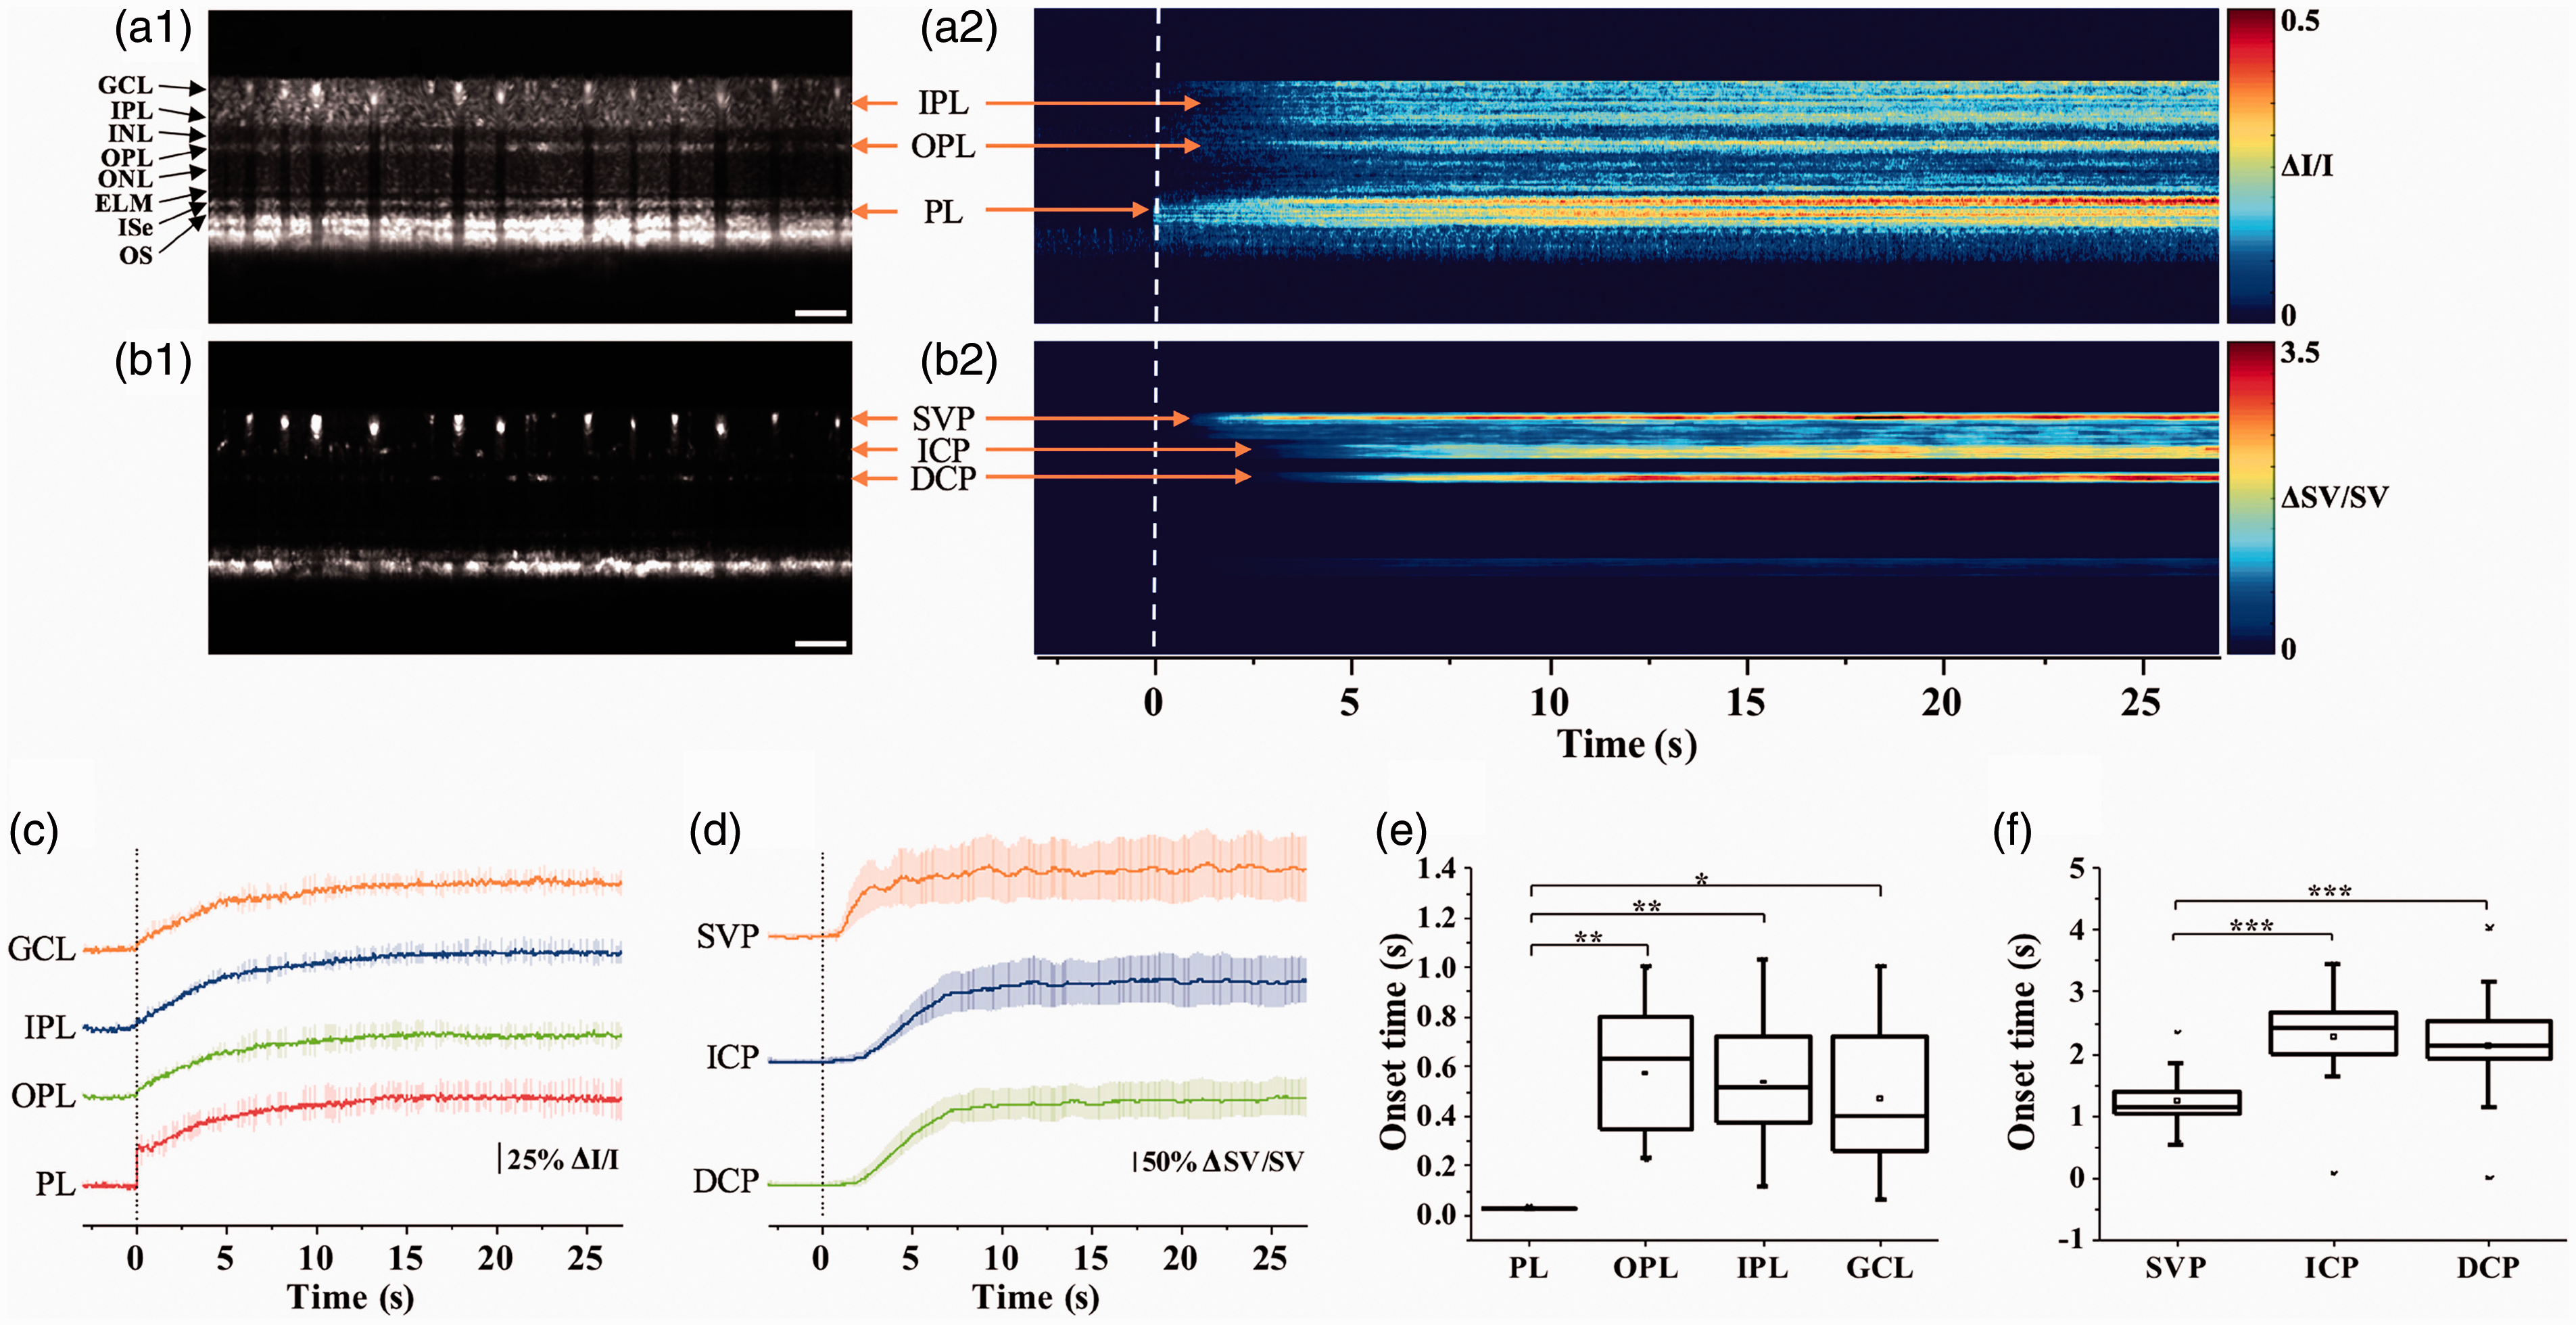
Functional OCT of stimulus-evoked neurovascular responses in a mouse retina (C57BL/6J). (a1) Representative flattened OCT B-scan and (a2) spatiotemporal neural-IOS map. (b1) Representative flattened OCTA B-scan and (b2) spatiotemporal hemodynamic-IOS map. Scale bars in (a1) and (b1) indicate 500 µm. (c) Neural-IOS changes of PL, OPL, IPL, and GCL. (d) Hemodynamic-IOS changes of SVP, ICP, and DCP. (e) Averaged onset times of neural-IOS changes at PL, OPL, IPL, and GCL. (f) Averaged onset times of hemodynamic-IOS changes of SVP, ICP, and DCP. SVP: superficial vascular plexus; ICP: intermediate capillary plexus; DCP: deep capillary plexus; GCL: ganglion cell layer; IPL: inner plexiform layer; OPL: outer plexiform layer; PL: photoreceptor layer. Reprinted with permission from Yao et al. 28 (A color version of this figure is available in the online journal.)
High-speed adaptive optics imaging has revealed millisecond level intensity fluctuations in human photoreceptors, and cone waveguiding efficiency was speculated to be enhanced shortly following the bleach of visual pigment. 62 Similarly, phase-sensitive OCT imaging of awake human retinas revealed rapid reduction of optical pathlength (OPL) of photoreceptor OSs. 61 The rapid OPL decrease of OSs also showed a time course of millisecond level, which is consistent with that of stimulus-evoked fast photoreceptor-IOS in animal models.43,45
Discussion
Biophysical mechanism of the fast photoreceptor-IOS may attribute to transient OS shrinkage.43,44 Comparative TEM has revealed shortened inter-disc spacing of OSs in light-adapted retinas compared to that in dark-adapted retinas. 44 Fast X-ray diffraction studies also found a light-induced shrinkage of the disc lattice distance from both the frog and mouse rod OSs.63,64 A recent phase-sensitive OCT study has revealed transient reduction of OPL of photoreceptor OSs, 61 which is consistent with the vertical shrinkage of photoreceptor OS. 44 In addition, both the fast photoreceptor-IOS and OS shrinkage occur immediately following the visible light stimulation,31–33 which is much faster than ERG a-wave generation.45,53,54 These facts appear to provide evidence that the fast IOS and OS physical response may share the same physiological mechanism as well as they may stem from the early phase of phototransduction.
Figure 8 illustrates five steps of the phototransduction process: (1) activation of rhodopsin (R); (2) activation of G-protein transducin (G); (3) activation of the PDE; (4) hydrolysis of cGMP; and (5) ion channel closure, i.e. hyperpolarization of retinal photoreceptor. As shown in Figure 5, substitution of low-sodium medium did not substantially affect either the time course or the peak amplitude of the fast OS change. 45 However, the ERG response was significantly suppressed by low-sodium medium and fully recovered upon returning to normal medium (Figure 5). This indicates that fast photoreceptor-IOS change does not require the involvement of ion exchanges, accompanying the hyperpolarization of retinal photoreceptors, i.e. phototransduction step 5. In other words, this study refers the physiological origin of the stimulus evoked IOS change to the phototransduction steps 1–4.
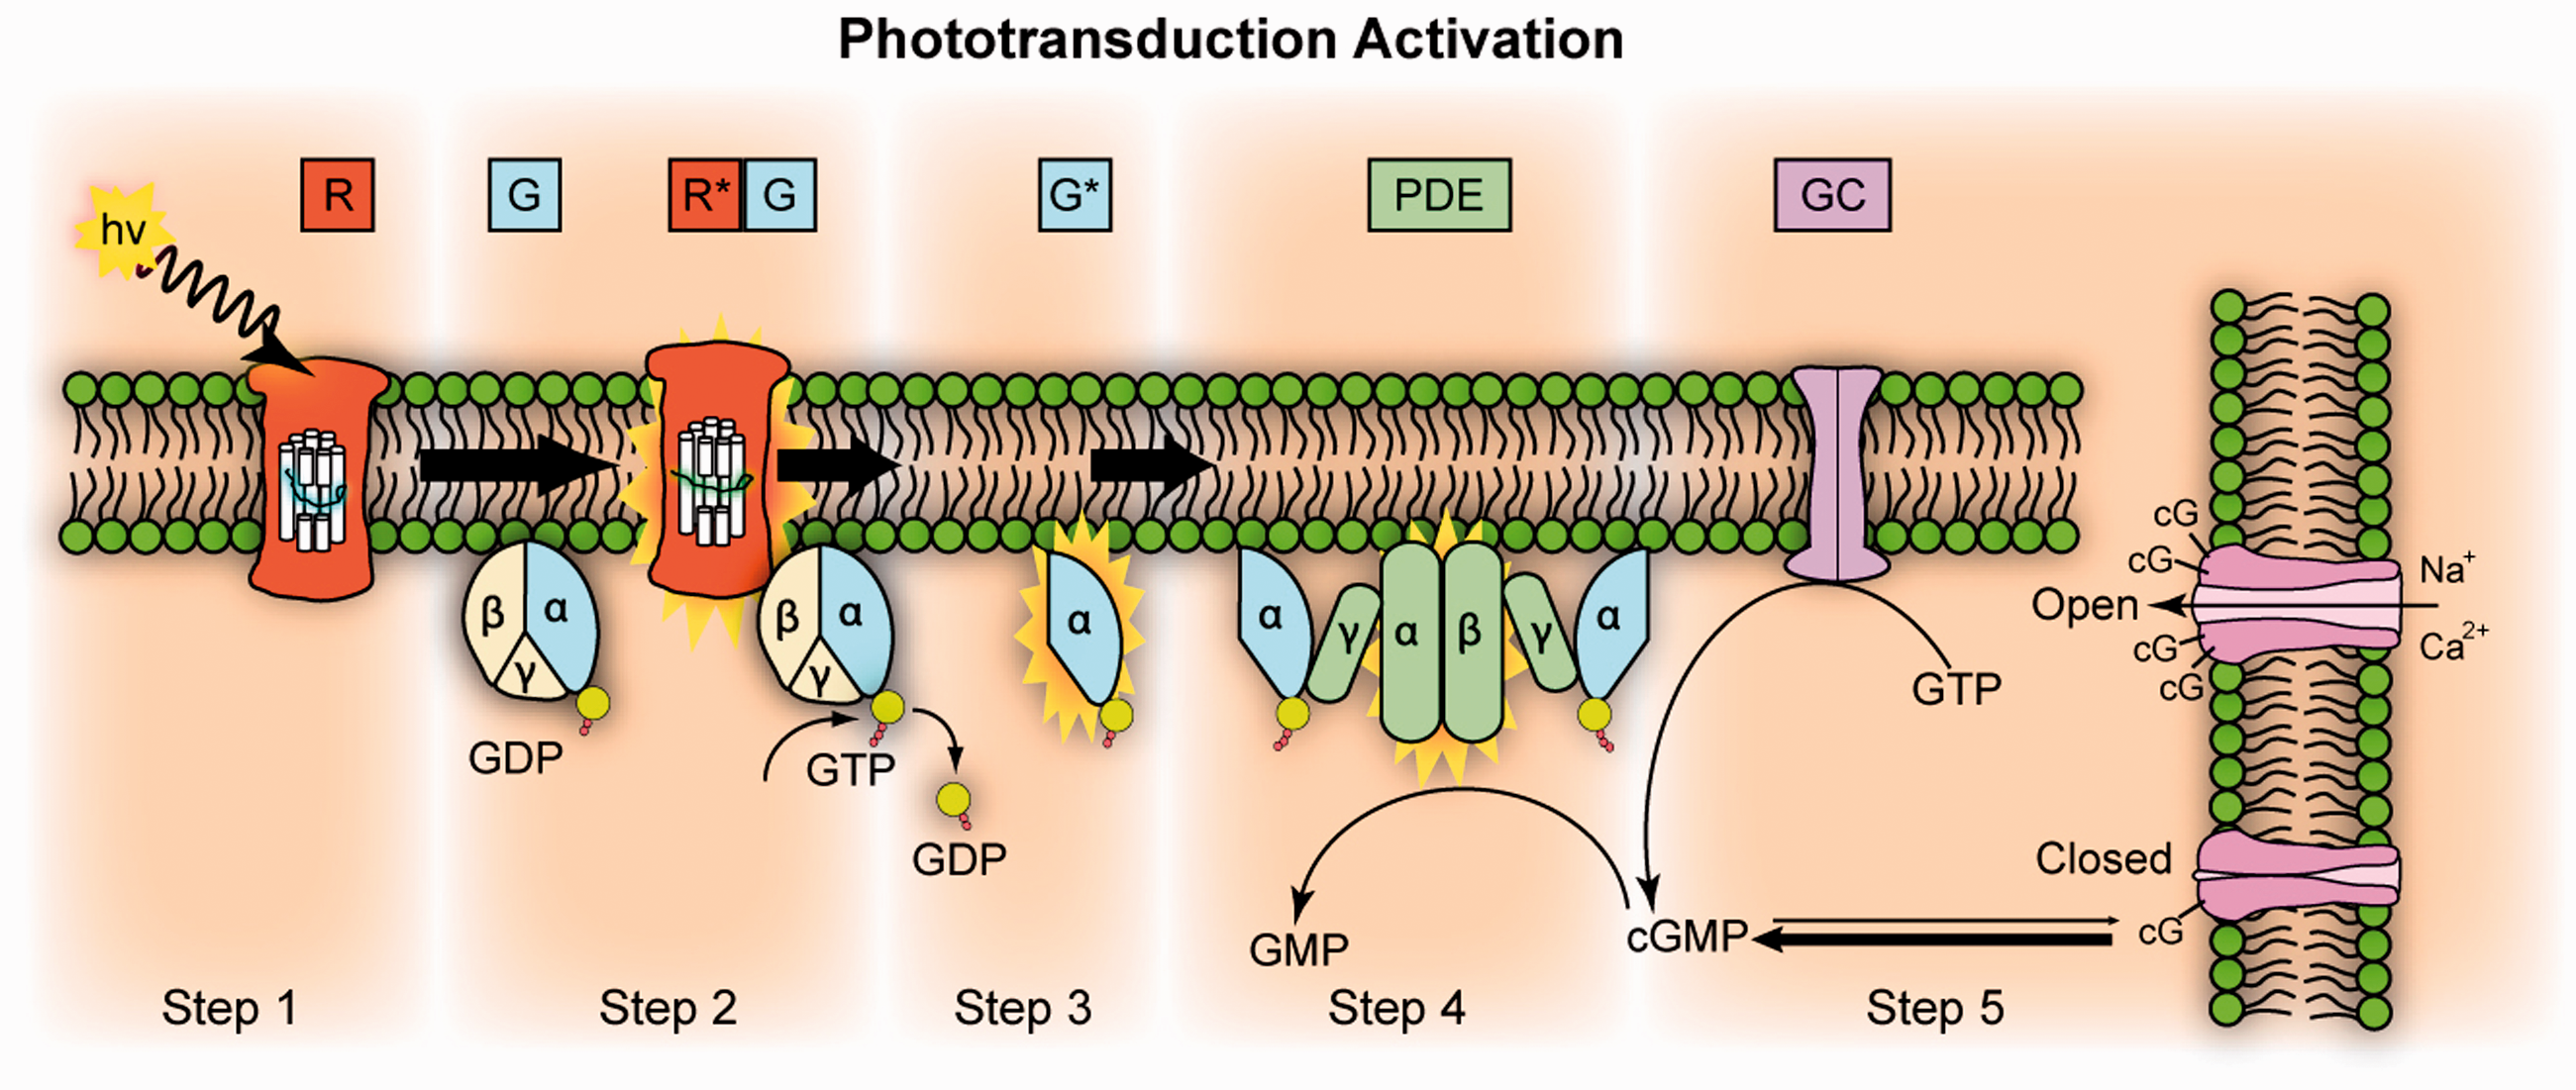
Phototransduction activation. Step 1: Incident photon (hν) is absorbed and activates a rhodopsin to R*. Step 2: R* makes repeated contacts with transducin molecules, catalyzing its activation to G*. Step 3: G* binds inhibitory γ subunits of the PDE activating its α and β subunits. Step 4: Activated PDE hydrolyzes cGMP. Step 5: GC synthesizes cGMP. Reduced levels of cytosolic cGMP cause cyclic nucleotide gated channels to close, preventing further influx of Na+ and Ca2+. GC: guanylyl cyclase; PDE: phosphodiesterase; GDP: guanosine diphosphate; GTP: guanosine triphosphate; GMP: guanosine monophosphate; cGMP: cyclic guanosine monophosphate. Reprinted from https://en.wikipedia.org/wiki/Visual_phototransduction. (A color version of this figure is available in the online journal.)
A preliminary study of WT and rd10 mice suggested that the fast photoreceptor-IOS might have a triggering point even before the PDE activation, i.e. phototransduction step 3. 46 The rd10 mice are a model of autosomal recessive RP and have a spontaneous mutation of the β-subunit of the PDE. 65 The PDE deficiency in rd10 can cause the accumulation of cGMP and then produce rod photoreceptor degeneration. However, as the rods still express about 40% of endogenous PDE in the rd10 mouse, it has a relatively delayed onset of rod photoreceptor degeneration. 66 Before postnatal days 15 (P15), the relative expression level of rhodopsin and transducin in rd10 mice are similar with that in WT mice, while the relative expression level of PDE in rd10 mice is about 21%–28% of that in WT mice. 66 If the PDE is involved in the production of the fast photoreceptor-IOS, the signal magnitude in rd10 should be smaller than that in WT as the relative expression level of rhodopsin and transducin are similar. Therefore, a comparative study of WT and rd10 mice before P15 can test the effect of PDE deficiency on the fast photoreceptor-IOS. As shown in Figure 9, the preliminary study revealed similar IOS changes in WT and rd10 retinas at P14, but significant difference was observed at P16. At P16, it is known that the relative expression level of rhodopsin and transducin is low in rd10 compared to WT. Therefore, this observation supports that the fast photoreceptor-IOS has a signal source even before the phototransduction step 3, i.e. the PDE activation is behind the onset of photoreceptor-IOS response. 46
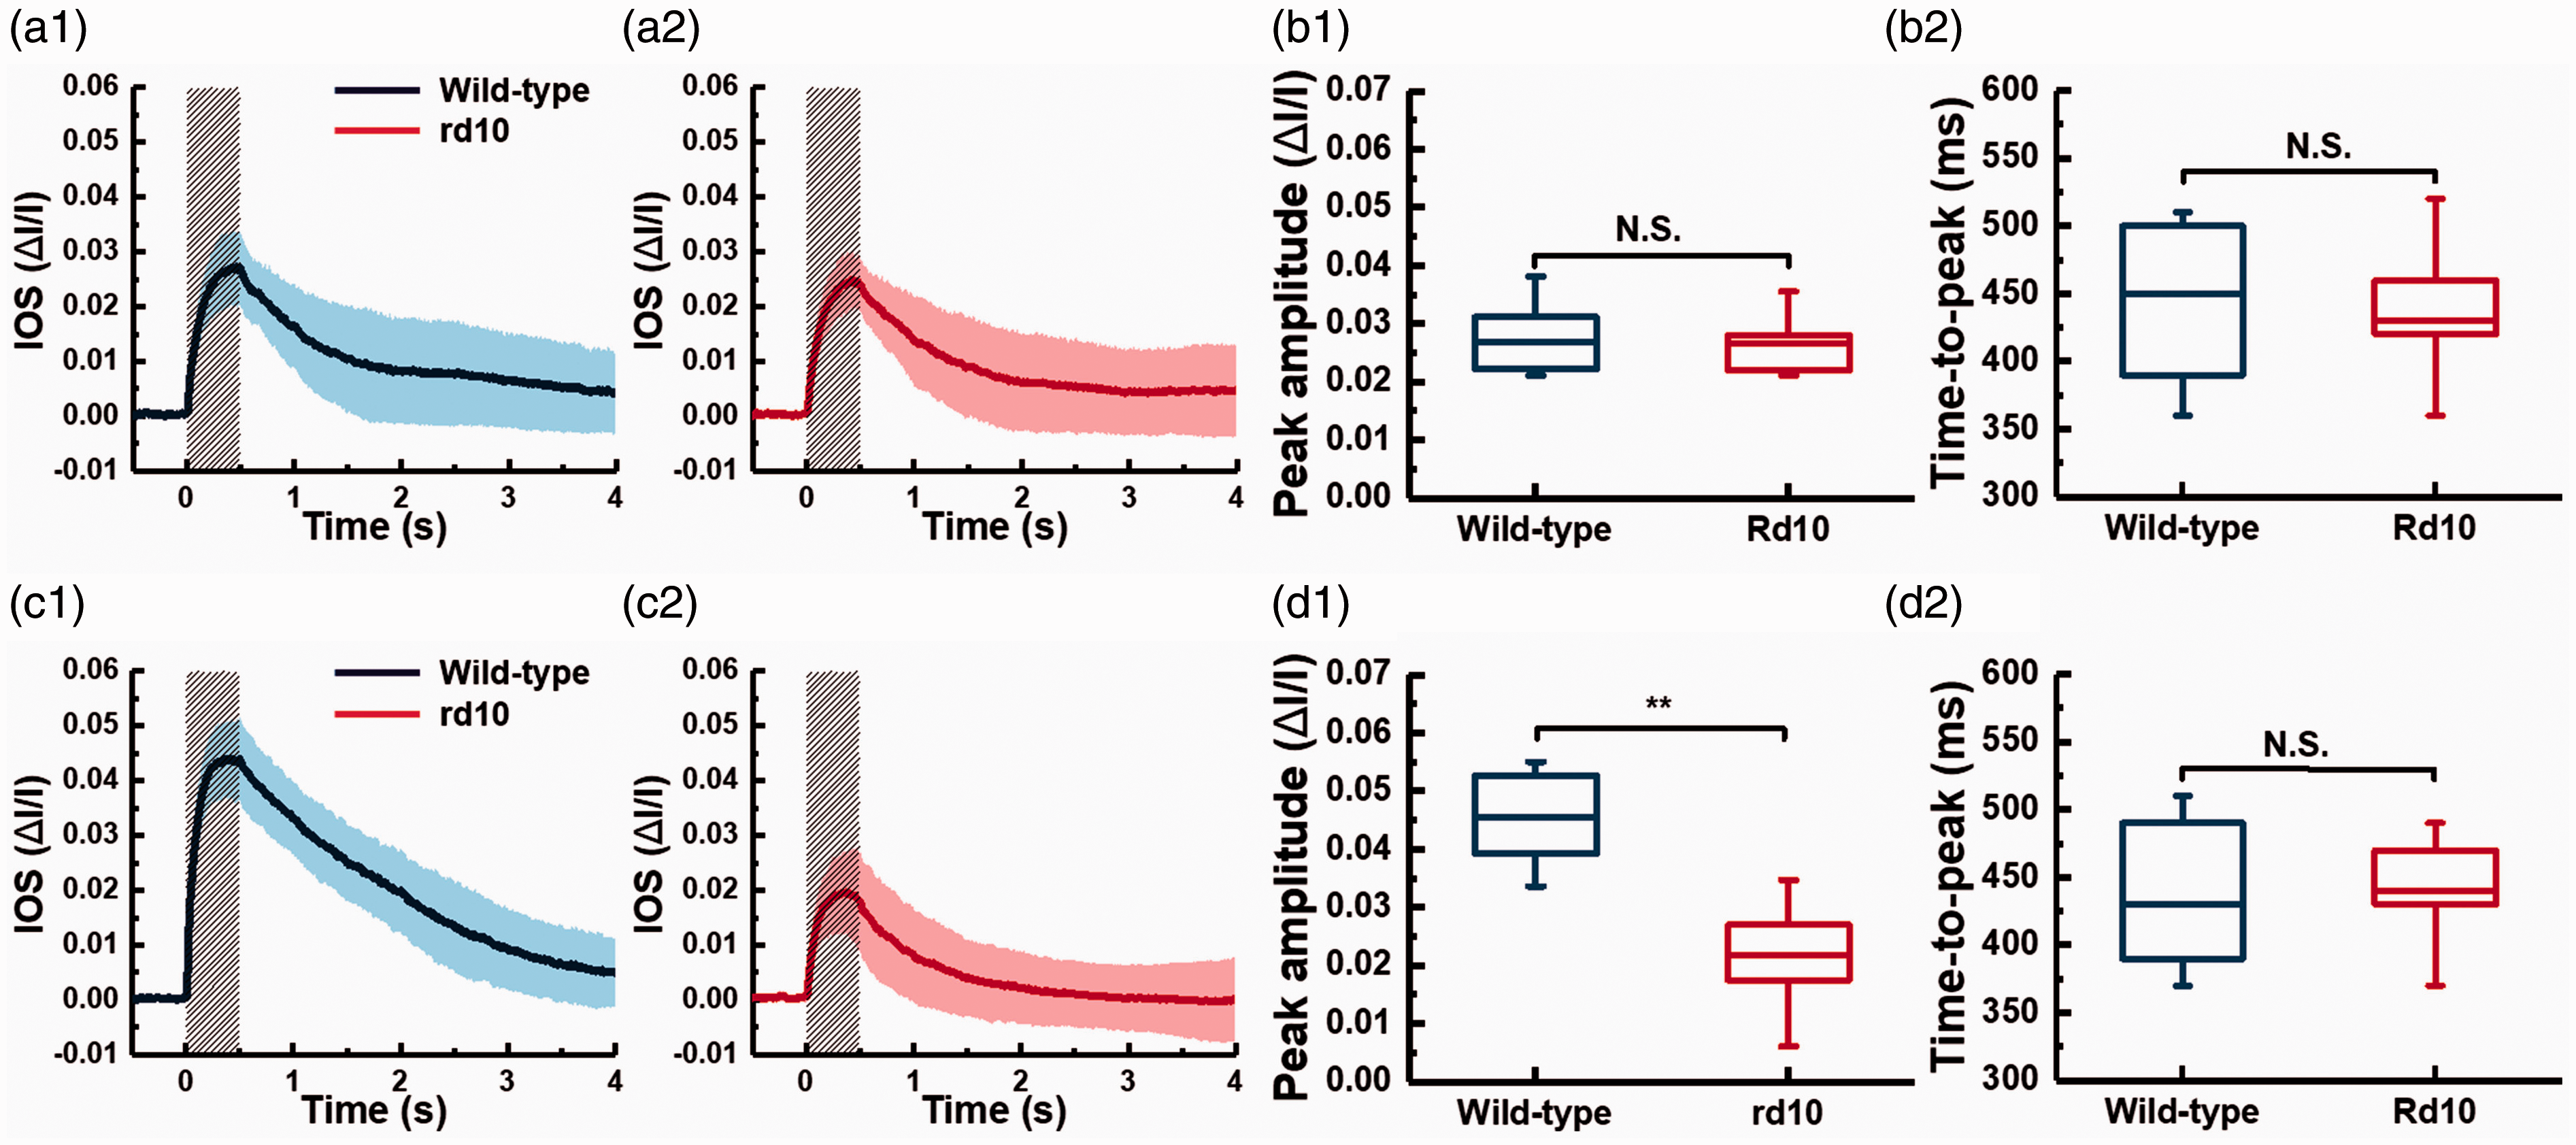
Comparative photoreceptor-IOS measurements in WT (C57BL/6J) and rd10 (B6.CXB1-Pde6brd10/J) mice at P14 and P16. (a1) and (a2) show averaged photoreceptor-IOS responses recorded from 12 WT and 12 rd10 retinas at P14. (b1) and (b2) are statistics of peak amplitudes and time-to-peaks corresponding to the data shown in (a1) and (a2), respectively (n = 12, NS = not significant). Averaged magnitude-temporal curve of photoreceptor-IOS responses from (c1) 12 WT mouse retinas and (c2) 12 rd10 mouse retinas at P16. (d1) and (d2) are statistics of peak amplitudes and time-to-peaks corresponding to the data shown in (c1) and (c2), respectively (n = 12, NS = not significant, **P < 0.05). Significance was determined by a two-sample t-test with equal variance assumed. The normality of data was determined using the Kolmogorov-Smirnov test. Each solid curve in (a) and (c) represents the mean values, and the accompanied colored area represents the corresponding standard deviations of the photoreceptor-IOS responses. The gray shaded areas represent stimulus duration. Reprinted with permission from Lu et al.46 (A color version of this figure is available in the online journal.)
Taken together, the similarity of the properties of the fast photoreceptor-IOS to that of ERP strongly argues that both are produced by a similar phenomenon. The ERP is caused by the rapid movement of charge across the photoreceptor plasma membrane produced by conformational change in rhodopsin after bleaching, the phototransduction step 1. 67 The ERP increases linearly with the intensity of the light stimulus. Similarly, the magnitude of fast IOS response also showed a positive correlation with the number of incident photons. 57 Recent in vivo human studies also reported a light-evoked rapid decrease of OPL within the cone OSs in a few milliseconds.60,61 These results demonstrate the potential capability of the fast IOS as a new imaging biomarker that probes the early phase of phototransduction in the photoreceptors. However, further investigations, such as comparative ERP and IOS measurement with different bleaching levels, are required to verify the exact effects of the early phase of phototransduction on the fast photoreceptor-IOS. Moreover, it is not clear if the observed transient OS shrinkage may affect physiological properties of the supporting tissue of the retina. Light-evoked expansion of choroidal thickness and subretinal space has been reported in mouse models. 68 Further characterization of the relationship between the transient photoreceptor OS shrinkage and posterior segment dynamic may provide new biomarkers for functional ORG assessment of retinal physiology.
Conclusion
Fast photoreceptor-IOS, which may attribute to step 1 and/or step 2 of phototransduction, has been imaged in animals and human subjects. Further development of the fast IOS imaging technology promises an objective method for high resolution ORG assessment of activation phase of phototransduction, improving early detection and clinical management of AMD, DR, RP, and other eye diseases which can cause photoreceptor dysfunctions.
Footnotes
Authors’ contributions
XY drafted a first version of the manuscript, and TK contributed to manuscript revision and figure preparation.
DECLARATION OF CONFLICTING INTERESTS
The author(s) declared no potential conflicts of interest with respect to the research, authorship, and/or publication of this article.
FUNDING
The author(s) disclosed receipt of the following financial support for the research, authorship, and/or publication of this article: This research was supported in part by NIH grants R01 EY023522, R01 EY030101, R01EY030842, R01EY029673, and P30 EY001792; by Richard and Loan Hill endowment; and by unrestricted grant from Research to Prevent Blindness.