
Abstract
In photoacoustic tomography (PAT), conventional image reconstruction methods are generally based on the assumption of an ideal point-like ultrasonic detector. This assumption is appropriate when the receiving surface of the detector is sufficiently small and/or the distance between the imaged object and the detector is large enough. However, it does not hold in endoscopic applications of PAT. In this study, we propose a model-based image reconstruction method for endoscopic photoacoustic tomography (EPAT), considering the effect of detector responses on image quality. We construct a forward model to physically describe the imaging process of EPAT, including the generation of the initial pressure due to optical absorption and thermoelastic expansion, the propagation of photoacoustic waves in tissues, and the acoustic measurement. The model outputs the theoretical sampling voltage signal, which is the response of the ultrasonic detector to the acoustic pressure reaching its receiving surface. The images representing the distribution map of the optical absorption energy density on cross-sections of the imaged luminal structures are reconstructed from the sampling voltage signals output by the detector through iterative inversion of the forward model. Compared with the conventional approaches based on back-projection and other imaging models, our method improved the quality and spatial resolution of the resulting images.
Keywords
Impact Statement
This study offers a promising solution for the issue of image quality degradation in endoscopic photoacoustic tomography caused by detector effects. The proposed model-based scheme involves two steps: establishing the forward imaging model and inversing the forward model through iterative optimization. The imaging model physically describes the light transport, generation of initial pressure, acoustic propagation, and acoustic measurement where the temporal and spatial responses of the detector are incorporated. Our findings have demonstrated improved reconstruction quality by our method compared with conventional back-projection reconstruction and other reconstruction enhancement methods. This study makes a significant contribution to the literature because our approach showed superior performance in improving the quality of endoscopic photoacoustic tomography images.
Introduction
Photoacoustic tomography (PAT) has been a fast-developing hybrid imaging technique in the past two decades. It can provide high absorption contrast of optical imaging and superior spatial resolution of ultrasonic imaging in deep biological tissues. Reconstructions of high-quality images representing the distribution of optical absorption, initial pressure, and optical parameters of the imaged tissues are essential in PAT. Conventional methods such as analytical methods,1–5 time reversion (TR), 6 and iterative methods7–9 enable reconstructions with high quality from complete acoustic measurements. They are generally based on the premise of an ideal point detector with omnidirectional responses (i.e. it is equally sensitive to pressure waves from any direction), ignoring the effects of the detector responses on the acoustic measurements. However, to collect weak PA signals, planar unfocused ultrasonic transducers with large detection areas are usually used in practical applications, considering the drawbacks of the point detector, such as small effective area, poor sensitivity, and low signal-to-noise ratio (SNR). The diffraction effect of flat unfocused transducers affects the acceptance angle and the delay accuracy, resulting in the finite aperture effect.10,11 In addition, the sampling signal output by the transducers is the result of the convolution of the acoustic pressure reaching the transducer surface with the transducer responses. The responses of the ultrasonic transducers in receive-mode are generally depicted by their spatial impulse response (SIR) and electric impulse response (EIR). EIR characterizes the electrical response of the transducer. In contrast, SIR models the averaging effect over the active area, reflecting the anisotropic detection sensitivity caused by the finite receiving surface of the transducer. 12 If EIR and SIR are not considered in the image reconstruction algorithms, the image resolution and imaging accuracy will be reduced.
Different methods have been reported to mitigate the impact of detector properties on the quality of PAT images. We classified the main techniques into four categories: focused transducers, negative acoustic lens, compressed sensing (CS), and model-based image reconstruction, as shown in Table 1.
Comparison of methods for correcting the finite aperture effect in PA imaging.
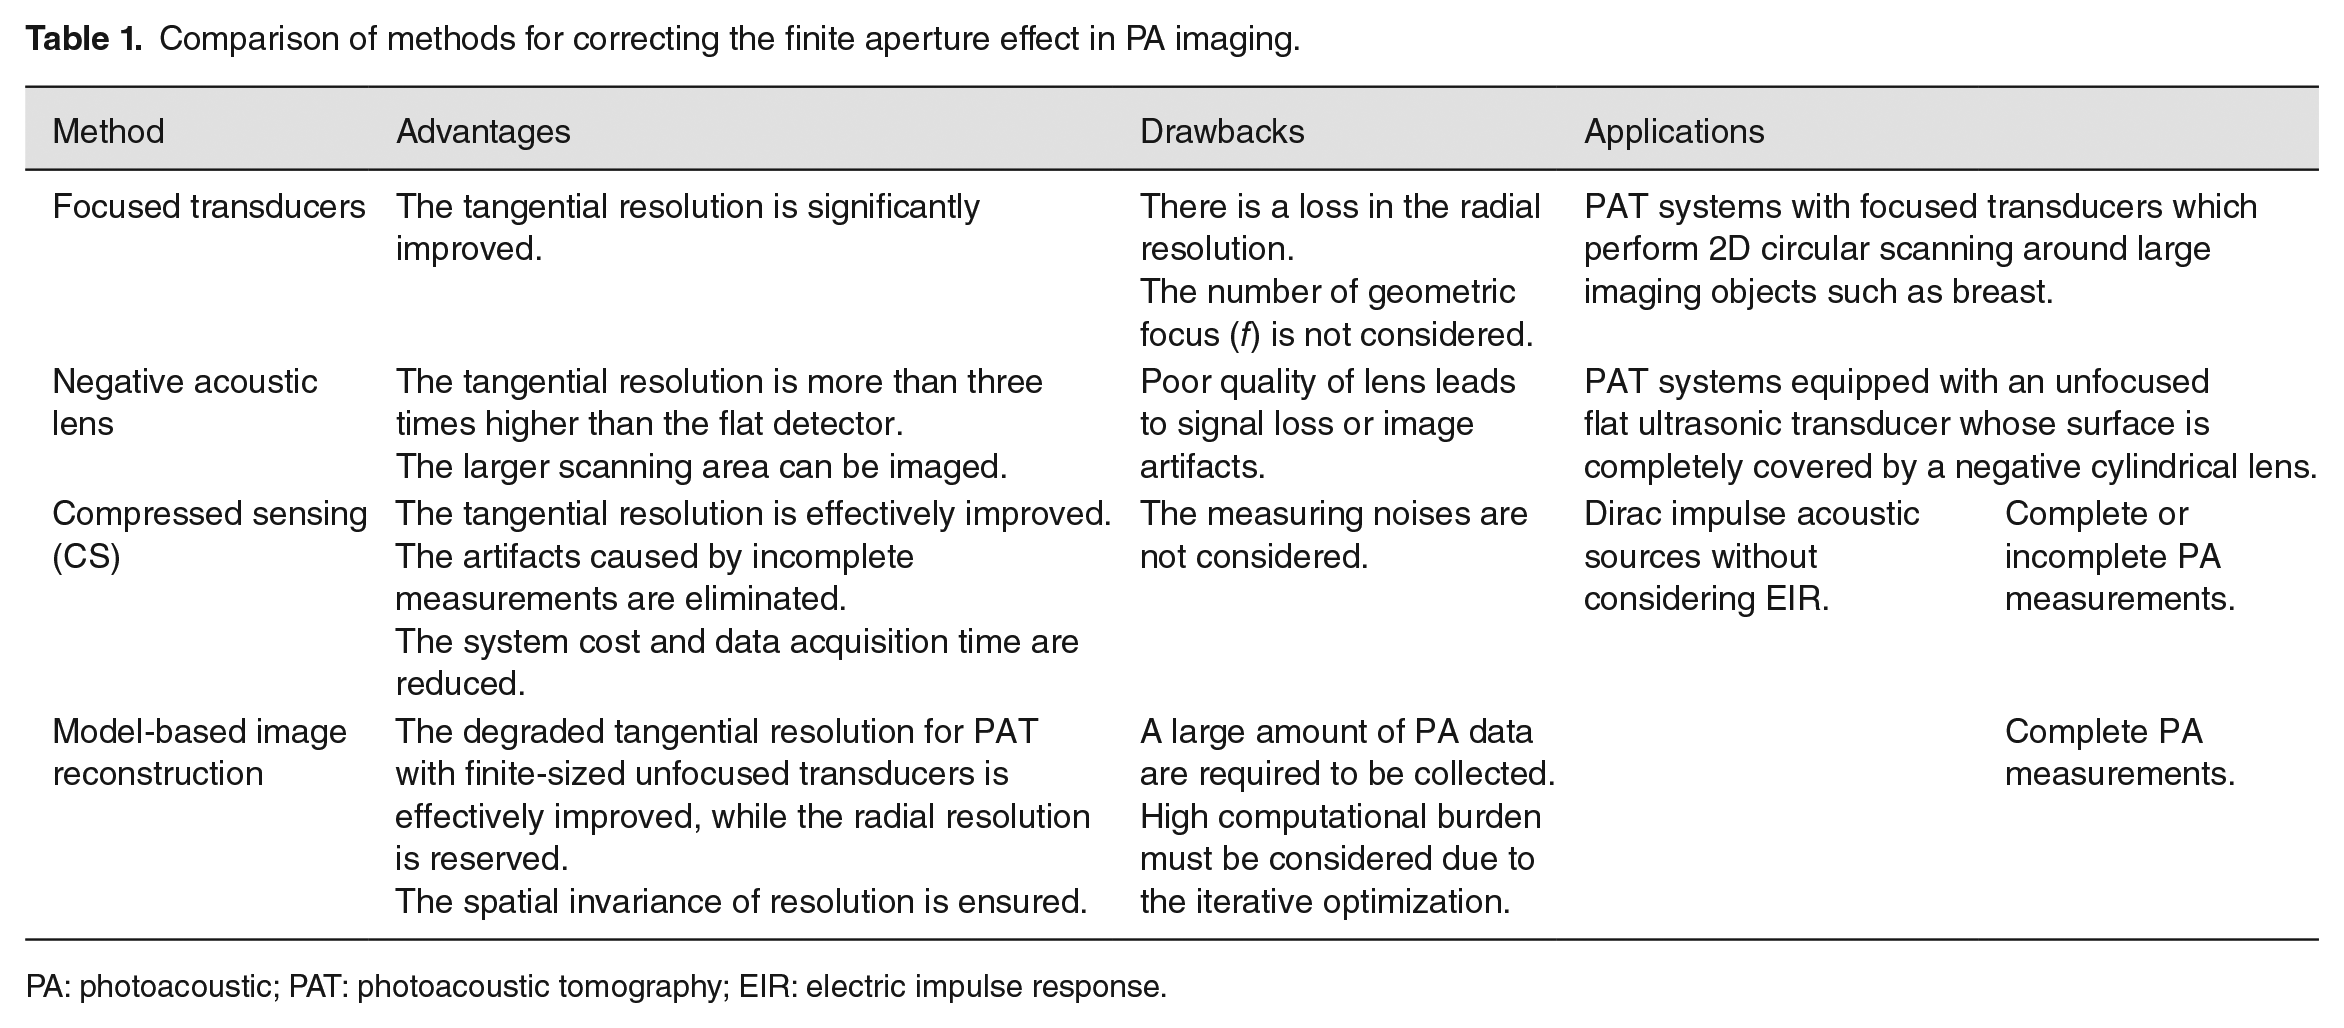
PA: photoacoustic; PAT: photoacoustic tomography; EIR: electric impulse response.
Unlike a point detector, a focused transducer enables detection of the PA radiation generated by the acoustic sources in a specific angle range by its focus, that is, a virtual point detector.10,13–15 The tangential extension of the point spread functions (PSFs) of a focused transducer is narrower than that of an unfocused transducer, improving the tangential resolution of the reconstructed images. However, this improvement is at the expense of the radial resolution.13,14 Fortunately, the trade-off between the tangential and radial resolution is acceptable, especially when imaging large objects such as breasts. 14 In addition, the f-number of a focused transducer determines its acceptance angle, which also affects the tangential and radial resolution and should be optimized to achieve optimal image reconstruction performance.
A finite-size unfocused detector has a large active area, high sensitivity, good SNR, and a slight acceptance angle. A partial solution is to use a negatively focused acoustic lens attached to the transducer surface to achieve a larger acceptance angle. With such a detector, the tangential resolution can be increased by more than three times than the flat detector.16–18 In addition, the imaging range can be further improved by enlarging the acceptance angle. However, the quality of lens fabrication, the acoustic reverberation inside the lens, and the film defects between the lens and transducer surface will lead to artifacts in images. In addition, the signal loss caused by acoustic absorption inside the acrylic lens and the impedance mismatch between the acoustically coupled mineral oil and the acrylic lens must also be considered.
CS has been a practical scheme for reconstructing images from incomplete measuring data. It can remove artifacts originating from incomplete measurements while significantly reducing the system cost and data acquisition time. For instance, Chiu et al. 19 presented a CS-based method to eliminate the finite aperture effect in PAT image reconstruction by incorporating the SIRs of the finite-sized flat transducer into the linear discrete imaging model. However, they did not consider the impact of noises in the experimental verification.
The model-based scheme has been demonstrated effective in reconstructing images with high quality from complete or incomplete measurements.20–26 In this scheme, image reconstruction essentially involves the inversion of a forward imaging model. Li and Cheng 27 and Li et al., 28 for the first time, demonstrated the feasibility of model-based reconstruction to solve the problem of the spatial resolution degradation caused by finite-sized unfocused ultrasonic transducers without changing imaging settings. Based on the discrete imaging model, they designed a spatial-temporal optimal filter used for deconvolution with the SIR of the transducer for each point in the PA data set. This method effectively improved the tangential resolution while maintaining the radial resolution. Although it provided uniform peak amplitudes of PSF in all imaging domains, the sidelobe level might become more significant in the case of the object close to the detector surface. Later, various methods for numerically compensating for the transducer effects in image reconstruction algorithms were explored.12,29–38 These methods are generally computationally burdensome because of their nature of iterative least-squares minimization. However, incorporating far-field approximation into the forward model can reduce the computational complexity. 30
In addition, deconvolution has been applied to reduce blurring in PA images caused by a finite detector size.39–45 As a post-processing method for detector data or reconstructed images, the deconvolution-based algorithms can improve the image resolution without physically increasing the numerical aperture of the imaging system. However, the possible noises introduced by post-processing procedures should not be neglected.
Recently, Luo et al. 46 presented a fast method for correcting the finite aperture effect in circular/spherical-scanning-based PAT systems. The process is based on the quick calculation of SIR-related parameters and compensation of the SIR in the framework of the blood pressure (BP) reconstruction. The simulation and phantom experiments demonstrated improved lateral resolution and SNR over the conventional BP. Luo’s method is theoretically more computationally efficient than the model-based scheme. However, they did not consider the EIR of the detector and did not conduct experimental comparisons with the model-based methods.
Note that an essential difficulty with the image reconstruction incorporating the detector effects is the unknown EIR of the transducer. It is usually measured by experiment in practical applications because it is difficult to model it accurately using relatively simple analytical models, and the parameters employed in theoretical models cannot be accurately measured.20,33 This measurement is very sensitive to noise and other errors, reducing the accuracy of the system matrix.33,47 The readers are referred to Han et al. 33 for a comprehensive survey on the progress of EIR measurement. Alternatively, a joint optimization approach can solve this issue.36,37 The measured EIR is refined with a variable projection method to recover the optical deposition by exploiting the bi-linearity of the imaging model.32,33 This approach enables low-cost and adequate compensation for the model mismatch. However, it is required to choose the regularization parameters reasonably to obtain satisfactory reconstruction results.
Endoscopic photoacoustic tomography (EPAT) is an invasive application of PAT for biological luminal structures.48–51 In this study, we present a model-based image reconstruction method for EPAT, which incorporates the SIR and EIR of the detector into the imaging model. The process involves two steps: establishing a forward imaging model and inversing the forward model through iterative optimization. Results of verification and comparison with conventional BP and other model-based algorithms demonstrate the superiority of our method in improving the quality of EPAT images.
Materials and methods
Forward imaging model incorporating detector responses
EPAT utilizes an imaging catheter with a probe mounted on its tip inserted into the target cavity or lumen. As shown in Figure 1, the transversal imaging plane, that is, the cross-section of the luminal structure, is perpendicular to the catheter located in the image center. The collimating light source is the inward photon flow at the surface boundary facing the source. Light transport in the tissues is modeled by the radiative transfer equation (RTE), which is simplified as a diffusion equation (DE) based on the assumption that the reduced scattering coefficient is much larger than the absorption coefficient. 52 Solving the DE produces light fluence. The optical deposition is proportional to the absorption coefficient and light fluence as follows 53
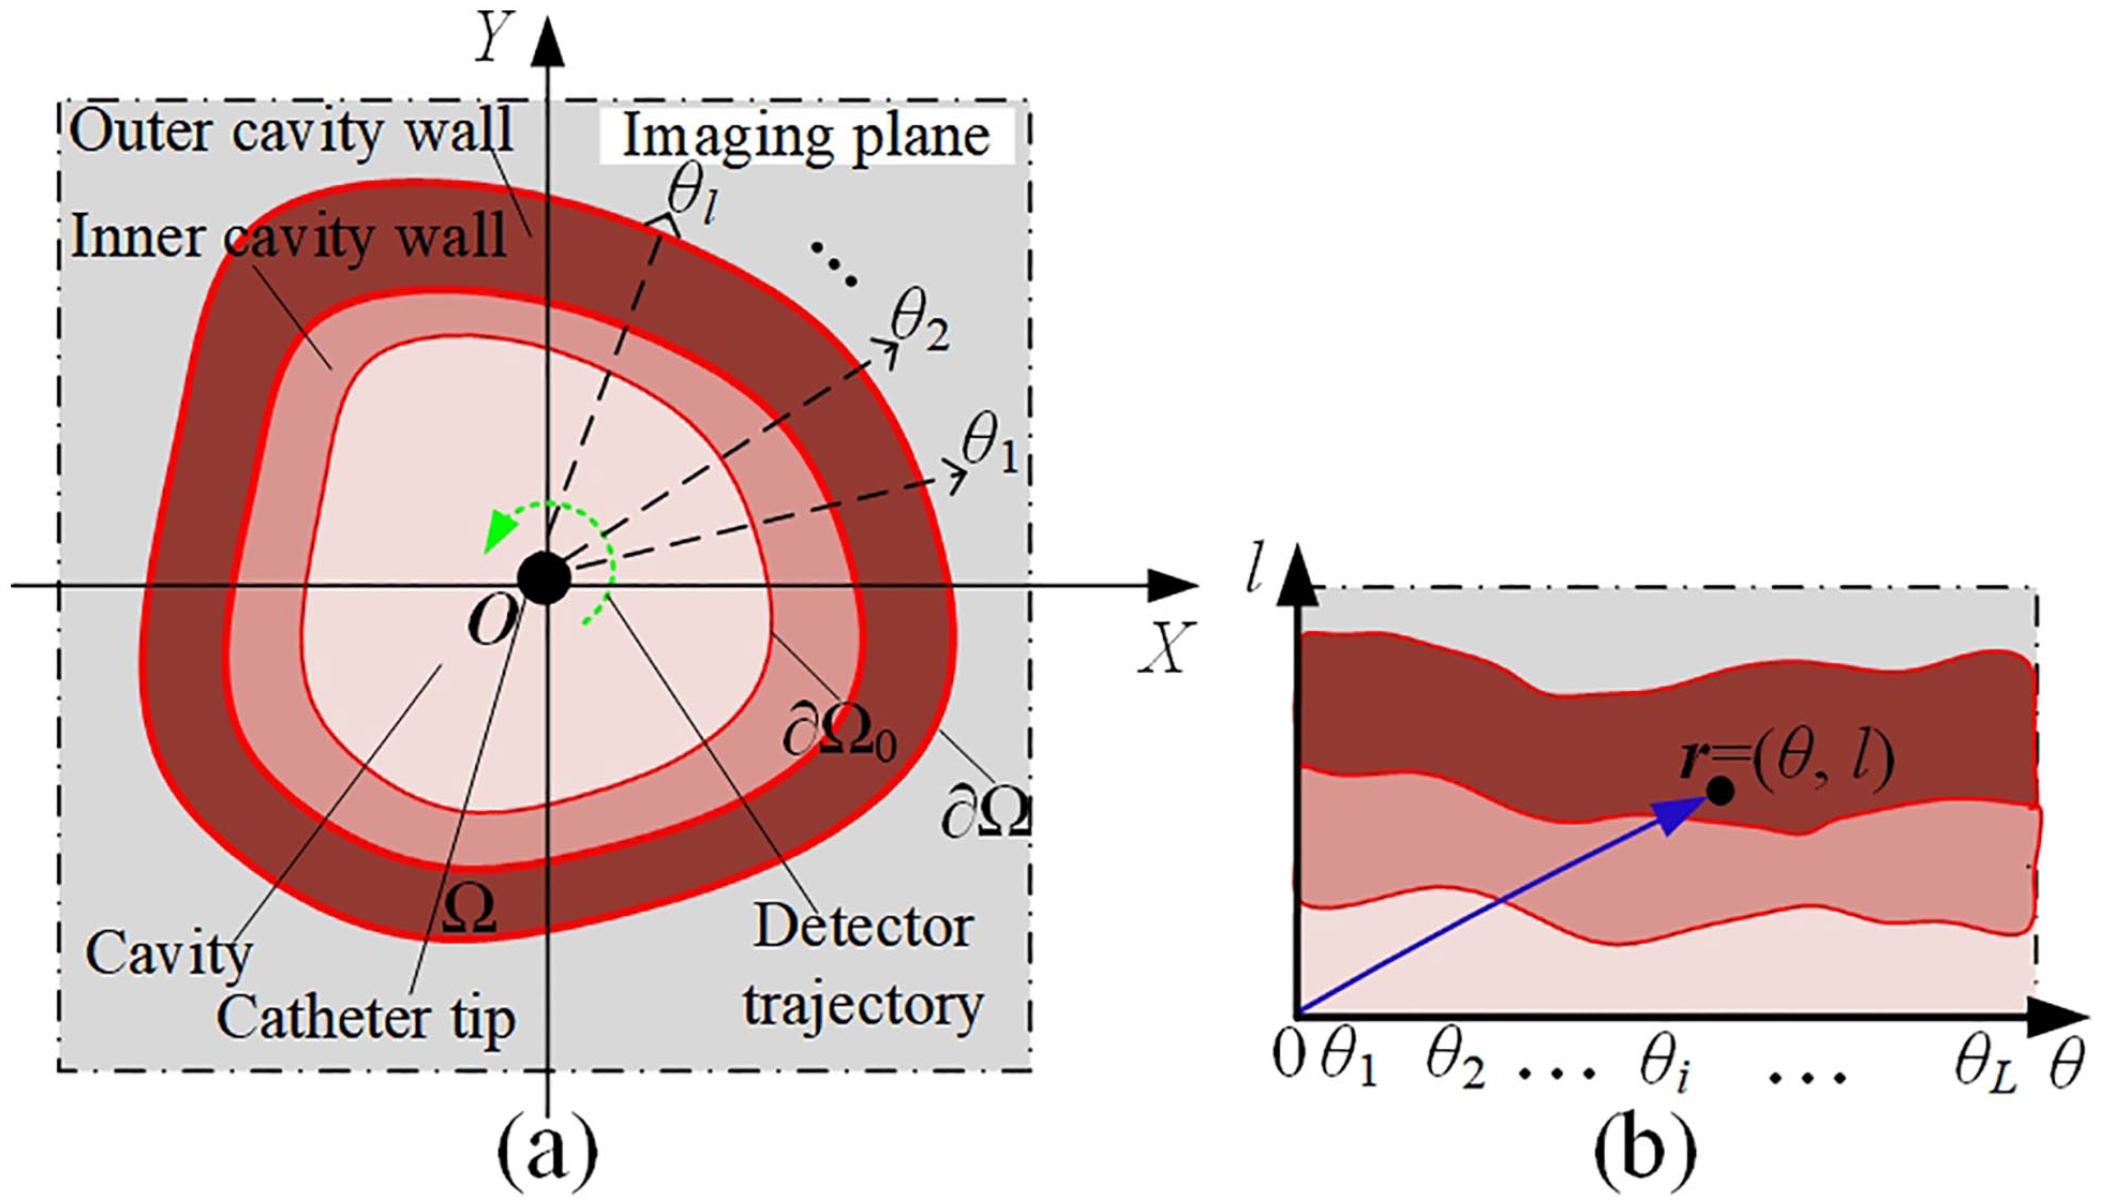
Planar co-ordinate systems of the imaging plane for EPAT. (a) Cartesian co-ordinate system and (b) polar co-ordinate system. (A color version of this figure is available in the online journal.)

where A(
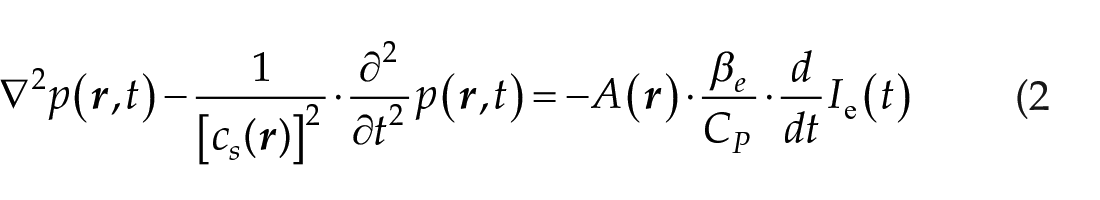
where p(
The photoacoustically induced ultrasonic waves, that is, PA waves, are collected by a finite-sized unfocused ultrasonic transducer in receiving mode along a circular trajectory in the imaging plane. The PA data set collected via a full-view (360°) scanning contains L A-scan lines. The radial angle of the lth A-line is

where
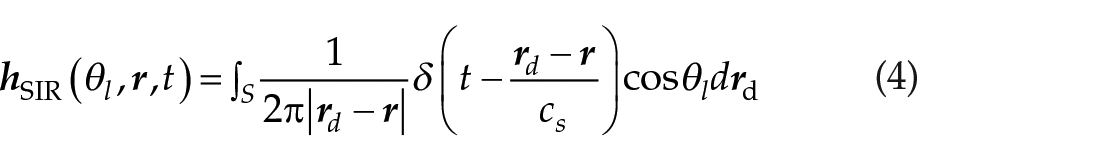
here,
Reconstruction of images representing AOED
The spatial distribution of the AOED on a cross-section of the imaged object is reconstructed from the sampling voltage signal output by the detector via inversion of the forward model. The non-linear least square (NLS) problem estimating the AOED at a position
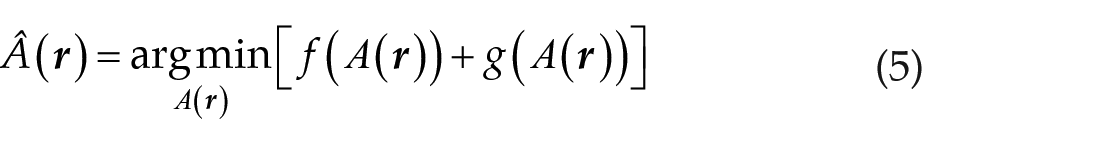
where
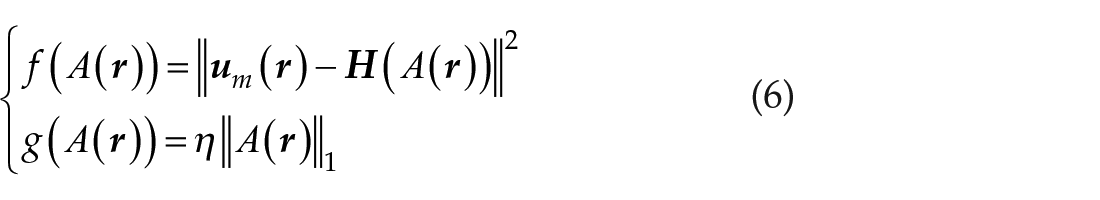
here,
The fast iterative shrinkage thresholding algorithm (FISTA) 54 is employed to solve the NLS problem iteratively. The AOED is taken as the unknown being updated at each iteration until the output of the forward model matches the sampling voltage output by the detector. The principle of the FISTA is as follows.
The quadratic approximation of f(A(
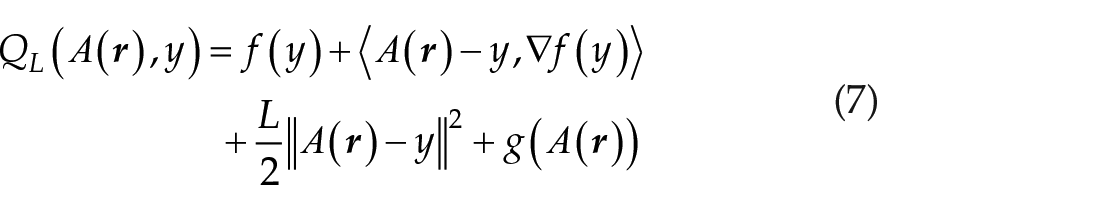
where L > 0 is the Lipschitz constant, ∇f is the gradient of f, and <·> denotes the inner product of two vectors defined by
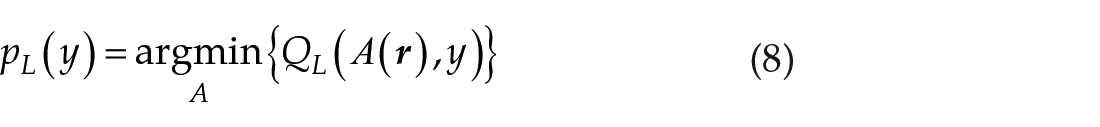
By neglecting the constant terms, equation (8) is rewritten as
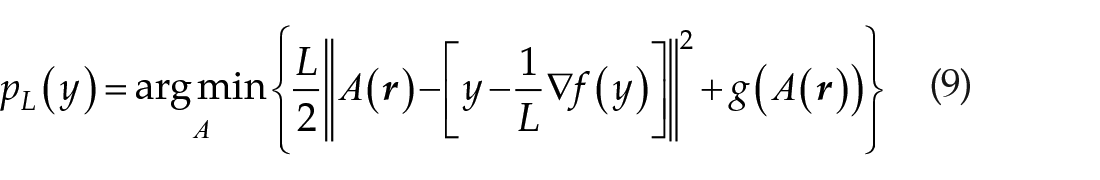
Then, the primary iterative step for solving equation (5) is

The detailed steps of iteration are as follows:
Step 1. Initialization
The iteration times k = 1; the step size t1 = 1; the initial guess of the AOED is denoted as A0(
Step 2. Determination of the Lipschitz constant
The Lipschitz constant is determined as follows
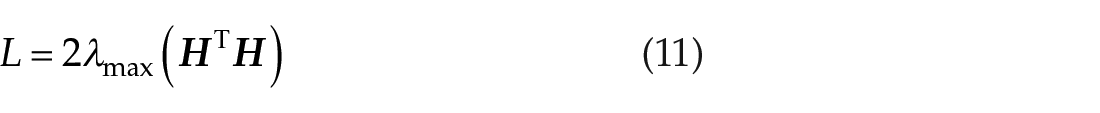
where λmax(·) represents the greatest eigenvalue of a matrix.
Step 3. Calculation of the AOED at the kth iteration
The AOED at position
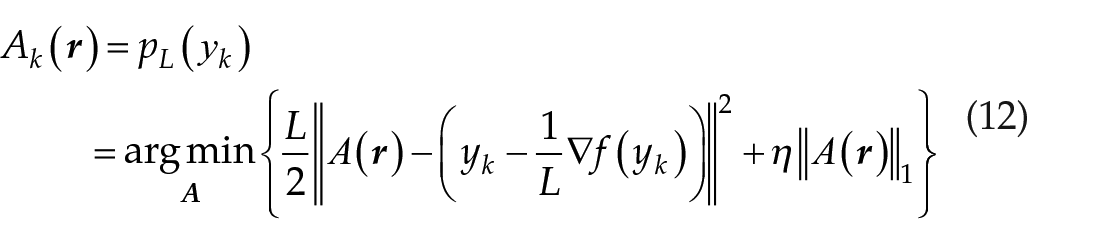
where
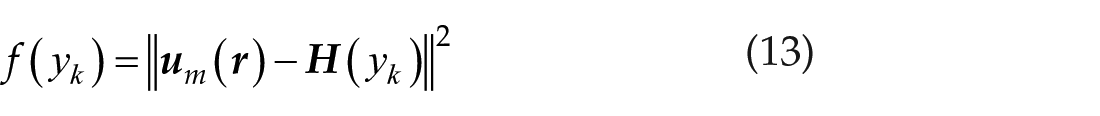
and
Step 4. Updating of yk
yk and tk are updated as
and
Step 5. Termination of the iteration
The termination of the iteration is determined by
where ε < 10−9 indicates the termination of the iteration, and accordingly, the estimates of AOED are the output; otherwise, proceed to Step 6.
Step 6. Let k ← k + 1 and return to Step 2
Experimental data and evaluation metrics
We used numerical phantoms to demonstrate the validity and evaluate the performance of the proposed method considering the lack of enough ground truth for human tubular structures. As shown in Figure 2, we generated the simple phantoms containing dot-grid and the complex phantoms mimicking coronary arterial vessels with plaque burdens. In the simple phantom, there are 25 dots with the radius of 0.03 mm evenly distributed along the angle of 0°, 45°, 90°, 135°, 180°, 225°, and 270° in the imaging plane. The complex vessel phantoms contain multilayered tissues with different compositions varying from healthy tissues to rupture-prone plaques. The size of the imaging plane is 3 mm × 3 mm. By referring to histological findings on human arterial vessels,55,56 we selected the optical and acoustic properties and geometrical parameters of different types of tissues, as shown in Table 2. The speed of sound and mass density of the vessel phantoms follow the Gaussian distributions based on the values provided in the table. We achieved the optical fluence simulation by discretely solving the DE with the finite difference time-domain algorithm. The forward acoustic process, including initial pressure signal generation and acoustic propagation, was simulated using the k-wave toolbox.
57
The sampling voltage signal output by the detector in response to the acoustic pressure reaching its receiving surface was generated based on equation (3). The noise vector was selected as an uncorrelated Gaussian white noise with zero mean and an SNR of 10 dB. The SD σ was determined by
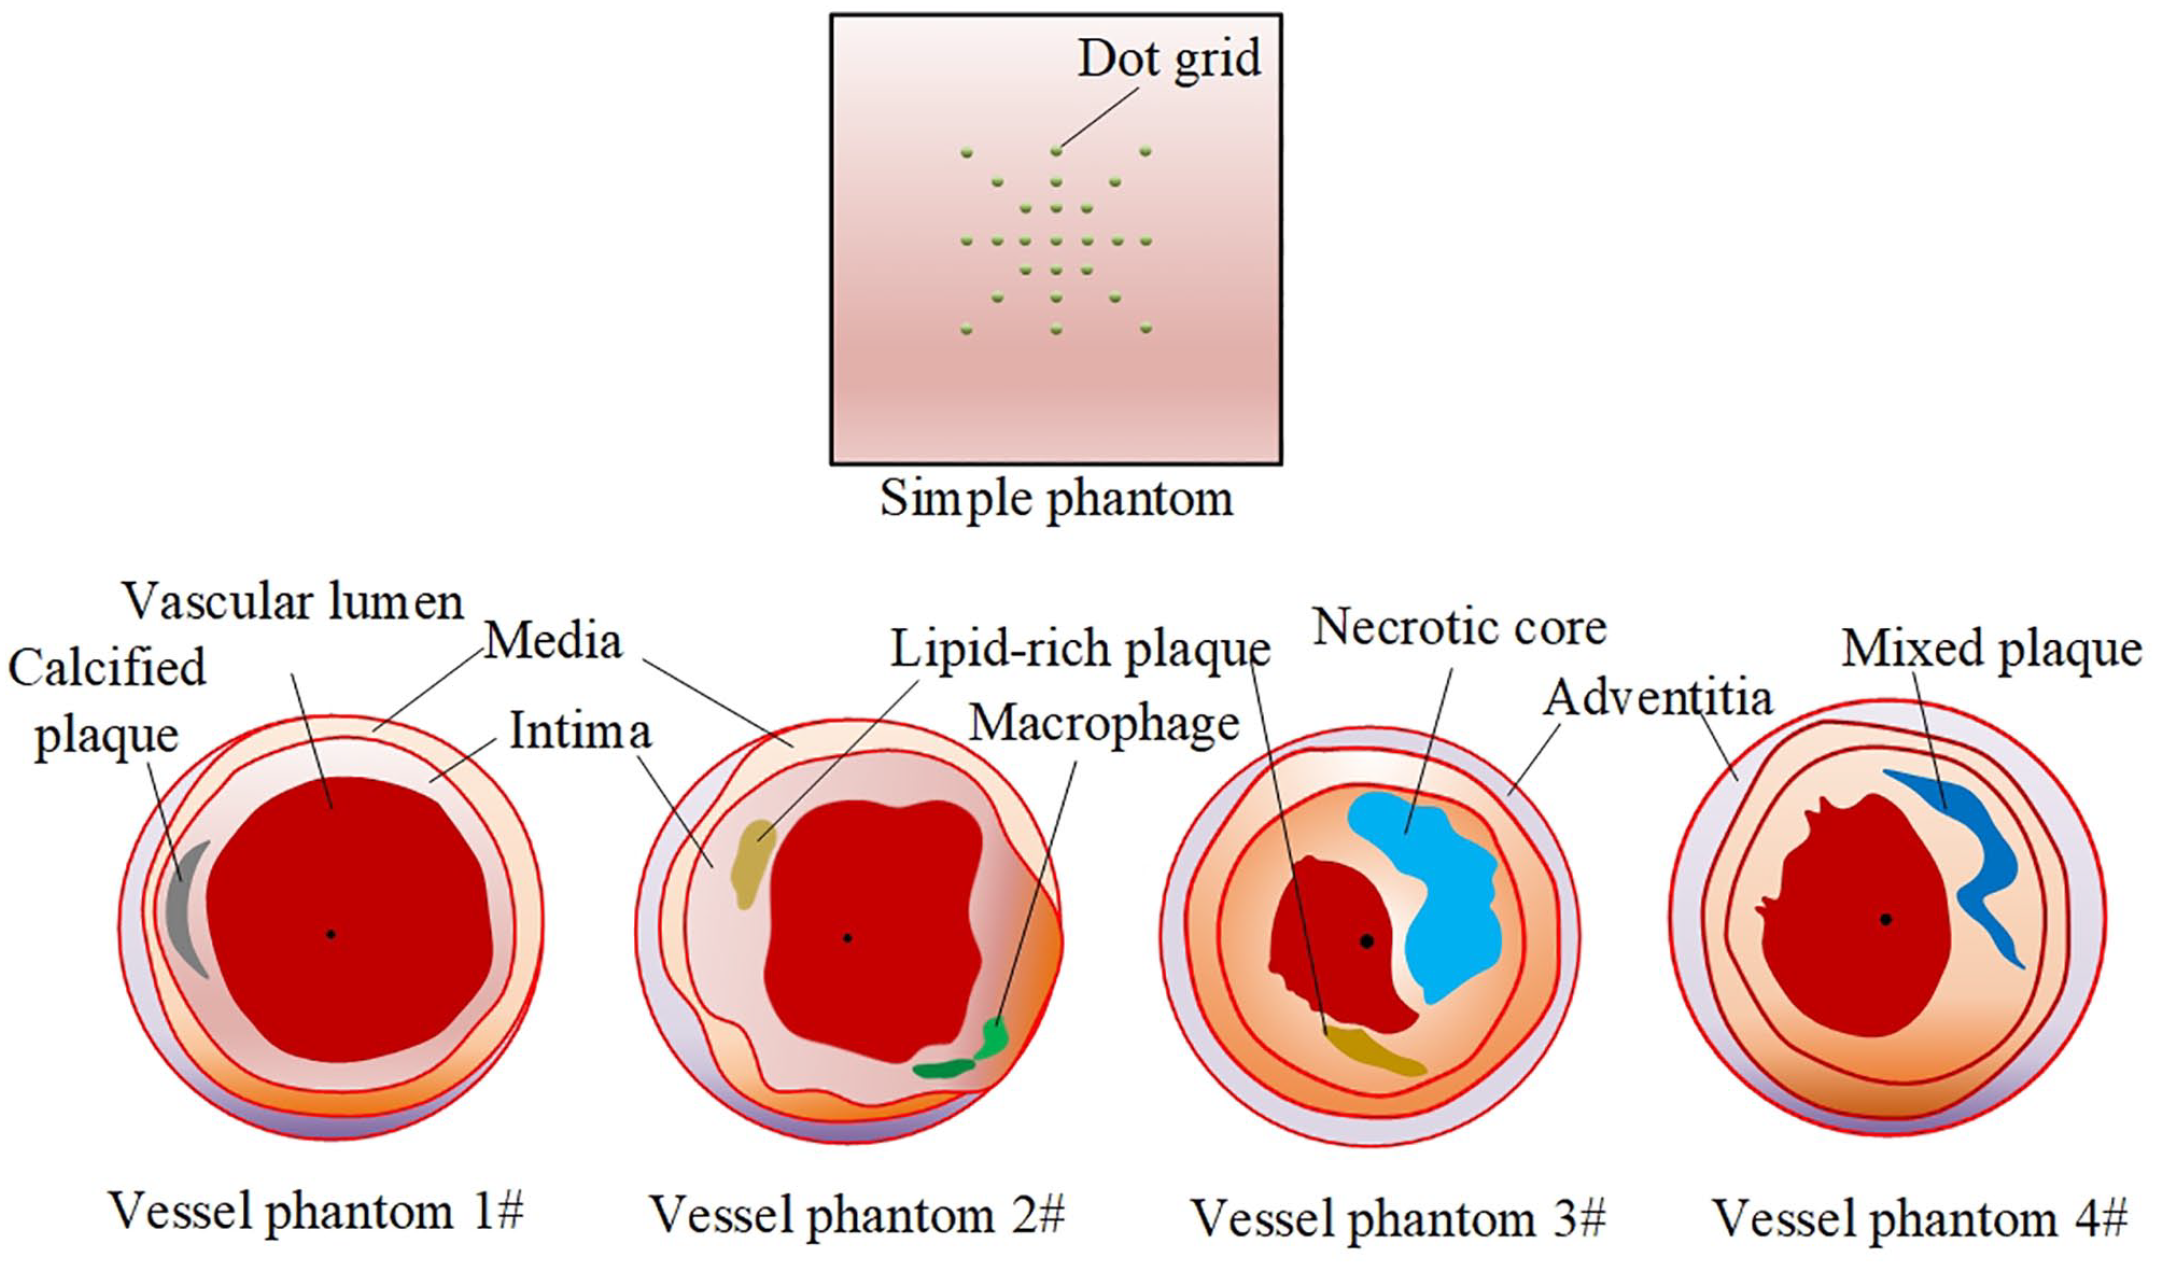
Geometry of simple dot-grid phantom and cross-sections of coronary vessel phantoms. (A color version of this figure is available in the online journal.)
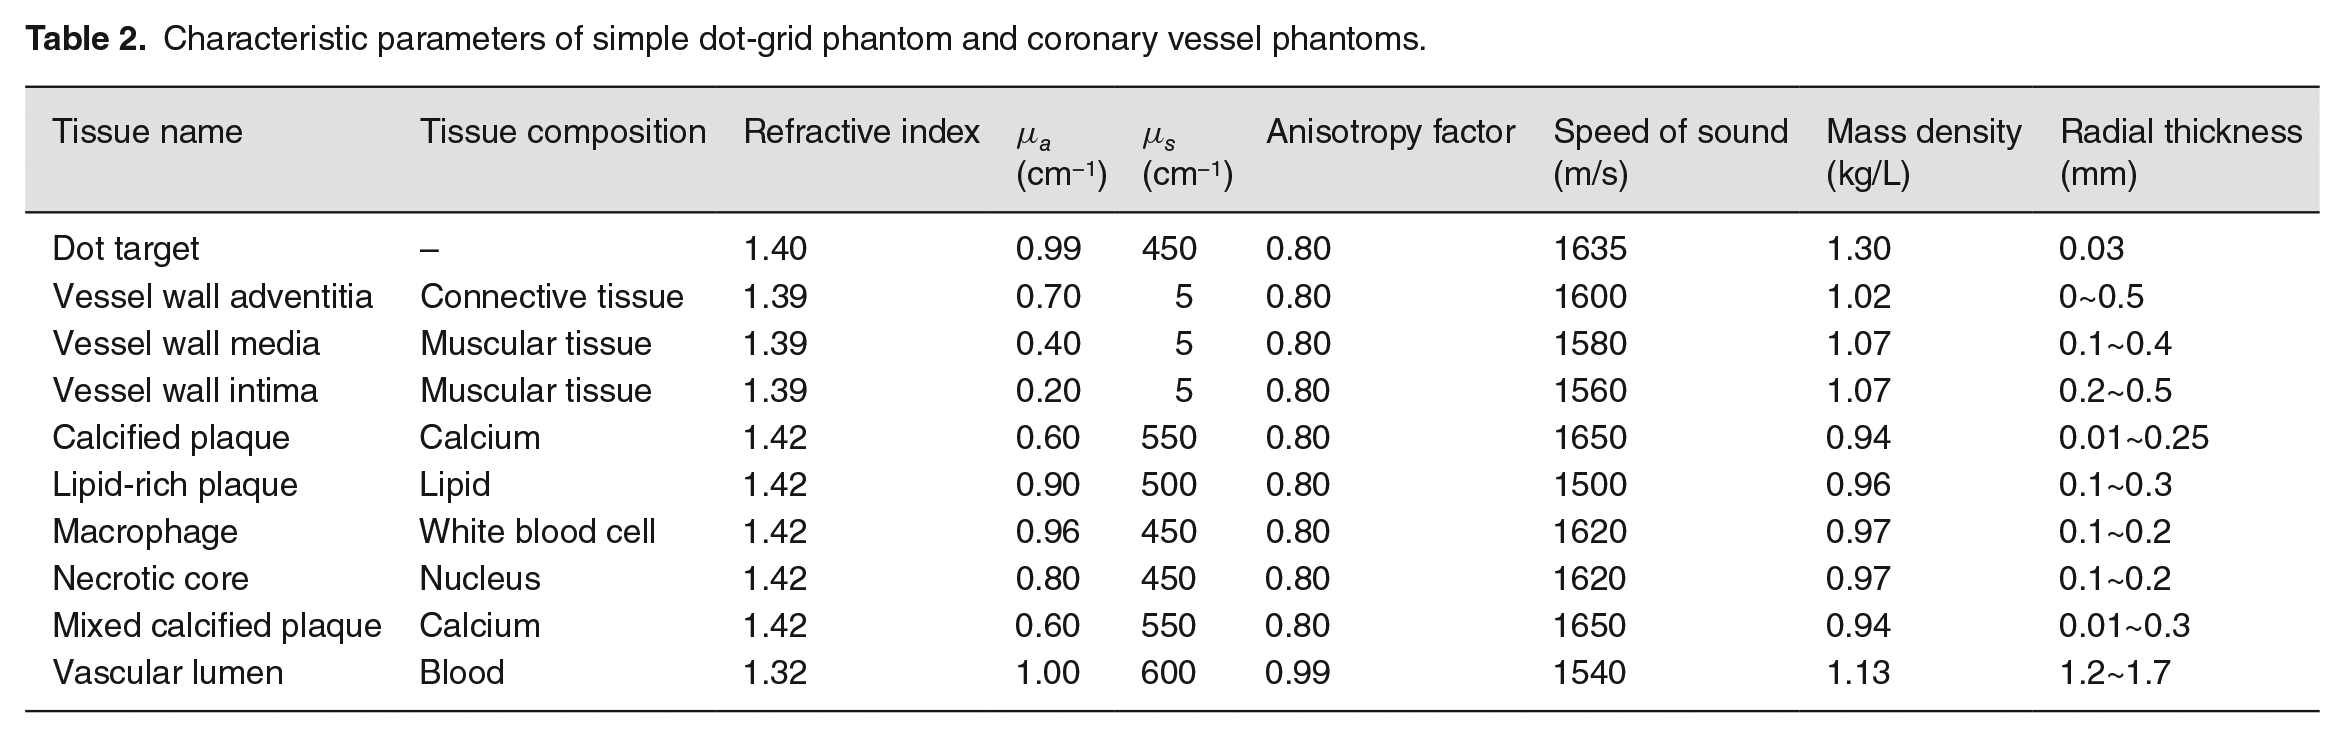
Characteristic parameters of simple dot-grid phantom and coronary vessel phantoms.
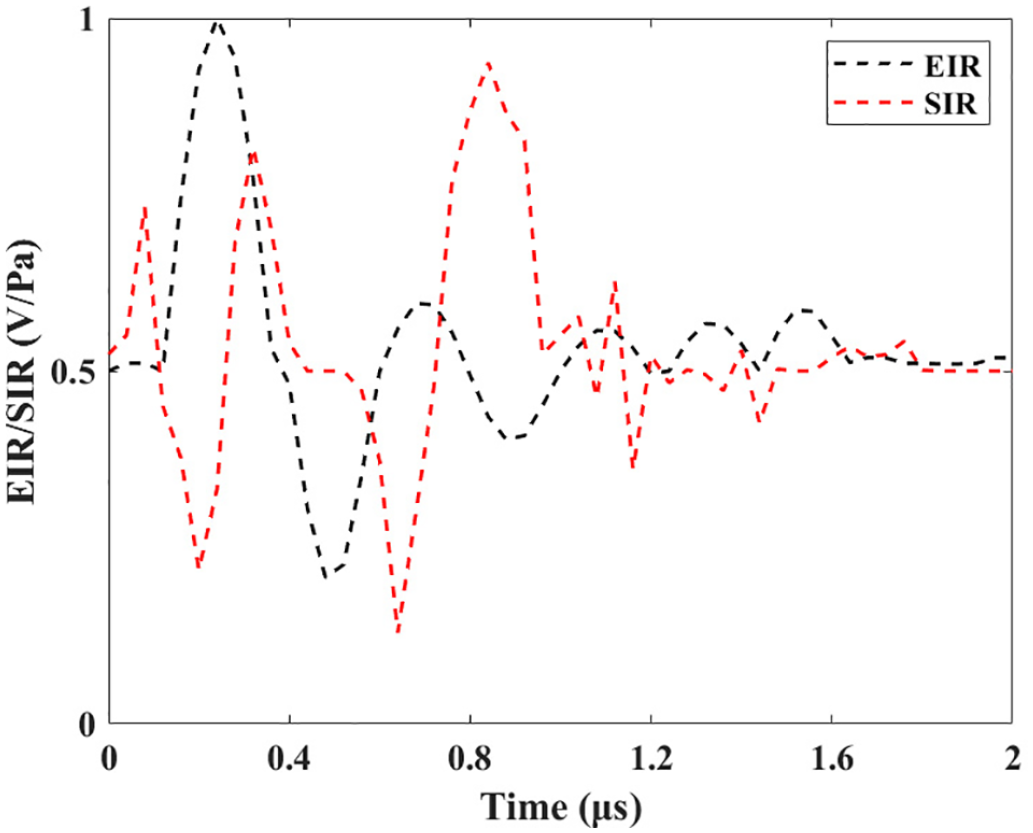
Profiles of EIR and SIR of the detector concerning time. (A color version of this figure is available in the online journal.)
In addition to visual inspection, we also quantitatively evaluated the quality of reconstructed images using standard metrics, including peak signal-to-noise ratio (PSNR), structural similarity index measure (SSIM), and normalized mean square absolute distance (NMSAD). 59 PSNR evaluates the image quality based on error sensitivity. NMSAD and SSIM measure the similarity between the reconstructed and ground truth images. High PSNR, high SSIM, or low NMSAD suggests reconstructions with high quality. In this work, the result images obtained by simulation were regarded as the ground truth images.
The conventional BP 53 and Wang’s iterative reconstruction method 12 were employed to make a comparison with the method proposed in this work. Wang’s method was developed for reconstructing three-dimensional PAT images based on an imaging model incorporating detector properties. As it utilized the conjugate gradient (CG) algorithm as the optimization framework, we call the CG method below for brevity. The programming environment of our experiments is MATLAB (R2018a, The MathWorks, Inc., Natick, MA, USA) on a personal computer configured with a 2.11 GHz Intel® Core™ i5-10210U CPU, 8 GB RAM, and Windows 10 64 bits as the operating system.
Results
Results of image reconstruction
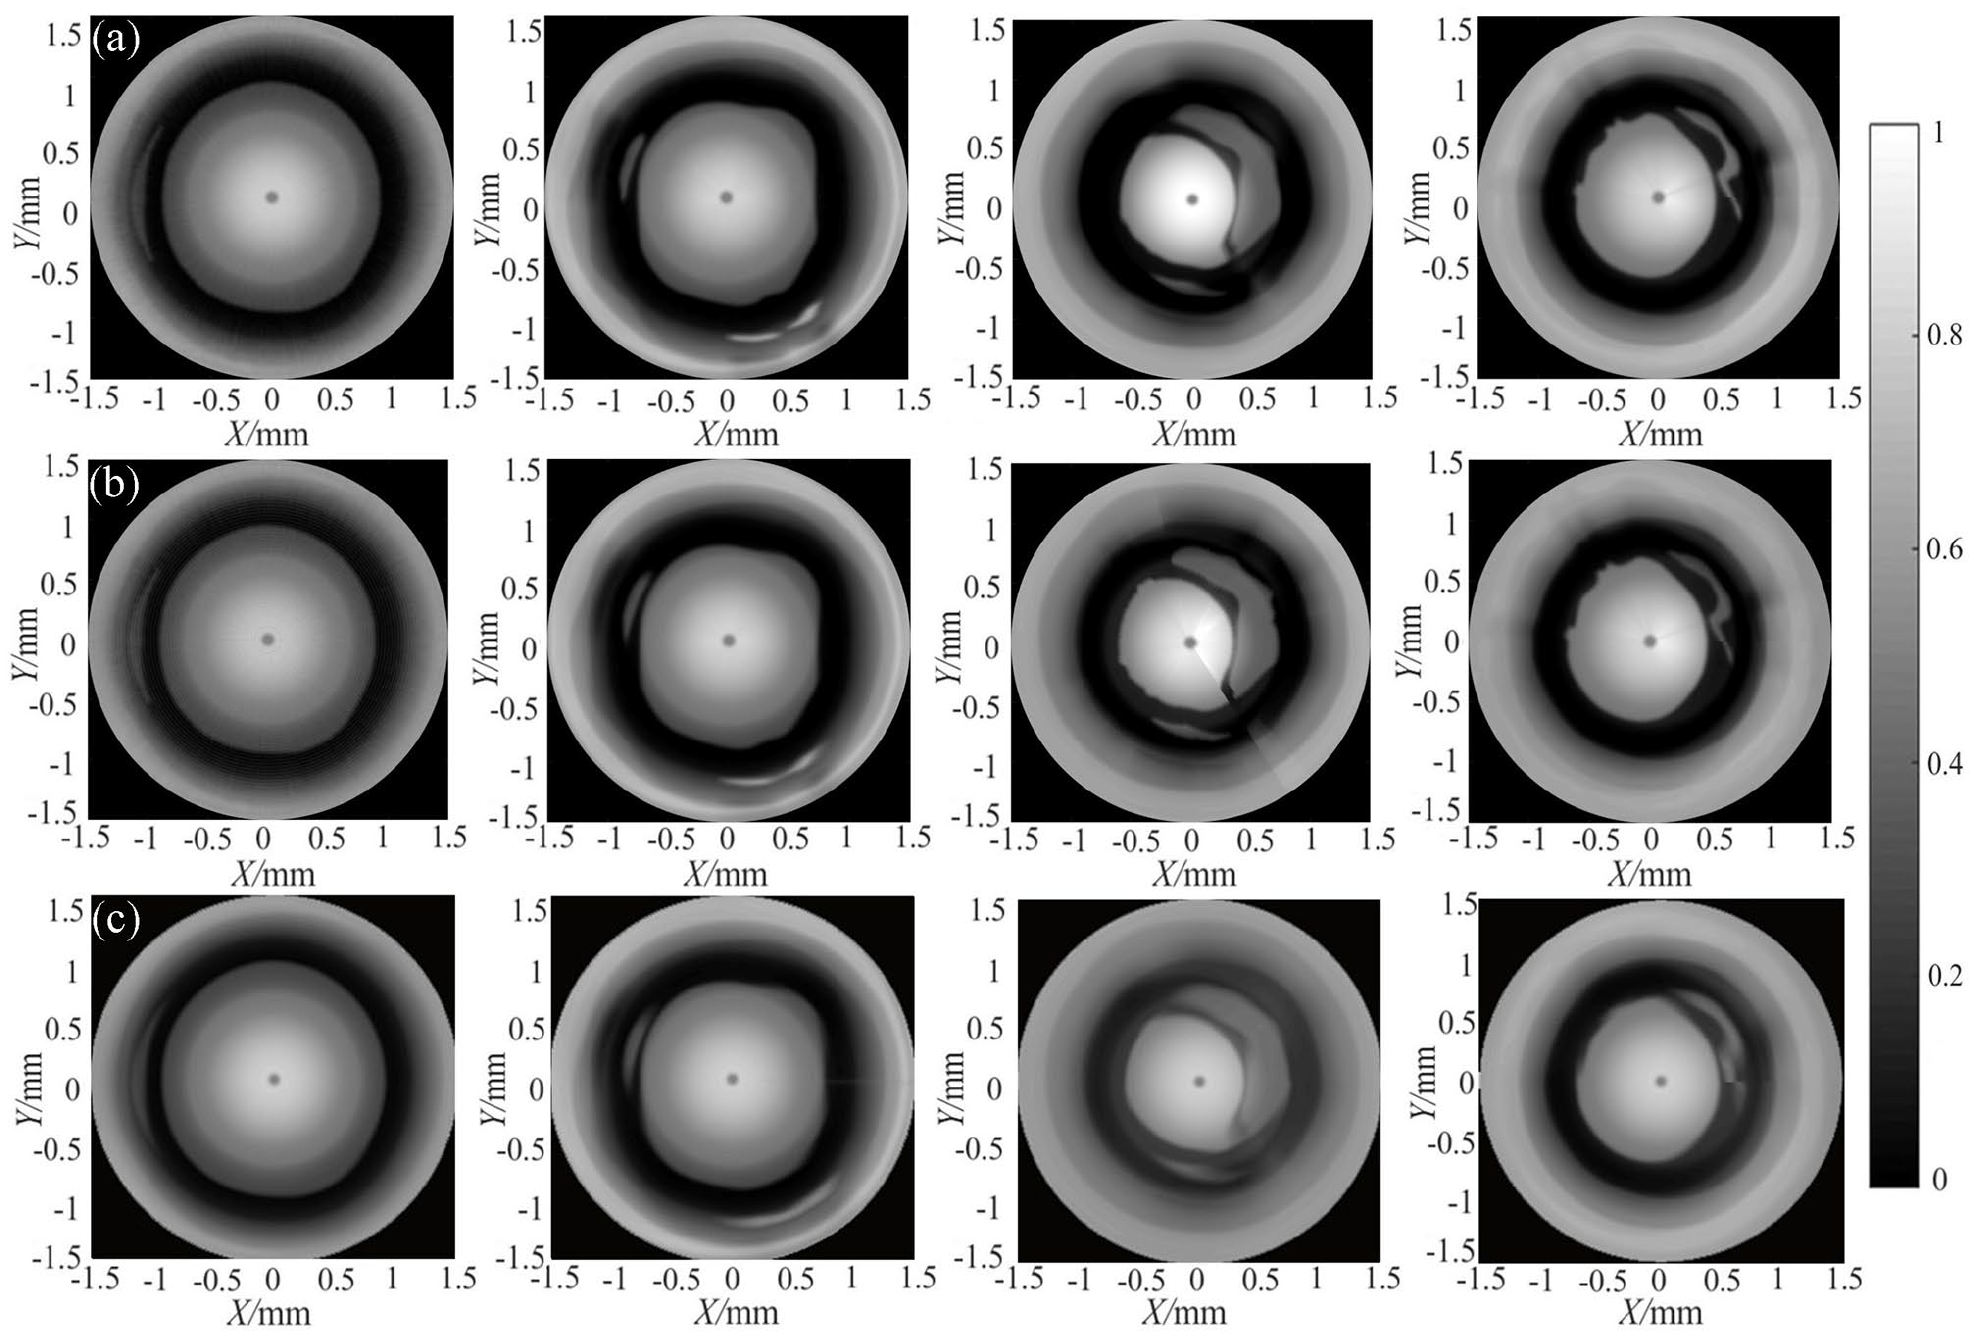
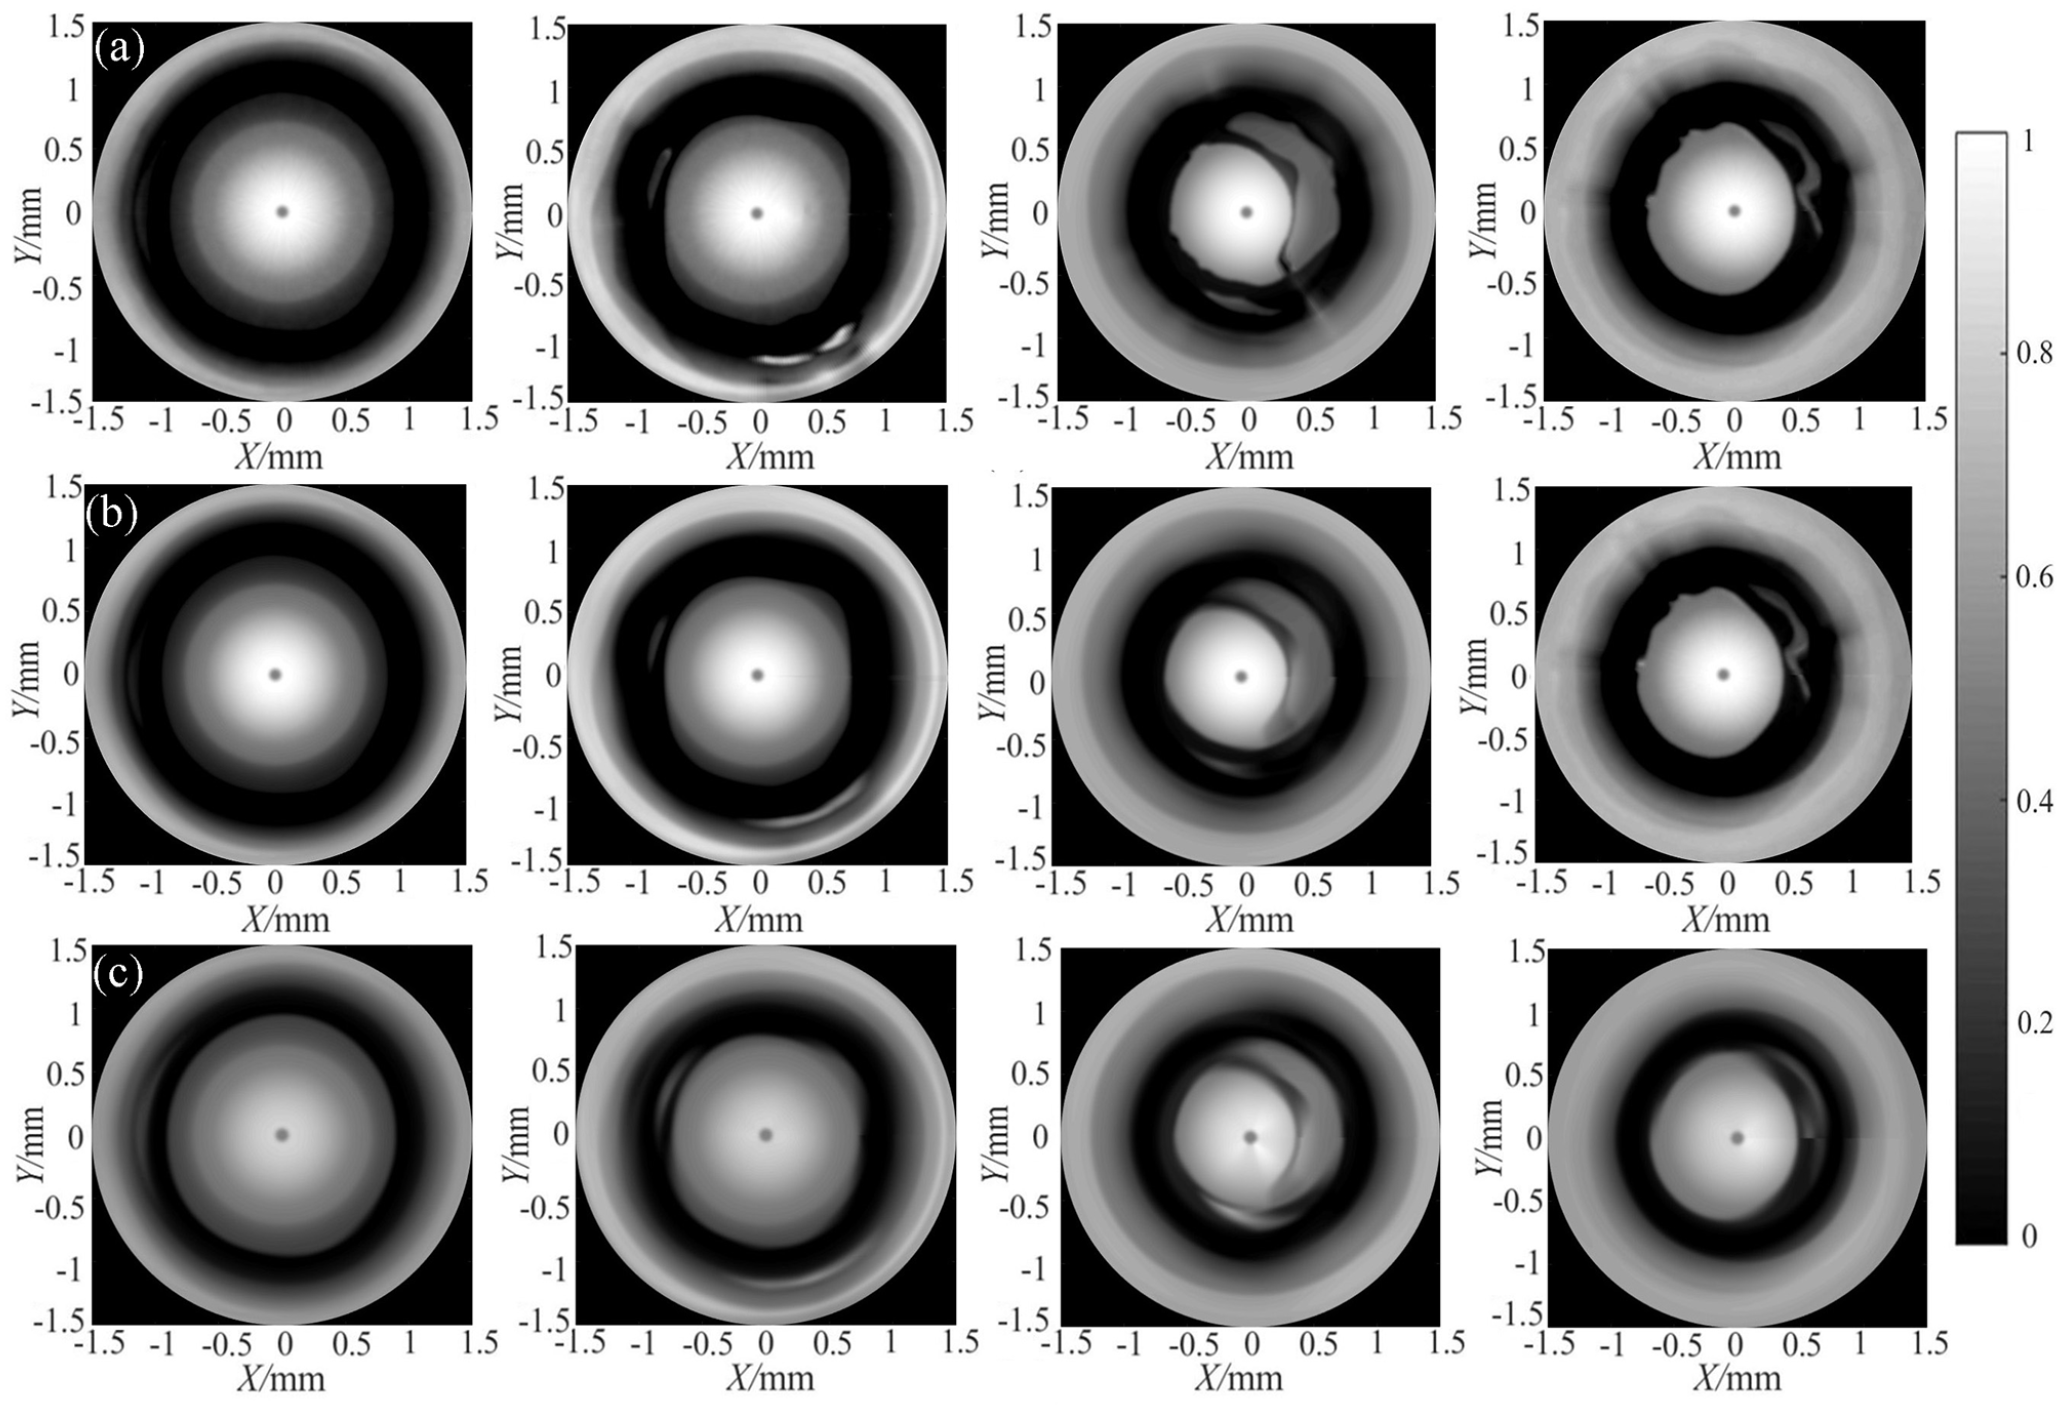
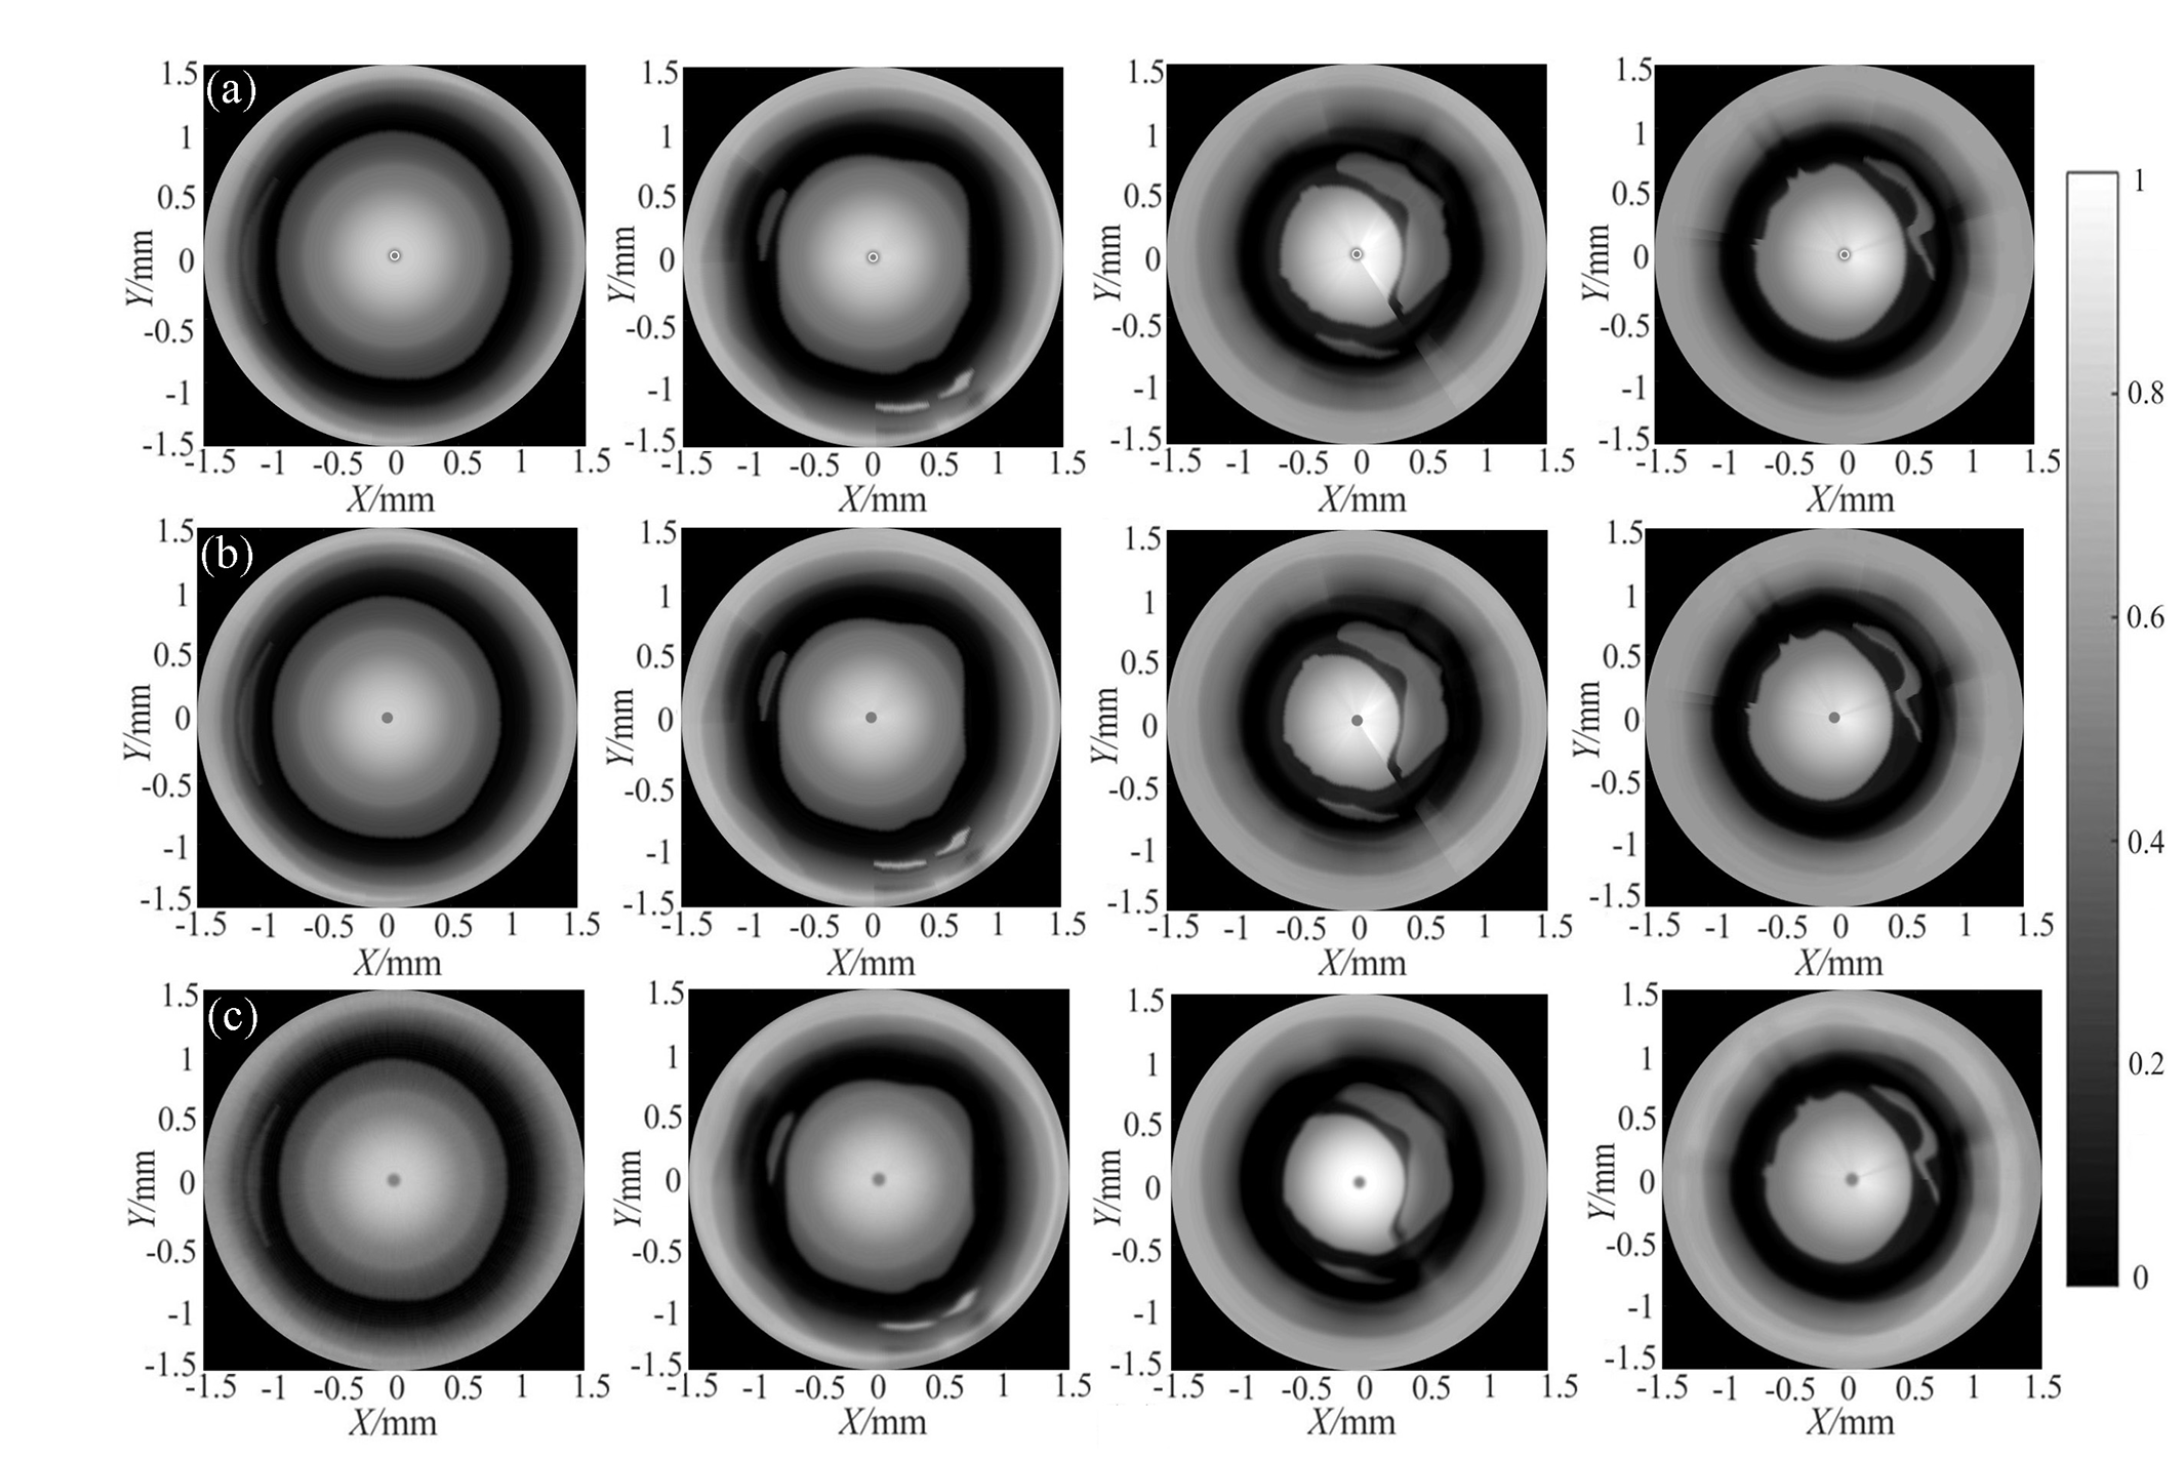
Figures 4(a) and 5(a) show the ground truth images of the simple phantom and vessel phantoms obtained by numerical simulation. The images represent the maps of the spatially varying AOED. Figures 4(b) to (d) and 5(b) to (d) highlight the images reconstructed with the conventional BP, CG method, and our method, respectively. In the traditional BP reconstructions, a point-like ultrasonic transducer was assumed. In our approach, the initial AOED in the iteration was set to 0.9. From the figures, we can find that our approach improved the spatial resolution of the images as compared to the BP reconstructions. The images reconstructed by iterative inversion of the forward imaging model incorporating the detector responses can display the inner structures of different tissue types such as atherosclerotic plaques with various components embedded into the vessel wall. In contrast, these structures are significantly blurred in the images recovered by the traditional BP. Moreover, our approach outperforms the CG method in recovering the AOED distribution. The images obtained by our method are more similar to the forward simulations, represented by the PSNR, SSIM, and NMSAD results in Figure 6. The convergence of CG minimization highly depends upon both appropriate values of the initial guess and the termination conditions of the iteration. An unreasonable initial guess will lead to an unsatisfactory convergence. The termination condition directly determines the iteration times. Too many or too few iterations will lead to low accuracy of the solution, thereby affecting the quality of the reconstructed images. Therefore, it is essential to select the appropriate iteration termination conditions.
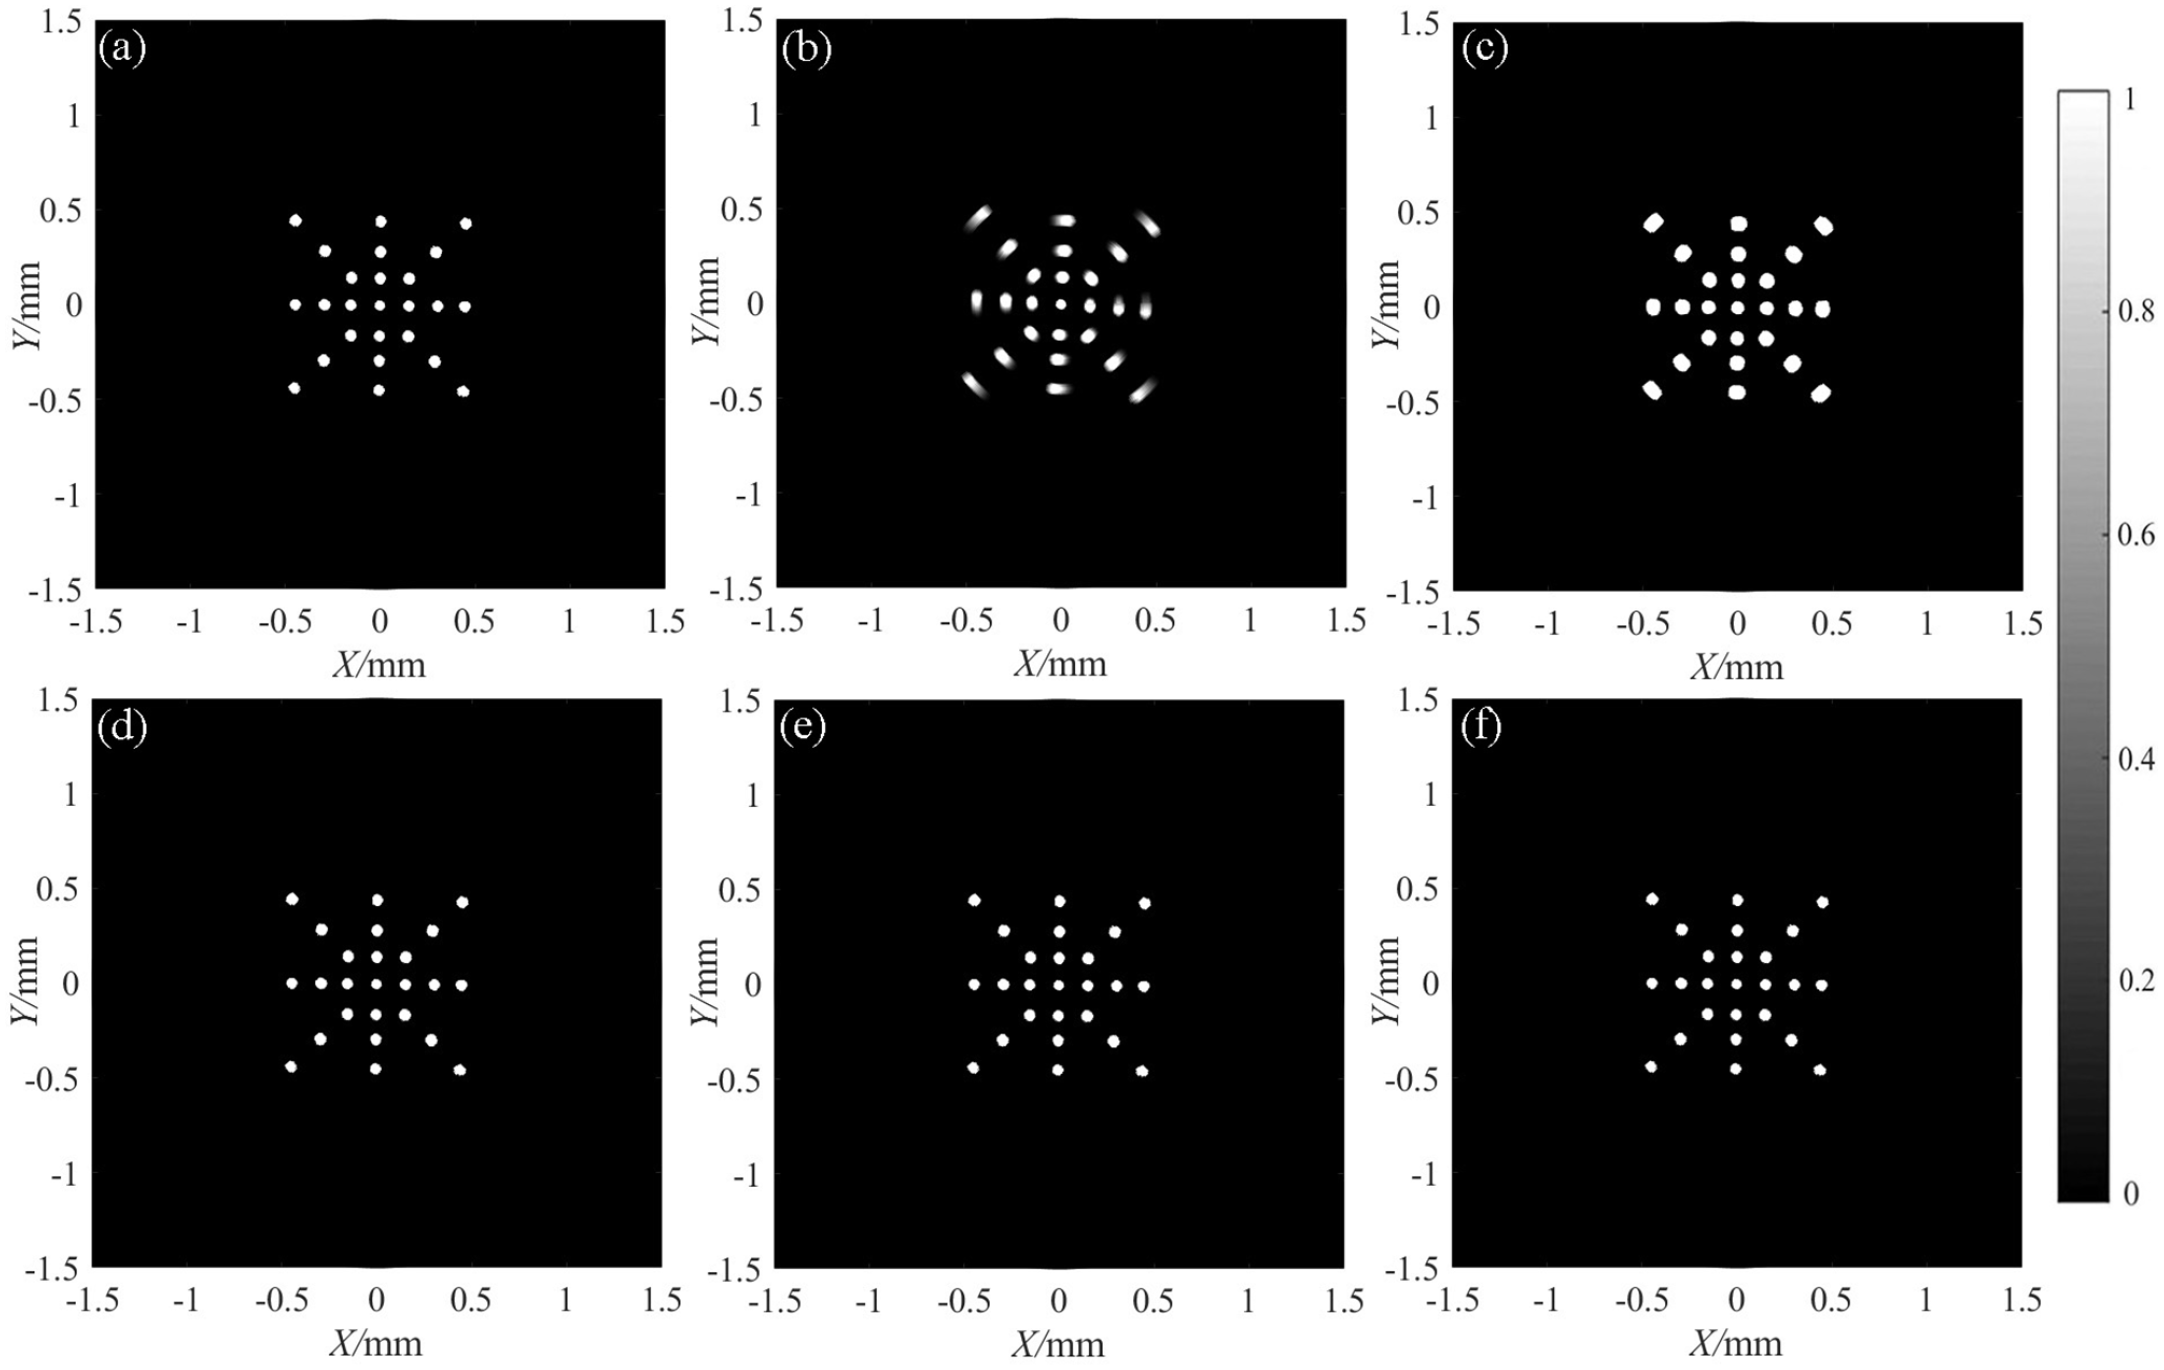
Image results of the simple phantom. (a) Ground truth image, (b) BP reconstruction, (c) CG reconstruction, (d) reconstruction with our method (FISTA + L1), (e) reconstruction with FISTA + TV, and (f) reconstruction with FISTA + Tikhonov.
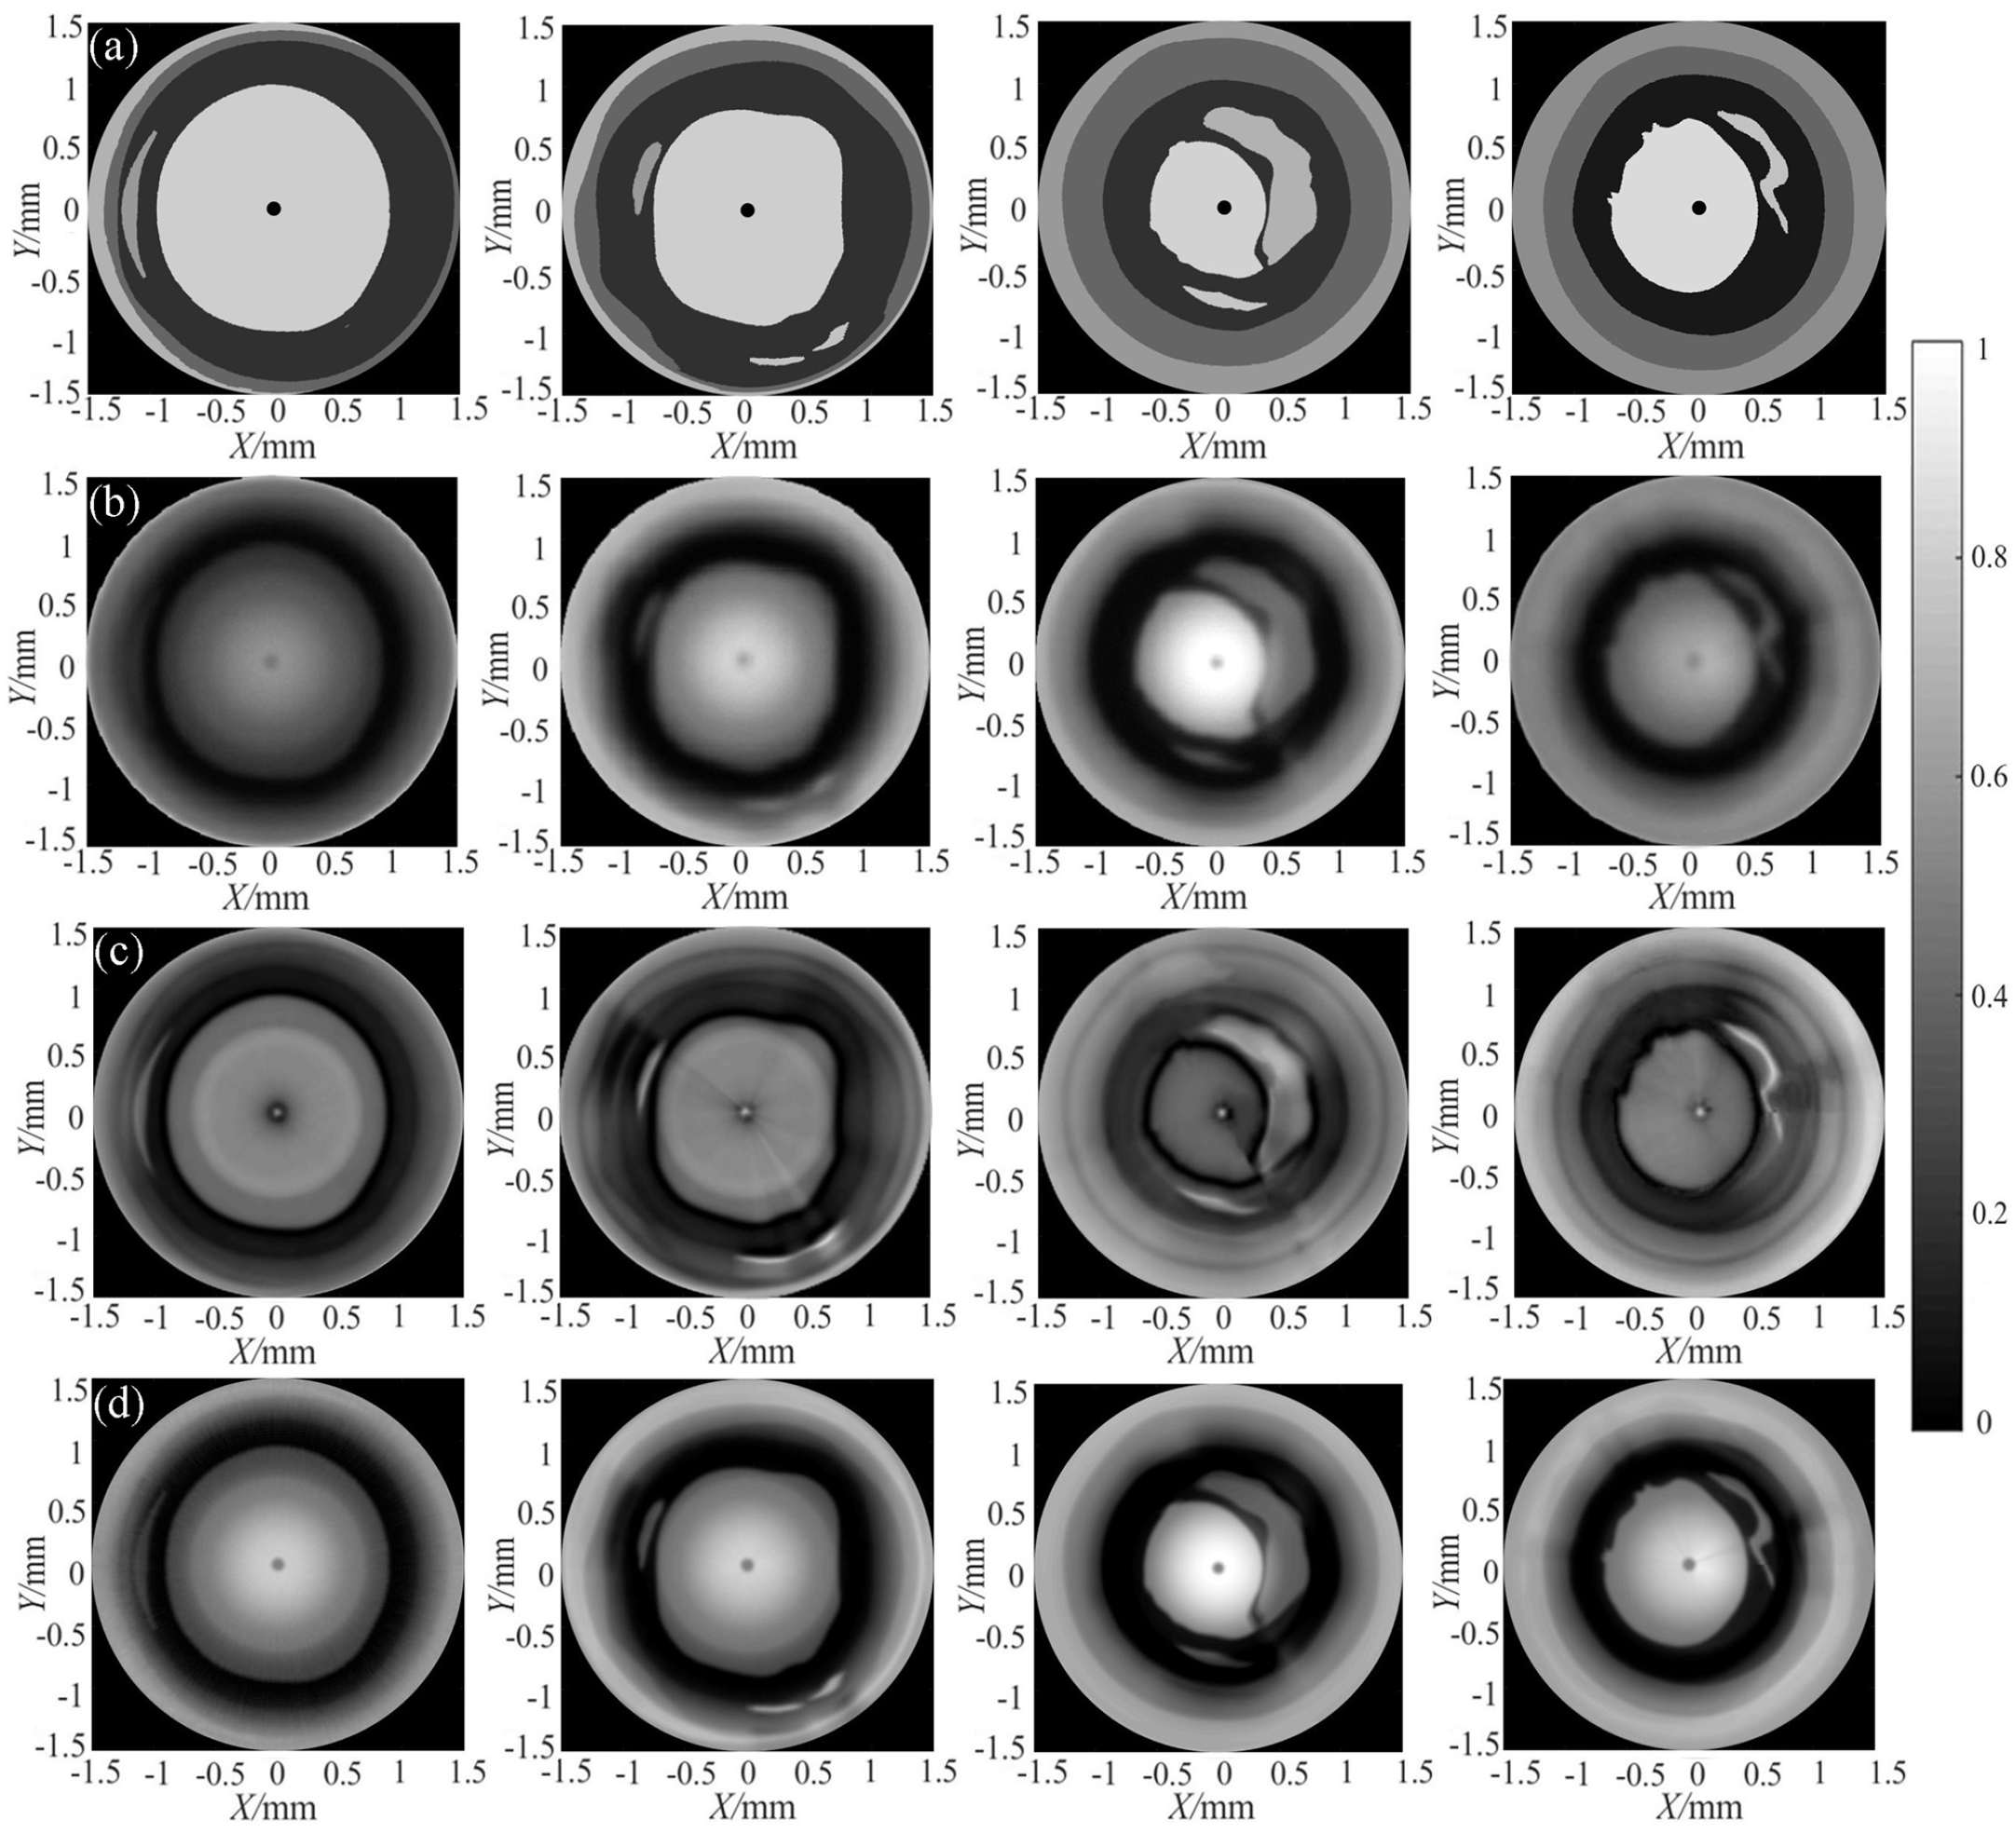
Image results of the vessel phantoms. (a) Ground truth images and (b) to (d) images reconstructed with BP, CG, and our method, respectively.
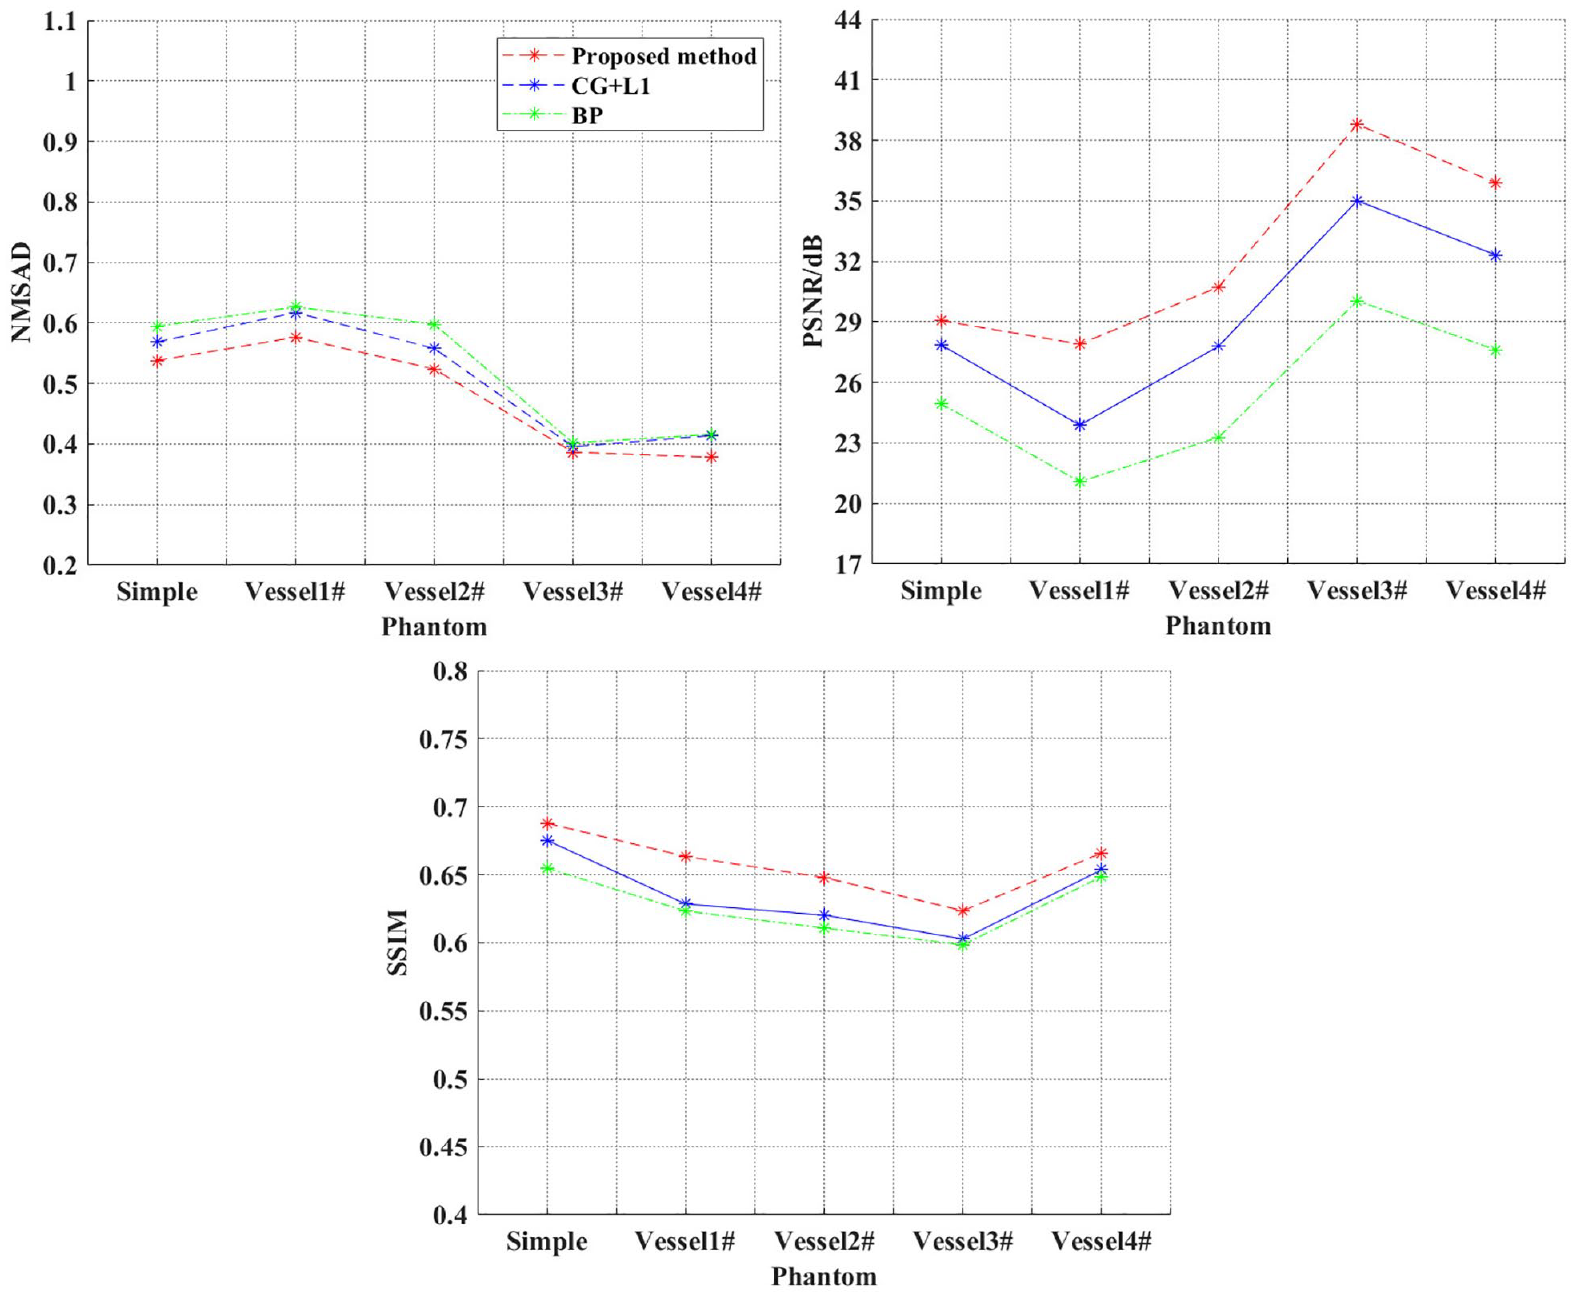
Evaluation metrics of the images reconstructed with BP, CG, and our method, respectively. (A color version of this figure is available in the online journal.)
Influence of the optimization framework
The model-based reconstruction scheme must use appropriate optimization algorithms and regularization tools to solve the NLS problem effectively. We designed three experiments to discuss the influence of various optimization algorithms combined with different regularization tools on the reconstructions by our method.
First, we compared the reconstructions using FISTA combined with L1, total variation (TV), and the Tikhonov regularization. Figures 4(d) to (f) and 7 show the results that exhibit no significant difference between the visualization of the reconstructed images. The evaluation metrics provided in Figure 8 indicate better quality of the reconstructions by FISTA + L1 than FISTA + TV and FISTA + Tikhonov.
Images of the vessel phantoms reconstructed with FISTA optimization. (a) FISTA + L1, (b) FISTA + TV, and (c) FISTA + Tikhonov.
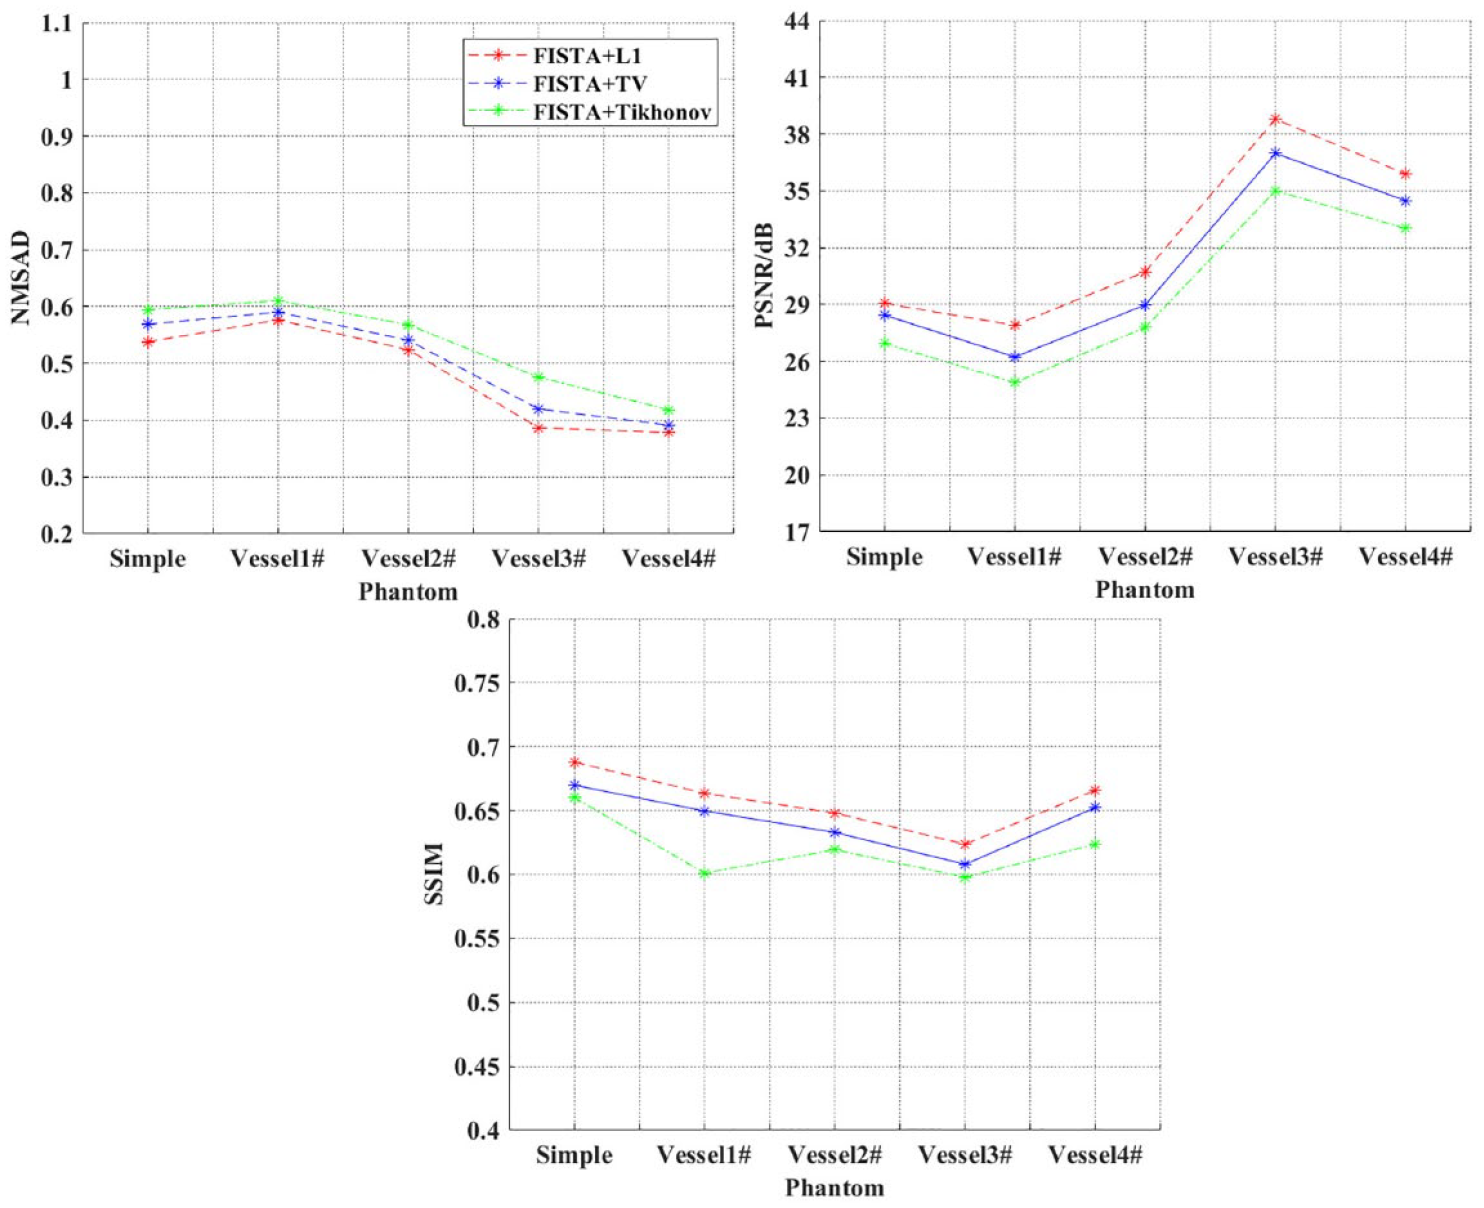
Evaluation metrics of the images shown in Figures 4(d) to (f) and 7. (A color version of this figure is available in the online journal.)
Second, we compared the performances of four optimization algorithms, Broyden–Fletcher–Goldfarb–Shanno (BFGS) quasi-Newton, CG, 12 Levenberg–Marquardt (L-M), 60 and FISTA, each combined with L1 regularization in solving the NLS problem depicting the model-based image reconstruction. The results in Figures 9 to 11 indicate that FISTA + L1 and BFGS + L1 outperform CG + L1 and L-M + L1.
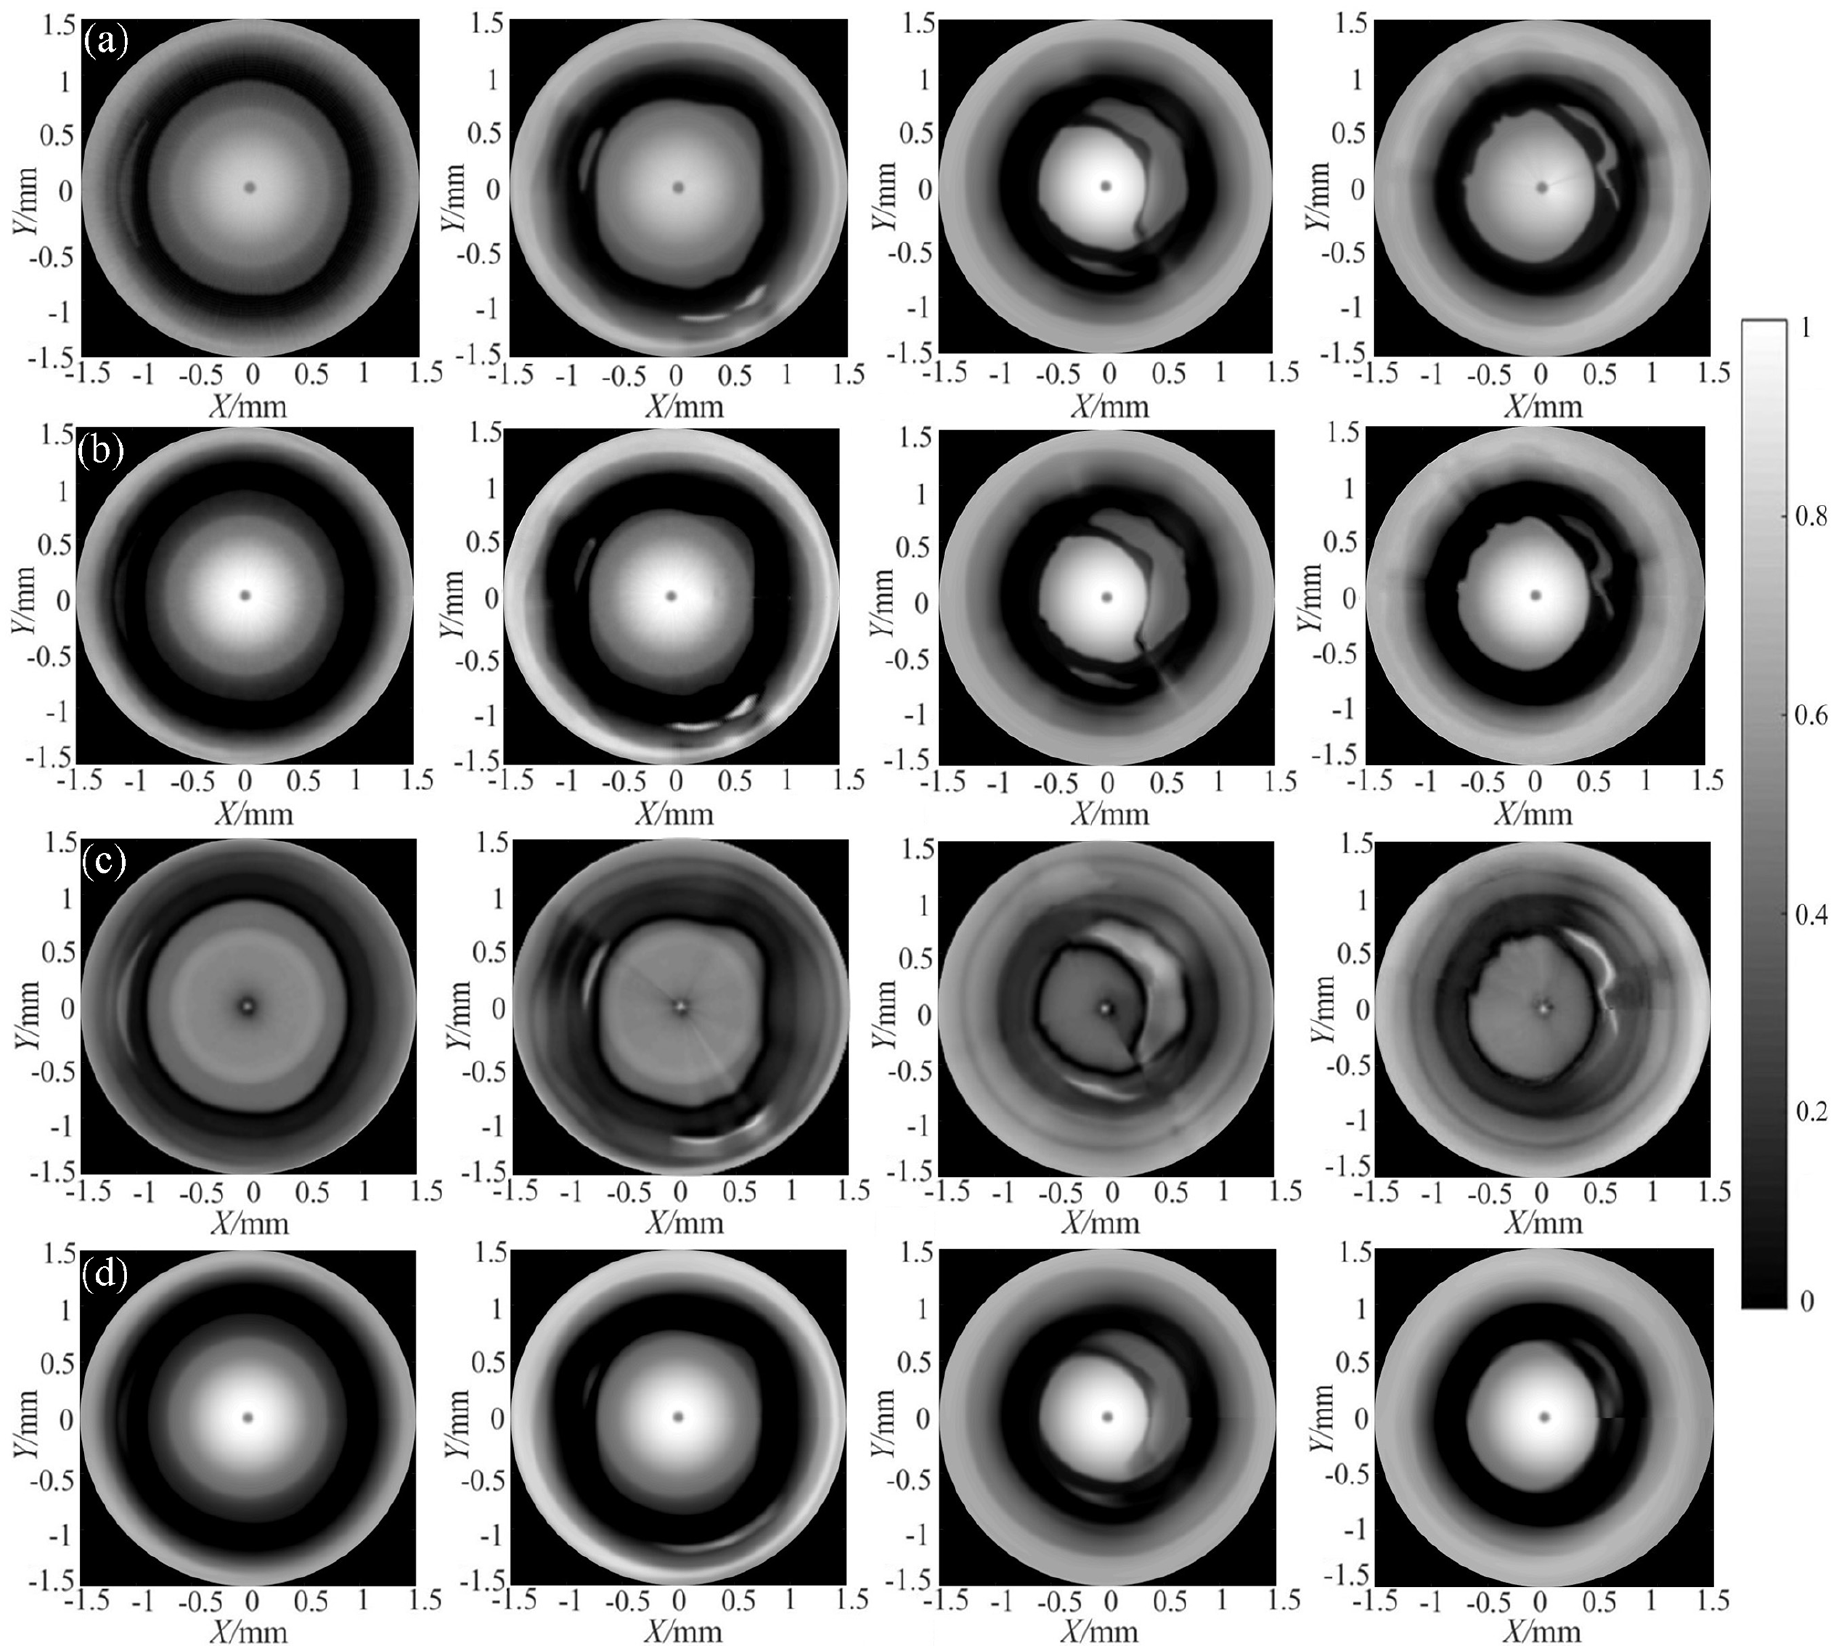
Images of the vessel phantoms reconstructed with different optimization schemes. (a) FISTA + L1, (b) BFGS + L1, (c) CG + L1, and (d) LM + L1.
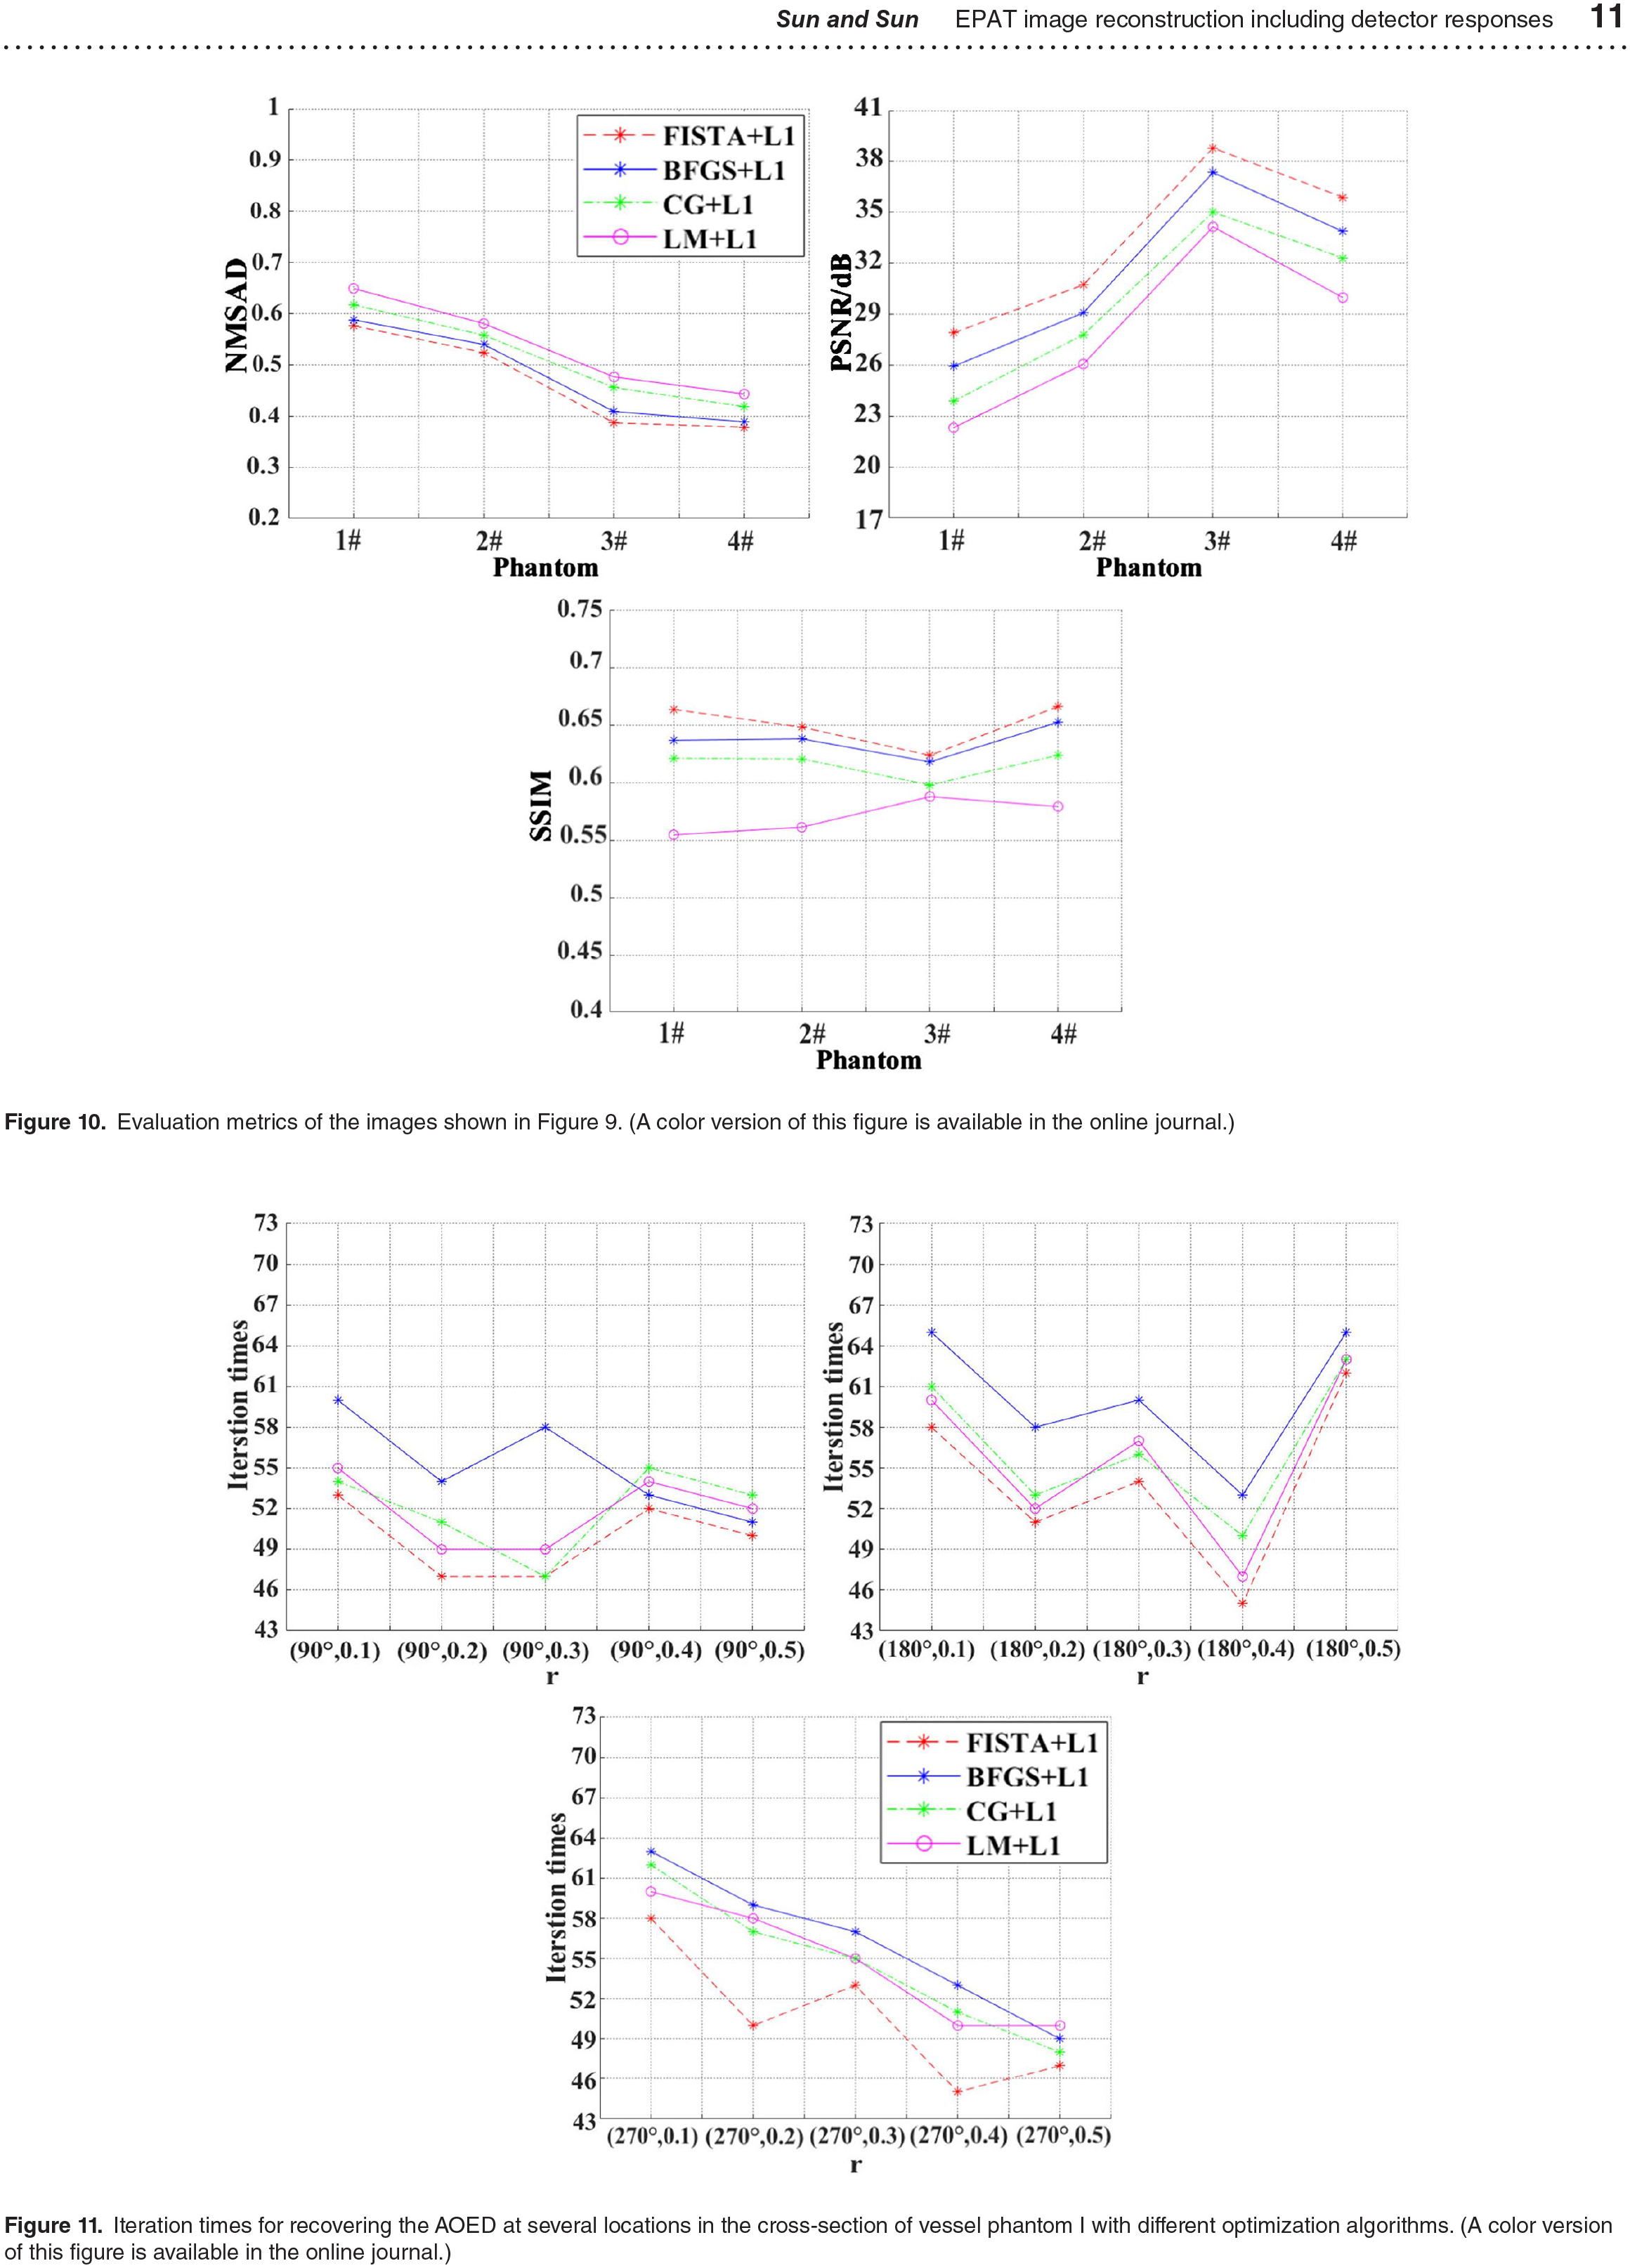
Evaluation metrics of the images shown in Figure 9. (A color version of this figure is available in the online journal.)
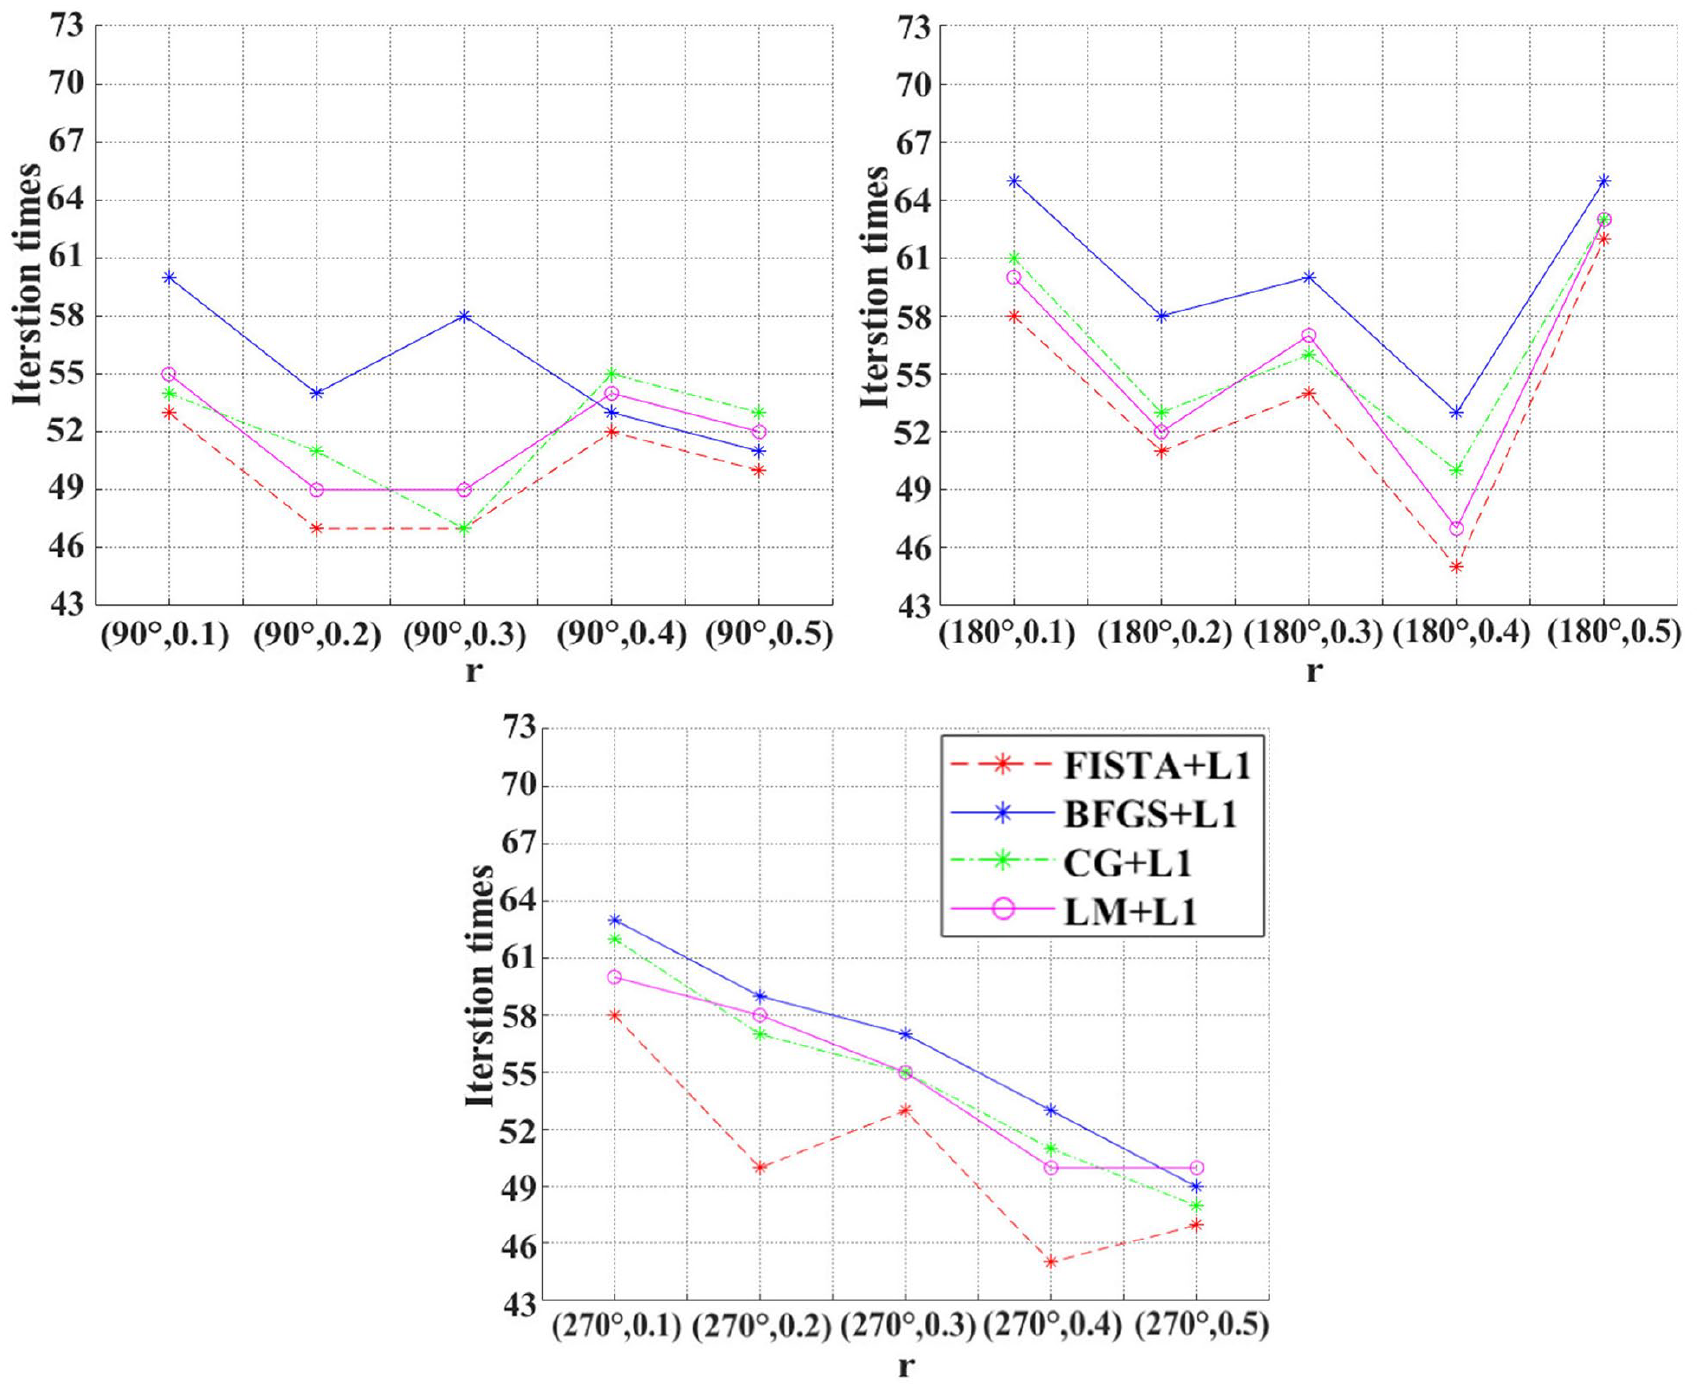
Iteration times for recovering the AOED at several locations in the cross-section of vessel phantom I with different optimization algorithms. (A color version of this figure is available in the online journal.)
The L-M algorithm combines the steepest descent with the Gauss–Newton method to find the optimal value quickly. By updating the damping parameter, its parameter update is varied between the steepest descent update and the Gauss–Newton update. A small damping parameter leads to an update of Gauss–Newton, whereas a large one corresponds to the steepest descent update. 54 The steepest descent might converge to different local minima because the descent is fast when the estimated parameters are far from their optimums at the beginning of the iteration. In contrast, it is slow when the parameters are close to their optimums. The Gauss–Newton method might also converge to local minima if the initial guess is far from the optimal solution due to a too sizable iterative step size. In addition, the reconstruction quality of FISTA + L1 is slightly better than that of BFGS + L1 since the BFGS convergence value depends on the eigenvalues of the Hessian matrix. The larger the eigenvalues, the more iterations are required to correct them. As shown in Figure 11, FISTA requires the least iteration times to converge to the global minimum among the four algorithms.
Third, we conducted experiments to analyze the influence of various regularization tools on the reconstruction quality by BFGS. From the results shown in Figures 12 and 13, we found that BFGS + L1 can achieve better reconstruction quality than BFGS + TV and BFGS + Tikhonov, demonstrating that changing the regularization term does not improve the quality of reconstructions by BFGS.
Images of the vessel phantoms reconstructed with BFGS optimization. (a) BFGS + L1, (b) BFGS + TV, and (c) BFGS + Tikhonov.
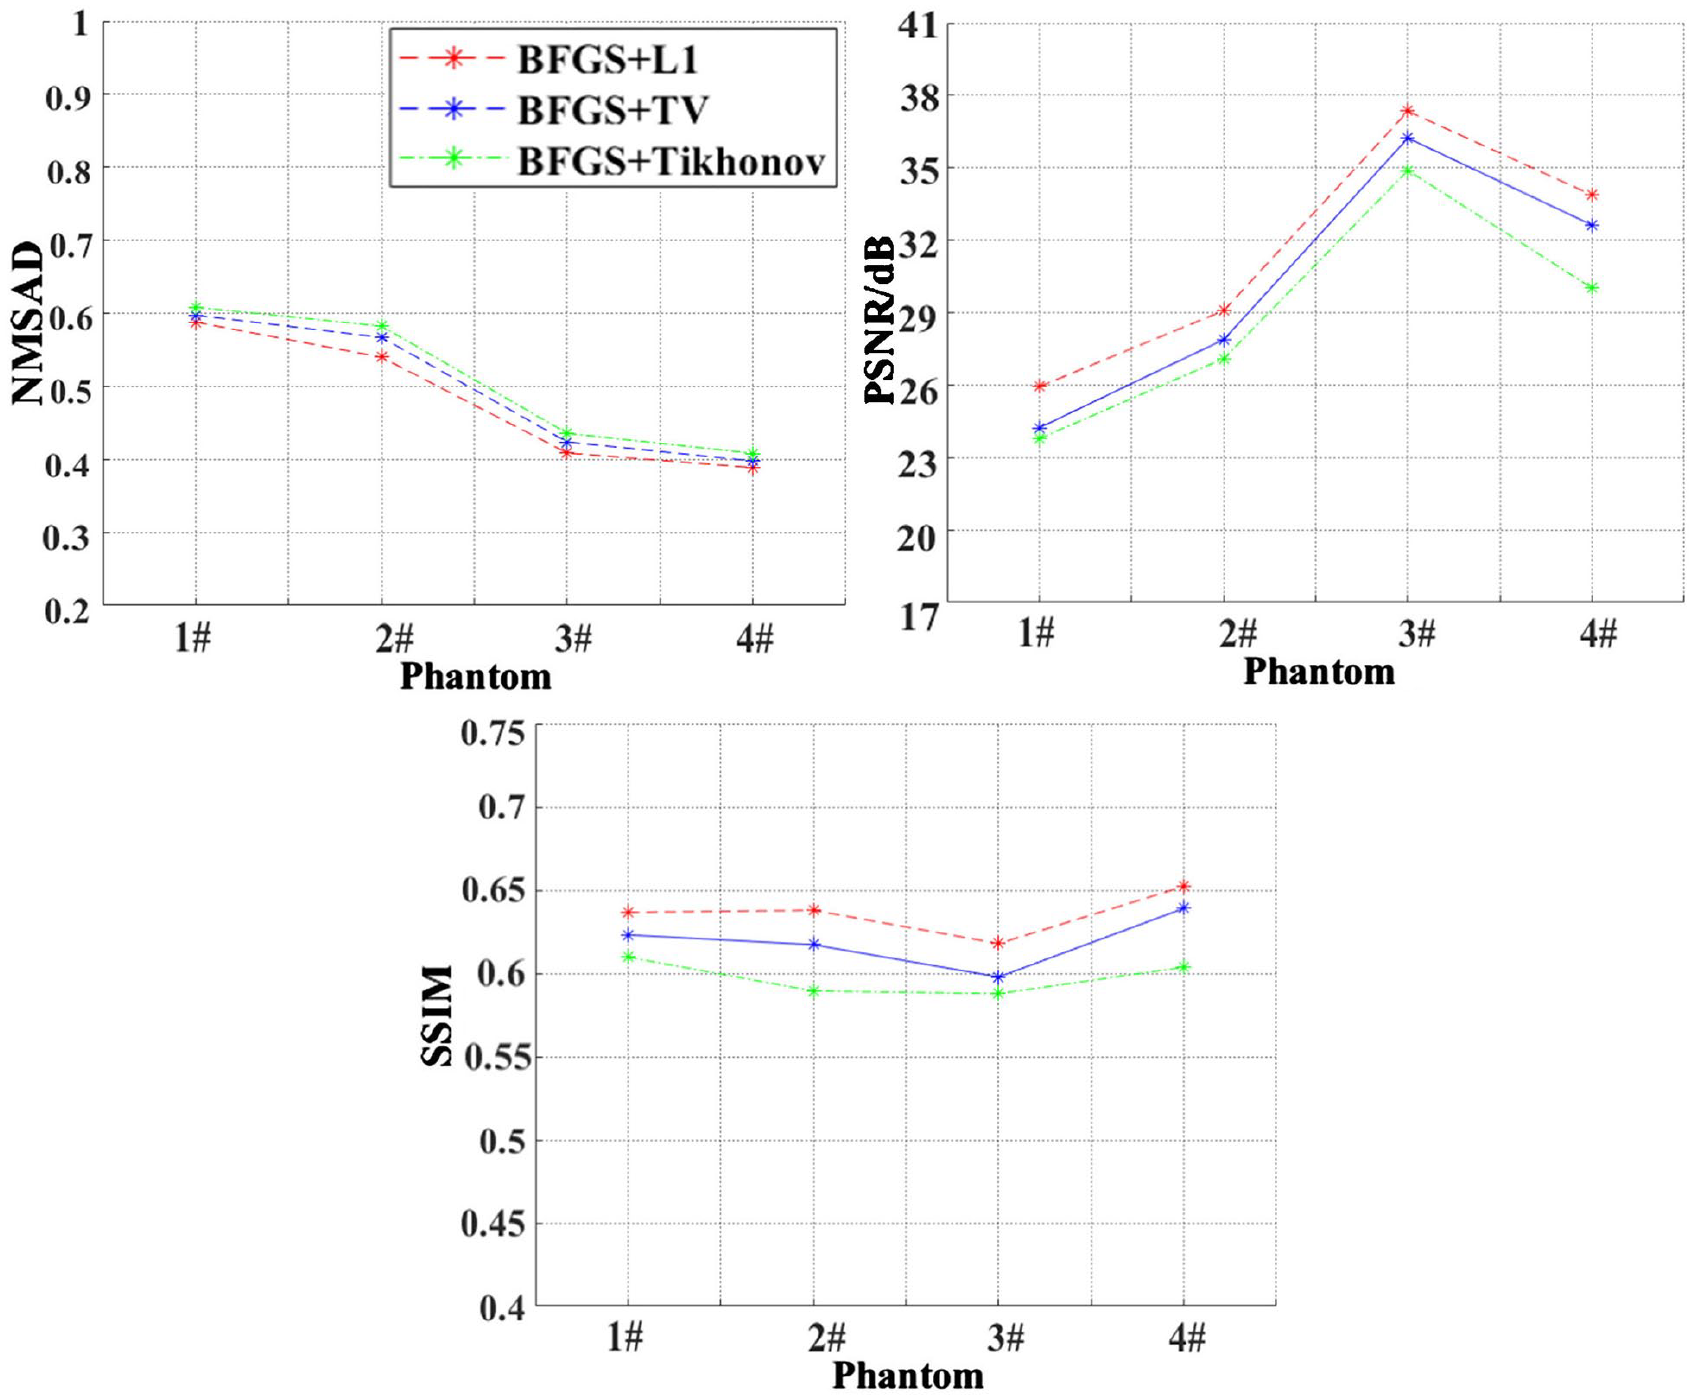
Evaluation metrics of the images shown in Figure 12. (A color version of this figure is available in the online journal.)
Influence of the initial guess of iterations
We changed the initial AOED in iteration while letting the other parameters remain unchanged to discuss the dependence of our method on the values of the initial guess. Figures 14 and 15 provide the results in the cases of A0(
Images of the vessel phantoms reconstructed with different initial values of AOED. (a) 0.3, (b) 0.6, and (c) 0.9.
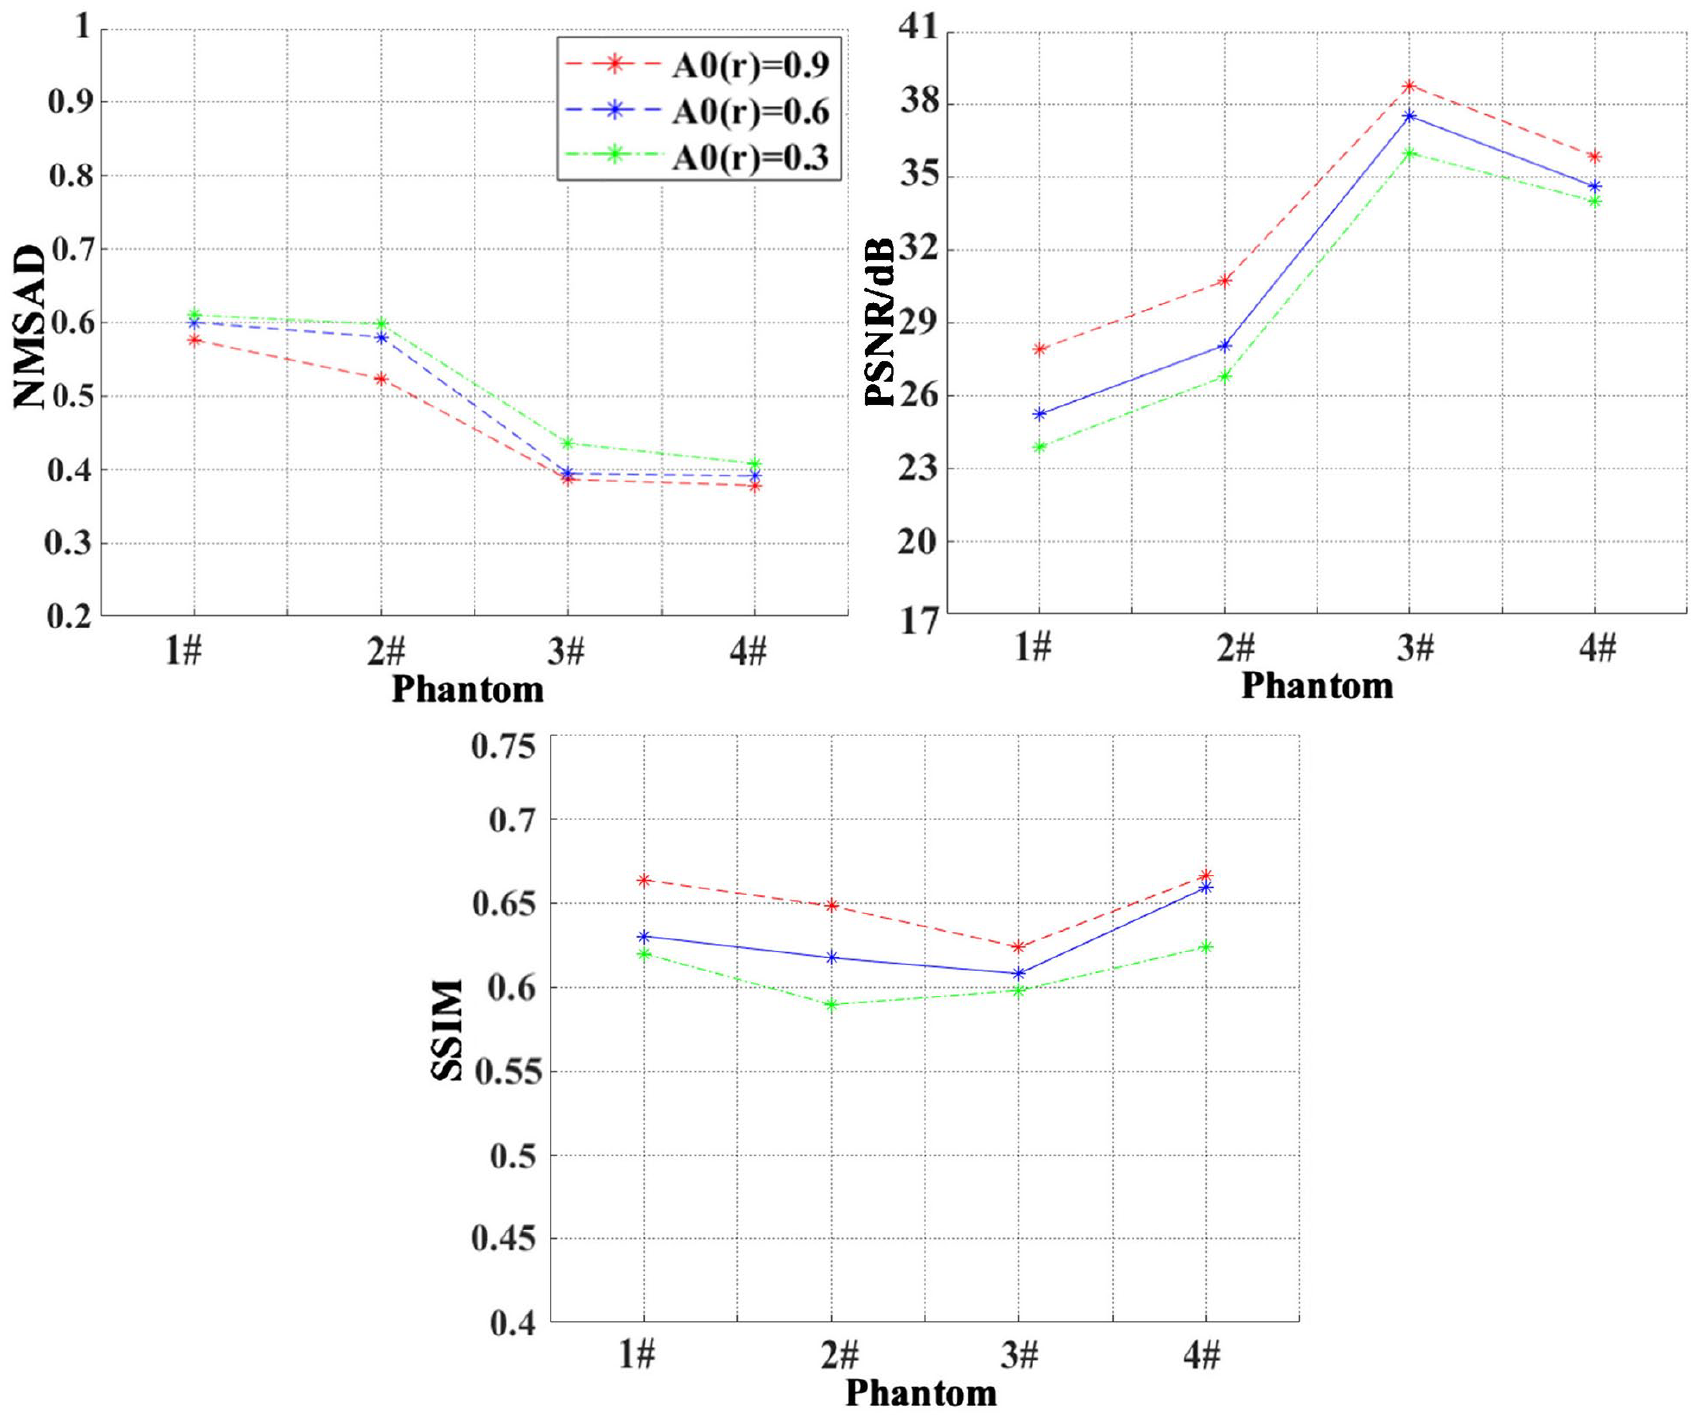
Evaluation metrics of the images shown in Figure 14. (A color version of this figure is available in the online journal.)
Discussion
Image reconstruction is an essential issue in PAT imaging. The method used to reconstruct tomographic images depends on the complexity of the imaged structures, collecting the photoacoustically induced acoustic waves, and the type of detector. EPAT is an endoscopic application of PAT to visualize the anatomical structures and functional compositions of biological tubular structures. Its scanning aperture is enclosed in a digest cavity or a vascular lumen with complex geometry. Therefore, sparsely sampling in a limited view is inevitable owing to the limitation of the mechanical structures of the catheter. EPAT cannot directly use well-developed PAT image reconstruction methods. On the contrary, the reconstruction methods developed especially for EPAT cannot be applied to PAT without any changes. This study focuses on reconstruction enhancement techniques for EPAT rather than general PAT.
The model-based image reconstruction is essentially the inversion of a forward operator, such that the reconstruction accuracy relies strongly on accurate forward modeling. The forward model of photoacoustic imaging includes optical model, acoustic model, and ultrasonic detection model. The optical model describes the transmission of incident light in the tissue, and the acoustic model depicts the propagation of photoacoustic waves in the tissue. The two are coupled by the thermoelastic effect. RTE is a widely accepted physical model of light transmission in turbid media. Given the light source, the geometry of the imaging target, and optical parameters of the imaging medium, solving the RTE produces the theoretical light fluence. However, the solution of the RTE is a computationally burdensome task since it is an integrodifferential equation in phase space. Discretization is required in both space domain and angle domain. Therefore, its approximations are generally applied in optical imaging, such as the diffusion approximation and Monte Carlo (MC). 61 The diffusion approximation is a deterministic model based on which the RTE is simplified as the DE. The solution of the DE is relatively simple in that discretization is needed only in the space domain. However, the diffusion approximation is only valid in the diffusion domain, that is, the region of several mean free paths from the light source. For PAT, the area close to the light source and the imaging domain boundary constitute essential parts of the recovered image. They usually contain crucial information required for the evaluation of diseased tissues. Light transmission in these regions is highly anisotropic, so the diffusion approximation does not hold. Alternatively, MC is a stochastic method that simulates interactions between light and tissues. A calculative brief model of light propagation in turbid media is required in the model-based image reconstruction algorithms because the forward operator is calculated repeatedly during iteration. Therefore, this would consider the computational and accuracy trade-offs between DE and MC to better determine what situations would be used. Figures 16 and 17 provide the image results of DE and MC, respectively. The results reveal insignificant differences between the quality of the final reconstructions by DE and MC, while MC is computationally burdensome than DE. These results suggest that the possible inaccuracy of DE in modeling light transport in the regions where the diffusion approximation is invalid is tolerable in terms of the significant improvement in the image quality and computational cost.
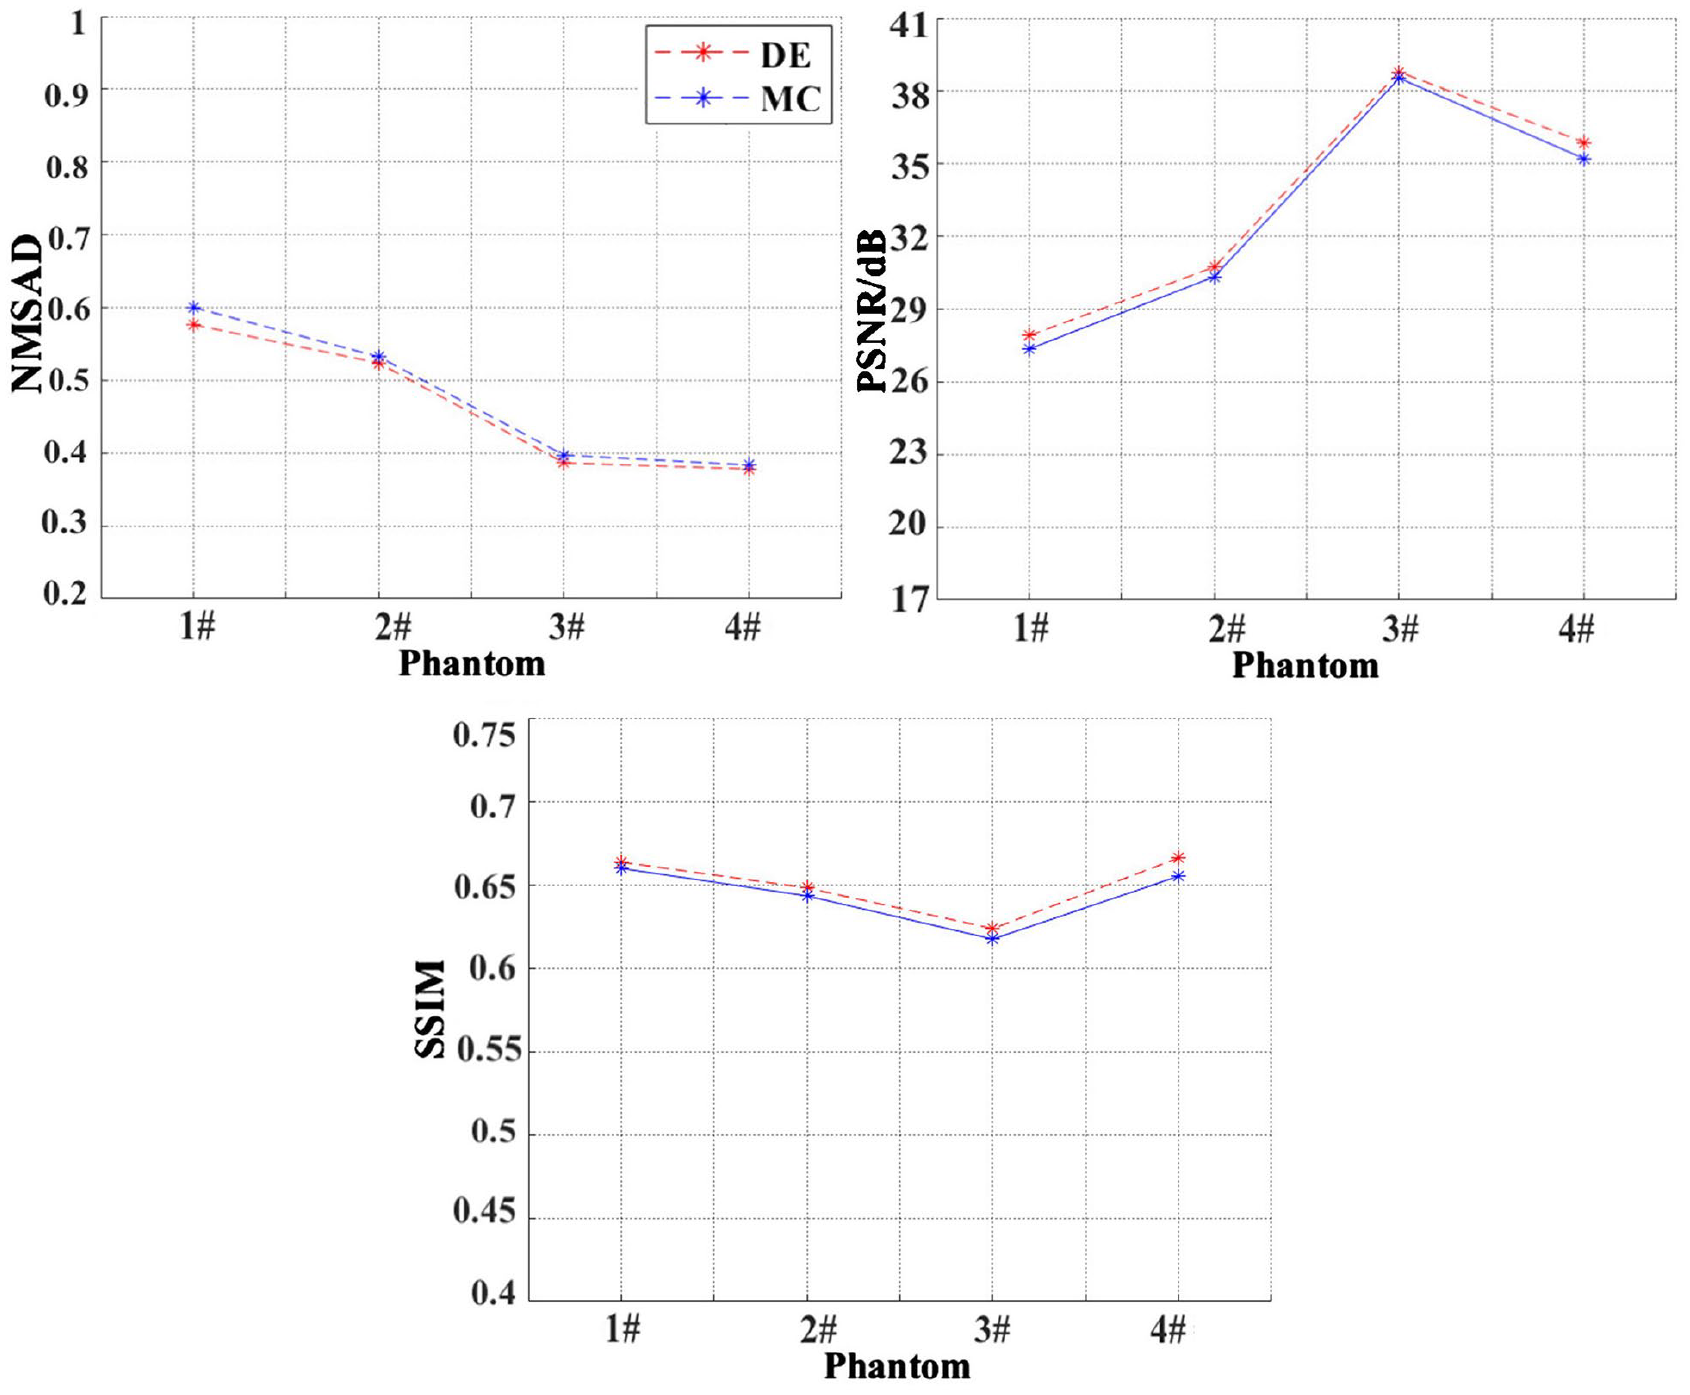
Evaluation metrics of reconstructed images when using DE and MC for light transport modeling, respectively. (A color version of this figure is available in the online journal.)
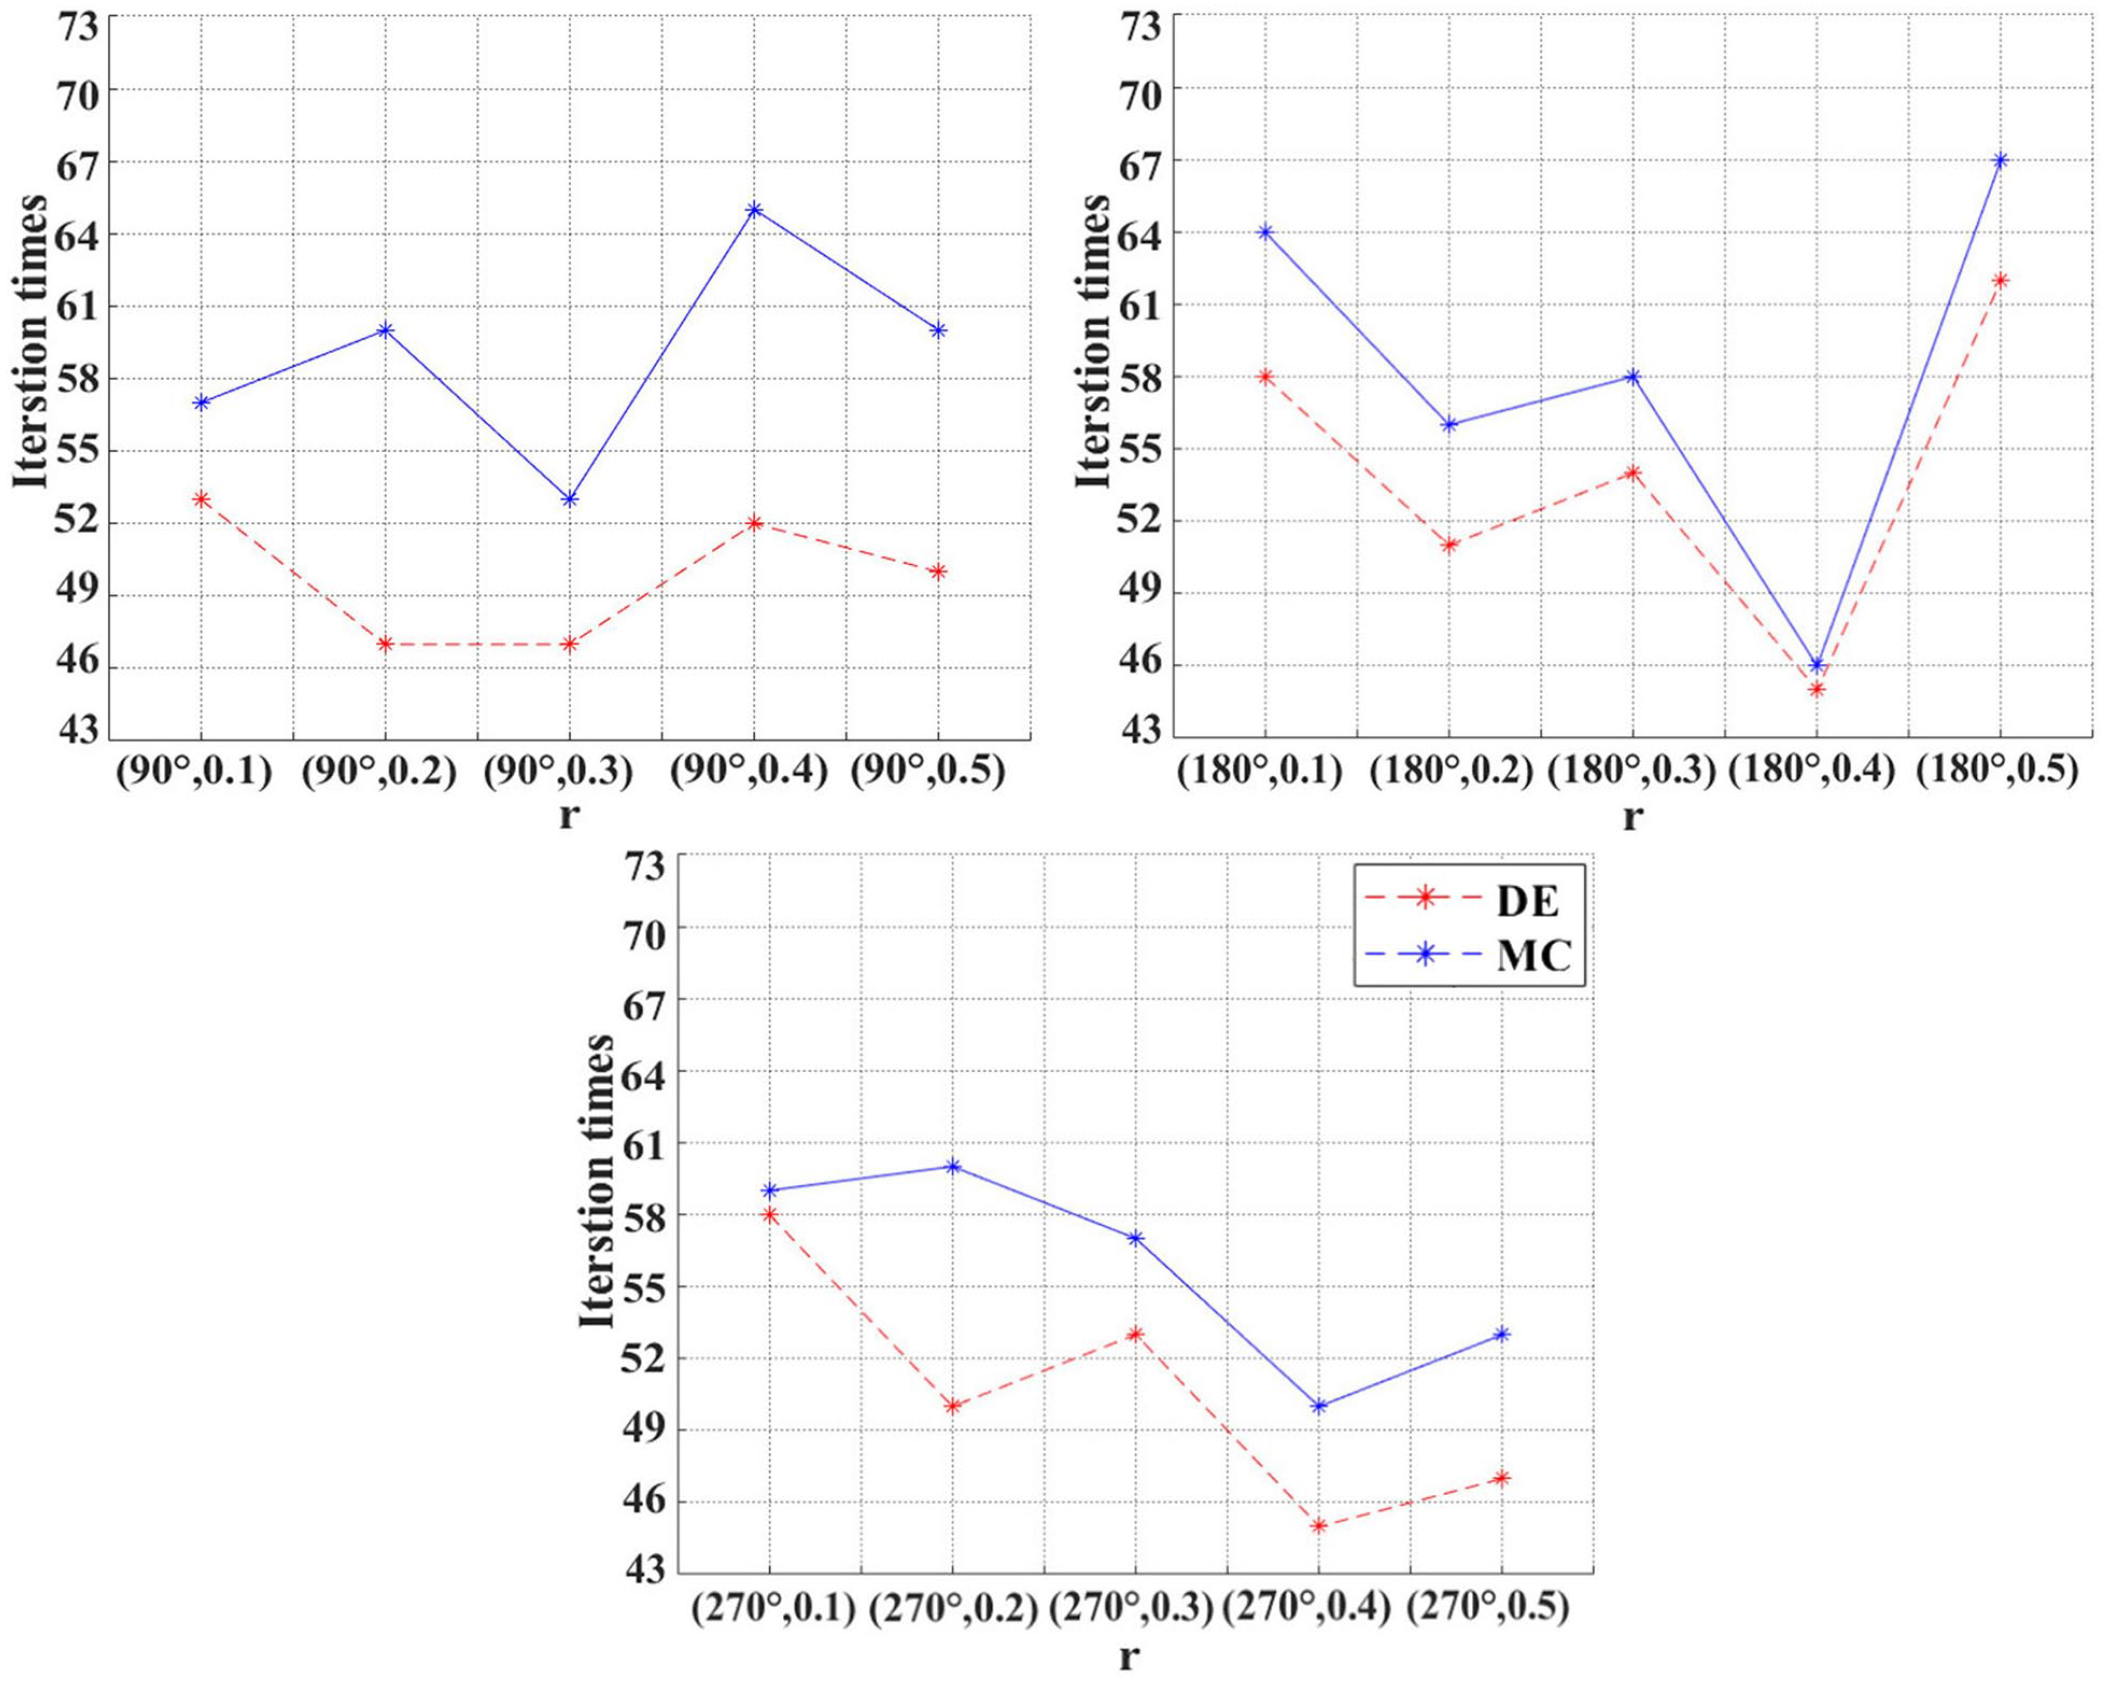
Iteration times for recovering the AOED at several locations in the cross-section of vessel phantom I when DE and MC are used for light transport modeling, respectively. (A color version of this figure is available in the online journal.)
In addition, the image reconstruction algorithm should take the detector properties into account to improve the image quality. In this work, we only incorporated the spatial and temporal responses of the detector into the forward model. However, in practical applications, the detector directionality, 62 limited aperture, 11 limited view, 63 limited bandwidth, 64 scanning radius, 65 and the uncertainty of detector position 66 affect the reconstruction quality apart from the EIR and SIR. We will optimize the accuracy of the forward model further in our future work by incorporating these detector properties into the model, ultimately improving the quality of reconstructed images.
In addition, even though promising results have been obtained with simulation data, verifying the fidelity of the recovered structures for in vivo images is still technically challenging. It is a common problem in image reconstruction and enhancement methods due to the lack of ground truth information on the underlying tissue properties when acquiring experimental measurements. 64 Our future work will validate our approach on in vivo data.
Conclusions
We designed a method for EPAT image reconstruction considering the detector responses. We incorporated the SIR and EIR of the detector into the forward model. We then reconstructed the cross-sectional images representing the AOED distribution based on the sampling voltage signals by iteratively solving the inverse problem of the forward model. The results of the simulation data demonstrated the improvement of the reconstruction quality by our method compared with conventional BP and the previous CG method. Our comparison results indicate that the image quality reconstructed with FISTA + L1-regularization is better than FISTA + TV-regularization and FISTA + Tikhonov-regularization. In contrast, FISTA is superior to BFGS, CG, and L-M when L1 regularization is used. In addition, our model-based reconstruction based on FISTA + L1 optimization has been demonstrated to be robust to the initial guess of iteration.
Footnotes
Authors’ contributions
All the authors contributed to the experimental and model design, data analysis, and manuscript writing.
Declaration of conflicting interests
The author(s) declared no potential conflicts of interest with respect to the research, authorship, and/or publication of this article.
Funding
The author(s) disclosed receipt of the following financial support for the research, authorship, and/or publication of this article: This work was supported by the National Nature Science Foundation of China (no. 62071181).