
Abstract
Most patients with pharmacoresistant mesial temporal lobe epilepsy (MTLE) have hippocampal sclerosis on the postoperative histopathological examination. Although most patients with MTLE do not refer to a family history of the disease, familial forms of MTLE have been reported. We studied surgical specimens from patients with MTLE who had epilepsy surgery for medically intractable seizures. We assessed and compared gene expression profiles of the tissue lesion found in patients with familial MTLE (n = 3) and sporadic MTLE (n = 5). In addition, we used data from control hippocampi obtained from a public database (n = 7). We obtained expression profiles using the Human Genome U133 Plus 2.0 (Affymetrix) microarray platform. Overall, the molecular profile identified in familial MTLE differed from that in sporadic MTLE. In the tissue of patients with familial MTLE, we found an over-representation of the biological pathways related to protein response, mRNA processing, and synaptic plasticity and function. In sporadic MTLE, the gene expression profile suggests that the inflammatory response is highly activated. In addition, we found enrichment of gene sets involved in inflammatory cytokines and mediators and chemokine receptor pathways in both groups. However, in sporadic MTLE, we also found enrichment of epidermal growth factor signaling, prostaglandin synthesis and regulation, and microglia pathogen phagocytosis pathways. Furthermore, based on the gene expression signatures, we identified different potential compounds to treat patients with familial and sporadic MTLE. To our knowledge, this is the first study assessing the mRNA profile in surgical tissue obtained from patients with familial MTLE and comparing it with sporadic MTLE. Our results clearly show that, despite phenotypic similarities, both forms of MTLE present distinct molecular signatures, thus suggesting different underlying molecular mechanisms that may require distinct therapeutic approaches.
Keywords
Impact Statement
Mesial temporal lobe epilepsy (MTLE) is the most frequent type of partial epilepsy in adults. We have previously described a familial form of MTLE associated with hippocampal abnormalities, familial mesial temporal lobe epilepsy. Unfortunately, treating patients with MTLE using antiseizure medication is ineffective in controlling seizures in about one-third of them, making it essential to identify new treatment targets. In this work, by studying the mRNA expression signature of brain tissue from patients with MTLE, we show evidence that familial and sporadic forms of the disease may have different underlying molecular mechanisms. Also, we show that these differences may impact the treatment of these patients by identifying candidate compounds based on mRNA expression signatures.
Introduction
Mesial temporal lobe epilepsy (MTLE) is the most common form of medically refractory focal epilepsy. 1 Most patients with pharmacoresistant MTLE have hippocampal sclerosis (HS) as the underlying pathology.2,3 Signs of HS can be detected reliably in vivo by magnetic resonance imaging (MRI). 4 Thus, patients with medically refractory MTLE and signs of HS by MRI can be treated by epilepsy surgery, in most cases with a favorable outcome.5–7 The surgical tissue resected from these patients can be studied, and numerous reports of target expression studies have used this material.8–13 In addition, several high-throughput studies aiming to determine the expression profile of the lesion identified in these patients have been published, all of which have sporadic, non-familial forms of MTLE.14–20 In general, the main enriched pathways and biological processes identified in these studies are extracellular matrix and cytoskeletal organization, axonal and dendritic morphogenesis, metabolism, synaptic plasticity (CDK5, SCN1B, FN1, RELN, TGFβR2, NLRP1, CSNK2B, CABP1, NEUROD6, KIF5A, and SCRT1 genes), and GABA and glutamate pathways (CACNG2, GABRA5, GABRB3, ABAT). In addition, there are reports of altered expression in signal transduction genes (MAPK1, PRKAR1A, PLA2G4 C, MAP4 K4, G3BP2, GPR37), the prothrombin pathway (F13A1), atherosclerosis signaling (COL1A2, COL1A1, LYZ, COL3A1), complement signaling (C1R, C7, CFI), and cytokine secretion (IL-10, IL-1B, CXCL8, HLA).14–20
Most patients with MTLE do not refer to a family history of the disease and are therefore considered sporadic; however, there are reports of familial MTLE.21–25 The familial recurrence of MTLE was first reported in 1998. 26 Subsequently, we have described in detail the most extensive series of patients with familial MTLE identified to date.7,21,27–38 Among other characteristics, we found that hippocampal abnormalities seen on MRI are observed in most patients with familial MTLE, including those with benign disease or even spontaneous seizure remission. 31 Furthermore, MRI performed in asymptomatic first-degree relatives of patients with familial MTLE revealed hippocampal signal abnormalities in about 50% of these individuals, suggesting a pre-existing lesion.32,33 However, a longitudinal MRI study demonstrated that seizures could cause further damage to the abnormal hippocampal formation of patients with familial MTLE. 30 Also, linkage studies have been carried out in familial forms of temporal lobe epilepsy, such as the identification of a locus on the chromosome (chr) 10q in patients with partial epilepsy with auditory symptoms. 39 Since these results were obtained in a family with a different temporal lobe epilepsy syndrome, we tested our families with MTLE and excluded linkage to the chr10q loci. These results indicate the presence of genetic heterogeneity in familial temporal lobe epilepsy, which seems to be syndrome specific. 40 Also, there are a few additional studies reporting linkage of single families with temporal lobe epilepsy to loci at chr 1q25-q31, 41 and 12q22-q23.3, 42 as well as a few reports of patients with chr abnormities on 18qter 41 and 15q26qter. 43 Finally, in 2012, we identified the first locus for familial MTLE with HS, located on chr 18p11.31. 28 However, the gene expression profile and molecular pathways involved in familial MTLE have not been studied to date.
Previous studies comparing patients with familial and sporadic MTLE revealed no significant differences in clinical presentation, electroencephalographic findings, neuroimaging characteristics, and response to surgical treatment. However, a detailed neuropathological study reported that mossy fiber sprouting was less pronounced in patients with familial MTLE.7,44,45
Thus, we aimed to investigate and compare gene expression profiles in surgical tissue obtained from patients with familial and sporadic MTLE. In addition, with the expression signatures identified, we determined the main biological pathways represented in the resected tissue and candidate therapeutic compounds that could be used to treat these patients.
Materials and methods
Patients and controls
This study used surgical tissue, mainly hippocampi, from patients with pharmacoresistant MTLE who underwent surgery. Patients were investigated using a detailed research protocol applied to all patients with medically refractory seizures referred to our Epilepsy Center at the University of Campinas (UNICAMP) since 1998. These include a detailed neurological examination, serial electroencephalograms (EEGs), and a state-of-the-art neuroimaging investigation, including high-field volumetric MRI and neuropsychological and psychological assessments. Seizures were lateralized according to the medical history, interictal EEGs, and comprehensive neurological examination.35,46 Family history of epilepsy was considered positive when the patient had at least two first- or second-degree relatives with MTLE, as defined by diagnostic criteria proposed previously and accepted by the literature in the field of epilepsy and by the International League Against epilepsy.2,3,7,21–38,45 None of the patients included in the present study had any generalized or complex partial seizures documented 48 h before or during epilepsy surgery. This project was approved by the Research Ethics Committee of the University of Campinas (ethics approval # CAAE: 12112913.3.0000.5404), and all patients signed a consent form to donate part of the surgical tissue to research.
We obtained the gene expression profiles from normal hippocampi from the Gene Expression Omnibus (GEO) database (http://www.ncbi.nlm.nih.gov/geo/) access number GSE11882. Postmortem hippocampi tissues are from cognitively intact individuals aged 20–99, obtained from seven Institute on Aging Alzheimer’s Disease brain banks located in the United States (for more details, see original manuscript 47 ). These data were used when comparing the two groups of patients with controls. We downloaded the .CEL files from the Human Genome U133 Plus 2.0 chips (Affymetrix, https://www.affymetrix.com/support/developer/powertools/changelog/gcos-agcc/cel.html) and included in our microarray pipeline analysis. Thus, we analyzed data from three groups: patients with familial MTLE (n = 3), patients with sporadic MTLE (n = 5), and controls from the GSE11882 dataset (n = 7).
Tissue processing
Fresh surgical specimens were sectioned, immediately frozen in liquid nitrogen, and stored at -80°C until processing. For the microarrays, we used total RNA isolated by using the TRIzol™ reagent (Invitrogen, Carlsbad, USA), following the manufacturer’s instructions. We determined the concentration of the samples by spectrophotometry at 260/280 nm and by electrophoresis on agarose gels.
Gene expression by microarray
We performed transcriptional profiling of total RNA (5 µg) from surgical specimens of patients by using the Affymetrix (Santa Clara, CA) oligonucleotide microarray Human Genome U133 Plus 2.0, according to a standard One-Cycle Target Labeling protocol array for complementary DNA (cDNA) synthesis. We performed in vitro transcription, production of biotin-labeled complementary RNA (cRNA), hybridization of cRNA with the plate, and scanning of image output files using the GeneChip Scanner 3000 (Affymetrix). In addition, we assessed the quality of hybridized chips by following the Affymetrix guidelines based on the average background, scaling factor, the number of genes called present, and 3’ to 5’ ratios for endogenous control genes.
We only included high-quality arrays in the bioinformatics analysis pipeline. We included the .CEL files generated from the experiments indicated above (patients) and the .CEL files from the GEO database (controls) in our bioinformatics pipeline. We processed in the R environment (http://www.r-project.org) using the computer packages “affy” and “limma” from Bioconductor.48,49 We considered genes to be significantly differentially expressed when the log2 fold change (log2FC) was ⩾ 1.0 or ⩽ -1.0 and the false discovery rate (FDR)-adjusted P-value was ⩽ 0.05. 50
Functional enrichment analysis
We identified over-represented Gene Ontology (GO) categories using the “clusterProfiler” R package. This approach identifies enriched known biological functions and processes in the list of differentially expressed genes. 51 This analysis calculated the hypergeometric distribution corresponding to the one-sided Fisher’s exact test. 52 We considered significant GO terms to have an FDR-adjusted p-value ⩽ 0.05.
We also carried out a second functional enrichment analysis using Metascape. 53 This analysis clusters enriched terms into non-redundant groups, where it implements similar logic as found in the Database for Annotation, Visualization and Integrated Discovery (DAVID). 54 It also combines functional enrichment, interactome analysis, and gene annotation based on over 40 independent knowledgebases such as GO processes, 55 Kyoto Encyclopedia of Genes and Genomes (KEGG) pathways, 56 Reactome gene sets, 57 canonical pathways, 58 and CORUM complexes, 59 enabling comprehensive analysis and interpretation of the results.
Gene set enrichment analysis
We used the list of differentially expressed microarray probes identified in the two groups of patients in the GSEA software version 4.1.0 (http://www.broad.mit.edu/gsea). We downloaded a .gmt file containing “all curated gene sets v 7.4” from the MSigDB database. We queried this database against the gene expression profiles identified in the patients with the following parameters: probe set collapse = true; phenotype = MTLE vs control; permutation = gene set; permutations = 1000; gene set size = 15 < n < 500. We considered gene sets to be significantly enriched when p < 0.05, FDR q-value < 0.05, and the familywise error rate (FWER) p-value < 0.05. Details of the GSEA software and algorithms are provided elsewhere. 58
Connectivity map analysis
We used the list of differently expressed genes identified in patients, excluding non-HG-U133A probe sets, to query the C-MAP software build 02 (http://www.broadinstitute.org/cmap). We analyzed compounds with a negative correlation and p < 0.05 as potential new compounds for the treatment of MTLE. In this analysis, compounds with negative correlation are putatively capable of reversing the disease to a normal/healthy state. Details of the Connectivity Map dataset and analytics are provided elsewhere. 60 We identified biochemical interactions using the ChEMBL database, 61 DrugBank, 62 and/or the PubChem database (http://pubchem.ncbi.nlm.nih.gov). We did not consider the following compounds as potential candidates: those not found or not functionally described in the databases, and antibiotics, antifungals, and anthelmintics.
Results
Clinical characteristics of patients
Presurgical evaluation of all patients confirmed the diagnosis of MTLE according to the criteria proposed by the International League Against Epilepsy, 63 including the presence of MRI findings of HS. In addition, all patients had focal seizures, which had not been controlled using optimal doses of antiseizure medications for at least 2 years. 1 The mean preoperative seizure frequency was 7.25 seizures/month for patients with familial MTLE and 9.25 seizures/month for sporadic MTLE. The most relevant clinical information for both groups of patients is shown in Table 1.
Summary of main clinical characteristics of patients with mesial temporal lobe epilepsy included in the microarray analysis.
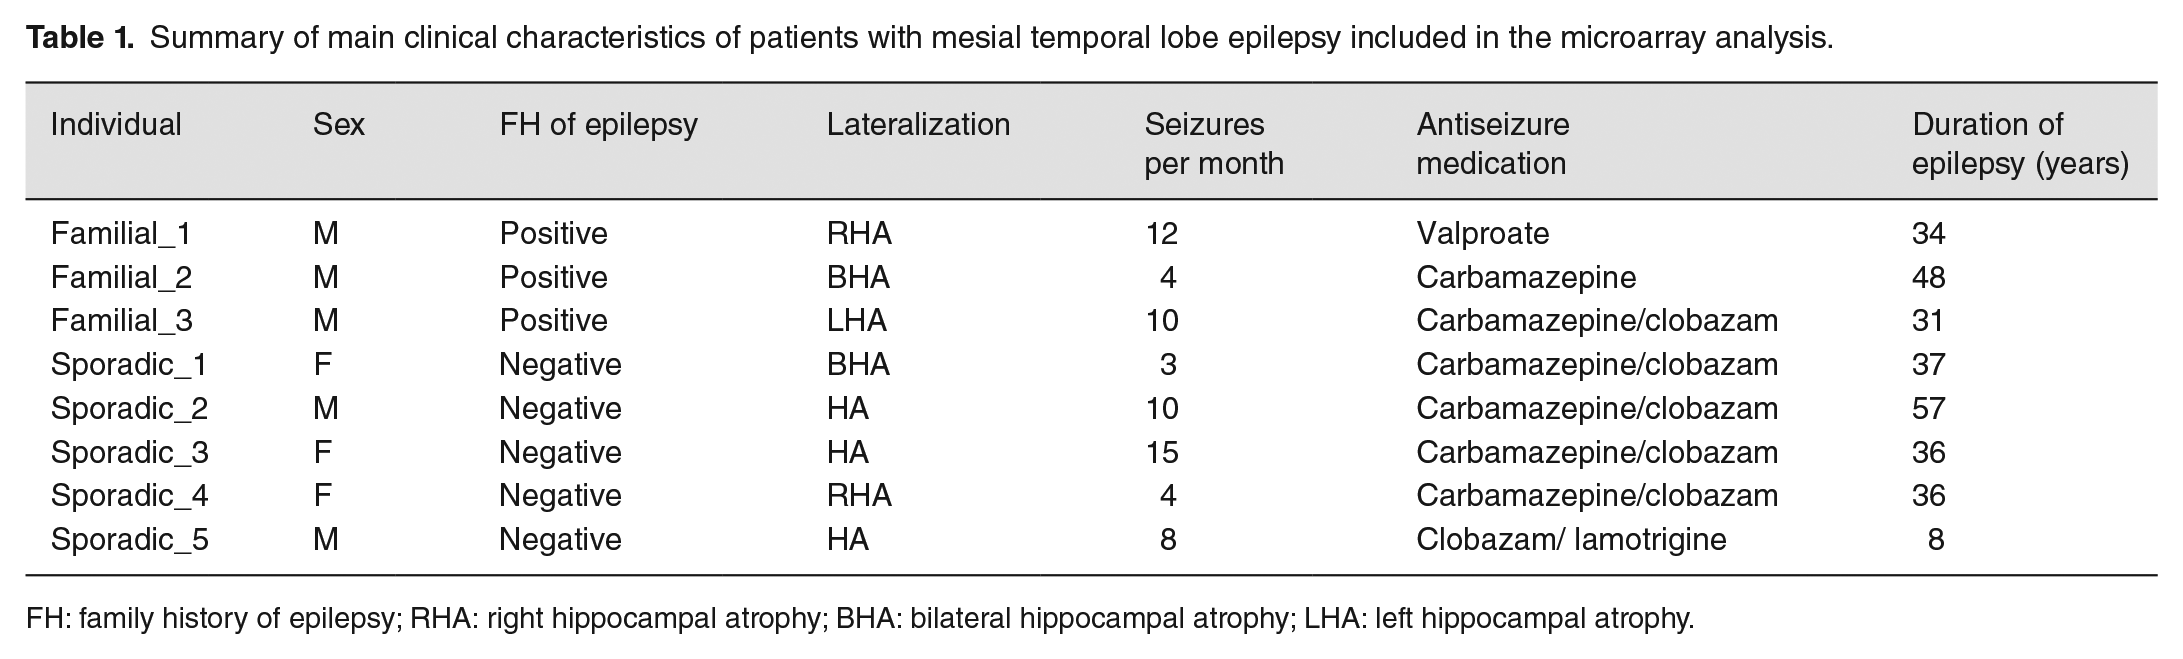
FH: family history of epilepsy; RHA: right hippocampal atrophy; BHA: bilateral hippocampal atrophy; LHA: left hippocampal atrophy.
General features of gene expression for familial and sporadic MTLE
Overall, transcriptional changes were differentially distributed, in terms of up- and downregulation, when comparing familial and sporadic MTLE. Figure 1 shows a hierarchical cluster analysis for the three groups studied: patients with familial MTLE, patients with sporadic MTLE, and controls. To assess the global variance in gene expression profiles among the different groups, we performed a principal component analysis (PCA) of the microarray data. As shown in Figure 2, the PCA revealed three distinct clusters correlating with the three groups analyzed. Since patients were using different antiseizure medications (ASM) and these drugs may change gene expression, 64 we performed a PCA analysis according to ASM used and found no sample stratification according to treatment, Supplemental Figure 1.
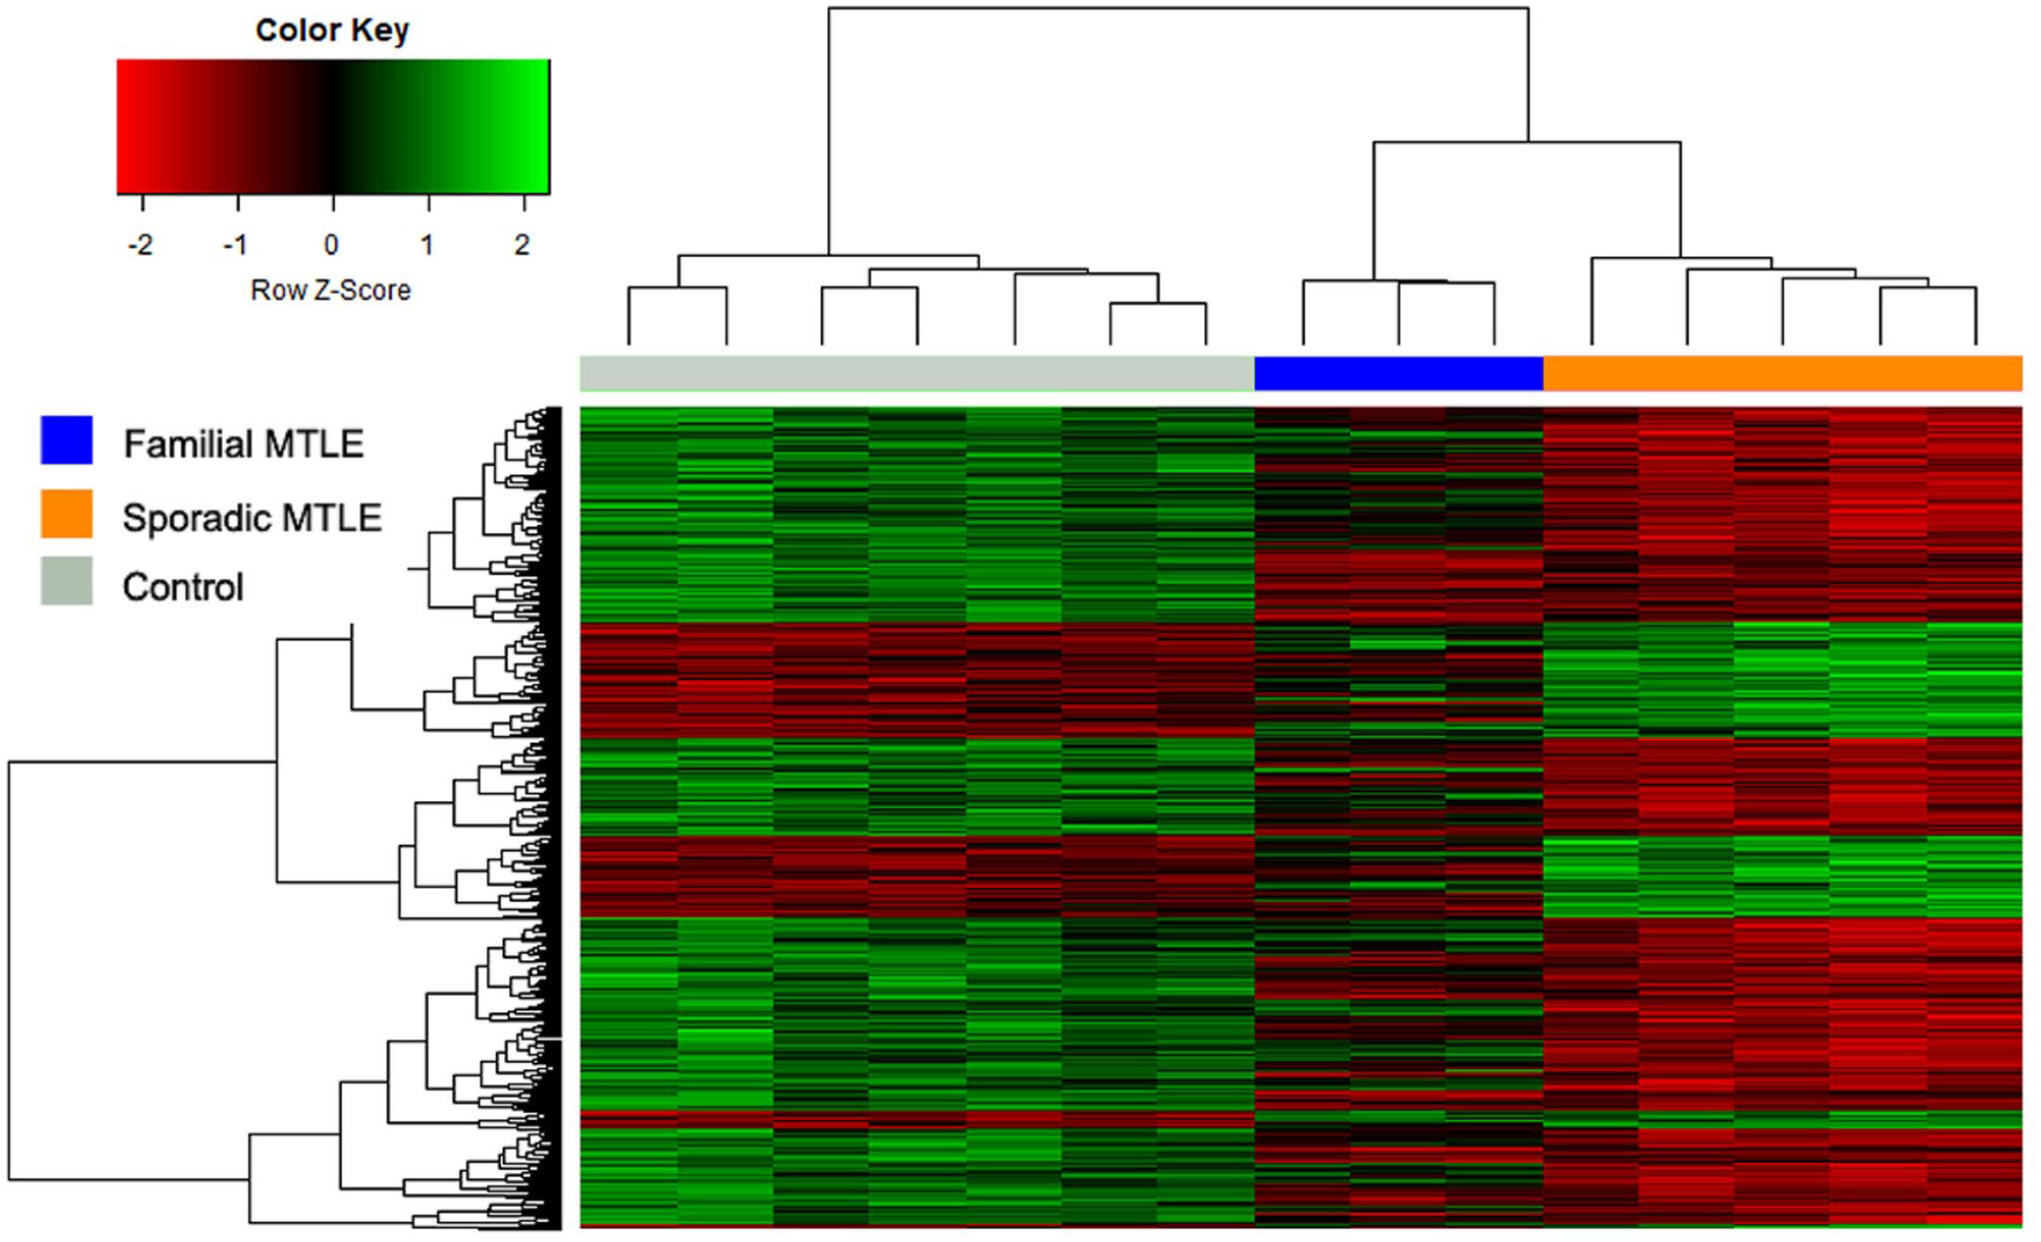
Hierarchical cluster analysis depicting the expression signature in hippocampi of patients with familial mesial temporal lobe epilepsy (MTLE), sporadic MTLE, and controls. The colorgram reflects the global differences among samples. The columns represent different samples, and the rows represent different genes. Gene expression is shown with a pseudocolor scale (-3 to +3), with the red color denoting a high expression level and the green color denoting a low expression level. The distances among high-dimensional expression profiles are represented as a dendrogram that arranges the clustered genes in terms of similarity. (A color version of this figure is available in the online journal.)
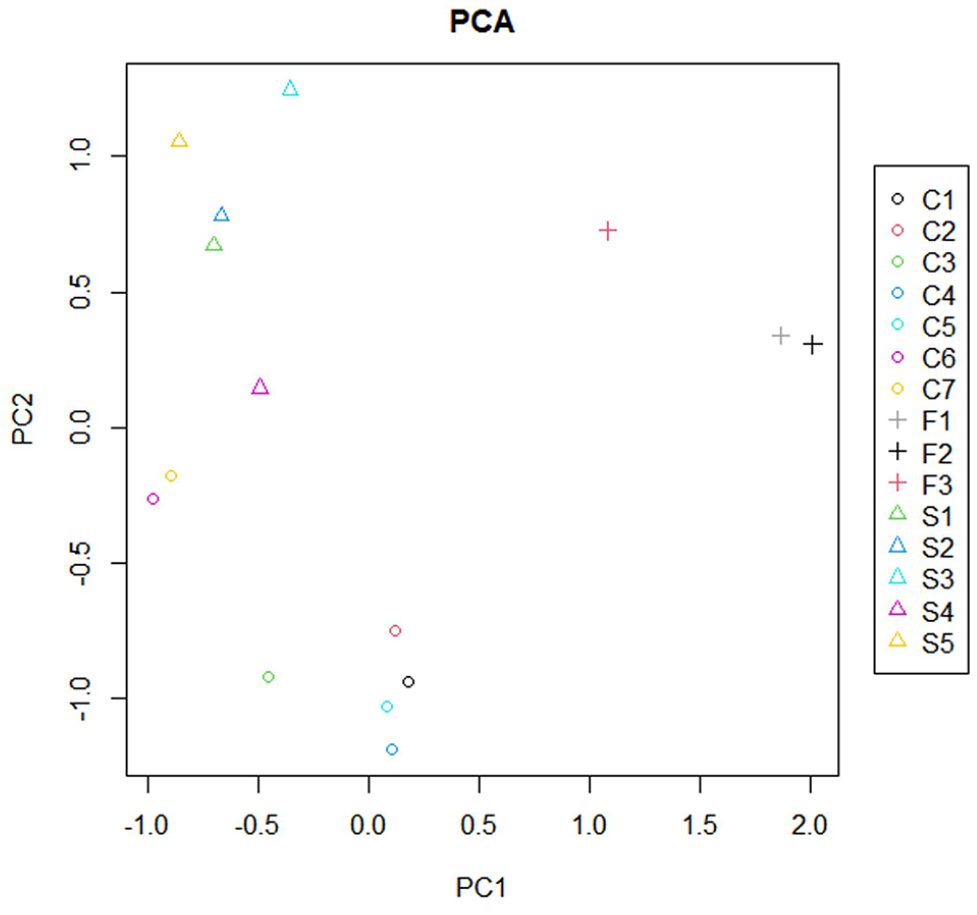
Principal component analysis (PCA) of variability in gene expression profiles from hippocampi of patients with familial mesial temporal lobe epilepsy (MTLE), sporadic MTLE, and controls. PCA depicts the distribution of each sample based on an orthogonal transformation that converts data of possibly correlated variables into a set of values of linearly uncorrelated variables (Components 1 and 2). The three experimental groups formed three distinct clusters, demonstrating gene expression differences among the three groups analyzed. C1-C7: controls; F1-F3: familial MTLE; S1-S5: sporadic MTLE.
To better explore the differentially expressed genes in the two groups of patients, we compared each group of patients to the controls. Comparing familial MTLE and controls, we found 3109 differentially expressed microarray probes. In addition, we identified 2766 annotated genes from these probes, some of which are redundant; thus, we found 2274 differently expressed unique genes. When comparing sporadic MTLE with controls, there were 1716 differently expressed probes, corresponding to 1296 annotated genes and 1077 unique genes. Finally, we found 3412 differentially expressed probes linked to 2757 annotated genes, of which 2278 were unique when comparing familial and sporadic MTLE. Figure 3 depicts the overall number of differentially expressed genes in the two-by-two comparisons among the three groups. A complete list of differentially expressed genes in the three different comparisons (familial MTLE versus controls, sporadic MTLE versus controls, and familial MTLE versus sporadic MTLE) can be found in the Supplemental Material (Table S1).
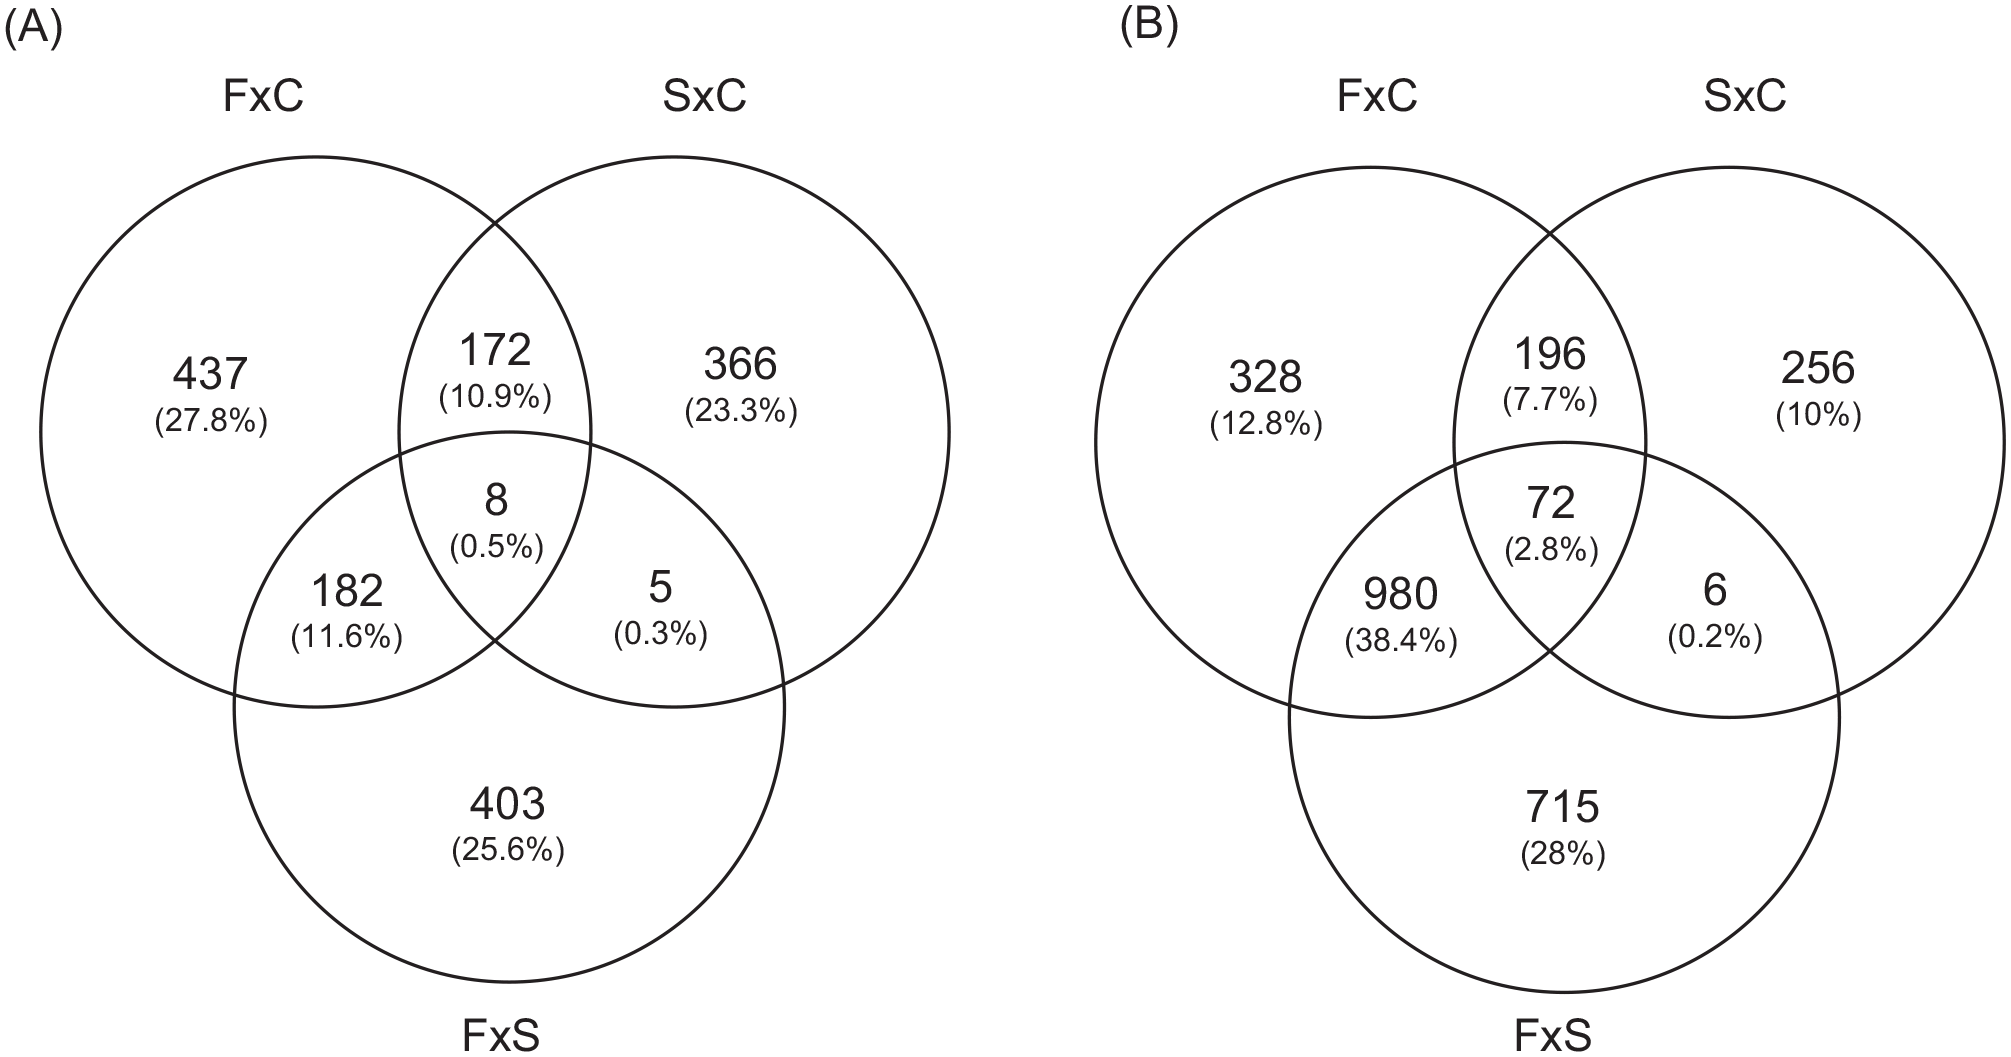
Graphic representation of the overlap in gene expression among hippocampi of patients with familial mesial temporal lobe epilepsy (MTLE), sporadic MTLE, and controls. (A) The Venn diagram shows the number of upregulated genes in hippocampi of patients with familial MTLE, sporadic MTLE, and controls. (B) The Venn diagram indicates the number of downregulated genes in hippocampi of patients with familial MTLE, sporadic MTLE, and controls.
GO processes and pathways modulated by differentially expressed genes in MTLE
We performed enrichment analysis using the list of differentially expressed genes in the two groups of patients with MTLE. We identified GO processes and biological pathways represented more frequently than expected by random distribution. We used the “clusterProfiler” package for the analysis. We used cut-off criteria of an enrichment score FDR-adjusted p-value = 0.05, q-value = 0.05, minimal size of genes annotated by ontology term for testing = 3, and maximal size of genes annotated for testing = 500. First, we performed the analysis using the list of genes generated by comparing familial and sporadic MTLE. The most represented GO categories were as follows: proteasomal protein catabolic process, regulation of protein serine/threonine kinase activity, regulation of GTPase activity, protein dephosphorylation, regulation of mRNA metabolic process, cytosolic transport, positive regulation of transcription, transport across the blood-brain barrier, and regulation of microtubule polymerization (Figure 4). Next, we compared familial MTLE with controls and found the following enriched GO categories: regulation of GTPase activity, dephosphorylation, positive regulation of the catabolic process, regulation of neuron projection development, and synapse organization (Figure 5). Finally, the top enriched GO categories of gene ontology for sporadic MTLE compared with controls were: regulation of GTPase activity, neutrophil-mediated immunity, positive regulation of cytokine production, and response to interferon-gamma (Figure 6).
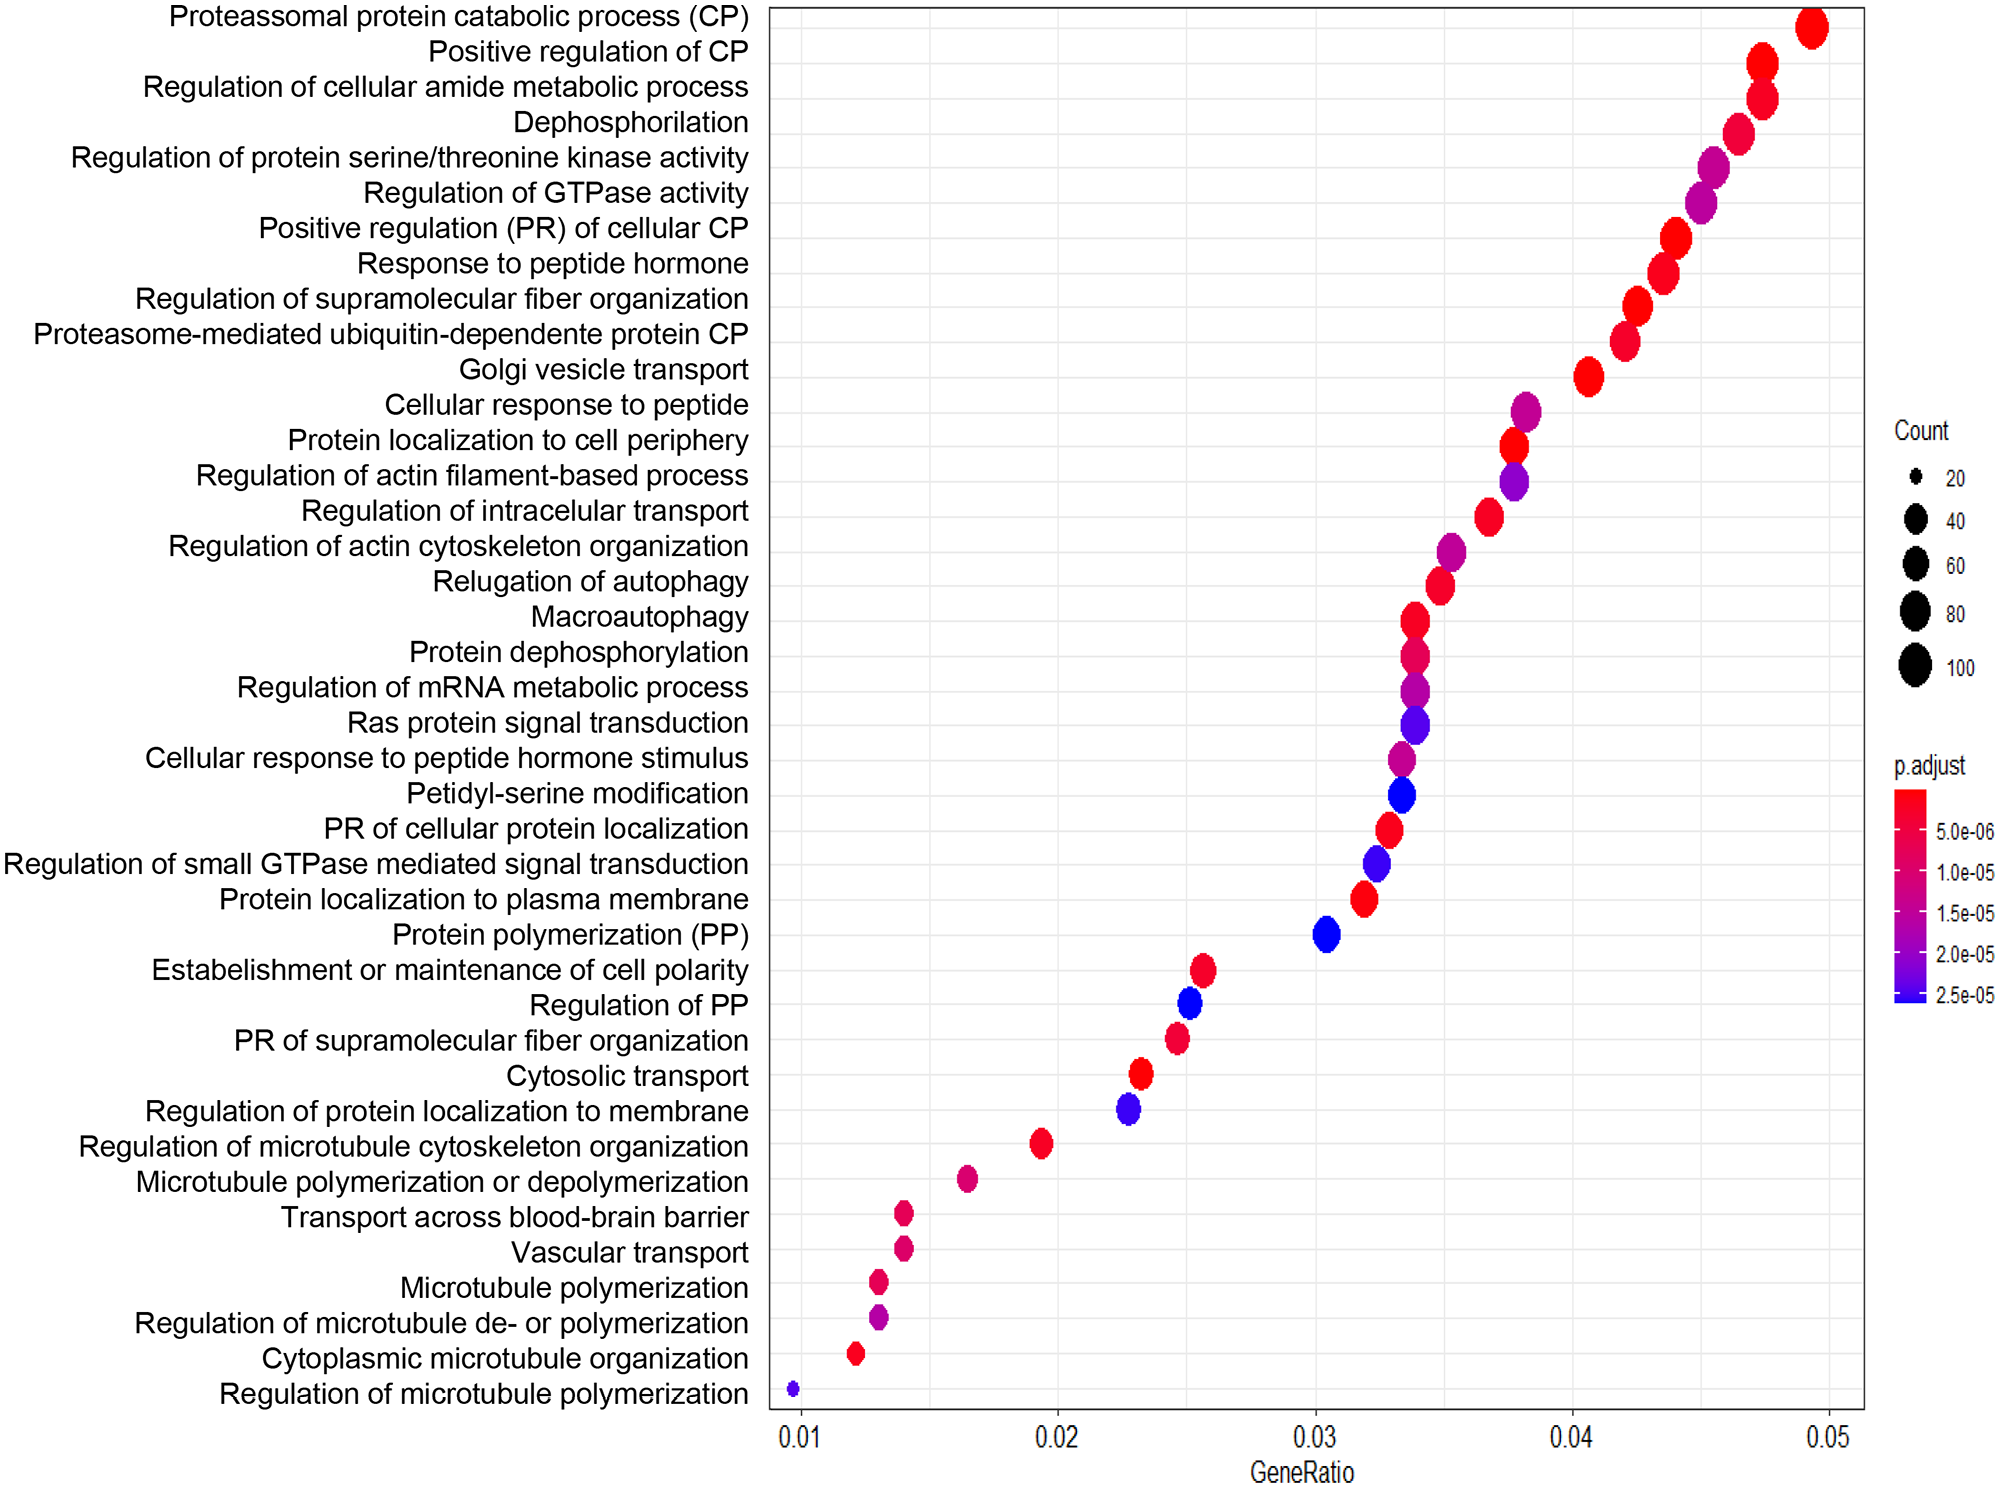
Graphic representation of the enrichment analysis for the group comparisons. The analysis was performed using the “clusterProfiler” package. The dot plot depicts the enriched Gene Ontology categories and the gene ratio. The dot size represents the enrichment score. The p-value depicts the significance of enrichment: the smaller the p-value, the more significant the enrichment. Enrichment analysis of gene expression data obtained from hippocampi of patients with familial mesial temporal lobe epilepsy (MTLE) versus sporadic MTLE.
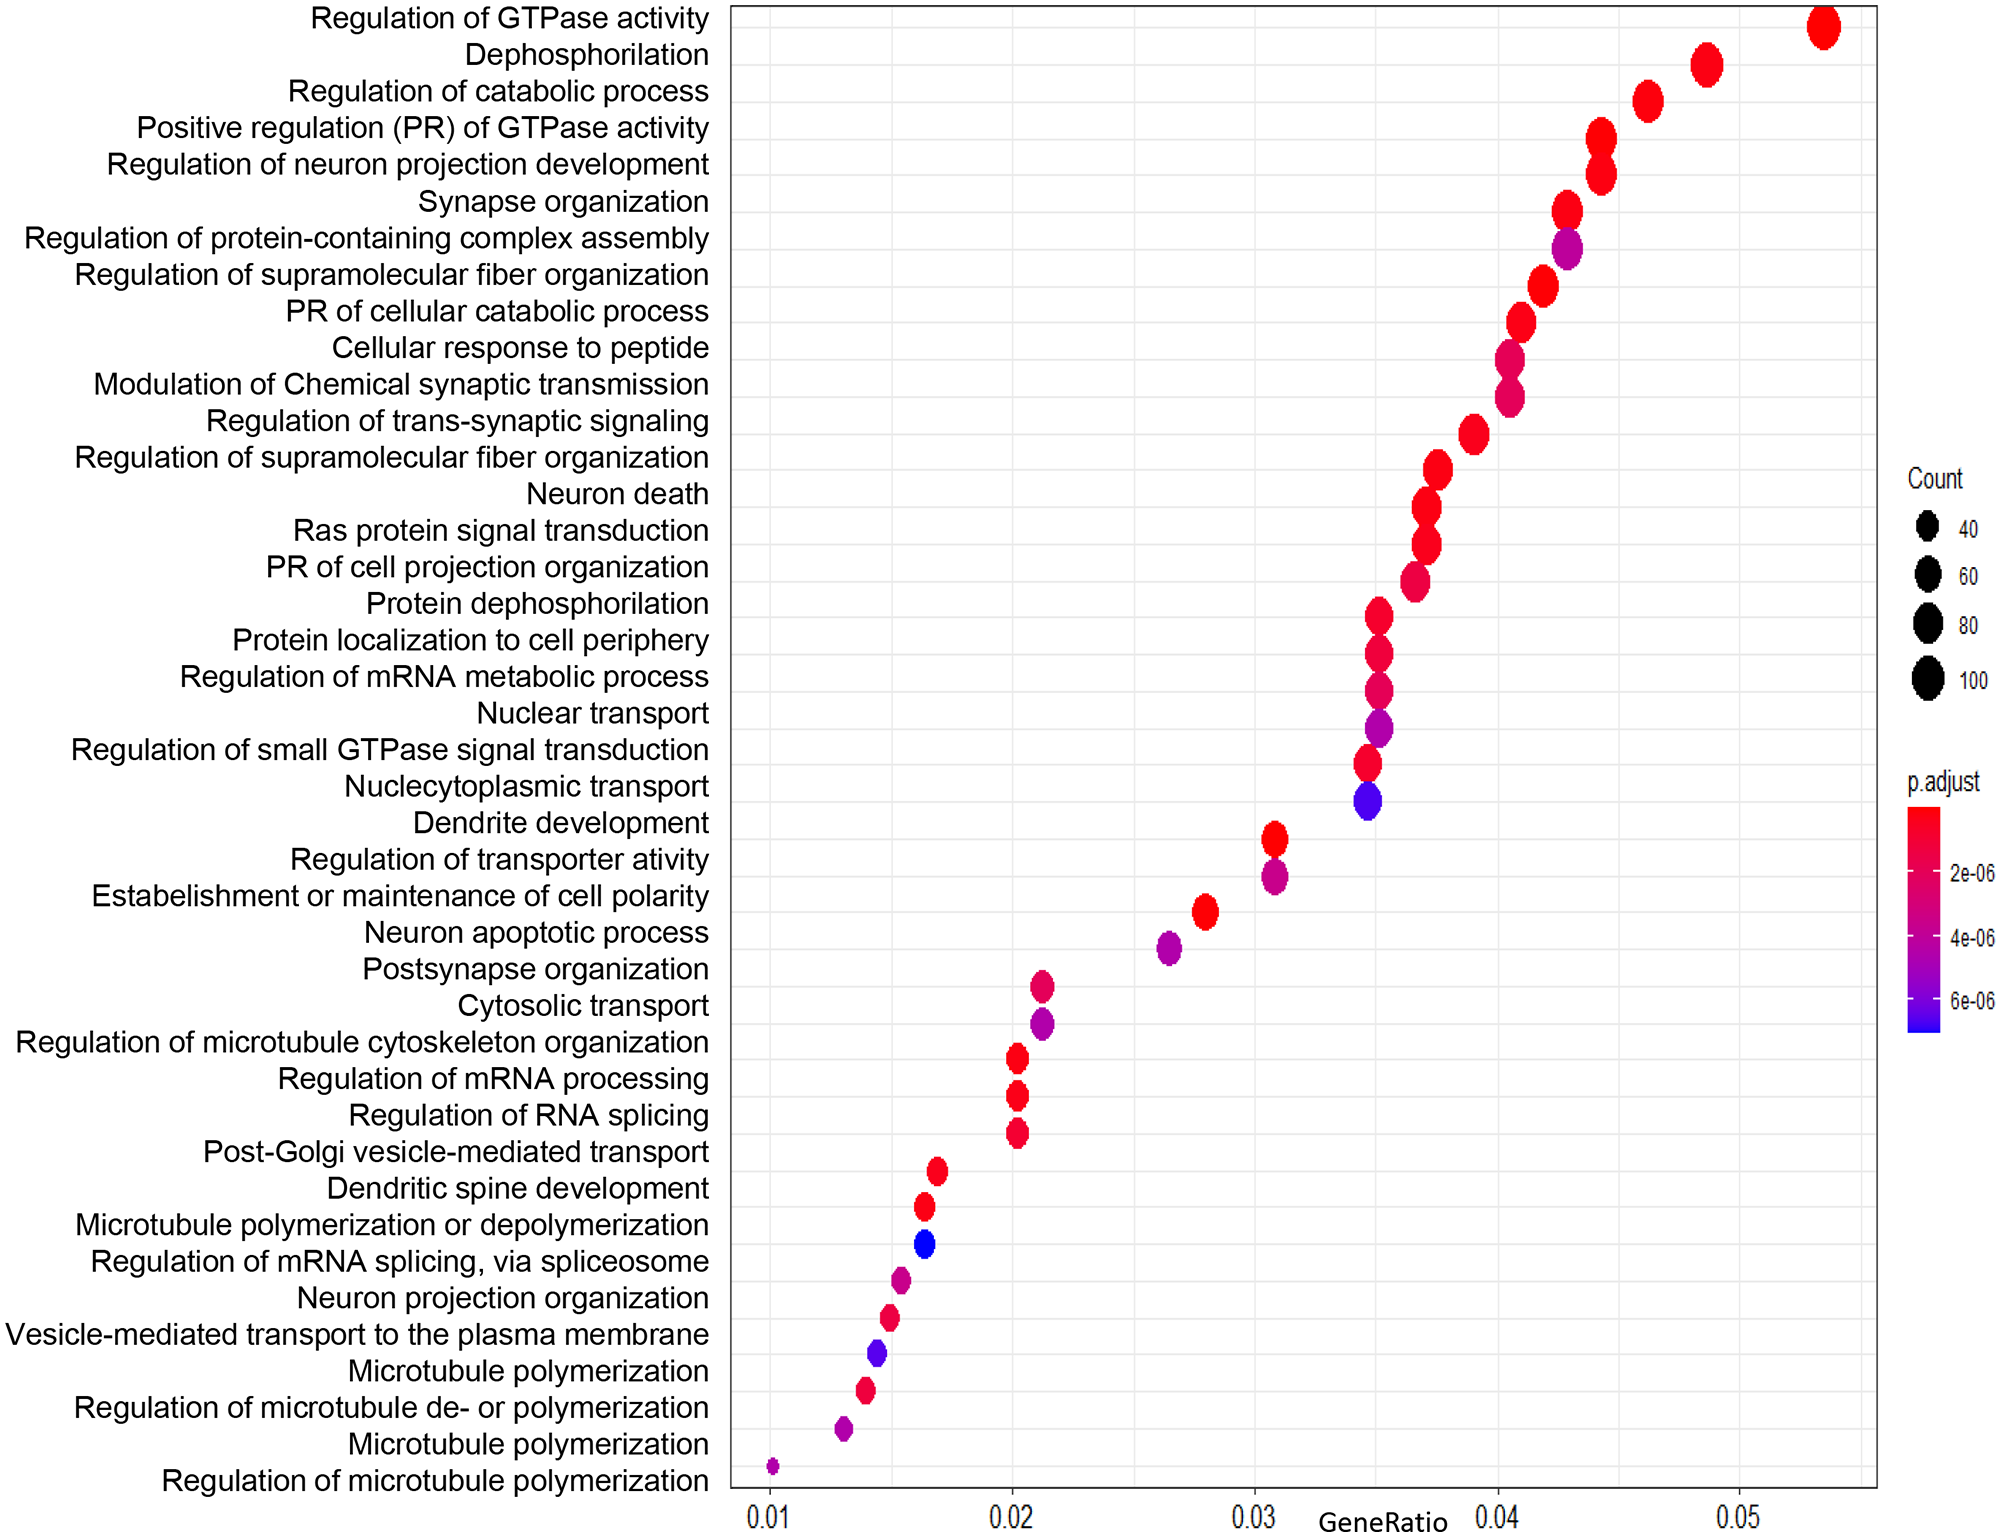
Graphic representation of the enrichment analysis for the group comparisons. The analysis was performed using the “clusterProfiler” package. The dot plot depicts the enriched Gene Ontology categories and the gene ratio. The dot size represents the enrichment score. The p-value depicts the significance of enrichment: the smaller the p-value, the more significant the enrichment. Enrichment analysis of gene expression data obtained from hippocampi of patients with familial MTLE versus control.
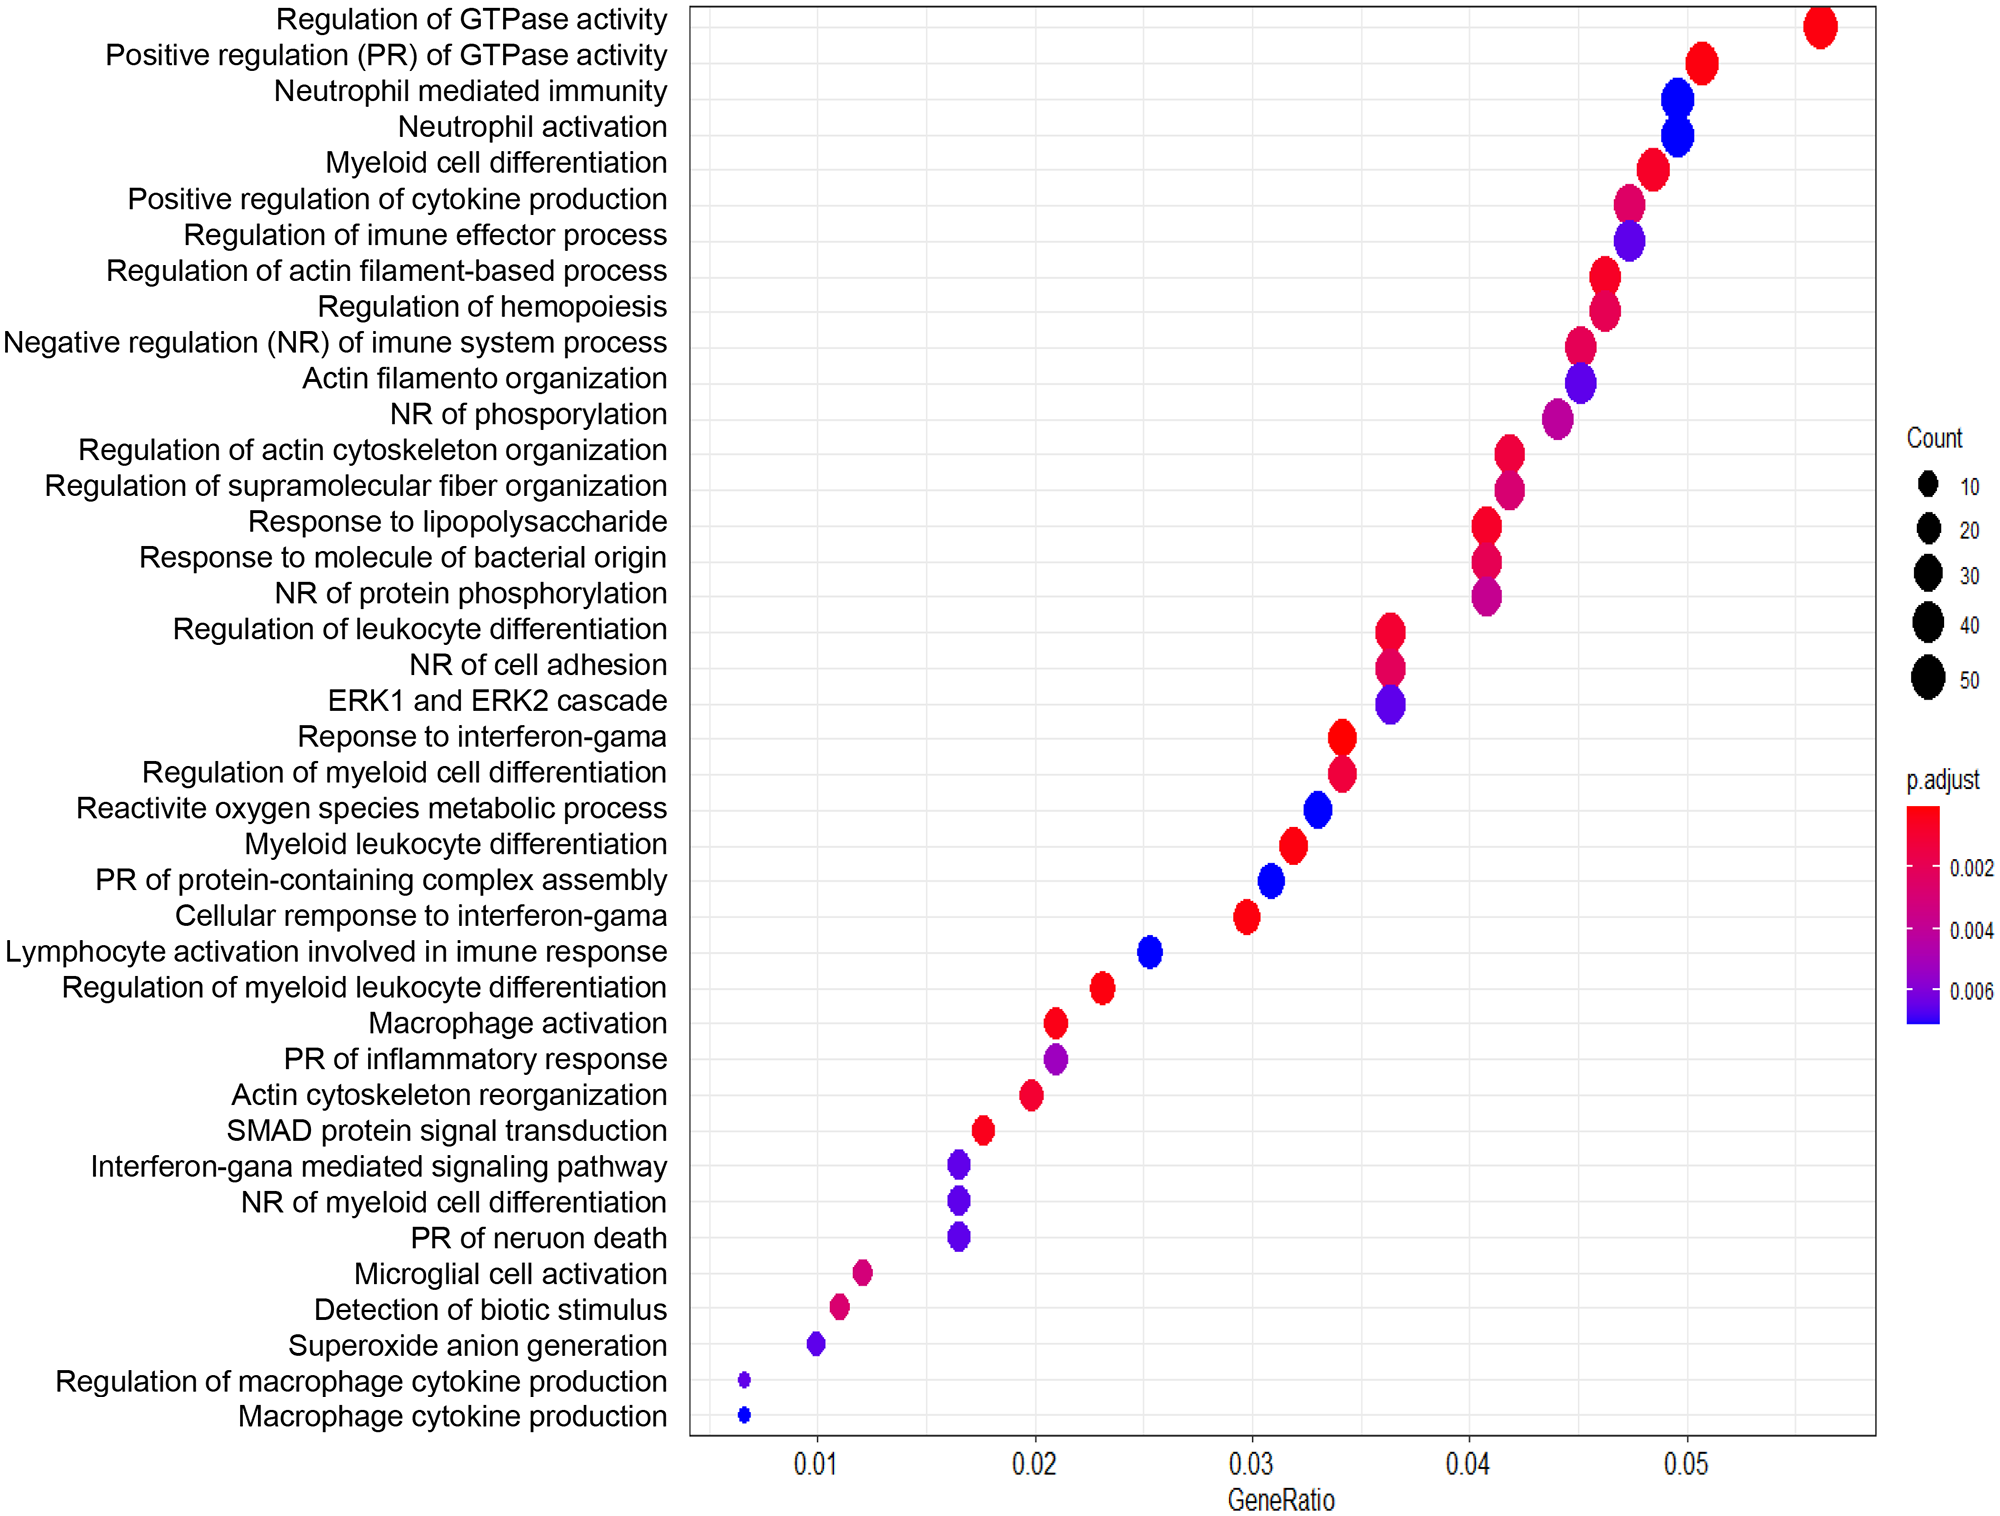
Graphic representation of the enrichment analysis for the group comparisons. The analysis was performed using the “clusterProfiler” package. The dot plot depicts the enriched Gene Ontology categories and the gene ratio. The dot size represents the enrichment score. The p-value depicts the significance of enrichment: the smaller the p-value, the more significant the enrichment. Enrichment analysis of gene expression data obtained from hippocampi of patients with sporadic MTLE versus control.
We also compared familial and sporadic MTLE and identified the differently modulated biological enrichment networks. This analysis makes it possible to visualize the terms being shared or unique to a specific comparison (familial MTLE versus control and sporadic MTLE versus control) and to understand how they relate to each other within the biological context. We performed this analysis separately for up- and downregulated genes. Among upregulated enriched terms in familial MTLE, we found the MAPK cascade, adaptive immune cell, and negative regulation of cell population proliferation. In sporadic MTLE, we found the response to wounding, myeloid leukocyte activation, and neutrophil degranulation (Figure 7). The top downregulated enriched terms were cell junction organization, regulation of cellular protein localization, signaling by receptor tyrosine kinases, and neuron death in familial MTLE, and RNA splicing, alternative mRNA splicing via the spliceosome, response to growth factor, and chromatin organization in sporadic MTLE (Figure 8).
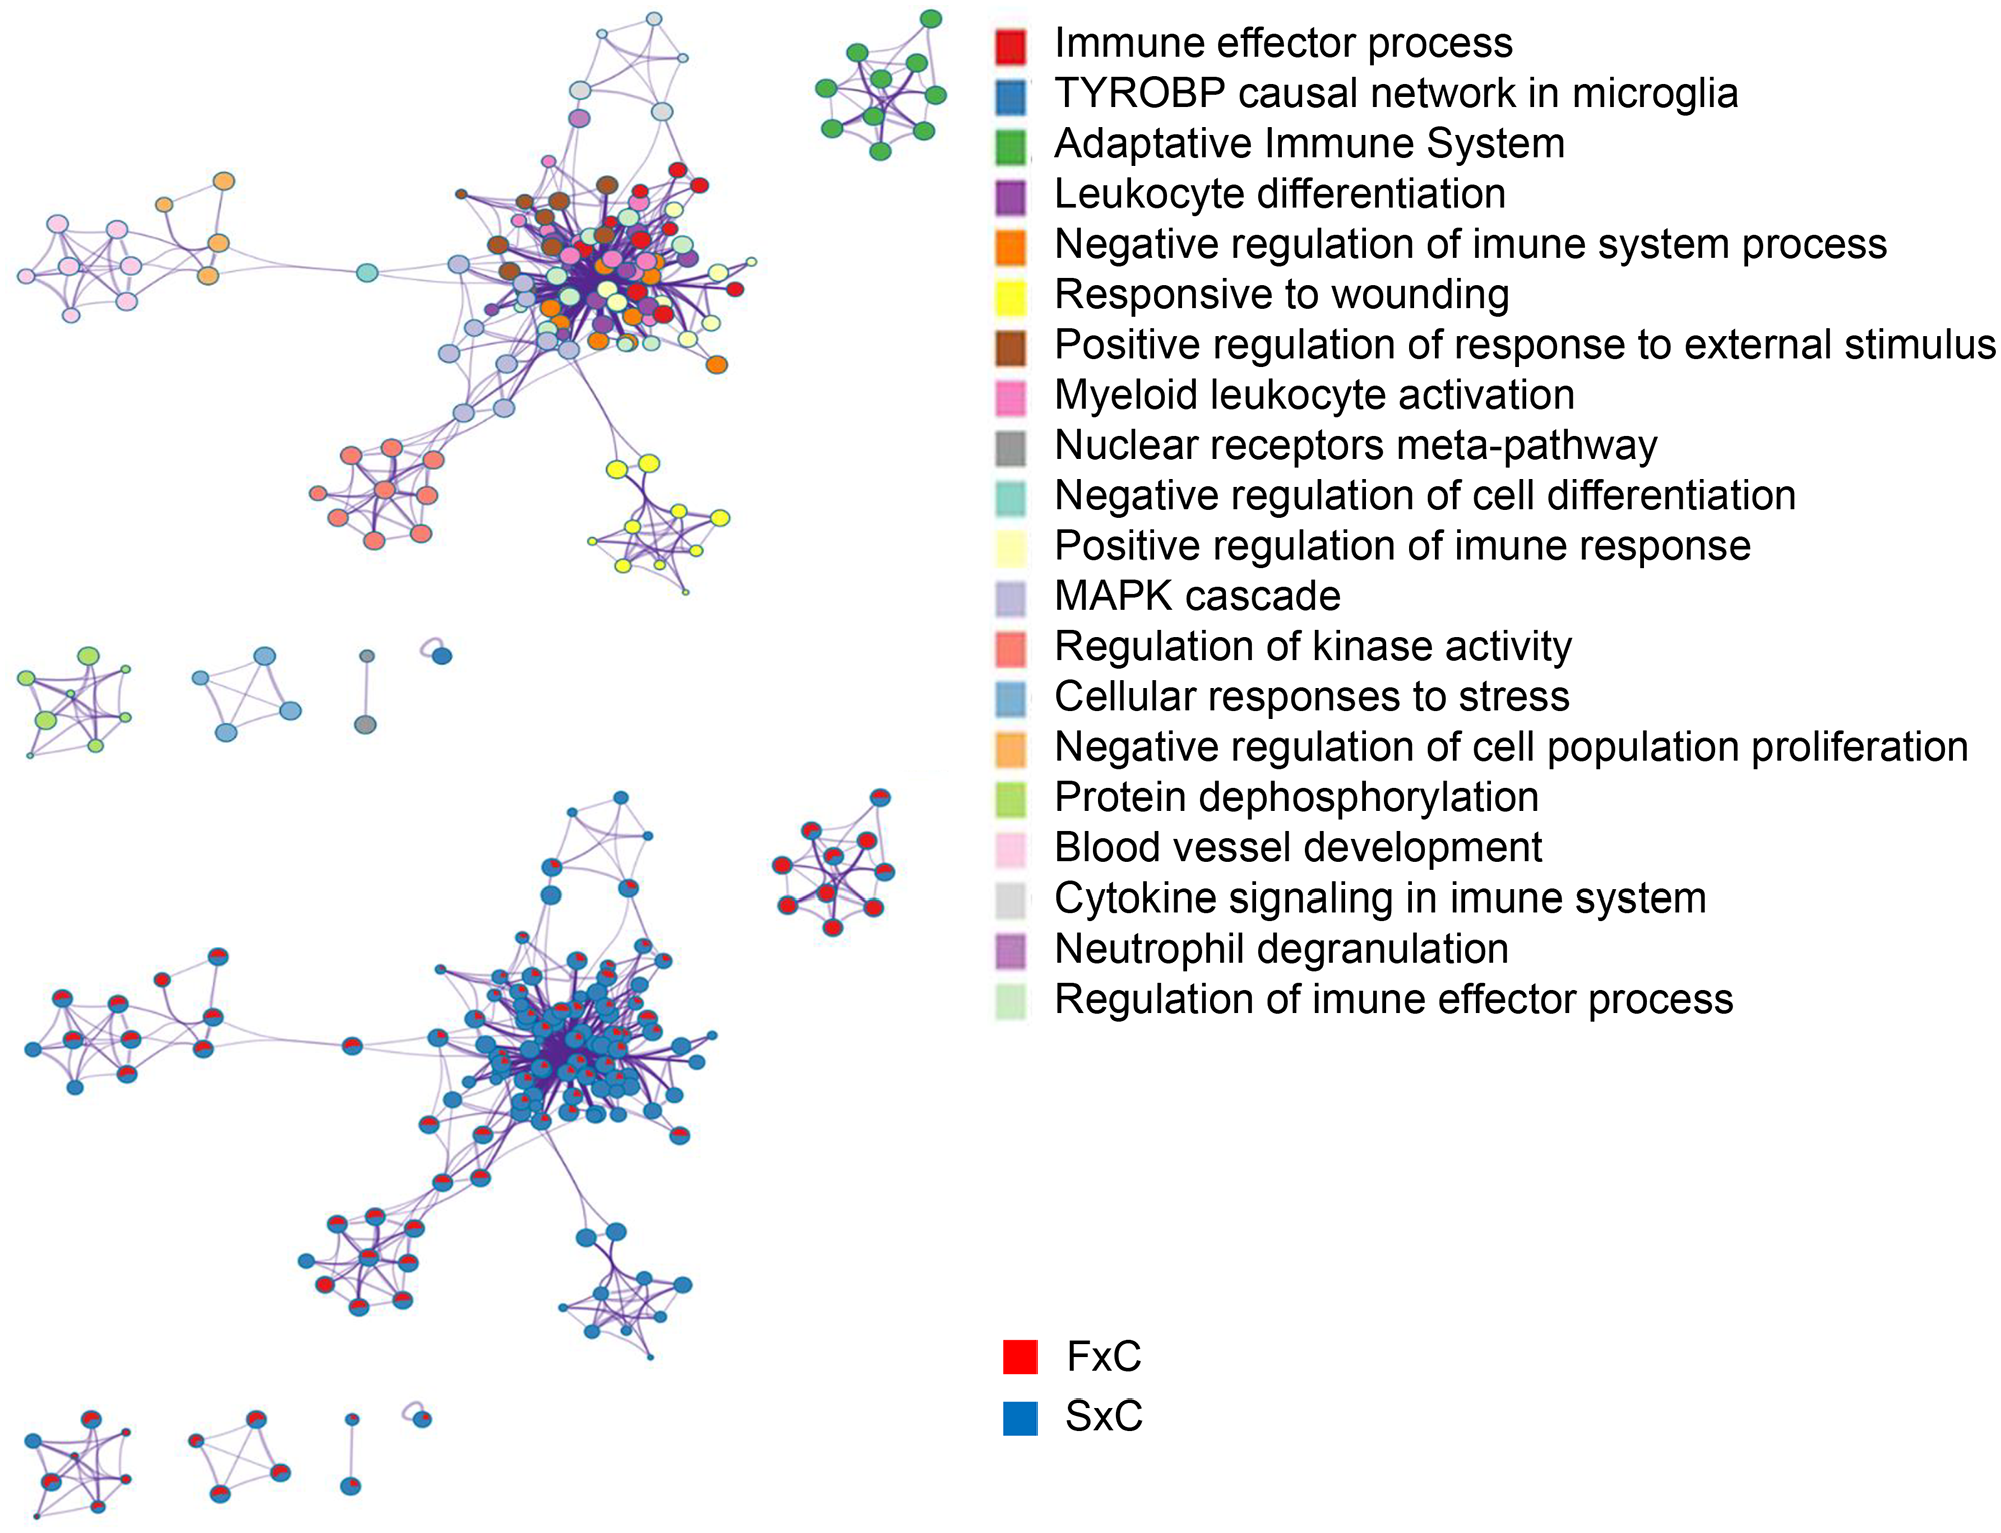
Graphic representation of the network of enriched terms. Different colors represent cluster ID, where nodes that share the same cluster ID are typically close to each other. The same enriched terms are also represented as pie charts, with pies color-coded based on the different comparisons: familial mesial temporal lobe epilepsy (MTLE) versus control (FxC, red) and sporadic MTLE versus control (SxC, blue). Network of upregulated genes. Figures were created using Metascape (http://metascape.org/).
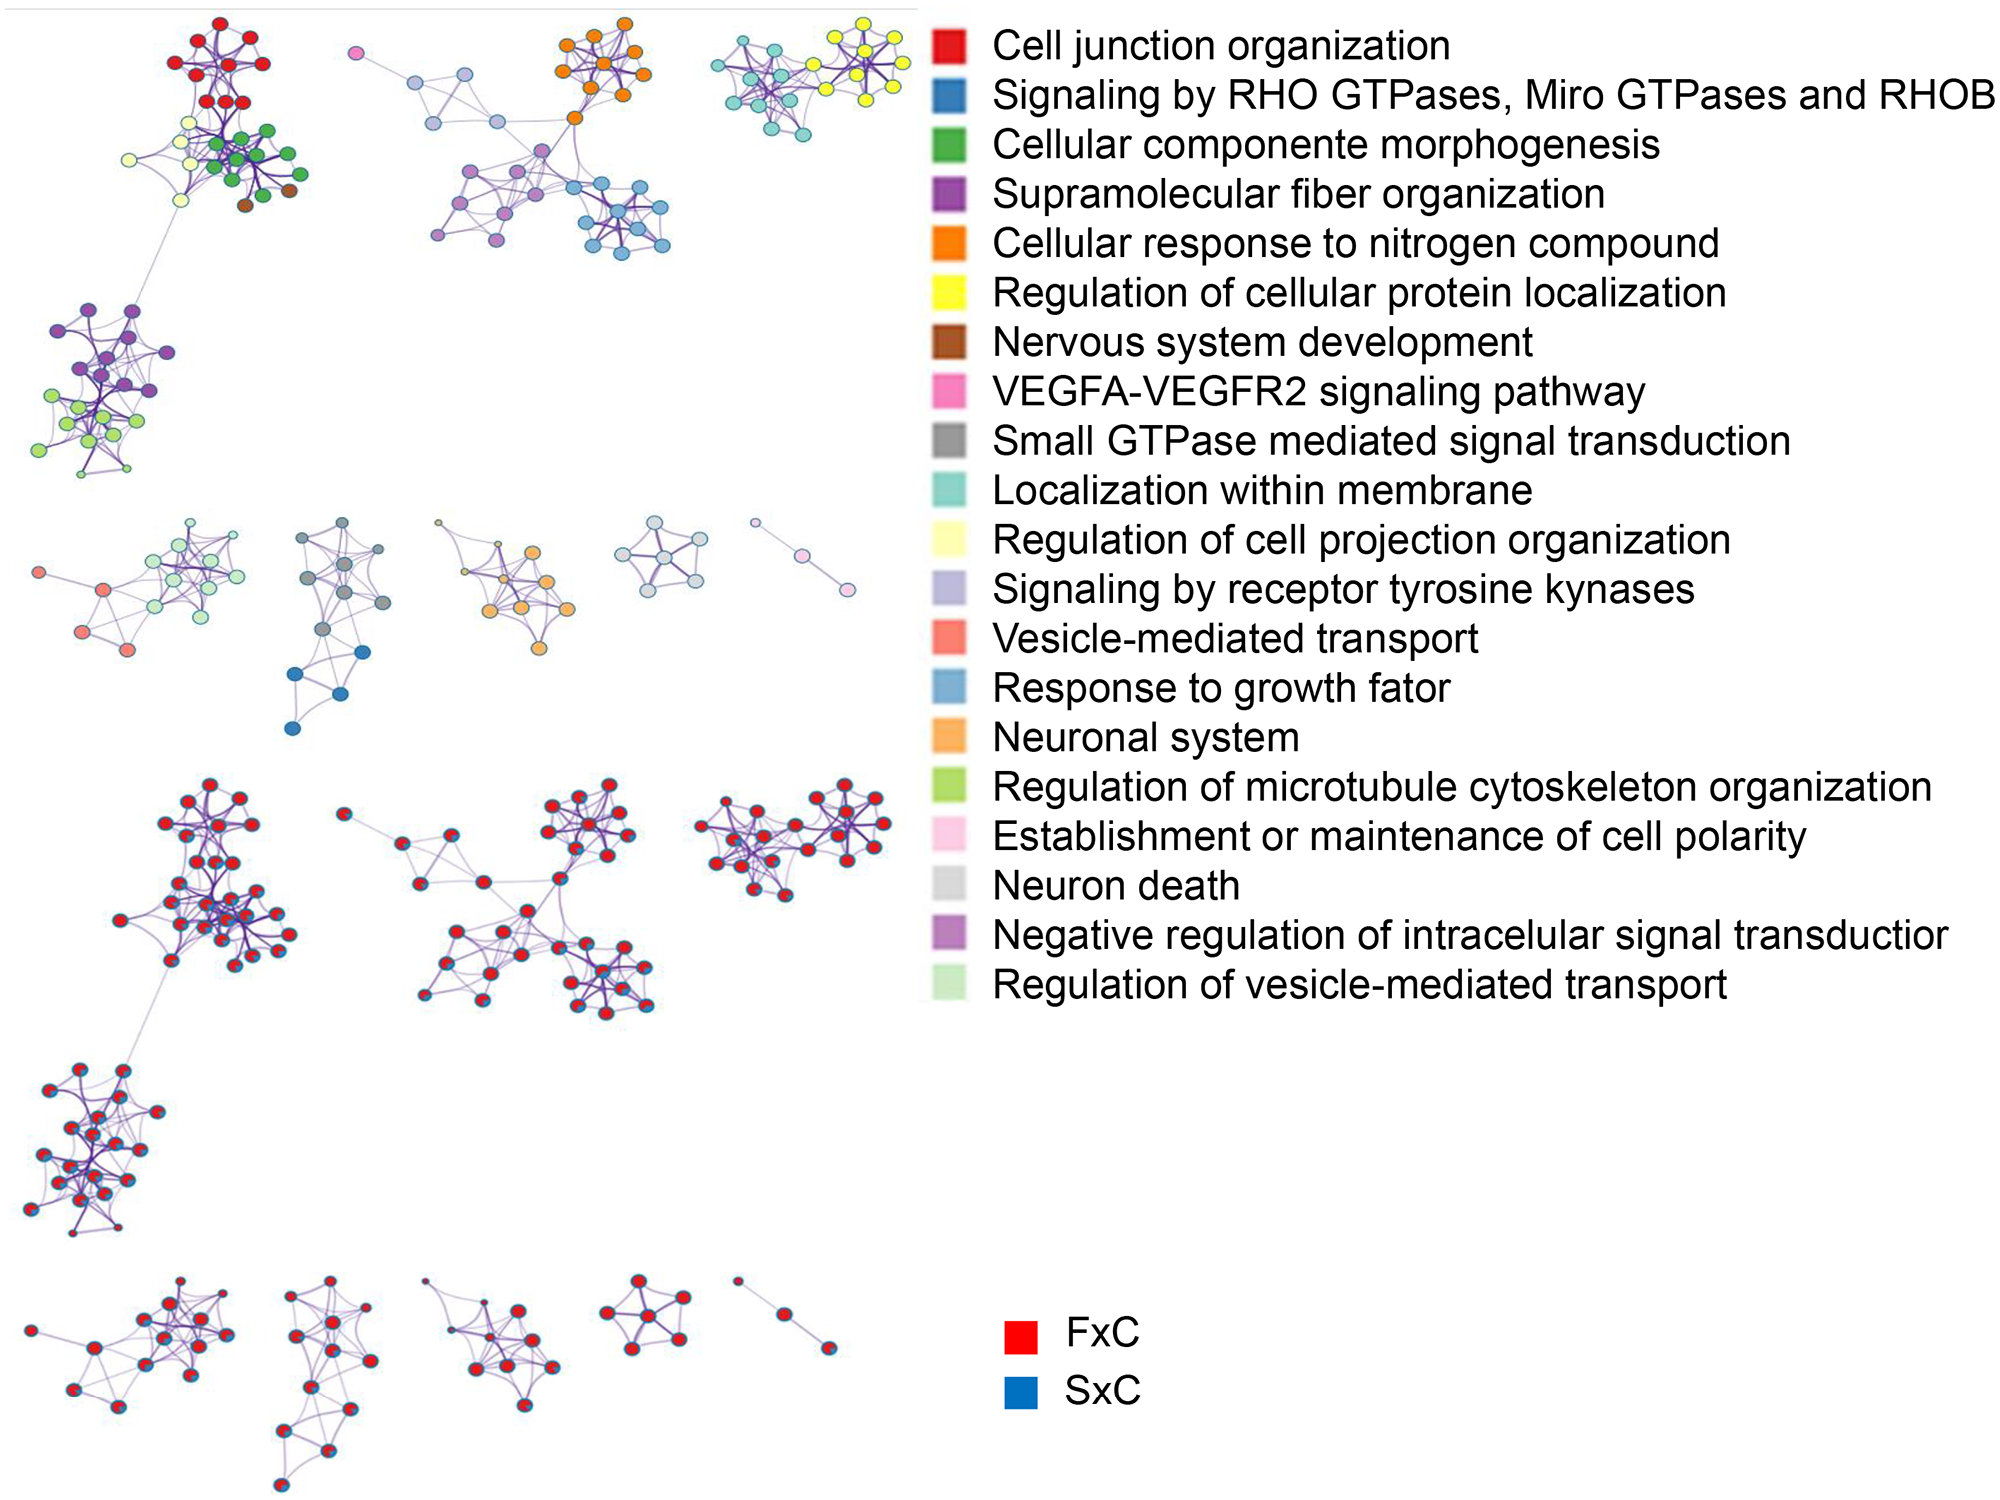
Graphic representation of the network of enriched terms. Different colors represent cluster ID, where nodes that share the same cluster ID are typically close to each other. The same enriched terms are also represented as pie charts, with pies color-coded based on the different comparisons: familial mesial temporal lobe epilepsy (MTLE) versus control (FxC, red) and sporadic MTLE versus control (SxC, blue). Network of downregulated genes. Figures were created using Metascape (http://metascape.org/).
Gene set enrichment analysis
We queried the list of differentially expressed microarray probes from familial and sporadic MTLE against a list of all curated gene sets available as part of the MSigDB database (https://www.gsea-msigdb.org/gsea/msigdb). We found significantly enriched gene sets involved in inflammatory cytokines and mediators and chemokine receptor pathways in both groups of patients (Figures 9 and 10). In addition, for the sporadic MTLE group, we identified enrichment of the epidermal growth factor (EGF) signaling pathway, prostaglandin synthesis and regulation, and the microglia pathogen phagocytosis pathway (Figure 10), which were not present in the familial MTLE group.
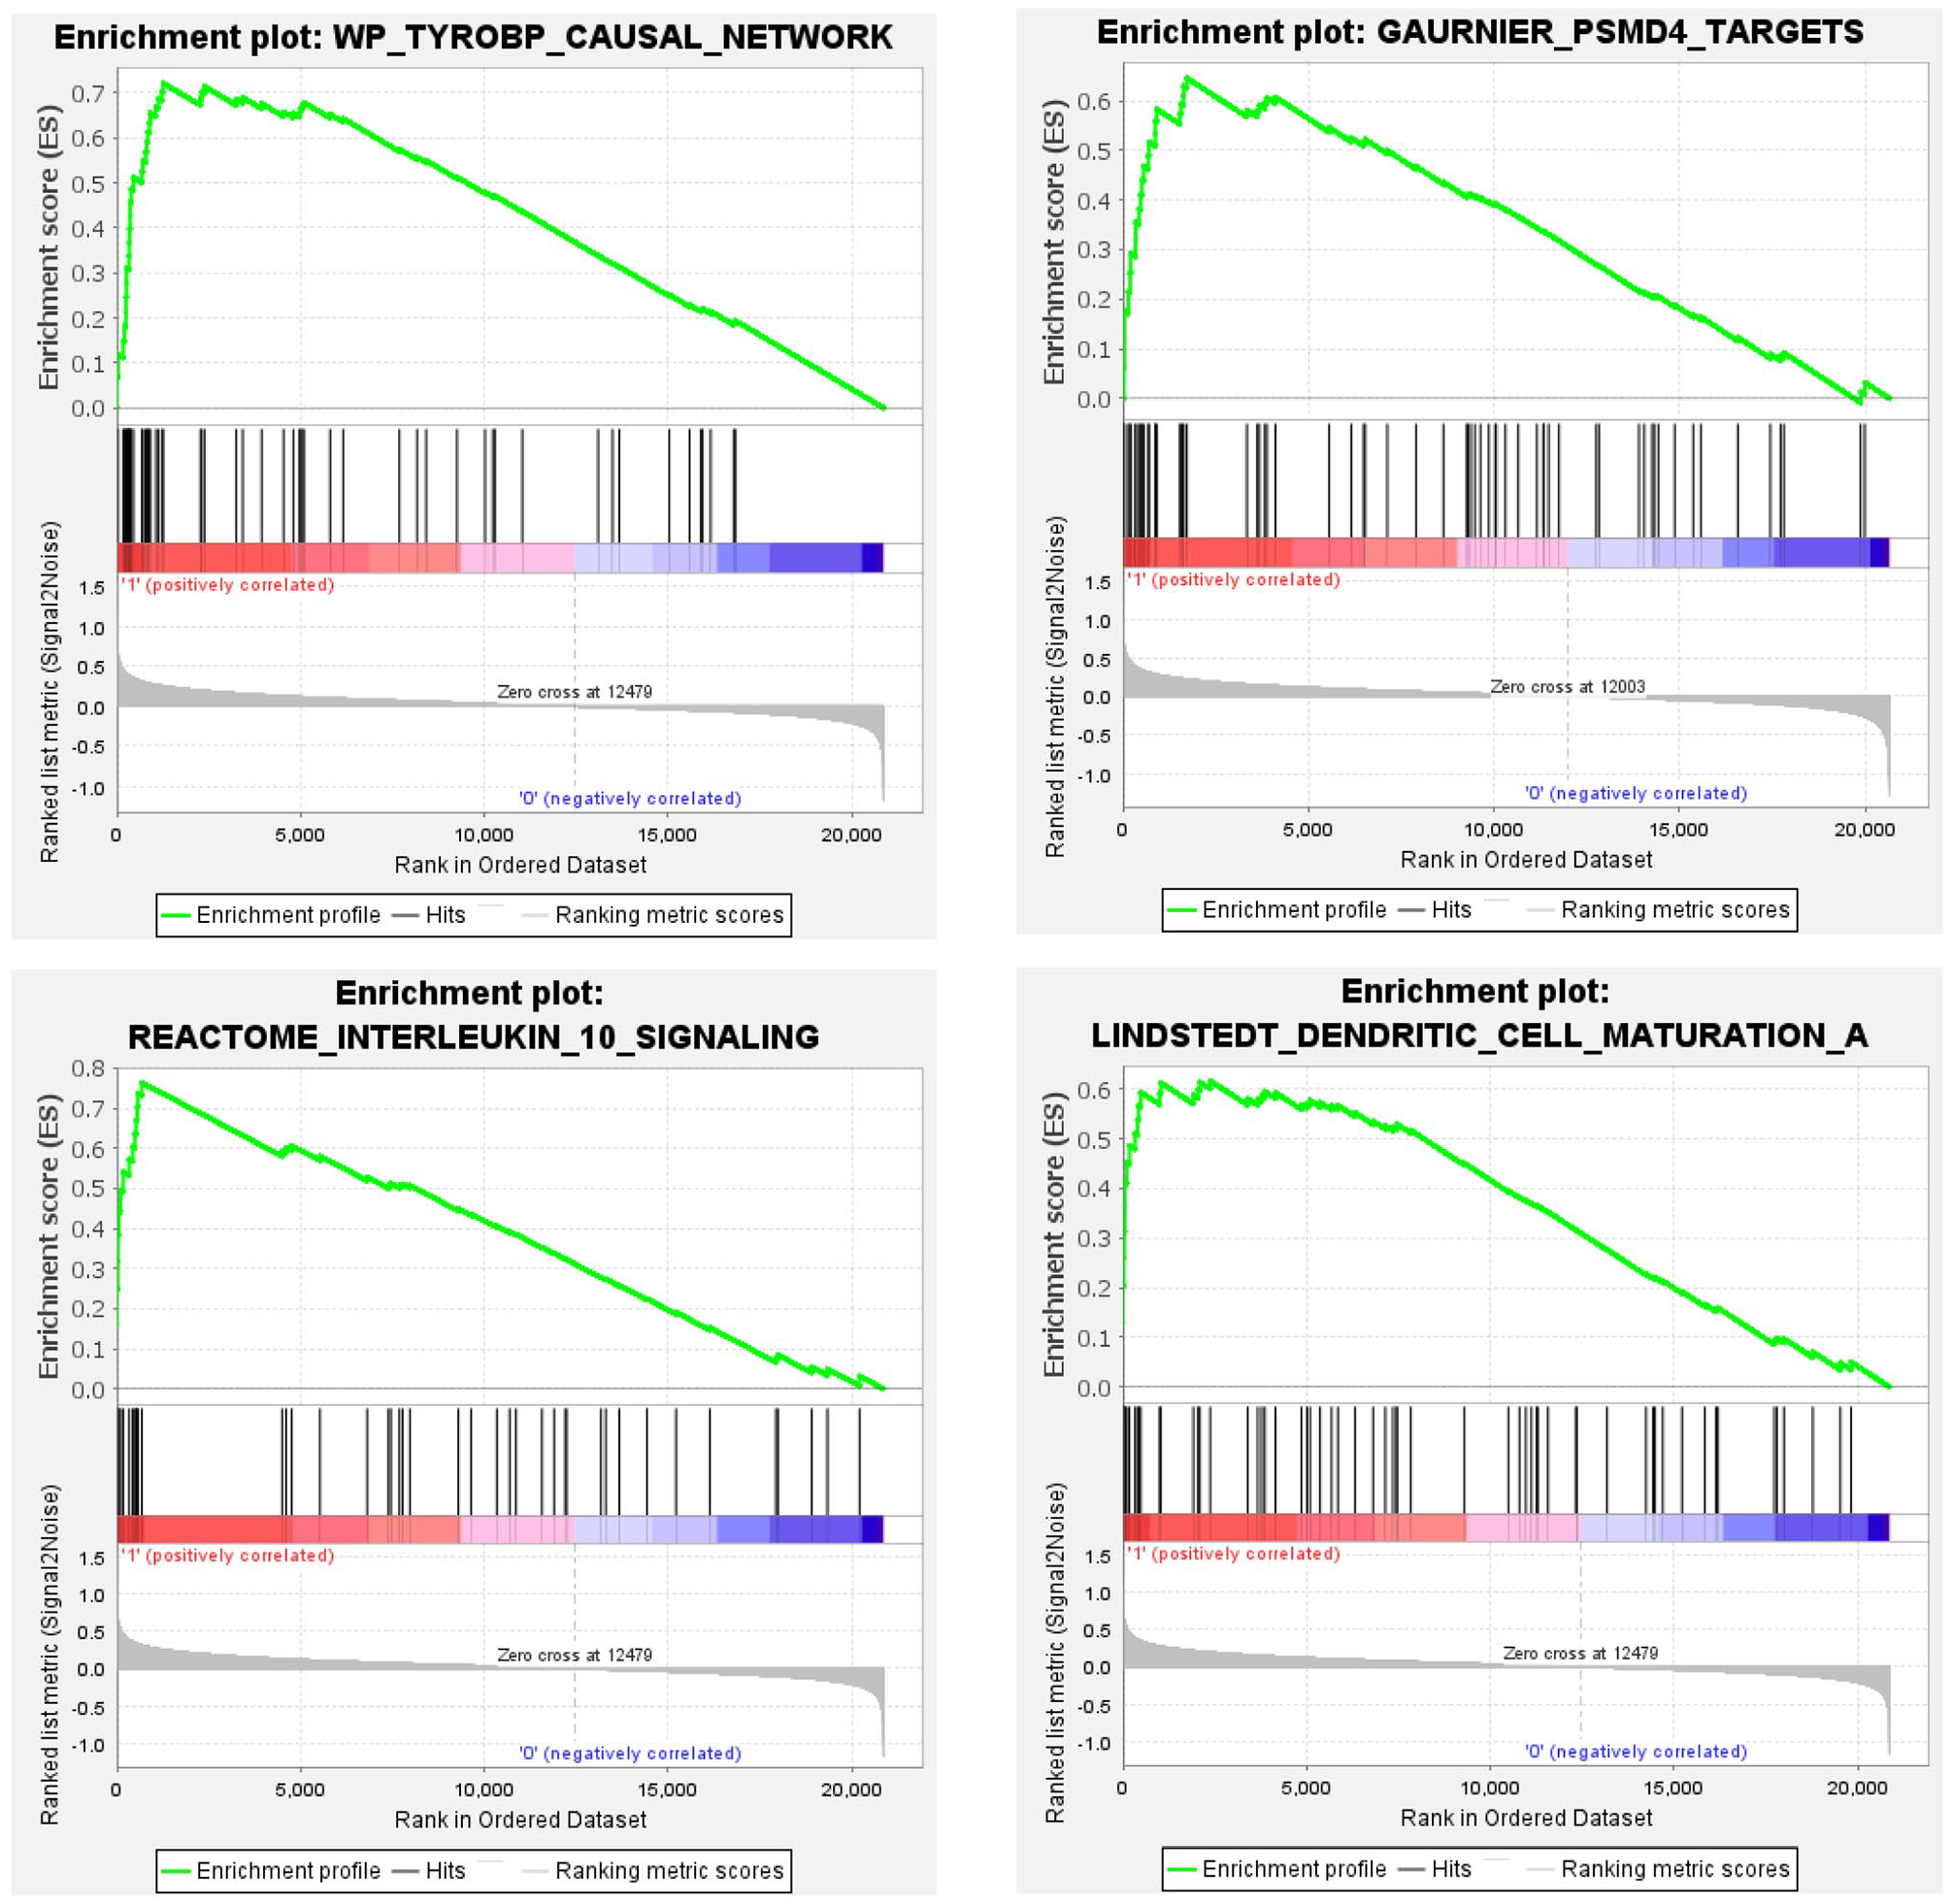
Graphic representation of gene set enrichment analysis performed in gene expression profiles from hippocampi of patients with mesial temporal lobe epilepsy (MTLE). Enriched gene set in the familial MTLE group. The analyses were performed using curated gene sets downloaded from the MSigDB database. p-value < 0.05, false discovery rate (FDR) q-value < 0.05, and familywise error rate (FWER) p-value < 0.05. (A color version of this figure is available in the online journal.)
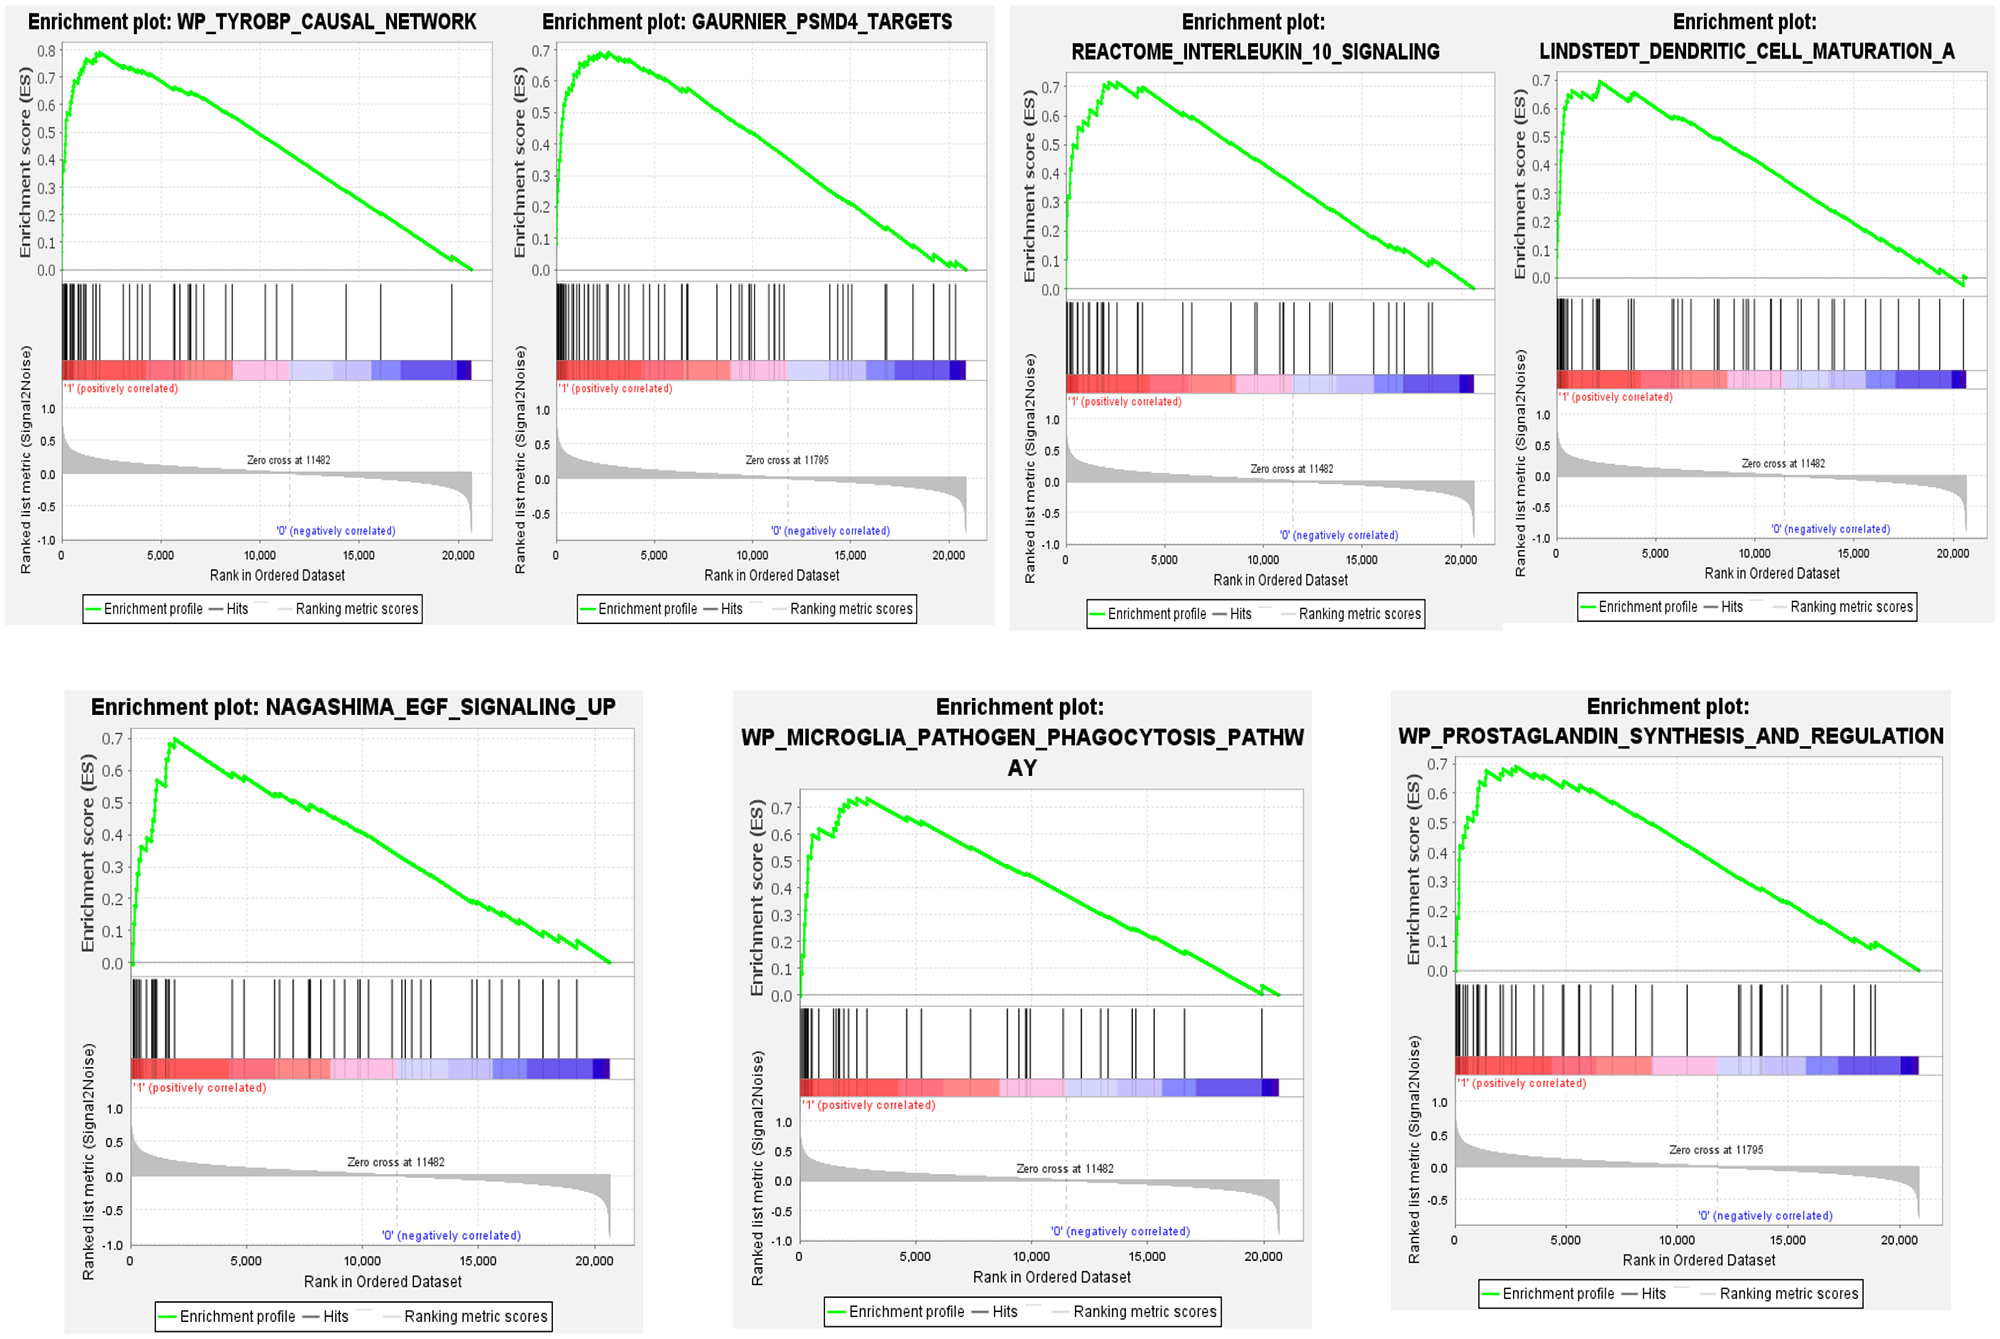
Graphic representation of gene set enrichment analysis performed in gene expression profiles from hippocampi of patients with mesial temporal lobe epilepsy (MTLE). Enriched gene set in the sporadic MTLE group. The analyses were performed using curated gene sets downloaded from the MSigDB database. p-value < 0.05, false discovery rate (FDR) q-value < 0.05, and familywise error rate (FWER) p-value < 0.05. (A color version of this figure is available in the online journal.)
Connectivity map analysis revealed new candidate compounds for epilepsy therapy
We used the C-MAP software (http://www.broadinstitute.org/cmap) to identify potential new therapeutic compounds to treat patients with MTLE based on the gene expression signatures. Interestingly, the analysis identified just one common molecule with a negative correlation for both the sporadic and familial MTLE groups, a GABA uptake inhibitor called nipecotic acid. However, for familial MTLE only, we identified a negative correlation with histamine H2 receptor antagonists, an inhibitor of protein kinase C delta (PKCδ), and an inhibitor of cyclin-dependent kinases (CDKs) (Figure 11(A)). Whereas, for sporadic MTLE only, we found negative correlations with an inhibitor of Rho-associated protein kinase (ROCK), an inhibitor of leukotriene biosynthesis, and an antioxidant compound (Figure 11(B)).
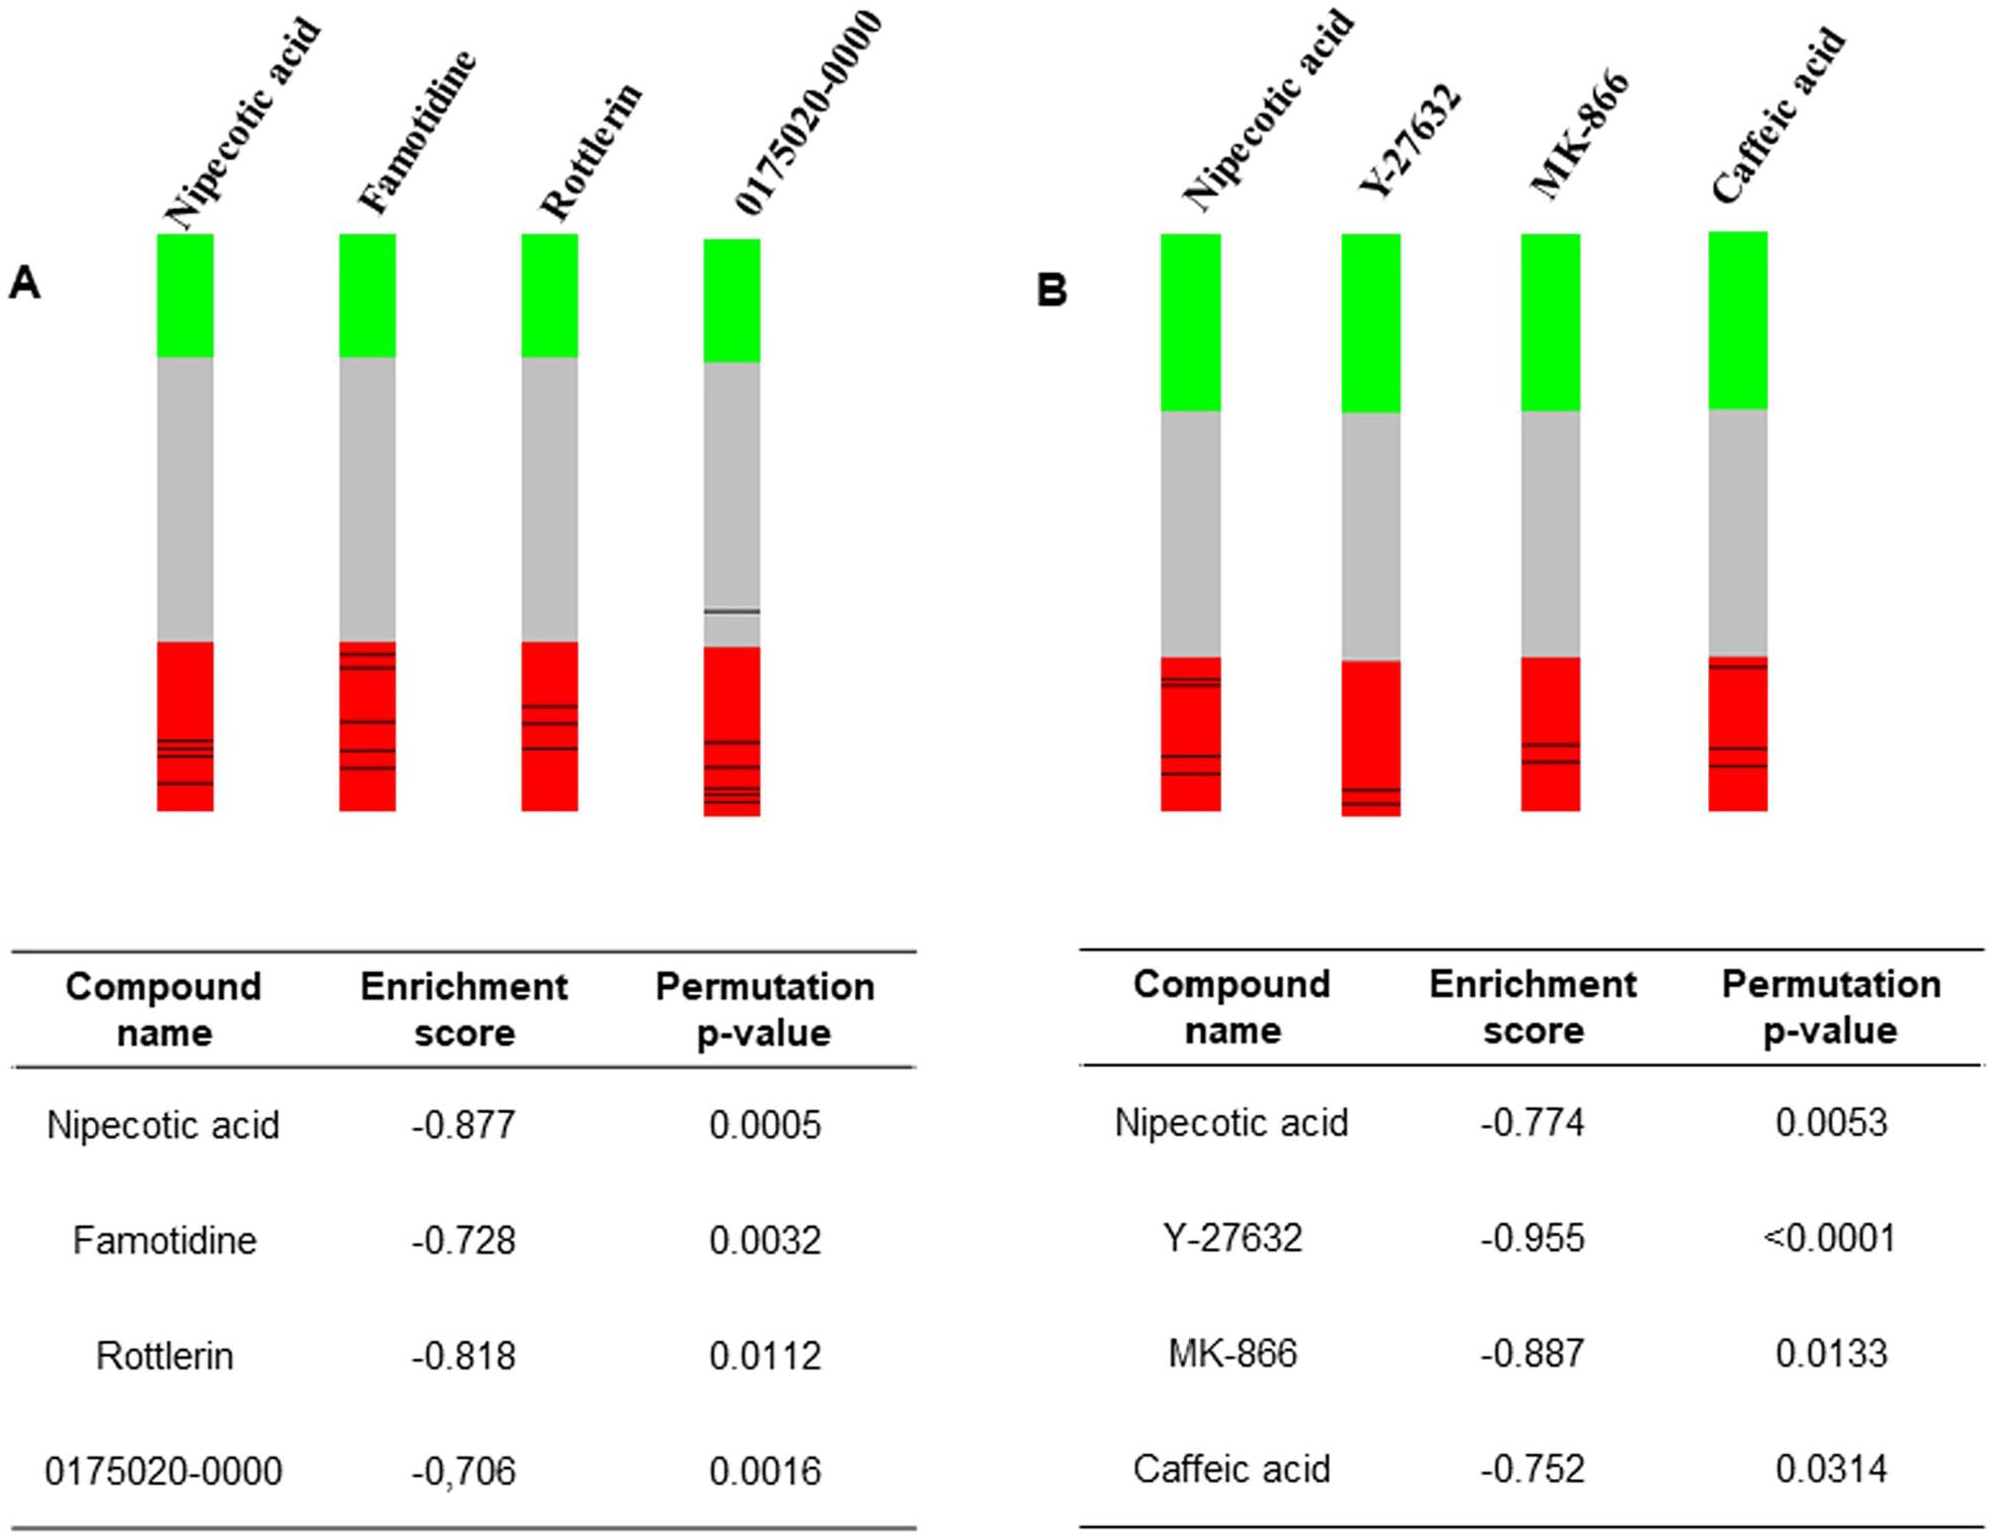
Graphic representation of connectivity map analysis performed on gene expression profiles from hippocampi of patients with mesial temporal lobe epilepsy (MTLE). The “barview” is constructed from ~7000 gene expression profiles representing ~1309 compounds, each indicating an individual treatment instance, ordered by their corresponding connectivity scores with signatures produced from (A) familial MTLE and (B) sporadic MTLE. The name of the compound, the connectivity enrichment score, and the permutation p-value are shown in the table and are colored as black bars in each “barview.” Colors applied to the remaining instances (i.e. gene expression profiles of the cells obtained with other compounds) reflect the sign of their scores (green: positive; gray: null; red: negative). (A color version of this figure is available in the online journal.)
Discussion
We have determined and compared gene expression profiles in surgically removed hippocampi of patients with familial and sporadic MTLE. We used these data to perform clustering analyses of functionally related genes based on GO categories. Furthermore, we sought and identified different potential compounds to treat patients with familial and sporadic MTLE.
We and others have compared the clinical and histopathological findings and response to epilepsy surgery in patients with familial and sporadic MTLE and have found no remarkable differences.7,44,45 However, a more detailed study using comparative MRI of gray and white matter atrophy showed less widespread voxel-based morphometric abnormalities and better intelligence quotient (IQ) performance in patients with familial MTLE than patients with sporadic MTLE. 38 Nonetheless, structural abnormalities outside the mesial portion of the temporal lobe were similar in both forms of MTLE. 44 These findings, combined with previous results,32,33 suggest that genetic factors may predispose some individuals to develop hippocampal abnormalities that may be further intensified by recurrent seizures; 30 however, to date, no studies addressing the molecular mechanisms possibly involved in familial MTLE have been performed, including gene expression analysis.
The investigation of gene expression has been extensively used to study the mechanisms underlying human neurological disorders, such as Alzheimer’s disease,65–68 other forms of dementia, 69 and tauopathies. 70 Especially in human oncology, gene expression signatures have been critical for identifying oncogenes and tumor suppressor genes involved in tumoral growth and progression, characterizing tumor subtypes, aiding in the development of new treatments, and establishing specific treatment protocols based on the gene expression signatures.71–75 Moreover, drug repositioning based on gene expression signatures has been proposed for several conditions, including inflammatory bowel disease, 76 several types of cancer,75,77,78 Alzheimer’s disease, 79 diabetes, 80 hyperlipidemia, and hypertension. 81
Based on the gene expression signature identified in familial MTLE, the main enriched GO processes were related to protein response, mRNA processing, synaptic plasticity, and function, namely proteasomal catabolic process, protein dephosphorylation, protein catabolic process, regulation of mRNA metabolic process, protein localization, protein polymerization, regulation of RNA splicing, synapse organization, modulation of chemical synapse transmission, regulation of trans-synaptic signaling, dendrite development, post synapse organization, dendritic spine development, regulation of microtube polymerization or depolymerization, and regulation of microtube polymerization (Figures 4 and 5). These changes suggest that proteostatic stress may be occurring, leading to inappropriate protein translation, transcription, folding, localization, and degradation.82,83 Interestingly, regulation of mRNA processing and protein translation are directly linked to cellular energy metabolism,84–86 which has been associated with epilepsy,87,88 and is also observed as one of the mechanisms linked to abnormally regulated genes in tissue from familial MTLE in the present study (Figures 4 to 6). However, there was a more prominent enrichment of biological pathways linked to the regulation of energy metabolism in samples from patients with sporadic MTLE, making it the mechanism predominantly involved in sporadic MTLE in the present study.
The enrichment of biological pathways in familial MTLE is mainly linked to the dendritic spine development process during synaptic reorganization. This process has been recognized as a mechanism responsible for increased hippocampal excitability in epilepsy. 89 It is well known that in HS, the mossy fibers and granule cell axons undergo reorganization, also known as sprouting, to create new synaptic terminals in the inner molecular layer of the hippocampus. 90 This result is closely linked with a GO category that appears overrepresented in samples from familial MTLE: regulation of GTPase activity. Small GTPases assemble proteins and molecular networks to control multiple cellular functions. For example, Ras homology (Rho) GTPases interact with a broad range of kinases and effectors, regulating cell polarity, proliferation, migration, adhesion, and cytoskeletal dynamics. 91 RAC1 is a member of the Rac subfamily of GTPases and is responsible for promoting the formation of a veil of branched actin filaments leading to membrane ruffling. 92 Interestingly, we found that RAC1 was downregulated in familial MTLE. Furthermore, RhoA is the main member of the RhoA GTPase subfamily that controls intermediate filaments, the cortical actin cytoskeleton, myosin filaments, and microtubules to regulate immune cell migration and activation through its effectors DIAPH1, ROCK1, and ROCK2. 93 RHOA was also downregulated in familial MTLE.
Although we found that small GTPases were also enriched in sporadic MTLE, they might have a different signaling cascade related to the regulation of actin cytoskeleton organization, regulation of actin filament-based process, and actin cytoskeleton reorganization (Figure 6). In vitro studies using cells expressing mutant CDC42, a member of the GTPase Cdc42 subfamily, showed that these cells have a reduced actin filament content, a lack of filopodia, and shape alterations, all of which are consistent with impaired binding of CDC42 to ARHGDIA (also known as RhoGDI1). 93 ARHGDIA was significantly downregulated in familial MTLE and upregulated in sporadic MTLE. A previous histopathological study 45 of tissue samples from patients with familial MTLE demonstrated that although sprouting is present in these tissues, it is less pronounced in familial MTLE, indicating that this group of patients may respond differently to plastic changes induced by cellular loss in epilepsy. 45
For sporadic MTLE, the gene expression profile suggests that an inflammatory response (e.g. neutrophil-mediated immunity, positive regulation of cytokine production, regulation of immune effector process, negative regulation of immune system process, among others) is highly triggered in patients who do not have a family history of MTLE (Figure 6). We identified that HLA-DQA1, HLA-DRB4, and HLA-DPA1 were upregulated in both forms of MTLE compared with controls, and HLA-DQB1 and HLA-DRA were upregulated only in sporadic MTLE. In addition, HLA-B and HLA-E were downregulated in patients with familial MTLE compared with patients with sporadic MTLE and controls, respectively. Moreover, we found IL18 (interleukin 18), IL1B (interleukin 1 beta), CCL3 (chemokine (C-C motif) ligand 3), C3AR1 (complement component 3a receptor 1), TLR4 (Toll-like receptor 4), and PTGS2 were also upregulated in patients with sporadic MTLE compared with controls. This is consistent with the identified GO processes, the adaptative immune system, immune response, and inflammation process. One of the first studies evaluating HLA association with MTLE was conducted by Özkara et al. 94 They observed a high frequency of HLA-DQ2, HLA-DR4, and HLA-DR7 in patients with MTLE. They hypothesized that patients with these specific class II antigens, together with an early childhood event, might trigger the development of HS and MTLE. 94 Subsequently, another study found that the HLA-DRB1*13 alleles were more frequent in the MTLE-HS population, corroborating the role of HLA in the pathophysiology of MTLE-HS. 95 In 2006, Jamali et al. 15 described that the CC3 (complement component 3) gene, a major component of the immune complement system, was upregulated in surgical samples of the entorhinal cortex. Another study used immunohistochemistry to evaluate the gene expression of inflammatory mediators and their respective proteins in the hippocampus of patients with MTLE. They found that high TLR4 expression correlated to the seizure frequency (seizures per month) and TLR4 protein expressed in neurons and astrocytes. 90 Also, ATF-3 expression, detected only in neurons, was inversely correlated with seizure frequency, and that low IL-8 expression in neurons was associated with high seizure frequency. 96 However, IL-8 protein was also expressed in microglia and reactive astrocytes. 96 Similarly, a study found the presence of HLA-DR + microglia and TLR4 and IL-1β overexpression in the hippocampus and anterior temporal cortex of patients with MTLE-HS. 97 Therefore, even though the inflammatory response is an important and frequent finding in epilepsy, it occurs by activating distinct molecular pathways in familial MTLE compared with sporadic MTLE.
The enriched gene sets in both MTLE groups are involved with inflammatory cytokines and chemokine receptors (Figures 9 and 10). Epilepsy is not an inflammatory disease; however, there is abundant evidence that the inflammatory response increases in patients or animal models of epilepsy.98,99 Neuroinflammation is caused by the synthesis and release of molecules such as chemokines, reactive oxygen species, cytokines, and secondary messengers. 100 Moreover, as seen in epilepsy and neurodegenerative diseases, brain damage leads to various biological processes that characterize neuroinflammation. When this inflammatory process is unregulated, it forms aberrant neural connections and hyperexcitability. 101 In addition, the TYROBP signaling adaptor appeared in gene set and functional enrichment analyses (Figures 7, 9 and 10). TYROBP is a transmembrane receptor that interacts with TREM2, which is present in dendritic cells, macrophages, and microglia, triggering the activation of the immune response. 102 Recent studies have reported that Trem2 was downregulated in the hippocampus of animal models of epilepsy. Trem2 overexpression could inhibit neuronal apoptosis and alleviate hippocampal neuronal damage in acute seizures and decrease oxidative stress activating the phosphoinositide 3-kinase (PI3 K)/AKT pathway.103,104
Although no enriched gene sets were restricted to the familial MTLE group (Figure 9), we identified the EGF signaling pathway, which promotes cell survival, growth, and differentiation, only in the sporadic MTLE group (Figure 10). Some of the downstream signaling pathways activated by the EGF pathway are mitogen-activated protein kinase (MAPK), AKT, RAS, and c-Jun N-terminal kinase (JNK). 105 The PI3 K/AKT pathway mediates neuronal survival during nervous system development 106 and has been reported to be deregulated in hippocampal samples taken from patients with MTLE-HS.107–109 In addition, gene set enrichment analysis revealed prostaglandin synthesis and regulation. Prostaglandins are produced from arachnoid acid by cyclooxygenase 2 (COX-2); they promote an inflammatory signaling cascade and may play a role in epilepsy.110,111
Our C-MAP analysis identified just one common molecule with a negative correlation in both lists of differentially expressed genes: a GABA uptake inhibitor called nipecotic acid (Figure 11(A) and (B)). Due to its hydrophilic properties, isolated nipecotic acid cannot cross the blood-brain barrier (BBB). 112 However, the antiseizure medication tiagabine ((R)-N-(4, 4-di-(3-methyl-2-yl) but-3-enyl) nipecotic acid) is a derivative of nipecotic acid; it is used to control focal seizures by inhibiting synaptic GABA transporters. 113 In addition, some studies have demonstrated that combining tiagabine with compounds that affect other aspects of the GABAergic system provides a synergic antiseizure effect.114–118
The C-MAP analysis of the patients with familial MTLE also demonstrated a negative correlation with famotidine, rottlerin, and 0175029-0000 (a CDK inhibitor) (Figure 11(A)). Famotidine is a histamine H2 receptor antagonist, and H2 receptors are localized in postsynaptic neurons. 119 The acute and prolonged administration of this compound alongside conventional antiseizure medications has been studied in epileptic mice. 120 Famotidine increased the antiseizure effect of valproic acid and diphenylhydantoin after 1 day and 7 days of the administration, respectively. 120 However, famotidine has also been reported to induce seizures, neuropsychiatric symptoms, and other H2-antagonist-related side effects. 121 Conversely, the histamine H3 receptor is an autoreceptor in presynaptic neurons that regulates the synthesis and release of neuronal histamine, and there has been growing interest in using antagonists to this receptor as new antiseizure drugs.122–126 Rottlerin is an inhibitor of PKCδ. 127 It decreases the activity of cytosolic phospholipase enzyme A2 (cPLA2), which plays an important role in modulating the metabolic activity of polyunsaturated fatty acids that release free fatty acids, which, in turn, participate in the neuroinflammatory response after an injury.128,129 Moreover, PLA2 inhibitors prevented neurodegeneration in some neurodegenerative diseases. 130 Compound 0175029–0000 has been characterized as a CDK inhibitor by a gene-set-based local hierarchical clustering developed to identify therapeutic properties and targets previously unknown in C-MAP. 131 CDKs regulate sequential activation of the cycle cellular progression into phases. In addition, the kinase activity is also controlled by their interactions with CDK inhibitors. 132 A study with (R)-roscovitine, a CDK inhibitor, demonstrated an increase in the tonic GABA inhibition in the rat hippocampus, suppressing spontaneous spiking activity of pyramidal cells. 133 Another study showed that valproic acid administration in mice enhanced the gene and protein expression of the CDK inhibitor p21. Moreover, altered DNA methylation patterns at the distal CpG island in the p21 gene have been described, supporting the neuroprotective effect of valproic acid. 134
The C-MAP analysis of the samples from patients with sporadic MTLE showed a negative correlation with Y-27632 (a ROCK inhibitor), MK-886 (an inhibitor of 5-lipoxygenase-activating protein (FLAP) and leukotriene biosynthesis), and caffeic acid (a histone demethylase inhibitor) (Figure 11(B)). Y-27632 is a ROCK1 inhibitor and has been studied as an antiseizure medication in animal models of epilepsy. 135 A study demonstrated that two Rho-kinase inhibitors, including Y-27632, decreased the onset of myoclonic jerks and tonic and clonic convulsions stimulated with pentylenetetrazole (PTZ) in mice and reduced tonic hindlimb extension and the recovery latency for righting reflex in mice induced by maximal electroconvulsive shock. 135 In mice pretreated with Y-22763 and then treated with kainic acid (KA) to induce seizures, there was protection against neurodegeneration and neurite dystrophy. Furthermore, in vitro analysis demonstrated that Y-27632 preserved neurite formation and neurons during glutamate-induced excitotoxicity. 136 However, in another study that evaluated this compound in pilocarpine-treated rats, the authors demonstrated that chronic administration of Y-27632 increases neuronal death in the CA3 subfield and ectopic recurrent mossy fiber sprouting in the dentate gyrus. 137 MK-886 is an inhibitor of FLAP and leukotriene biosynthesis. 138 FLAP and cPLA2 participate in inflammatory signaling and the formation of cysteinyl leukotrienes (CysLTs). 139 CysLT receptor antagonists decreased PTZ-induced seizures and prevented BBB disruption.140–142 Moreover, patients with medically refractory focal seizures treated with pranlukast (a CysLTR1 antagonist) as an adjuvant therapy showed diminished seizure frequency and reduced pro-inflammatory cytokines in cerebrospinal fluid after 24 weeks of treatment. 143 Caffeic acid phenethyl ester is an antioxidant compound extracted from propolis.144,145 Studies have demonstrated a neuroprotective effect, improving oxidative stress parameters and preventing neuronal death in animal models of epilepsy.146–149
Gene expression signatures have been used successfully to develop Food and Drug Administration (FDA)-approved drugs, mainly in oncology, through the inhibition of oncogene overexpression in tumor tissues. For example, trastuzumab is a monoclonal antibody that blocks the ERBB2 proto-oncogene and is used for breast cancer combined with other medications. In addition, Gefitinib inhibits the EGF receptor and is used for non-small-cell lung cancer (NSCLC) treatment. Finally, imatinib is an inhibitor of ABL tyrosine kinase for chronic myeloid leukemia and gastrointestinal stromal tumors.150,151 Considering that many patients with MTLE do not benefit from the current available antiseizure medication, identifying molecular profiles that lead to safe and optimized treatment may lead to the clinical implementation of precision medicine to treat patients with epilepsy.152,153 Indeed, we identified some compounds associated with the different groups of patients with MTLE according to the presence or absence of familial recurrence of the disease. These results should be investigated further in experimental models of epilepsy to confirm their potential role as new therapeutic compounds in the treatment of subgroups of patients with MTLE.
It is important to note that the hippocampus is a singular structure with different cells and functions to generate excitatory and inhibitory synapses. We performed our experiments using all structures of the hippocampus; however, to better understand the histopathological findings of HS and its relationship to MTLE, single-cell RNA-seq, and integration with other -omics modalities may provide additional information about differences between sporadic and familial MTLE. 154 Nevertheless, the database we have produced provides a complete view of molecular events in tissue from patients with familial and sporadic MTLE, significantly contributing to new insights into the molecular mechanisms underlying MTLE.
Conclusions
This is the first study to compare gene expression profiles of familial and sporadic MTLE. Our results clearly show that these forms of MTLE have distinct molecular signatures despite similarities in the clinical features. Furthermore, these findings offer new insights into the heterogeneous nature of the mechanisms underlying MTLE.
Supplemental Material
sj-pdf-1-ebm-10.1177_15353702221126666 – Supplemental material for Gene expression profile suggests different mechanisms underlying sporadic and familial mesial temporal lobe epilepsy
Supplemental material, sj-pdf-1-ebm-10.1177_15353702221126666 for Gene expression profile suggests different mechanisms underlying sporadic and familial mesial temporal lobe epilepsy by Claudia V Maurer-Morelli, Jaira F de Vasconcellos, Estela M Bruxel, Cristiane S Rocha, Amanda M do Canto, Helder Tedeschi, Clarissa L Yasuda, Fernando Cendes and Iscia Lopes-Cendes in Experimental Biology and Medicine
Footnotes
Authors’ Contributions
CVM-M, JFV, and IL-C participated in the study design and data generation; HT, CLY, and FC provided surgery tissues; CSR and EMB analyzed the data; CVMM, JFV, EMB, and IL-C wrote the manuscript; AMC contributed with a critical review of the results. All authors participated in the review of the manuscript. CVM-M, JFV and EMB contributed equally to this paper.
Declaration of Conflicting Interests
The author(s) declared no potential conflicts of interest with respect to the research, authorship, and/or publication of this article.
Funding
The author(s) disclosed receipt of the following financial support for the research, authorship, and/or publication of this article: This study was supported by grants from Fundação de Amparo à Pesquisa do Estado de São Paulo (FAPESP), Brazil, grant numbers: 2005/56578-4, 2008/54789-6, 2010/17440-5 and 2013-07559-3), and Coordenação de Aperfeiçoamento de Pessoal de Nível Superior (CAPES), Brazil, grant number 001. EMB and AMC are supported by fellowships from FAPESP (grant numbers: 2018/03254-7 and 2019/25948-3). CVM-M received a fellowship from Conselho Nacional de Pesquisa (CNPq), Brazil, grant number 154664/2006-5.
Data Availability
Supplemental Material
Supplemental material for this article is available online.
References
Supplementary Material
Please find the following supplemental material available below.
For Open Access articles published under a Creative Commons License, all supplemental material carries the same license as the article it is associated with.
For non-Open Access articles published, all supplemental material carries a non-exclusive license, and permission requests for re-use of supplemental material or any part of supplemental material shall be sent directly to the copyright owner as specified in the copyright notice associated with the article.