
Abstract
This study set out to establish a lung cancer diagnosis and prediction model uses conventional laboratory indicators combined with tumor markers, so as to help early screening and auxiliary diagnosis of lung cancer through a convenient, fast, and cheap way, and improve the early diagnosis rate of lung cancer. A total of 221 patients with lung cancer, 100 patients with benign pulmonary diseases, and 184 healthy subjects were retrospectively studied. General clinical data, the results of conventional laboratory indicators, and tumor markers were collected. Statistical Product and Service Solutions 26.0 was used for data analysis. The diagnosis and prediction model of lung cancer was established by artificial neural network – multilayer perceptron. After correlation and difference analysis, five comparison groups (lung cancer-benign lung disease group, lung cancer-health group, benign lung disease-health group, early-stage lung cancer-benign lung disease group, and early-stage lung cancer-health group) obtained 5, 28, 25, 16, and 25 valuable indicators for predicting lung cancer or benign lung disease, and then established five diagnostic prediction models, respectively. The area under the curve (AUC) of each combined diagnostic prediction model (0.848, 0.989, 0.949, 0.841, and 0.976) was higher than that of the diagnostic prediction model established only using tumor markers (0.799, 0.941, 0.830, 0.661, and 0.850), and the difference in the lung cancer-health group, the benign lung disease-health group, the early-stage lung cancer-benign lung disease group, and early-stage lung cancer-health group was statistically significant (P < 0.05). The artificial neural network–based diagnostic models for lung cancer combining conventional indicators with tumor markers have high performance and clinical significance in assisting the diagnosis of early lung cancer.
Keywords
Impact statement
In this study, we used artificial neural network – multilayer perceptron to establish a combined diagnosis model of lung cancer based on clinical data, including multiple laboratory indicators and tumor markers, so as to provide a more convenient, fast, and cheap detection method for early clinical screening and diagnosis of lung cancer, and improve the early diagnosis rate of lung cancer. The diagnosis model has high diagnostic performance and far-reaching significance for early auxiliary diagnosis of lung cancer.
Introduction
Lung cancer is the leading cause of cancer death. 1 The survival rate of lung cancer is low, with a five-year survival rate of only 19.4%, 2 whereas the five-year overall survival rate for patients diagnosed with early-stage lung cancer is about 80%.3,4 However, most patients with lung cancer do not show obvious symptoms in the early stage, so they are less likely to be diagnosed early, and most of them are in advanced stage or have metastases when they are diagnosed. Therefore, early detection is essential to improve the diagnosis rate of lung cancer and reduce lung cancer–related mortality.
Lung biopsy is the gold standard for the diagnosis of lung cancer, but lung biopsy is an invasive test and the risk of invasive procedures cannot be avoided. Existing imaging techniques such as computed tomography (CT) have proven to be effective in screening high-risk populations for lung cancer. 3 High-risk patients who underwent CT screening had a 20% decrease in lung cancer mortality.3,5 However, CT has low specificity and high cost in the detection of lung cancer, and the radiation received by repeated scanning will cause certain damage to the human body.3,6 The use of biomarkers in peripheral blood to predict cancer is a convenient, non-invasive, and widely accepted method. Tumor markers are molecules secreted by tumor cells or produced by the interaction between tumor and host cells during carcinogenesis, and their appearance or level changes can reflect the existence of tumors, 7 which is of great significance in the screening, diagnosis, and therapeutic evaluation of lung cancer. However, the sensitivity of tumor markers in patients with early lung cancer is inferiority. 8 Moreover, no single serum tumor marker can be specifically used to detect lung cancer.9,10 To improve the early diagnosis rate of lung cancer, it is a research hotspot to combine the conventional biological indicators and tumor markers in peripheral blood.
At present, artificial intelligence is widely used to assist in the diagnosis of cancer. Artificial neural network (ANN) is a non-linear and adaptive artificial intelligence method for information processing, which is composed of a large number of interconnected processing units. It is often used to assist diagnosis and monitoring of diseases in medicine. The basic ANN structure has three layers: input layer, hidden layer, and output layer. The predictive variables at the patient level are represented as nodes in the input layer, the results of patients are represented as nodes in the output layer, and the nodes in the hidden layer contain intermediate values computed by ANN, and the hidden nodes allow the ANN to model the complex relationship between the input variables and the outcome. 11 There is a study that constructed ANN prediction model and compared it with Lung Imaging Reporting and Data System (Lung-RADS). It was found that the sensitivity of the ANN model for lung cancer detection in Asian population was 75.0%, while the sensitivity of Lung-RADS was only 12.5%. Therefore, it is believed that ANN can provide higher sensitivity for lung cancer detection in Asian population. 12
Therefore, this study uses ANN – multilayer perceptron to establish a combined diagnosis model of lung cancer based on clinical data, including multiple laboratory indicators and tumor markers, so as to provide a more convenient, fast, and cheap detection method for early clinical screening and diagnosis of lung cancer, and improve the early diagnosis rate of lung cancer.
Materials and methods
Clinical sample collection
The general clinical characteristics (including age and gender) and laboratory indexes (including tumor markers, liver function indexes, renal function indexes, electrolytes, blood routine indexes, coagulation indexes) of patients diagnosed with lung cancer and benign lung diseases in the Affiliated Hospital of Southwest Medical University from 2013 to 2021 were retrospectively collected. A total of 1620 cases were analyzed according to the inclusion and exclusion criteria, and 321 cases were included for follow-up analysis. Of these, 221 cases were lung cancer patients, all confirmed by pathology biopsy; 100 cases were patients with benign lung diseases. The general clinical characteristics and laboratory indexes of 219 healthy people were collected. After analyzing the data according to the inclusion and exclusion criteria, 184 cases were included for follow-up analysis. The three types of subjects were divided into three comparison groups: lung cancer-benign lung disease group (321 cases), lung cancer-health group (405 cases), and benign lung disease-health group (284 cases) (Figure 1). Non-small cell lung cancer was classified into stage I, stage IIA, stage IIB, stage III, and stage IV; 13 small cell lung cancer (SCLC) was classified into limited and extensive stages. Lung cancer in stage I, stage IIA, and limited stage was classified as early-stage lung cancer (37 cases), and the rest were classified as advanced-stage lung cancer (184 cases) (Figure 1). The screening of indicators and the establishment of diagnostic prediction models were performed separately within each comparison group.
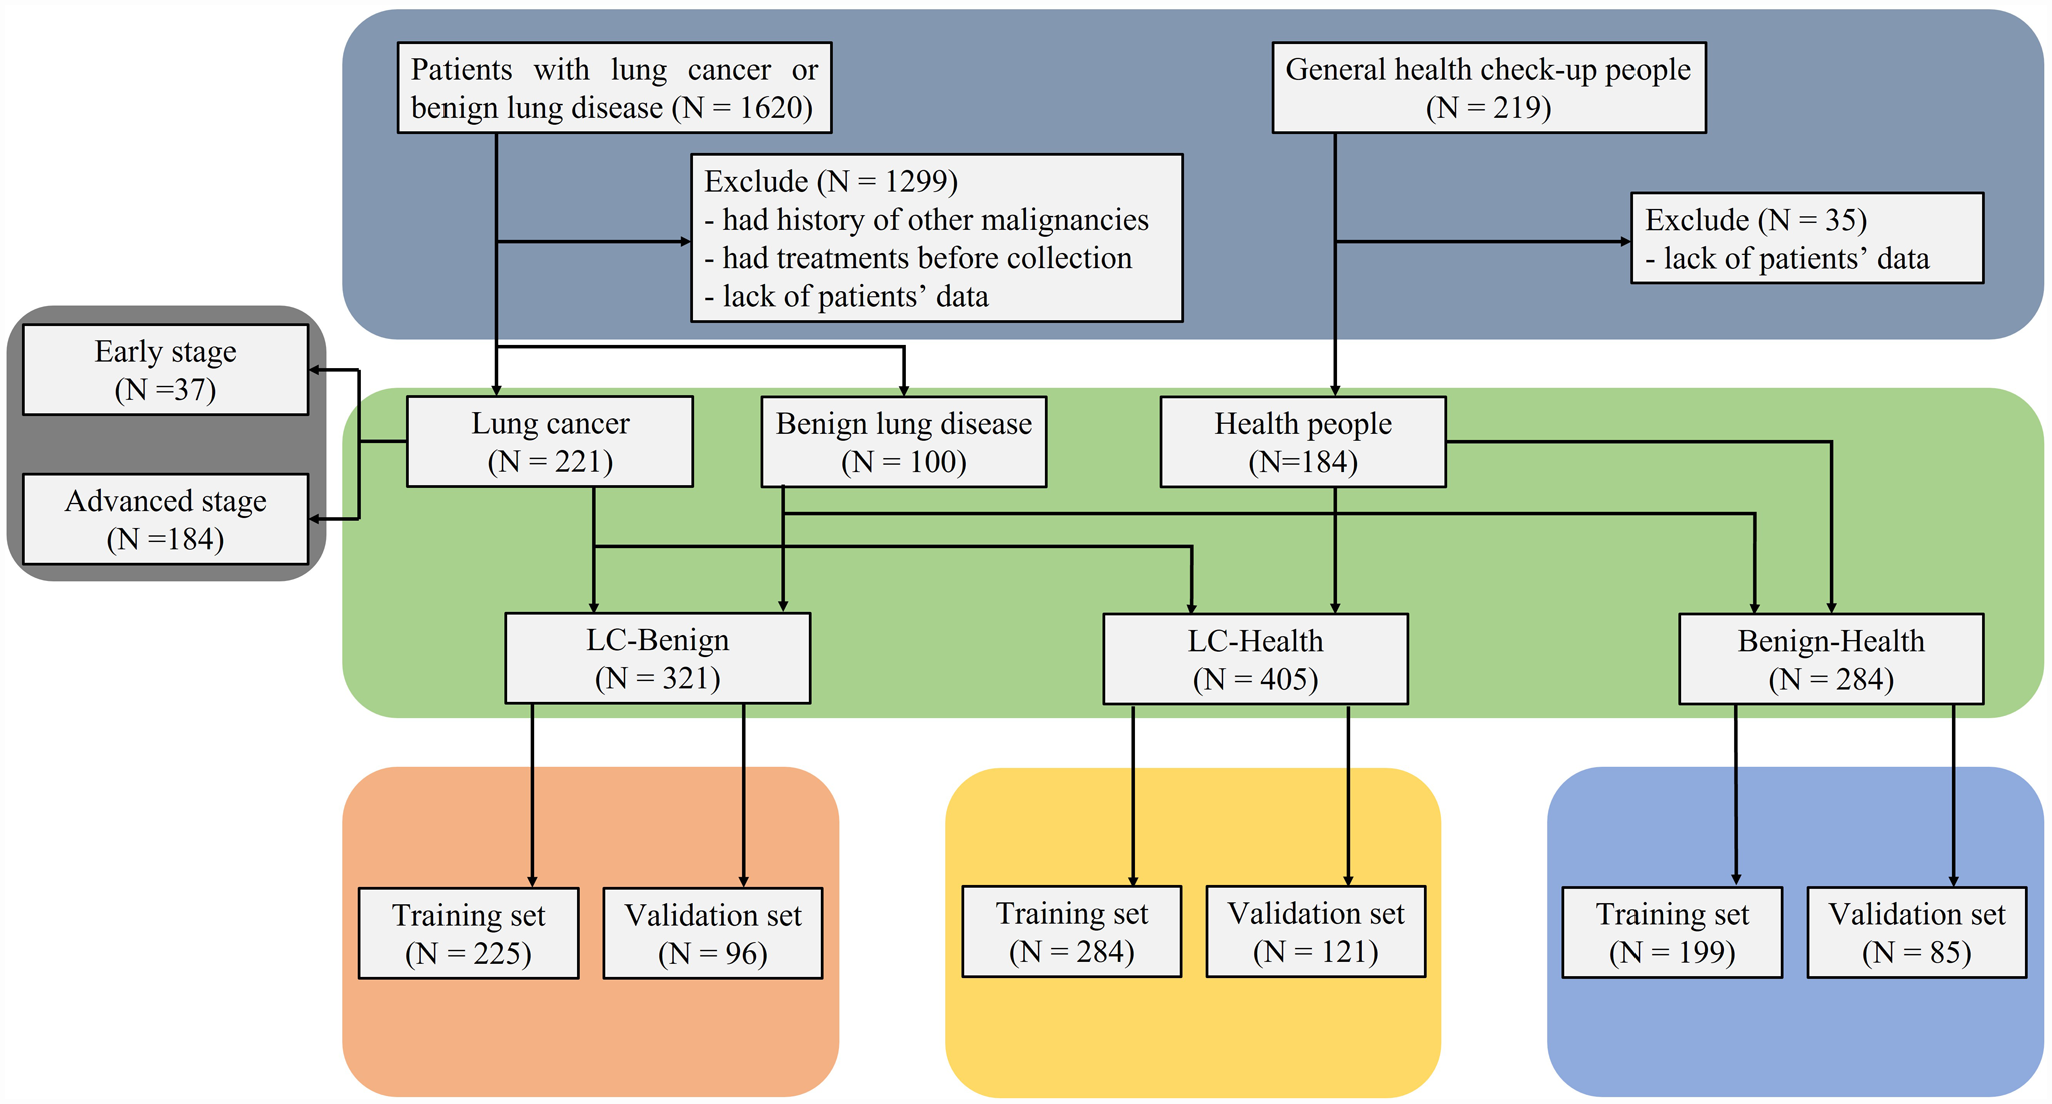
Flow chart of diagnosis model construction.
Inclusion and exclusion criteria
Cases of lung cancer: cases with a confirmed diagnosis of lung cancer by pathological biopsy were included; cases with other cancers or a history of other cancers were excluded; cases that had been treated were excluded; and cases with incomplete data were excluded. Cases of benign lung disease: cases with confirmed benign lung disease were included; cases with a history of lung cancer or other cancers were excluded; cases with suspected lung cancer were excluded; and cases with incomplete data were excluded. Healthy individuals: cases that did not suggest a lung mass, nodules, and other suspected lung lesions by X-ray or CT examination and have no history of cancer were included; cases with incomplete data were excluded.
Statistical analysis
Data analysis and graphing were performed using Statistical Product and Service Solutions 26.0. Normally distributed measures were described using X ± SD, and non-normally distributed measures were described using median and interquartile range. Numeration data are described using frequency (percentage). The UNIFORM function was used to generate random values. The data of lung cancer patients, benign lung disease patients, and healthy subjects were randomly divided into training set and validation set with the ratio of training set / validation set = 7 / 3 using random values. Spearman correlation analysis was used for bivariate correlation testing. Independent sample t-test was used for comparison of normally distributed measurement data between groups. The Mann–Whitney non-parametric test was used for comparison of skewed distribution measurement data between groups. A chi-square test was used for comparison of numeration data between groups. In all analyses, a value P < 0.05 was considered to be statistically significant. ANN – multilayer perceptron was used to establish lung cancer diagnosis prediction models. The receiver operating characteristic (ROC) curve was drawn and the area under the curve (AUC) was calculated to compare the diagnostic prediction models.
Model construction
The samples are split according to the ratio of 7:3 between the training set and the test set; the architecture is taken as custom; two layers are specified for the hidden layer and a hyperbolic tangent activation function is used; the number of units is calculated automatically in the hidden layer; the sigmoid function is selected for the activation function of the output layer; the training type is processed using batches; the standard conjugate gradient optimization algorithm is used; the predicted values are saved, and the final synaptic weight estimates are exported to XML file to determine the neural network model. The models’ data is also exported (Supplemental Figures 1-10).
Results
Analysis of general clinical characteristics of subjects
Table 1 shows the general clinical characteristics of all samples. The average age of patients with lung cancer was higher than that of patients with benign lung disease and healthy people, and the difference was statistically significant (P < 0.05). The average age of patients with benign lung diseases was higher than that of healthy people (P < 0.05). The proportion of males in patients with lung cancer and benign lung diseases was higher than that of females (P < 0.05), and the difference was statistically significant. There was no significant difference in gender distribution among healthy people (P > 0.05).
Analysis of general clinical characteristics of serum samples.
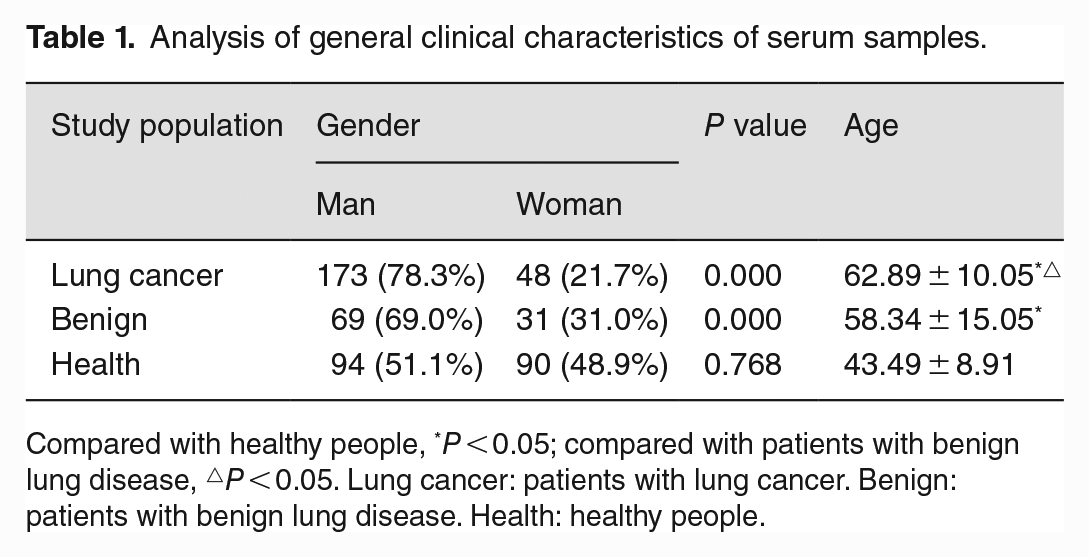
Compared with healthy people, *P < 0.05; compared with patients with benign lung disease, △P < 0.05. Lung cancer: patients with lung cancer. Benign: patients with benign lung disease. Health: healthy people.
Analysis of correlation between indexes and the risk of lung cancer or benign lung disease
In the lung cancer-benign lung disease comparison group, three tumor markers (carcinoembryonic antigen [CEA], neuron-specific enolase [NSE], and carbohydrate antigen 153 [CA153]), carbon dioxide (CO2), and thrombin time (TT) were associated with an increased risk of lung cancer. The correlation coefficients were 0.314, 0.391, 0.207, 0.239, and 0.203, respectively. In the lung cancer-health comparison group, 28 indicators were associated with the risk of lung cancer. Among them, age, CEA, NSE, carbohydrate antigen 125 (CA125), CA153, globulin (GLO), r-glutamyl transferase (GGT), alkaline phosphatase (ALP), white blood cell (WBC), neutrophil (NEU), monocyte (MONO), neutrophil rate (NEU-R), monocyte rate (MONO-R), red blood cell volume distribution width standard deviation (RDW-SD), and red blood cell volume distribution width coefficient of variation (RDW-CV) were associated with the increased risk of lung cancer. There was a strong correlation between age (r = 0.701), NEU (r = 0.577), CA125 (r = 0.569), and the increased risk of lung cancer. In the benign lung disease-health comparison group, 25 indicators were associated with the risk of benign lung disease, of which 11 were positively correlated (age, CEA, CA125, GLO, GGT, ALP, WBC, NEU, MONO, NEU-R, and RDW-CV). NEU-R (r = 0.636), NEU (r = 0.595), and CA125 (r = 0.550) were strongly correlated with the increased risk of benign lung diseases (Table 2).
Indicators associated with the risk of lung cancer or benign lung disease.

LC-Benign: lung cancer-benign lung disease group. LC-Health: lung cancer-health group. Benign-Health: benign lung disease-health group. *The association with the risk of lung cancer is not caused by random errors (P < 0.05). **The association with the risk of benign lung disease is not caused by random errors (P < 0.05). CEA: carcinoembryonic antigen; NSE: neuron-specific enolase; CA125: carbohydrate antigen 125; CA153: carbohydrate antigen 153; CA724: carbohydrate antigen 724; AST: aspartate aminotransferase; ALT: alanine aminotransferase; TP: total protein; ALB: albumin; GLO: globulin; AGR: albumin/globulin ratio; TBIL: total bilirubin; DBIL: direct bilirubin; IBIL: indirect bilirubin; GGT: r-glutamyl transferase; ALP: alkaline phosphatase; UA: uric acid; WBC: white blood cell; NEU: neutrophil; LYM: lymphocyte; MONO: monocyte; NEU-R: neutrophil rate; LYM-R: lymphocyte rate; MONO-R: monocyte rate; EOS-R: eosinophil rate; BASO-R: basophil rate; RBC: red blood cell; HGB: hemoglobin; HCT: red blood cell hematocrit; MCV: mean volume of red blood cells; MCH: mean hemoglobin of red blood cells; MCHC: mean hemoglobin concentration of red blood cells; RDW-SD: red blood cell volume distribution width standard deviation; RDW-CV: red blood cell volume distribution width coefficient of variation; MPV: mean platelet volume; PDW: platelet volume distribution width; P-LCR: large platelet ratio; K+: potassium ion; Cl−: chloride ion; CO2: carbon dioxide; TT: thrombin time.
Differential analysis of laboratory indicators in lung cancer or benign lung disease
Differential analysis was performed using indicators related to the risk of lung cancer or benign lung disease to screen for indicators for identification. In the lung cancer-benign lung disease group, the serum levels of five indicators related to the risk of lung cancer were significantly different between lung cancer patients and benign lung disease patients (P < 0.05). In the lung cancer-health group, 28 indicators related to the risk of lung cancer were significantly different between lung cancer and healthy people (P < 0.05). In the benign lung disease-health group, 25 indicators related to the risk of benign lung disease were different between patients with benign lung disease and healthy people, and the difference was statistically significant (P < 0.05). It shows that these indicators are valuable for the diagnosis of lung cancer or benign lung diseases and can be included in the establishment of diagnostic prediction models (Tables 3 to 5).
Valuable indicators for the diagnosis of lung cancer in lung cancer-benign lung disease group.
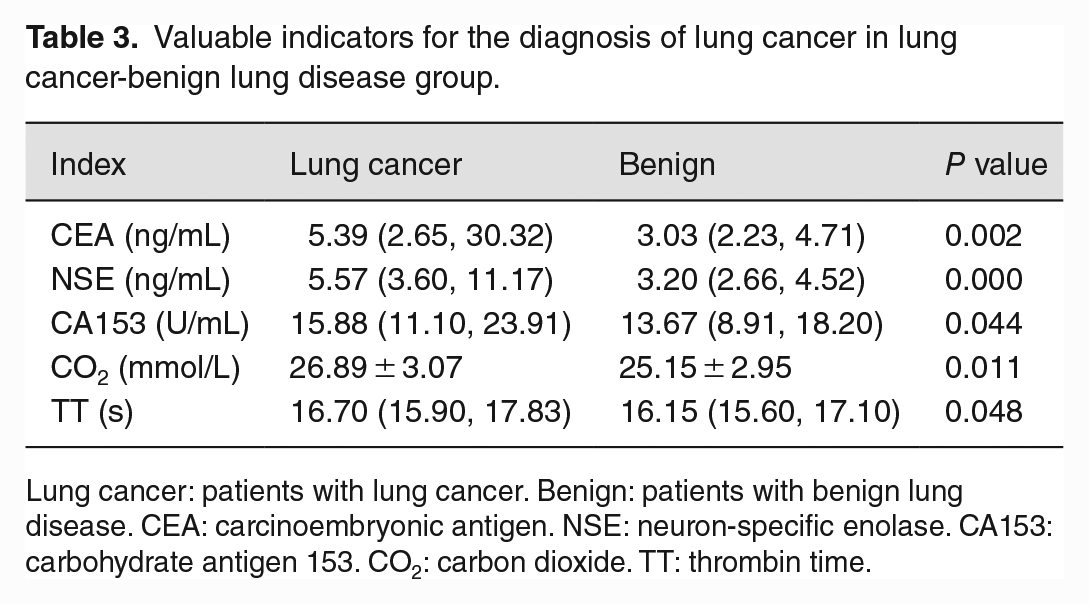
Lung cancer: patients with lung cancer. Benign: patients with benign lung disease. CEA: carcinoembryonic antigen. NSE: neuron-specific enolase. CA153: carbohydrate antigen 153. CO2: carbon dioxide. TT: thrombin time.
Valuable indicators for the diagnosis of lung cancer in lung cancer-health group.
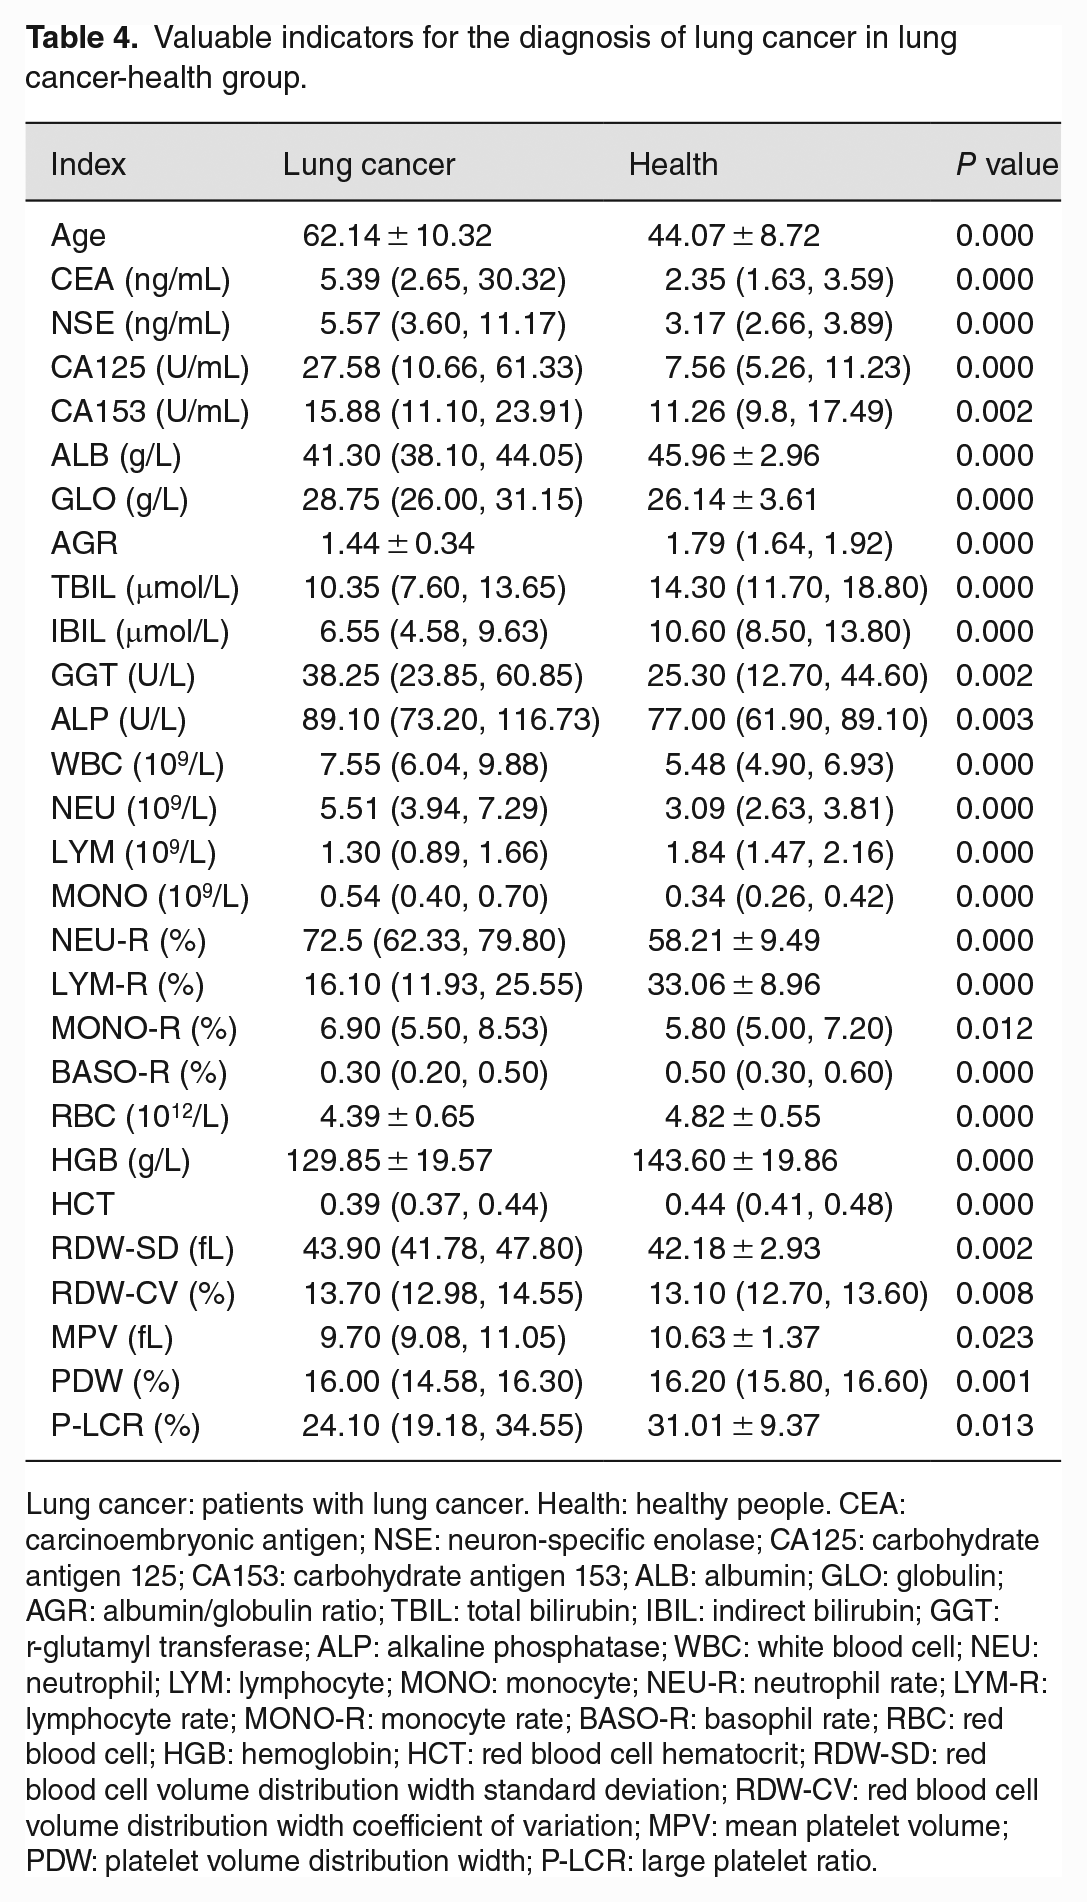
Lung cancer: patients with lung cancer. Health: healthy people. CEA: carcinoembryonic antigen; NSE: neuron-specific enolase; CA125: carbohydrate antigen 125; CA153: carbohydrate antigen 153; ALB: albumin; GLO: globulin; AGR: albumin/globulin ratio; TBIL: total bilirubin; IBIL: indirect bilirubin; GGT: r-glutamyl transferase; ALP: alkaline phosphatase; WBC: white blood cell; NEU: neutrophil; LYM: lymphocyte; MONO: monocyte; NEU-R: neutrophil rate; LYM-R: lymphocyte rate; MONO-R: monocyte rate; BASO-R: basophil rate; RBC: red blood cell; HGB: hemoglobin; HCT: red blood cell hematocrit; RDW-SD: red blood cell volume distribution width standard deviation; RDW-CV: red blood cell volume distribution width coefficient of variation; MPV: mean platelet volume; PDW: platelet volume distribution width; P-LCR: large platelet ratio.
Valuable indicators for the diagnosis of benign lung disease in benign lung disease-health group.
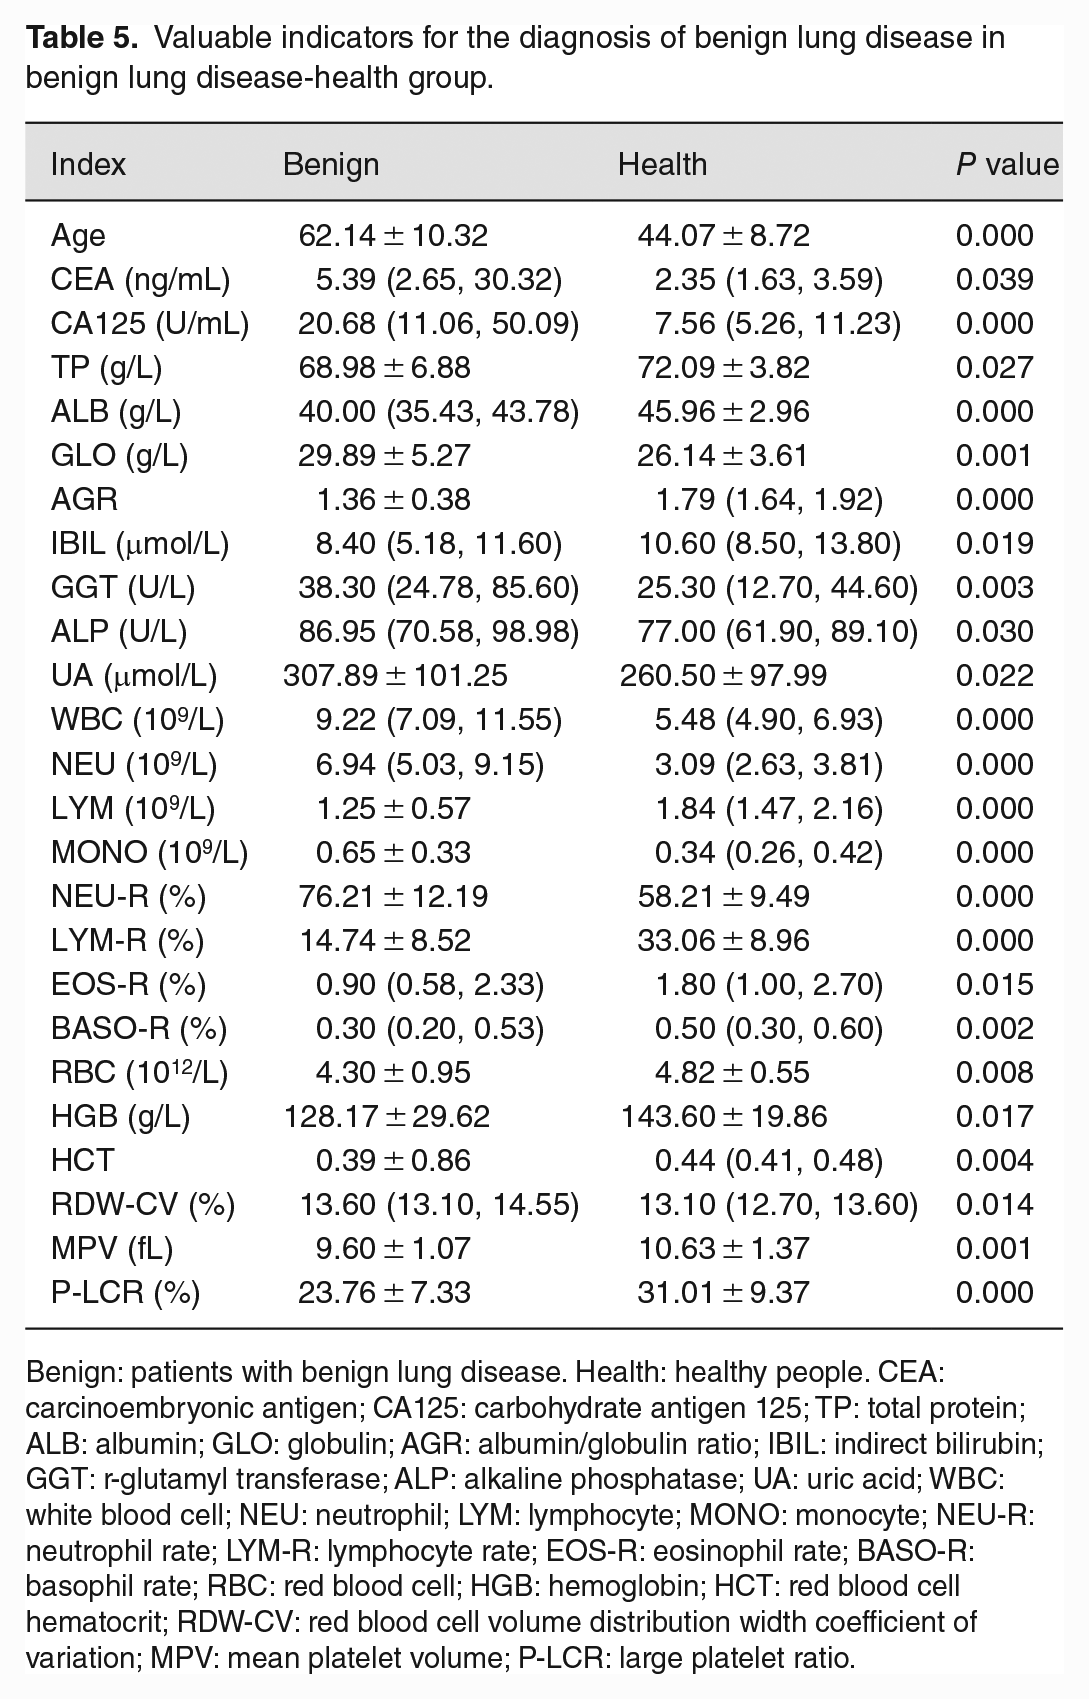
Benign: patients with benign lung disease. Health: healthy people. CEA: carcinoembryonic antigen; CA125: carbohydrate antigen 125; TP: total protein; ALB: albumin; GLO: globulin; AGR: albumin/globulin ratio; IBIL: indirect bilirubin; GGT: r-glutamyl transferase; ALP: alkaline phosphatase; UA: uric acid; WBC: white blood cell; NEU: neutrophil; LYM: lymphocyte; MONO: monocyte; NEU-R: neutrophil rate; LYM-R: lymphocyte rate; EOS-R: eosinophil rate; BASO-R: basophil rate; RBC: red blood cell; HGB: hemoglobin; HCT: red blood cell hematocrit; RDW-CV: red blood cell volume distribution width coefficient of variation; MPV: mean platelet volume; P-LCR: large platelet ratio.
Establishment and evaluation of diagnostic prediction model
In the lung cancer-benign lung disease group, five indicators were used to establish a diagnostic prediction model. The AUC of the model was 0.848; the sensitivity and specificity were 85.5% and 76.0%, respectively; and the Youden index was 0.615. In the lung cancer-health group, a diagnostic prediction model was established using 28 indicators. The AUC of the model was 0.989; the sensitivity and specificity were 97.7% and 94.6%, respectively; and the Youden index was 0.923. The benign lung disease-health group used 25 indicators to establish a diagnostic prediction model. The AUC of the model was 0.949; the sensitivity and specificity were 90.0% and 93.5%, respectively; and the Youden index was 0.835. The AUC of the three combined diagnostic prediction models was higher than that of the model using only tumor markers (0.799, 0.941, and 0.830), and the difference in the lung cancer-health group and the benign lung disease-health group was statistically significant (P < 0.05) (Figure 2). It shows that the diagnostic prediction model established by combining conventional laboratory indicators and tumor markers has better performance in the diagnosis of lung cancer than the prediction model established by using tumor markers alone (Table 6).
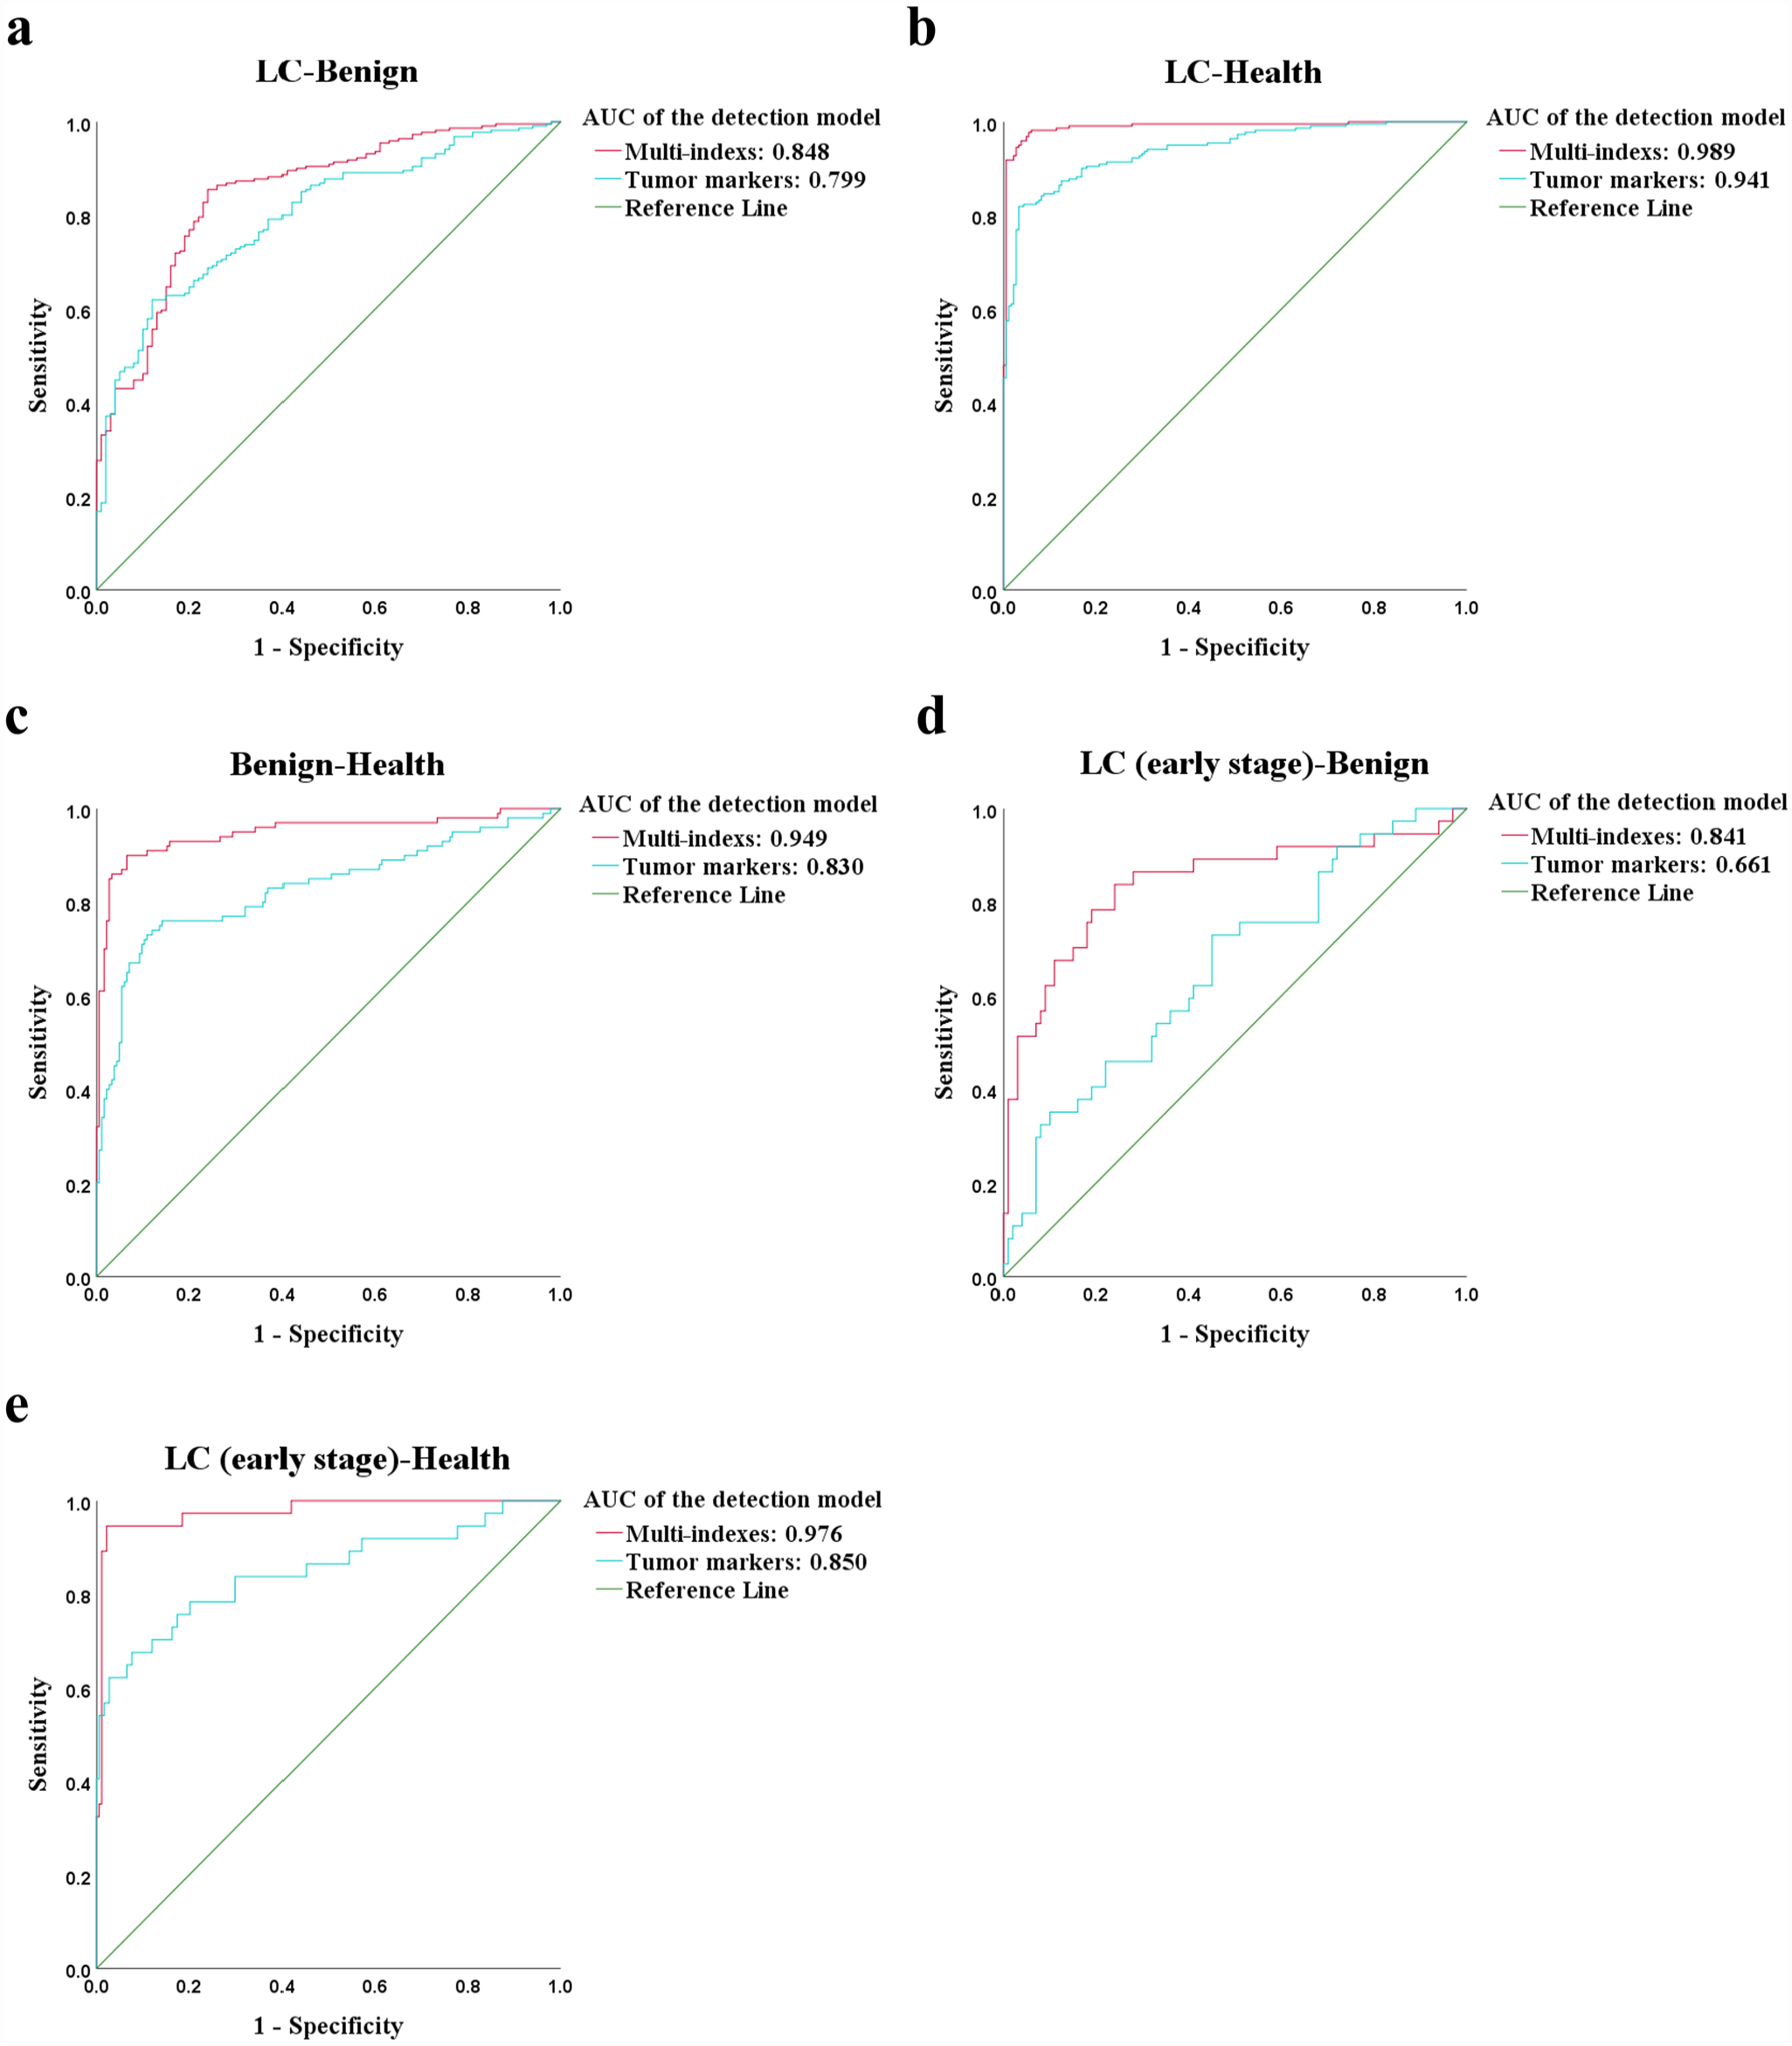
ROC curve of five diagnostic models. (a) ROC curve of the diagnostic model of lung cancer-benign lung disease group; (b) ROC curve of the diagnostic model of lung cancer-health group; (c) ROC curve of the diagnostic model of benign lung disease-health group; (d) ROC curve of the diagnostic model of early-stage lung cancer-benign lung disease group; (e) ROC curve of the diagnostic model of early-stage lung cancer-health group.
Discriminant analysis of diagnostic models.
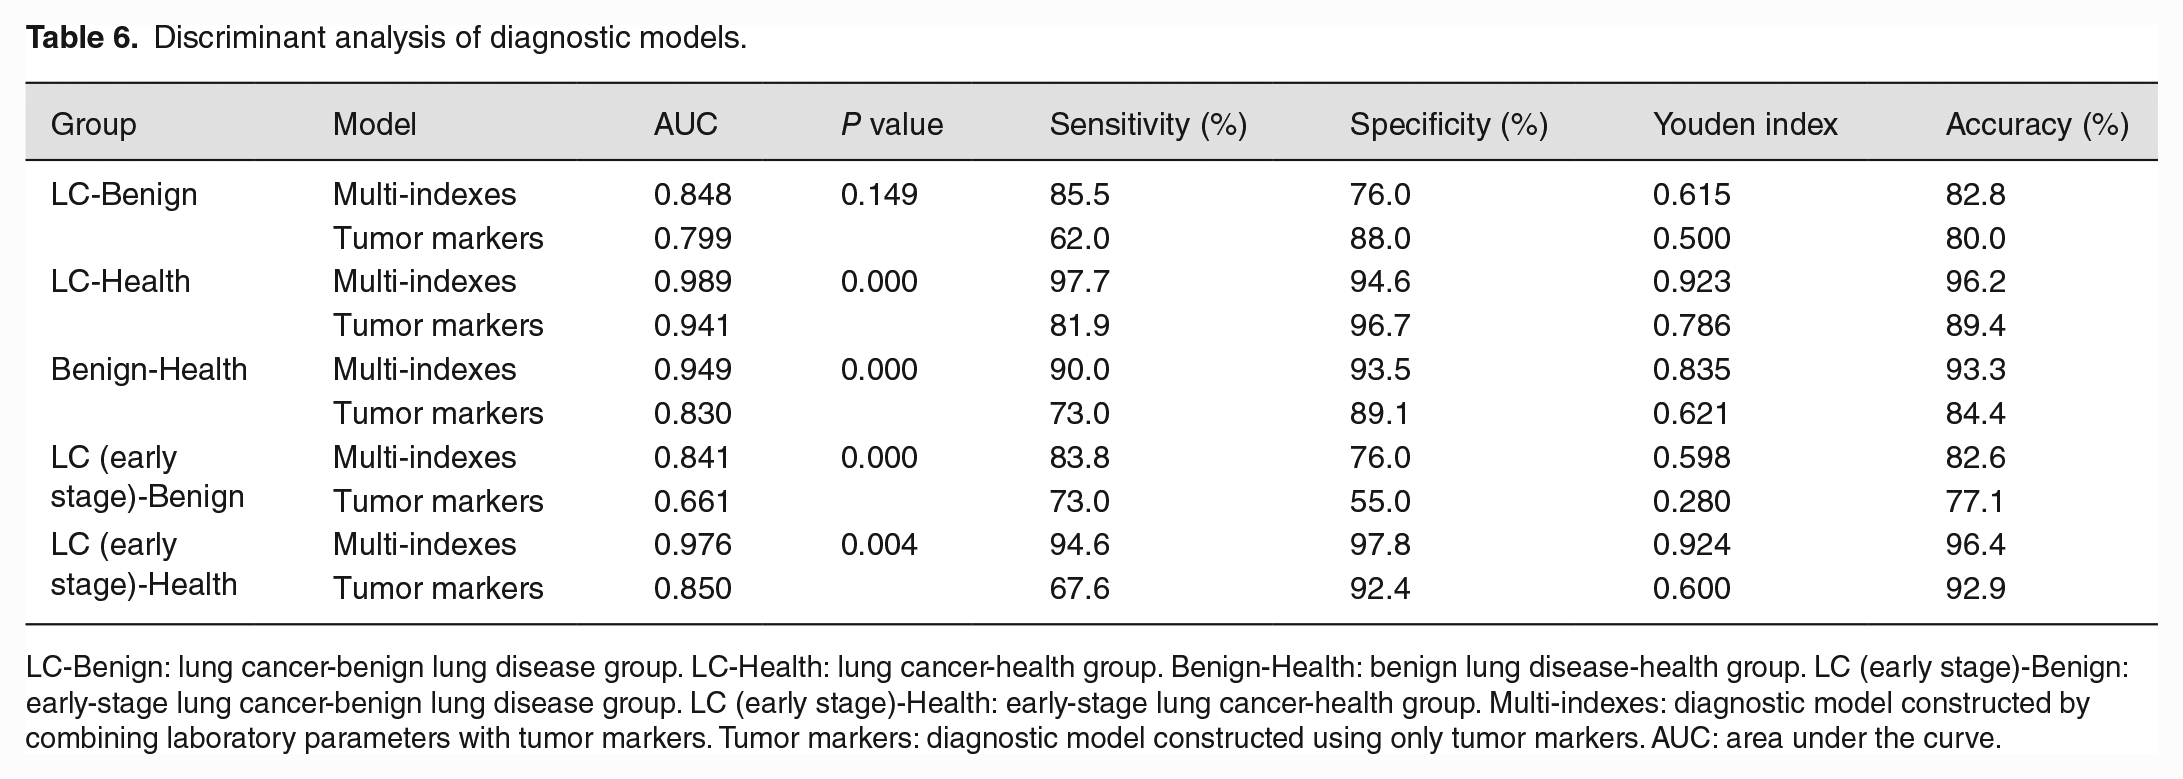
LC-Benign: lung cancer-benign lung disease group. LC-Health: lung cancer-health group. Benign-Health: benign lung disease-health group. LC (early stage)-Benign: early-stage lung cancer-benign lung disease group. LC (early stage)-Health: early-stage lung cancer-health group. Multi-indexes: diagnostic model constructed by combining laboratory parameters with tumor markers. Tumor markers: diagnostic model constructed using only tumor markers. AUC: area under the curve.
Diagnostic model of early-stage lung cancer
In the early-stage lung cancer-benign lung disease group, 16 indicators (CEA, NSE, uric acid [UA], CO2, WBC, NEU, NEU-R, lymphocyte rate [LYM-R], eosinophil rate [EOS-R], mean hemoglobin concentration of red blood cells [MCHC], RDW-SD, mean platelet volume [MPV], large platelet ratio [P-LCR], prothrombin time [PT], prothrombin time activity [PT-%], and TT) were associated with early-stage lung cancer. Moreover, the levels of these 16 indicators were significantly different between early-stage lung cancer and benign lung disease patients. Then, use them to establish a diagnostic prediction model. The AUC of the model was 0.841 (Figure 2); the sensitivity and specificity were 83.8% and 76.0%, respectively; and the Youden index was 0.598. In the early-stage lung cancer-health group, 26 indicators were associated with early-stage lung cancer. Among them, 25 indicators (age, CEA, NSE, CA125, carbohydrate antigen 724 [CA724], albumin [ALB], GLO, albumin to globulin ratio [AGR], total bilirubin [TBIL], direct bilirubin [DBIL], indirect bilirubin [IBIL], GGT, ALP, urea, WBC, NEU, lymphocyte [LYM], MONO, NEU-R, LYM-R, MONO-R, red blood cell [RBC], hemoglobin [HGB], red blood cell hematocrit [HCT], and RDW-SD) were significantly different between early-stage lung cancer and healthy people. The AUC of the model was 0.976 (Figure 2); the sensitivity and specificity were 94.6% and 97.8%, respectively; and the Youden index was 0.924 (Table 6). Both models have good diagnostic efficacy for differentiating early-stage lung cancer from healthy individuals and patients with benign lung disease.
Discussion
The construction of a marker model for predicting lung cancer plays a significant role in the occurrence and development of the disease. 14 In this study, three diagnostic prediction models were established by combining conventional laboratory indicators and serum tumor markers using ANN, and their risk prediction performance was better than that of the model using only tumor markers.
Increasing age, smoking history, occupational exposure history, and family history of lung cancer are considered to be risk factors for lung cancer. 15 It has been found that the risk of lung cancer increases significantly with age. 16 In this study, the age distribution of lung cancer cases and benign lung disease cases was significantly different in the overall and training sets (P < 0.05), but there was no significant correlation between age and the risk of lung cancer in the validation set, so age was not included in the establishment of the prediction model for the lung cancer-benign lung disease group, which does not mean that age cannot be used to identify benign and malignant lung diseases, and the sample size will be expanded for further verification in the future. In the comparison between healthy people and patients with lung cancer or benign lung disease, age was significantly positively correlated with the risk of lung disease and had significant differences (P < 0.05), and the age of healthy people was significantly lower than the other two groups, so we think age is a risk factor for lung disease, but it still needs to be considered in combination with other clinical features. Globally, men are more than twice as likely as women to be diagnosed with and die from lung cancer, but this may be related to the fact that men are more likely to smoke than women. 17 And epidemiological studies also have identified an association between smoking and an increased risk of lung cancer. 18 In addition, hormonal differences between men and women may be associated with the risk of lung cancer. 17
CEA is a glycoprotein complex that is expressed and released in various cancers. CEA is increased in colorectal cancer, breast cancer, lung cancer, thyroid cancer, and other cancers. It is usually absent or low in the blood of healthy adults and is considered to be associated with poor prognosis of tumors.19–24 CEA may also be elevated in various benign diseases, such as obstructive pulmonary disease, hepatitis, and pancreatitis. 23 NSE is the main enolase isoenzyme in neurons and neuroendocrine tissues, and its serum level is often elevated in diseases with neuronal damage. 25 SCLC is an aggressive neuroendocrine tumor. Currently, NSE is considered a reliable tumor marker for the diagnosis of SCLC 26 and has certain significance for the initial screening of lung cancer. CA125 is a transmembrane glycoprotein with increased expression in a variety of pathological states, such as lung and ovarian cancer; however, the level of CA125 is also elevated during menstruation and early pregnancy.27–29 CA153 is a variant glycoprotein on the surface of breast cells. It was found that the serum level of CA153 was significantly higher in patients with breast cancer than in patients with benign breast lesions. 7 In this study, CEA and NSE were both positively correlated with benign and malignant lung lesions. We suggest that elevated serum levels of CEA or NSE may reflect a higher risk of benign lung disease or even lung cancer. CEA, CA125, NSE, and CA153 were differentially expressed in patients with lung cancer, patients with benign lung disease, and healthy individuals (P < 0.05) and were therefore included in the development of the diagnostic model.
ALB and GLO are the main components of serum proteins. ALB is produced by the liver and reflects the nutritional status of the body; GLO is calculated from a formula (total serum protein minus ALB) and has been shown to be associated with immunity and chronic inflammation. 30 Hypoalbuminemia is an independent risk factor for survival in several cancers, and all types of GLOs produced by chronic inflammation can promote tumor development. 31 In this study, serum ALB was negatively correlated with the risk of lung cancer or benign lung disease, and the level of ALB was significantly higher in healthy individuals than in patients with lung cancer or benign lung disease, and the difference was significant (P < 0.05). There was a positive correlation between GLO and the risk of lung cancer or benign lung disease, with healthy individuals having lower GLO levels than the other two groups of patients, and the difference was statistically significant (P < 0.05). Serum levels of ALB and GLO are susceptible to interference by several factors, but a low level of AGR is a valuable predictor of long-term mortality in lung adenocarcinoma. 30 A negative correlation between AGR and the risk of lung cancer or benign lung disease was observed in this study, with a significant difference between healthy individuals and the other two groups of patients (P < 0.05). GGT is distributed on the cell membrane and is most abundant in the kidney, followed by the pancreas, liver, and lung. Persistently elevated levels of GGT may reflect chronic inflammation and oxidative stress, which are risk factors for cancer.32,33 Recurrent elevations in GGT have been found to be associated with a higher risk of respiratory cancers. 32 In this study, the levels of GGT and ALP were higher in patients with lung cancer or benign lung disease than in healthy subjects, with statistically significant differences (P < 0.05), which is consistent with previous studies.32,34 Due to its anti-inflammatory and antioxidant properties, bilirubin may have a protective effect against the development of several chronic diseases, including cancer. 35 In this study, we found a negative association between total serum bilirubin, IBIL, and the risk of lung cancer, with significantly lower serum levels of total and indirect bilirubin in lung cancer patients than in healthy subjects (P < 0.05), which is consistent with the findings of existing studies.36,37
The relationship between serum UA levels and the risk of cancers is more complex. UA has both antioxidant and pro-oxidant effects, so its role in different cancers is contradictory. High UA levels may be positively associated with an increased risk of colorectal cancer in women. 38 Studies have also shown a negative correlation between UA and the risk of lung cancer in men. 39 In the results of this study, there was a negative correlation between UA and the risk of benign lung diseases in healthy people. The difference in serum UA levels between the two groups was statistically significant (P < 0.05). The correlation between UA and the risk of lung cancer was not statistically significant in this study (P > 0.05); the relationship between them needs further study.
Chronic inflammation is a risk factor for cancer. 40 The results of this study showed that total WBC and NEU were positively correlated with the risk of lung cancer or benign lung disease. The levels of WBC or NEU in the two types of patients were significantly higher than those in healthy people (P < 0.05). LYM was negatively correlated with the risk of lung cancer or benign lung disease. LYM in patients with lung cancer or benign lung disease was lower than that in healthy people (P < 0.05). WBC can be divided into granulocytes (including NEU, eosinophils, and basophils), MONO, and LYM according to their morphology, function, and source. When there is an inflammatory response in the body, the level of WBC in the blood is usually elevated. Studies have found that increased total WBC levels are associated with an increased risk of lung cancer, and this relationship is mainly mediated by NEU. 41 The antibodies secreted by LYM can regulate cancer cells and activate the complement cascade, thereby inducing tumor death. 42 MONO has both pro-inflammatory and anti-inflammatory properties and has an inhibitory or promotional effect on tumors, which depends on the type of cancer.43,44 Studies have found that MONO in peripheral blood of lung cancer patients increased significantly. 45 These are consistent with the results of our findings. The RDW is a parameter that reflects the volumetric heterogeneity of RBC and indicates the variability of the size of RBC in the blood. RDW is associated with multiple inflammatory markers, and this relationship suggests that the tumor-mediated inflammatory microenvironment can lead to increased RDW expression. 46 RBC is an important oxygen-carrying mediator, and when its size is variable or its function is impaired, it induces a hypoxic microenvironment, which in turn leads to tumor progression. 47 Anemia is the most common hematologic abnormality in cancer patients and is a direct or indirect consequence of tumor progression or antitumor therapy.48,49 In this study, RBC and HGB were negatively associated with the risk of lung cancer, RDW was positively associated with the risk of lung cancer, and their differences in levels between lung cancer and healthy individuals were statistically significant (P < 0.05). In summary, we believe that RBC, HGB, and RDW have great clinical significance in the differential diagnosis of lung cancer and healthy individuals.
TT is the time required for plasma to clot after a “standardized” prothrombin solution has been added to the plasma under test. TT has been previously found to be a marker to differentiate brain metastases from other intracranial malignancies. 50 In this study, the prolongation of TT was positively correlated with the development of lung cancer and was significantly different between patients with lung cancer and benign lung disease (P < 0.05), with longer TT in patients with lung cancer than in patients with benign lung disease. However, in the data collected in this study, the median values of TT in both categories of patients remained within the normal reference range. More relevant data on the role of TT in lung carcinogenesis need to be collected for further analysis.
In this study, the diagnostic efficacy of the predictive models developed by each of the three comparison groups was higher than that of the predictive models developed using tumor markers alone, and the difference in the lung cancer-health group and the benign lung disease-health group was statistically significant (P < 0.05). It can be assumed that the more indicators used for risk prediction of lung cancer, the higher the detection rate of lung cancer will be. The AUC of the models of early-stage lung cancer-benign lung disease group and early-stage lung cancer-health group reached 0.841 and 0.976, respectively. It indicates that the models have high diagnostic efficacy and can help in the differential diagnosis of early-stage lung cancer patients, patients with benign lung disease and healthy individuals. The five prediction models of this study can be used simultaneously for risk prediction when patients come to the hospital, so as to help early clinical detection of lung cancer and intervention to reduce lung cancer mortality. Since the data collected from healthy individuals in this study were obtained from the test results of the various physical examinations they attended, electrolyte tests as well as glomerular filtration rate were not included. Therefore, the above indicators were not included in the data analysis and the development of diagnostic models between healthy individuals and the other two populations in this study, which does not mean that these indicators do not correlate and differ between healthy individuals and those with lung cancer or benign lung lesions.
The innovation of this study is to establish a risk prediction model for lung cancer by combining several conventional laboratory indicators and tumor markers through ANNs. Next, we will further validate and improve the efficiency of the diagnostic model by improving the relevant data and expanding the sample size, and test the effect of the models in clinical practice.
Conclusion
The diagnosis model of lung cancer based on ANN which used conventional laboratory indicators combined with tumor markers has high diagnostic performance and far-reaching significance for early auxiliary diagnosis of lung cancer.
Supplemental Material
sj-pdf-1-ebm-10.1177_15353702231177013 – Supplemental material for Artificial neural network–based diagnostic models for lung cancer combining conventional indicators with tumor markers
Supplemental material, sj-pdf-1-ebm-10.1177_15353702231177013 for Artificial neural network–based diagnostic models for lung cancer combining conventional indicators with tumor markers by Yanan Luo, Hui Yuan, Qin Pei, Yiyu Chen, Jiawen Xian, Rongrong Du and Ting Ye in Experimental Biology and Medicine
Footnotes
Authors’ Contributions
All authors participated in the design, interpretation of the studies and analysis of the data, and review of the article; YL wrote the article.
Declaration Of Conflicting Interests
The author(s) declared no potential conflicts of interest with respect to the research, authorship, and/or publication of this article.
Funding
The author(s) disclosed receipt of the following financial support for the research, authorship, and/or publication of this article: This work was supported by the National Natural Science Youth Fund, China (Grant No. 82003138); the Sichuan Science and Technology Program for key Research and Development, China (Grant No. 2021YFS0226); Doctoral Research Initiation Fund of Affiliated Hospital of Southwest Medical University, China (Grant No.19077); and Medical Science and Technology Project of Sichuan Provincial Health Commission, China (Grant No.21PJ093).
Supplemental Material
Supplemental material for this article is available online.
References
Supplementary Material
Please find the following supplemental material available below.
For Open Access articles published under a Creative Commons License, all supplemental material carries the same license as the article it is associated with.
For non-Open Access articles published, all supplemental material carries a non-exclusive license, and permission requests for re-use of supplemental material or any part of supplemental material shall be sent directly to the copyright owner as specified in the copyright notice associated with the article.