
Abstract
Identifying the mechanisms by which bacterial pathogens kill host cells is fundamental to understanding how to control and prevent human and animal disease. In the case of Bacillus thuringiensis (Bt), such knowledge is critical to using the bacterium to kill insect vectors that transmit human and animal disease. For the Cry4B toxin produced by Bt, its capacity to kill Anopheles gambiae, the primary mosquito vector of malaria, is the consequence of a variety of signaling activities. We show here that Cry4B, acting as first messenger, binds specifically to the bitopic cadherin BT-R3 G-protein-coupled receptor (GPCR) localized in the midgut of A. gambiae, activating the downstream second messenger cyclic adenosine monophosphate (cAMP). The direct result of the Cry4B–BT-R3 binding is the release of αs from the heterotrimeric αβγ-G-protein complex and its activation of adenylyl cyclase (AC). The upshot is an increased level of cAMP, which activates protein kinase A (PKA). The functional impact of cAMP–PKA signaling is the stimulation of Na+/K+-ATPase (NKA) which serves as an Na+/K+ pump to maintain proper gradients of extracellular Na+ and intracellular K+. Increased level of cAMP amplifies NKA and upsets normal ion concentration gradients. NKA, as a scaffolding protein, accelerates the first messenger signal to the nucleus, generating additional BT-R3 molecules and promoting their exocytotic trafficking to the cell membrane. Accumulation of BT-R3 on the cell surface facilitates recruitment of additional toxin molecules which, in turn, amplify the original signal in a cascade-like manner. This report provides the first evidence of a bacterial toxin using NKA via AC/PKA signaling to execute cell death.
Impact Statement
The Cry4B toxin produced by Bacillus thuringiensis subsp. israelensis (Bti) is highly effective in killing Anopheles gambiae, a primary vector of malaria. To generate Bti-based insecticides for mosquito control, a fundamental understanding of the mechanism(s) by which the protein toxin kills mosquito is essential. We demonstrate for the first time that the mechanism by which Cry4B kills the mosquito involves its direct binding to the cadherin G-protein-coupled receptor (GPCR), BT-R3, located in the midgut of A. gambiae. In so doing, it triggers a signaling pathway involving stimulation of G-protein α-subunit (Gαs), which launches a coordinated signaling cascade involving Na+/K+-ATPase (NKA). These results provide first evidence of a bacterial toxin engaging NKA to kill cells. Moreover, they provide foundation for the development of mosquitocides based on Cry toxins that bind GPCRs. In general, components of intracellular pathways activated by binding of ligands to cell surface receptors represent potential insecticide discovery targets.
Introduction
Bacillus thuringiensis subsp. israelensis (Bti) produces several pleomorphic parasporal crystalline inclusions during the sporulation phase of its life cycle. 1 The parasporal crystals are mosquitocidal2,3 and represent 25–30% of the total cell mass of the bacterium. The crystals comprise several proteinaceous protoxins that are converted to active toxins, one of which is the Cry4B toxin that is highly effective against Anopheles gambiae, the principal mosquito vector of malaria. 4 On ingestion by a larva, the proteolytic enzymes in the larval gut juice process the protoxin, resulting in an activated Cry4B toxin that binds directly to the cadherin receptor BT-R3, effecting cell death. 5 BT-R3 is representative of single-pass (aka bitopic) transmembrane cadherins,6–10 which are involved in a variety of cellular functions and activities, chief of which are intercellular adhesion and signal transduction. A classic example of cell signaling associated with a single-pass transmembrane protein is the adenylyl cyclase/protein kinase A (AC/PKA) signaling pathway induced by binding of the Cry1Ab toxin of B. thuringiensis subsp. berliner to the cadherin G-protein-coupled receptor (GPCR) BT-R1 located in the plasma membrane of epithelial cells that line the midgut of tobacco hornworm (Manduca sexta) larvae.11–13 The Cry1Ab toxin is highly effective against other lepidopteran insects (moths) – its insecticidal action is the result of binding of the toxin to closely related cadherin GPCRs. 14
The parasporal Cry toxins produced by Bti are lethal not only to anopheles mosquitoes but to other mosquito species as well. 3 Examples include the yellow fever mosquito Aedes aegypti (also capable of spreading dengue fever, chikungunya, and Zika fever) and the common house mosquito Culex pipiens, a vector of St. Louis encephalitis, West Nile fever, Western equine encephalitis, heartworm in dogs, and bird malaria. Several of these diseases are of the utmost importance to the tropical and subtropical parts of the world. The Cry toxins contained within the parasporal crystal complex of Bti are Cry4A, Cry4B, Cry10A, and Cry11A, three of which are effective against the mosquitoes mentioned above. 4 The Cry4A and Cry11A toxins are highly toxic to Aedes and Culex species but less so to Anopheles species. The Cry4B toxin is effective against all three mosquito species. The LC50 values of native Cry4B for A. gambiae, A. aegypti, and C. pipiens are 180, 250, and 330 ng/mL, respectively. Toxicity of Cry10A to mosquito has not been documented. The slight variance in specific toxicity most likely is the result of selective binding of the respective Cry toxins to their cognate cadherin GPCRs distinctive to the individual mosquito species. We have focused our research efforts on Cry4B, whose remarkable toxic action against the malaria vector A. gambiae is mediated by the bitopic cadherin BT-R3. 5 Certainly, malaria is a major global health problem. According to the World Health Organization’s (WHO) World malaria report 2021, the number of malaria cases continues to increase – 241 million cases in 2020 (227 million in 2019) and about 627,000 deaths (620,000 in 2019). Worldwide, there are more than 3500 species of mosquitoes which represent the most dangerous creatures on earth. According to the WHO, the diseases spread by mosquitoes have been responsible for killing more people than all the wars in history. Indeed, mosquitoes account for 17% of the estimated burden of infectious diseases (IS Global Annual Report 2017; IS GLOBAL.org) and nearly half of the world’s population currently is at risk for malaria. Malaria occurs sporadically (about 2500 cases per year) in the United States because A. gambiae inhabits most parts of the country. This situation combined with an influx of malaria-infected individuals has brought about increased transmission in various locales of the United States.
Controlling malaria involves antimalarial drugs, vaccines, and insecticides. Although there are several drugs that bring relief to some patients, drug resistance is a major problem in the treatment and prophylaxis of malaria because malaria parasites have developed resistance to a variety of drugs, such as aminoquinolines, artemisinin, and artemisinin-based combination therapies. However, structure-based computationally driven lead optimization programs such as the one designed for a pyrrole-based series of dihydroorotate dehydrogenase inhibitors show good potential for the discovery of candidate antimalarial drugs effective against Plasmodium falciparum and other plasmodium-causative agents of malaria. 15 There is no licensed malaria vaccine on the market today because of the technical complexity of developing such a vaccine although RTS,S/AS01 (Mosquirix®) is a vaccine against malaria caused by P. falciparum that shows promise. Currently, it is in phase 3 trials. Although chemical insecticides are widely used to control insect vectors and insect pests, resistance has been observed in more than 500 species of insects, including approximately 50 species of Anopheles mosquitoes. Pyrethroids, such as Permethrin, is the only class of insecticides recommended by the WHO that currently is available for spray applications and impregnating mosquito nets. Unfortunately, widespread intensive use of Permethrin has placed increased selection pressure on mosquito populations, which has accelerated the spread of resistance by mosquitoes. Because of increasing resistance, there is a great deal of attention being paid to mosquito control by biological insecticides, primarily those based on Bti. The use of Bti has gained prominence because it is efficacious and, so far, there are no recent reports of resistance to Bti by mosquito larval populations that have been exposed for extended periods to the bacterium. Therefore, our goal is to establish a useful platform for structure-based rational design of insecticides that target not only bitopic receptors, such as BT-R3, but additional target molecules in A. gambiae and other mosquitoes as well. We believe that the kind of information provided in this report will enable the design and construction of future bioinsecticides for use against other mosquitoes that transmit infectious diseases. Creation of such a class of insecticides for mosquitoes also should have far-reaching impact on future development of insecticides for a variety of other insects.
To advance our understanding of the mechanism by which the Cry4B toxin kills mosquitoes, we have used a model system established in our laboratory 11 that involves High FiveTM (H5) insect cells stably expressing BT-R3 (M5 cells) and treating them with appropriate concentrations of the toxin. An important advantage of this system is that parental H5 cells do not express the BT-R3 receptor and the Cry4B toxin is not toxic to H5 cells, whereas cells stably transfected with BT-R3 cDNA and expressing BT-R3 (M5 cells) are sensitive to the Cry4B toxin. Based on this system and in vivo experiments using whole mosquito larvae, we discovered in earlier work that the lethal action of the Cry4B toxin is the immediate result of binding of monomeric toxin specifically to the BT-R3 receptor and that the toxin-binding site of the receptor resides within the five most proximal β-barrel cadherin repeats (EC7–EC11) of the extracellular domain (Domain 1) of BT-R3. 5 In this study, we demonstrate that Cry4B as the first messenger exerts its toxic action on the M5 cells stimulating G-protein α-subunit (Gαs) and activating a Mg2+-dependent AC/PKA signaling pathway with a concomitant increase in cyclic adenosine 3′,5′-monophosphate (cAMP) similar to seven-pass (polytopic) GPCRs and as described originally for the Cry1Ab toxin and its associated single-pass cadherin GPCR, BT-R1.11–13 Based on its structural organization and functionality, we refer to BT-R3 as a single-pass cadherin GPCR. Second messenger cAMP generated as a result of AC activation, in turn, actuates its major target PKA. 16 In its activated state, cAMP-dependent PKA stimulates Na+/K+-ATPase (NKA) in the plasma membrane which serves as a signal transducer to transmit messages from the plasma membrane to the nucleus17–19 and as an energy-transducing ion pump.20–22 A consequence of heightened NKA activity is indiscriminate ion flow across the membrane which interferes with a variety of ion concentration gradients. Such impairment is manifested by membrane blebbing and cell swelling followed by cell lysis of M5 cells expressing BT-R3. 5 NKA is ATP-powered and maintains appropriate concentration gradients for Na+ and K+ ions across the plasma membrane by pumping Na+ from the cytoplasm and K+ from the extracellular environment. 23 Such gradients are critical to generating action potentials vital to cell viability. cAMP–PKA also influences transcriptional activation and amplification of second messenger signaling and reprograms the cell, resulting in cell death. Moreover, cAMP signaling engages exocytotic trafficking of BT-R3 to the cell surface, as described for BT-R1, 24 generating more receptor molecules which ultimately amplify the signal cascade established by the initial toxin–receptor interaction. Clearly, NKA, along with cAMP, is involved in the mosquito cell death signaling pathway initiated by Cry4B.
Materials and methods
Purification of native Cry4B toxin
Native Cry4B toxin was obtained from Cry4B protoxin (Mr ~ 130 kDa) contained in parasporal crystals of Bti strain M1 isolated from soil samples collected in the Nile Delta Valley, Egypt. 4 Cry4B protoxin was extracted from parasporal crystals in an alkaline buffer consisting of 50 mM NaHCO3 (pH 8.5), 5 mM DTT, and 2 mM PMSF for 2 h at room temperature. Trypsin activation of the Cry4B protoxin produced Cry4B toxin (65 kDa), which was dialyzed against buffer containing 50 mM Tris-HCl (pH 8.7), 0.15 mM NaCl, and 5% glycerol and purified by anion exchange and gel filtration chromatography using an ÄKTA Fast Protein Liquid Chromatography system (Cytiva). All proteins studied were analyzed by SDS-PAGE. Fractions containing purified Cry4B were pooled, concentrated, and quantified with the Bradford assay reagent (Bio-Rad). Iodination of Cry4B was accomplished with the chloramine-T method. 25 The specific activity of the toxin was determined to be 10−15 mCi/mg by trichloroacetic acid precipitation of the eluate from desalting columns followed by scintillation counting. Protein aliquots were stored at −80 °C.
Larval bioassays
Toxicity assays were done using third-instar larvae of A. gambiae, A. aegypti, and C. pipiens. Eggs from all three species were provided by the MR4/American Type Culture Collection. The eggs were incubated in tap water at room temperature until they hatched (3–5 days). Purified native and recombinant Cry4B toxins were prepared and mixed in 10 mL of deionized water contained in 55 mm Petri dishes to render a series of final concentrations (0.5 × 10²–10.0 × 10⁶ ng/mL). In total, 15 third-instar larvae were placed into individual Petri dishes and held for 24 h at room temperature. The number of dead larvae was recorded, and the lethal concentration required to kill 50% (LC50) of the larvae was determined. All bioassays were done in triplet and replicated a minimum of six times. Survival (%) was calculated by the ratio of (viable larvae/total larvae) × 100.
Cloning and expression of the cry4b gene
Total DNA purified from Bti strain M1 was used as template for PCR cloning of the cry4b gene. The primers used 4 were designed based on the nucleotide sequence of this gene contained in the pBtoxis plasmid 26 of Bti (Accession No. AL731825). The amplified cry4b gene was analyzed in 1% agarose gel and purified. Escherichia coli strains, TOPO10 and BL21 (DE3) (Invitrogen), were used for the manipulation of recombinant DNA and gene expression, respectively. The plasmids pENTR/D-TOPO and pDEST-17 (Invitrogen) were used for cloning and expression, respectively. Plasmids were isolated and transformed into competent E. coli cells, and purified cry4b was cloned in pENTR/D-TOPO and subsequently subcloned in pDEST-17 and transformed into E. coli BL21 for expression under the control of the T7 promoter. Purification of recombinant Cry4B toxin and its identification was accomplished by Western blot analysis using anti-Cry4B antibody and visualizing with rabbit anti-goat antibody coupled with horseradish peroxidase as previously described.4,5
Cloning, sequence analysis, and construction of BT-R3
Cloning and sequence analysis of BT-R3 was performed as previously described 5 and is summarized as follows. Total RNA was purified from third-instar A. gambiae larvae using the RNeasy Mini Kit (Qiagen) and was reverse-transcribed using the appropriate primers. The full-length coding sequence of bt-r3 (5.2 kb) was amplified and cloned in the Gateway Entry vector pENTR/D-TOPO (Invitrogen). The complete nucleotide sequence was determined using a 3730XL Genetic Analyzer (Applied Biosystems). Sequence analysis and alignments were performed using BLAST 2.0 (http://blast.ncbi.nlm.nih.gov/Blast.cgi). Structural features of BT-R3, including signal peptide and transmembrane predictions, were determined based on motif searches using appropriate algorithms. BT-R3 cDNA encoding the BT-R3 protein was cloned into pBluescript (Stratagene) as described earlier. 27 The BT-R3 coding sequence was subcloned in the Gateway destination vector pXINSECT-DEST38 (Invitrogen) between attR1 and attR2 sites by recombination from the pENTR/D-TOPO vector using LR clonase II (Invitrogen). The recombinant plasmids then were transformed to an E. coli OmniMax2 T1 phage-resistant host grown in Luria-Bertani plates containing ampicillin (100 mg/mL) and chloramphenicol (34 mg/mL). Those colonies that grew in ampicillin but not chloramphenicol were identified for further screening. Positive recombinant pXINSECT-DEST38-BT-R3 constructs were confirmed by Sanger sequencing.
Construction of High Five insect cells stably expressing BT-R3 cDNA
The pXINSECT-DEST38-BT-R3 plasmid was purified and used to transfect Trichoplusia ni High Five (H5) insect cells (Invitrogen) using Cellfectin (Invitrogen). The H5 cells (untransfected) were cultured as a monolayer in 25 cm2 tissue culture flasks containing 5 mL of insect-Xpress medium (Lonza) supplemented with gentamicin (10.0 µg/mL; ThermoFisher Scientific). H5 cells transfected with pXINSECT-DEST38-bt-r3 also were co-transfected with the neomycin-resistant plasmid pBmA-neo and were cultured in the insect-Xpress medium supplemented with G418 (Geneticin, 1.5 mg/mL). G418-resistant transfected H5 cells were sub-cultured for several generations to obtain stably transfected cells. H5 cells stably expressing full-length BT-R3 are designated M5. Expression of bt-r3 in M5 cells was confirmed by RT-PCR using the following bt-r3-specific primers: Set 1, F-AACTGAAGGTGTCGGAGAACG; R-CTTGGCACCGCATTGTATTCGT; Set 2, F-GGACGTGCGGAAGTTTCTTG; R-TCCGATTGTAGACTGAGATCGT. Amplification of control genes, actin and α-tubulin, was also accomplished with the following primers: actin, F-ATCGCTGACCGTATGCAGAAG, R-TTCGAGATCCACATCTGCTGG; α-tubulin, F-TTACCGAGTTCCAGACCAAC, R-AAGCAGGCGTTGGTGATCTC. 28 To confirm the expression of BT-R3, plasma membranes were harvested from H5 and M5 cells (1 × 10⁶ each) and suspended in 100 µL of SDS-PAGE sample buffer and heated at 95 °C for 10 min. After brief centrifugation, soluble protein samples were loaded on an SDS-PAGE and resolved electrophoretically. Subsequently, Western blotting was conducted with anti-BT-R3 rabbit antiserum (1:2000) as primary antibody. Horseradish peroxidase-conjugated goat-anti-rabbit antibody (1:10000) was used as secondary antibody. Antibody-saturated membranes were treated with enhanced chemiluminescence (ECL) reagent and analyzed with a ChemiDoc MP Imaging System (Bio-Rad).
Cytotoxicity assays
Cytotoxicity assays were done precisely as described for the Cry1Ab toxin using H5 cells transfected with BT-R1 cDNA. 13 Namely, both H5 and M5 cells were seeded in 96-well plates (1 × 10³ cells/50 µL in each well) and allowed to grow attached to the surface of the plate bottom. Cry4B toxin was prepared in phosphate-buffered saline (PBS) and maintained at room temperature for 20 min after which toxin was added to the cells. All treatments were done in triplicate and repeated six times. Cells treated with toxin were incubated for 4 h at 27 °C. Cell death was determined by Trypan blue exclusion. However, 5 µL of Trypan blue solution (0.4%, wt/vol) was added directly to each well. More than 500 stained cells were viewed and counted immediately under a microscope (×200) per individual treatment. Cells remained attached to the plate bottom during counting and photographing. The number of viable cells (unstained) and dead cells (blue-stained) were recorded photographically for each treatment as were cytological and morphological changes, that is, membrane blebbing and swelling. Viability (%) was calculated by the ratio of viable cells/(dead cells + viable cells) × 100.
Preparation of cell extracts
Cells seeded and allowed to grow as monolayers in 96-well plates were washed in PBS at 4 °C and lysed in CytoBuster protein extraction reagent (Novagen). The lysates were centrifuged at 13,000 g for 10 min at 4 °C, and the supernatants containing intracellular membrane vesicles and soluble proteins were collected and frozen for later use. The pellets, predominantly plasma membrane, were solubilized in membrane protein buffer (5M urea, 2M thiourea, 2% w/v CHAPS and 40 mM Tris-HCl). All experiments involving cell membrane preparations for the detection of BT-R3 were performed with freshly prepared cell lysates.
Inhibitor studies
Cells were seeded in 96-well plates (1 × 10³ cells/50 µL per well) and allowed to grow overnight attached to the bottom surface of the plate. Individual wells containing cell monolayers each were preincubated for 30 min with bafilomycin A1 (200 nm), z-VAD-fmk (100 µM), pefabloc (300 µM), TPCK (300 µM), EGTA (5 mM), EDTA (5 mM), Exo1 (72 µM), NF449 (1 µM), FSK (0.2 µM), ddADP (40 µM), H-89 (5 µM), PKAI 14–22-amide (8 µM), and ouabain (0.5 mM), respectively, before the addition of Cry4B toxin. EDTA-treated cells were incubated with MgCl2 (5 mM), CaCl2 (5 mM), and FSK (0.2 µM), respectively, for 15 min; ddADP-treated cells were incubated with pCPT-cAMP (200 µM) for 30 min; and cells treated with ouabain (0.5 mM) were incubated with 50 mM HEPES (pH 7.4), 5 mM MgCl2, 5 mM ATP, 50 mM NaCl, and 25 mM KCl for 30 min before cytotoxicity assays were performed as described above.
Assay for NKA
Cells were seeded in 96-well plates (1 × 10³/50 µL per well) and allowed to grow overnight as monolayers attached to the bottom of the plates. The cells were harvested in microcentrifuge tubes and, after treatment, they were washed in PBS twice followed by 10 min of centrifugation (10,000 g) at 4 °C. Because NKA hydrolyzes ATP to produce ADP and inorganic phosphorus, the activity of NKA can be calculated by measuring colorimetrically the amount of inorganic phosphorus in a reaction mixture. For such measurement, 100 µL of assay solution (NKA Assay Kit; Assay Genie) was added to the cell pellet, vortexed for 3 s and centrifuged at 8000 g for 10 min, after which 20 µL of supernatant from each tube was assayed colorimetrically by the addition of 200 µL of chromogenic agent. The contents of each tube were transferred to a single well and mixed fully for 10 s in a microplate reader. After incubation at 27 °C for 45 min, the optical density of each well was measured at 660 nm. NKA activity was calculated based on a standard curve that correlates with the amount of inorganic phosphorus generated in the presence of increasing amounts of NKA over time. All measurements were done in quadruplicate. Results are the mean ± SD of six experiments.
Assay for intracellular cAMP
For cAMP measurement, cells were pretreated with 3-isobutyl-1-methylxanthine (0.5 mM), a non-selective, non-specific inhibitor of cAMP and cGMP phosphodiesterases, and planted in 96-well plates, harvested in microcentrifuge tubes, and washed as indicated above. However, 100 µL of assay solution (Bridge-It; Mediomics) was added to the cell pellet and vortexed for 1 s. The contents of each tube were transferred to a single well of a black polypropylene 96-well plate and incubated for 30 min at room temperature. The intensity of fluorescence (excitation, 480 nm; emission, 520 nm) was read with a fluorescence plate reader (DTX 880 Multimode Detector; Beckman Coulter). The cAMP concentration was determined based on a standard curve. All measurements were done in quadruplicate. Results are the mean ± SD of six experiments.
Results
Toxicity of Cry4B to mosquito larvae
The toxicity of the Cry4B toxin – native and recombinant – to third-instar larvae of A. gambiae, A. aegypti, and C. pipiens is summarized in Table 1. Cry4B is highly toxic to all three mosquitoes. As can be seen, the relative amounts of soluble native Cry4B required to kill 50% of third-instar larvae (LC50) of the three species are 1.8 × 10² ng/mL for A. gambiae, 2.5 × 10² ng/mL for A. aegypti, and 3.3 × 10² ng/mL for C. pipiens. The LC50 values for recombinant Cry4B against the three species are similar to native toxin: 2.0 × 10², 5.3 × 10², and 8.1 × 10² ng/mL, respectively. Notably, Cry1Ab (moth toxin) and Cry3A (beetle toxin) were ineffective.
Comparative toxicity of native and recombinant Cry toxins to A. gambiae, A. aegypti, and C. pipiens third-instar larvae.
LC50: lethal concentration required to kill 50%.
All data were subjected to probit analysis.
Genomic organization of the bt-r3 coding sequence
Figure 1 is a summary description and analysis of the bt-r3 coding sequence present in a 40.0 kb DNA fragment of chromosome 2R of A. gambiae. As can be seen in Figure 1(a), the 40.0 kb DNA fragment harbors three genes. Gene II encodes BT-R3. The topology of gene II (Figure 1(b)) reveals (1) transcription start site (TATA-box position, light blue arrowhead), (2) the initial exon (CDSf starting with the start codon, red arrow), (3) 30 internal exons (CDSi, gray bars), (4) the last coding segment (CDSL ending with stop codon, dark blue icon), and (5) a polyadenylation sequence (PolA, green diamond). Figure 1(c) is a diagram of a 7320-base transcript encoded by Gene II. An amplified DNA fragment (5.2 kb) from total RNA of A. gambiae using the primer pair bt-r3-F0/R5 was separated by agarose gel electrophoresis (Figure 1(d)). Figure 1(e) is a representation of the open reading frame (ORF) that encodes BT-R3 based on the cloned and sequenced DNA fragment obtained from the agarose gel. The first 60 amino acids (red letters) deduced from the N-terminus of the bt-r3 ORF (black letters) are presented in Figure 1(f). The complete amino acid sequence is shown in Figure 2.
Genomic organization of the bt-r3 gene. (a) Analysis of the bt-r3 gene present in a 40.0 kb DNA fragment of chromosome 2R of A. gambiae. The 40.0 kb DNA fragment harbors three genes of which Gene II encodes BT-R3. (b) Topology of gene II showing transcription start site (TATA-box position, light blue arrowhead), the initial exon (CDSf starting with the start codon, red arrow), 30 internal exons (CDSi, gray bars), the last coding segment (CDSl ending with stop codon, dark blue icon), and a polyadenylation sequence (PolA, green diamond). (c) Cloned 7320-base transcript (solid black bar, 1-7320). (d) Agarose gel image of amplified cDNA fragment (5.2 kb) from total RNA of A. gambiae using the primer pairs bt-r3-F0/R5. (e) ORF encoding BT-R3. (f) N-terminus of the BT-R3 ORF (amino acids in red; deoxynucleotides in black).
Annotated amino acid sequence of BT-R3.
Domain structure of BT-R3
The annotated amino acid sequence of the BT-R3 molecule is presented in Figure 2. BT-R3 cDNA was cloned in pENTR-D-TOPO and sequenced. The amino acid sequence was deduced from the nucleotide sequence of bt-r3 (GenBank Accession No. KC310451). The domain structure was derived from genomic and phylogenetic analyses as described for the cadherin superfamily. 29 As portrayed, full-length BT-R3 consists of 1735 amino acids. BT-R3 contains a single-membrane-spanning α-helical structure characterized by an N-terminal signal peptide (25-amino acids, 12LR37, bold green) with a putative peptidase recognition site at 20CQ21 and four domains: Domain 1 (ectodomain, EC) which contains 11 cadherin repeats (171FE1466) aka ectodomain modules (EC1−EC11, each marked with an arrow and red letters); Domain 2 (membrane proximal extracellular domain, MPED, amino acids 1467ET1582, bold magenta letters); Domain 3 (transmembrane domain, TM, 1583LI1597, bold red letters); and Domain 4 (cytoplasmic domain, CYTO, 1598RF1735, bold aqua letters). There are 10 predicted calcium-binding motifs – DRD, DPD, or DYD highlighted in bold blue – distributed throughout Domain 1 and one DRE motif located in EC 10 (bold blue). There is one DRD motif in Domain 4 (underscored). Also, two putative integrin recognition motifs, RGD and LDV (bold blue letters), were identified near EC1 and EC5, respectively. BT-R3 contains no cadherin-binding sequences (HAV) as do moth GPCR BT-R’s. 14
Cloning and expression of BT-R3 cDNA
The cDNA encoding BT-R3 (GenBank: KC310451) was cloned into the plasmid vector pXINSECT-DEST38 (Invitrogen) between the attR1 and attR2 recombination sites as illustrated in Figure 3(a). This vector consists of actin promoter and half of the cytoplasmic actin A4 coding region as well as the polyadenylation signal from Bombyx mori. The resulting plasmid construct was confirmed by Sanger sequencing. H5 cells were transfected with the pXINSECT-DEST38-BT-R3 plasmid and pBmA:neo (Invitrogen) in a 1:10 ratio. Stable cells were selected in the presence of G418 (1.5 mg/mL). A BT-R3 expressing clone was isolated and designated as M5. To determine expression in the M5 cells, total RNA was extracted from H5 and M5 cells followed by reverse transcription as described in the “Materials and methods” section. Polymerase chain reactions were conducted using two different sets of BT-R3 primers, Trichoplusia ni actin and α-tubulin primers. 28 Figure 3(b) shows that the PCR reactions with both sets of BT-R3 primers specifically produced amplification products in Lane 2 (plasmid control) and Lanes 5 and 6 (cDNA from M5 cells), demonstrating expression of BT-R3 transgene in the M5 cells but not in the H5 cells (Lanes 3 and 4). Transcripts of actin and α-tubulin, two internal control genes, were detected in both H5 (Lanes 3 and 4) and M5 (Lanes 5 and 6) cells. Because of the highly homologous nature of the actin genes in B. mori and T. ni, the B. mori actin fragment in the plasmids was also amplified with this set of primers, whereas α-tubulin fragments were amplified only from the H5 and M5 cDNA samples (Lanes 3–6). These results demonstrate that the M5 cells were successfully transfected. Cell membrane harvested from both H5 and M5 cell lysates was analyzed by immunoblotting using anti-BT-R3 antiserum. Figure 3(c) reveals a discrete protein band (Mr ~ 230 kDa) present in M5 (Lanes 2 and 3) but not in H5 cell membrane (Lane 1). This transcription/translation system provides a reliable and efficient means for stably producing BT-R3 and related proteins.
Cloning and expression of bt-r3. (a) Map of recombinant plasmid pXINSECT-DEST38-BT-R3. (b) Transcription of BT-R3 transgene in M5 cells. Total RNA samples were prepared from H5 (untransfected) and M5 (transfected) cells as described in the “Materials and methods” section. Reverse-transcribed cDNA samples and plasmids were PCR amplified using two BT-R3 primer sets, actin primers and α-tubulin primers, as indicated. Agarose gel images of pXINSECT-DEST38 cDNA and pXINSECT-DEST38-BT-R3 cDNA (Lanes 1 and 2, respectively). Lanes 3 and 4 are duplicates of H5 cDNA, and Lanes 5 and 6 are duplicates of M5 cDNA, respectively. (c) Expression of BT-R3 in M5 cell membrane preparations is shown in duplicate immunoblots (Lanes 2 and 3, arrows). Molecular weight of the BT-R3 protein is ~230 kDa. No such protein was apparent in H5 cell membrane (Lane 1).
Cytotoxicity of Cry4B toxin
Stably transfected M5 cells expressing BT-R3 cDNA as evidenced by RT-PCR (Figure 3) were killed by the Cry4B toxin (Figure 4). M5 cells not exposed to toxin exhibited normal cell growth and cell division (Figure 4(a), upper right panel) similar to normal H5 cells (Figure 4(a), upper left panel). However, M5 cells treated with toxin did undergo dramatic cytological and morphological modifications (Figure 4(a), lower right panel, arrows point to cell surface blebs) in contrast to toxin-treated H5 cells that showed no such effects (Figure 4(a), lower left panel). M5 cells were sensitive to Cry4B in a dose-dependent manner, whereas H5 cells were insensitive to the toxin (Figure 4(b)). The LC50 value, the concentration of Cry4B toxin required to kill 50% of the M5 cell population, is 79.3 nm. The morphological and cytological changes, which were sequential, are presented in Figure 4(c) in much the same format as reported earlier 5 but with photographs representing new and separate experiments. For point of reference, the pathway leading to cell death occurred in several stages marked by physical modifications to the cell membrane and to the whole cell itself, that is, membrane blebbing and ruffling (20 min after toxin exposure, center frame), cell swelling accompanied by nuclear swelling without intra-nucleosomal DNA fragmentation (40 min after toxin exposure, right frame) followed by lysis. The cells in the far left frame were recorded at 10 min after addition of Cry4B toxin and binding to BT-R3.
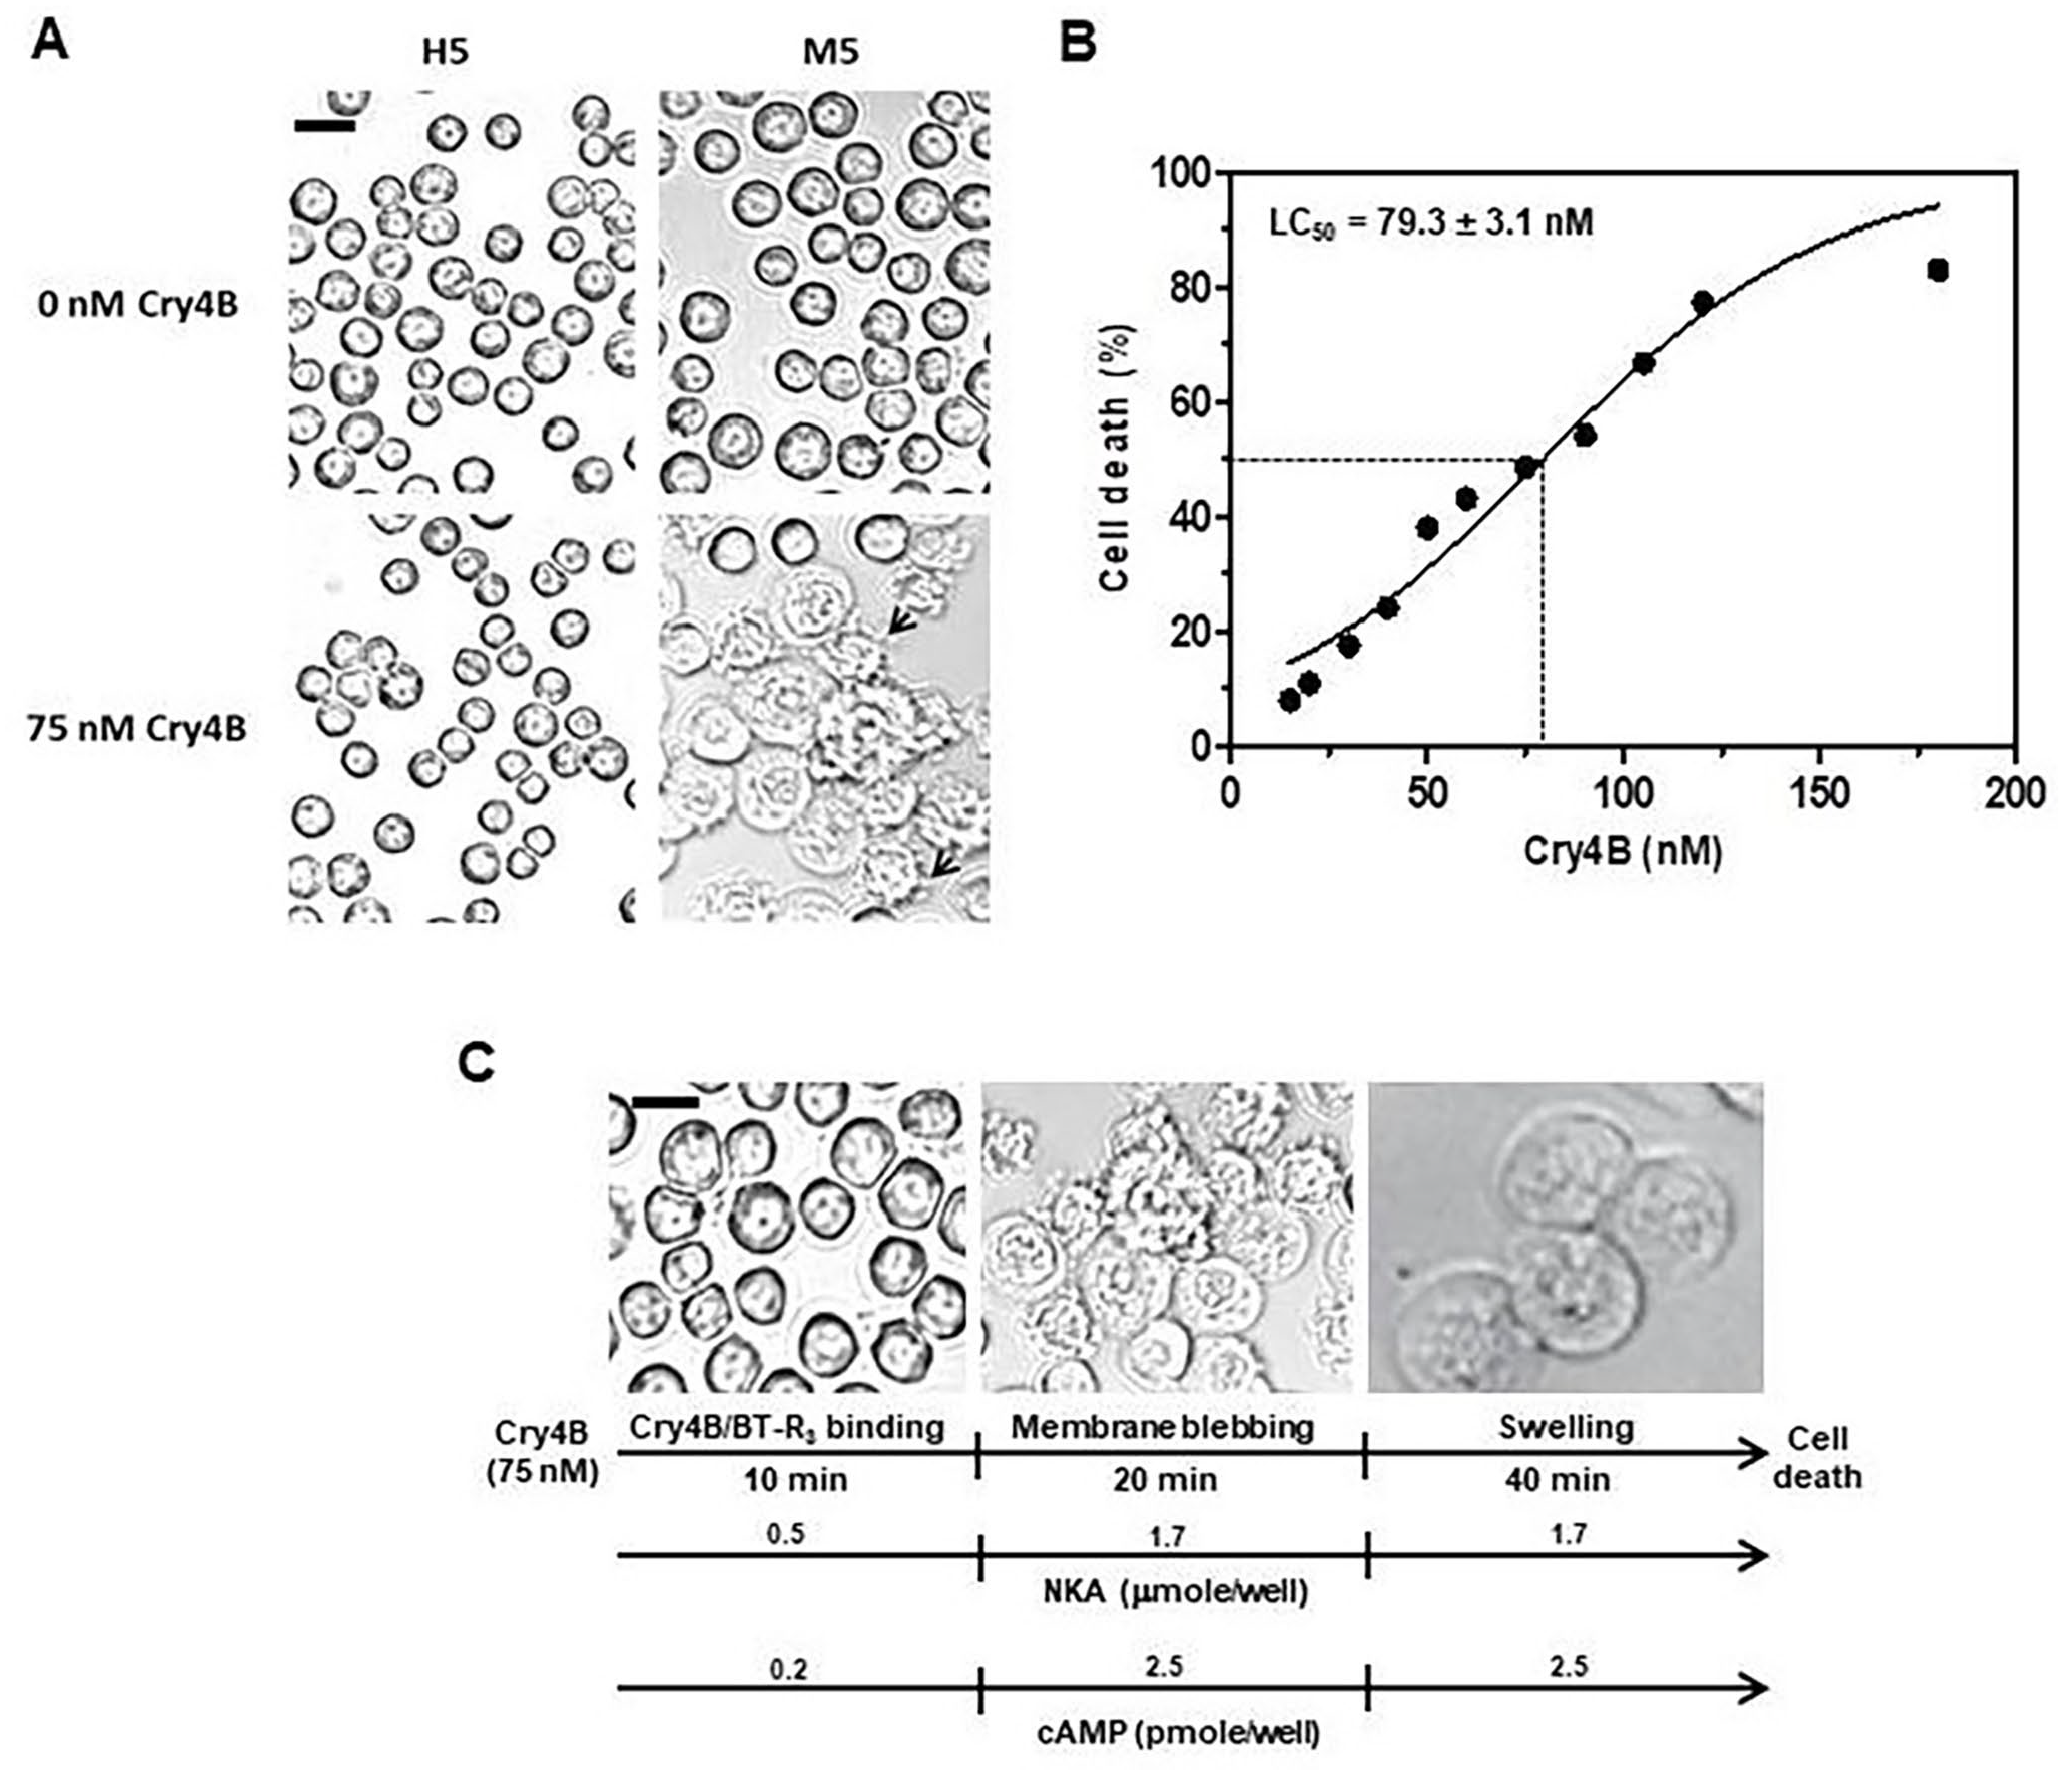
NKA and cAMP activities associated with the progression of Cry4B-induced cell death. (a) Selective cytotoxicity of Cry 4B toxin to M5 cells. Upper left panel, untransfected cells (H5) with no toxin treatment; upper right panel, transfected cells (M5) with no toxin treatment; lower left panel, H5 cells treated with toxin (79.3 nm); lower right panel, M5 cells treated with toxin (79.3 nm). Arrows point to cell membrane blebbing. (b) Dose-dependent response of M5 cells to increasing amounts of Cry4B toxin. The lethal concentration of Cry4B that kills 50% of the M5 cells (LC50 value) is 79.3 nm. Data are presented as the mean ± SD for results from six independent experiments done in triplicate. Curve fit was performed with non-linear regression using GraphPad Prism 5 software. (c) Sequential cytological changes of M5 cells exposed to Cry4B toxin. The pathway leading to cell death occurred in several stages marked by physical modifications to the cell membrane and to the whole cell itself (membrane blebbing and ruffling 20 min after toxin exposure, center frame) and cell swelling accompanied by nuclear swelling without intra-nucleosomal DNA fragmentation (40 min after toxin exposure, right frame), followed by lysis (not shown). Cells in the far left frame were recorded at 10 min after Cry4B toxin addition. The activity of NKA and the level of cAMP during the progression of oncotic cell death are designated by long arrows below the photographs with time indicators (vertical bars) showing a 3.4-fold increase (0.5→1.7 µmole/microtiter well) in NKA activity and a concomitant 12.5-fold increase (0.2→2.5 pmole/well) in cAMP production. Scale bars = 10 µm.
Cry4B cytotoxicity is Mg2+-dependent. As shown in Table 2, EDTA, not EGTA, prevented toxin-induced cell death. EDTA chelates Mg2+ and Ca2+, which inhibited cell death, whereas EGTA selectively chelates Ca2+ but did not inhibit cell death. Hence, our interest in determining the effect of Mg2+ on the cytological changes in M5 cells associated with the progression of Cry4B toxin-induced cell death. In summary, supplementation with EDTA (5 mM) prevented both membrane blebbing/ruffling and swelling (see Figure 4(c) photographs for reference) of the M5 cells, whereas EGTA at the same concentration did not. The EDTA-treated M5 cells retained their normal form and shape throughout the entire experiment (40 min). Addition of Mg2+ (5 mM) to the EDTA-treated cells restored toxin-induced cellular blebbing and swelling. The addition of Ca2+ (5 mM) had no such effect. Obviously, removal of Mg2+ by EDTA prevented blebbing, swelling, and death of the M5 cells. As was true for H5 cells transfected with BT-R1 cDNA,11,12 a Mg2+-dependent signaling pathway was established upstream of the blebbing stage in M5 cells expressing the bt-r3 gene (Figure 4(c), far left panel), pointing up the critical nature of Mg2+ in Cry4B toxin-induced cell death.
Features of Cry4B toxin-induced cell death.
z-VAD-fmk: methyl (3S)-5-fluoro-3-[[(2S)-2-[[(2S)-3-methyl-2 (phenylmethoxycarbonylamino)butanoyl]amino]propanoyl]amino]-4-oxopentanoate; Pefabloc: 4-[2-aminoethyl]benzenesulfonyl fluoride; TPCK: L-1-tosylamido-2-phenylethyl chloromethyl ketone; EGTA: ethylene glycol tetraacetic acid; EDTA: ethylenediaminetetraacetic acid; NF449: (4,4′,4″,4′″-[carbonyl-bis[imino-5,1,3-benzenetriyl bis-(carbonylimino)]]tetrakis-(benzene-1,3-disulfonate); ddADP: 2′,5′-dideoxyadenosine 3′-diphosphate; H-89: N-[2-(p-bromocinnamylamino)ethyl]-5-isoquinolinesulfonamide; PKAI 14-22: Thr6-Tyr-Ala-Asp-Phe-Ile-Ala-Ser-Gly-Arg-Thr-Gly-Arg-Arg-Asn-Ala-+ ++Ile22-NH2; Ouabain: C29H44O12; Exo 1: 2-(4-fluorobenzoylamino)-benzoic acid methyl ester; ARF1 GTPase: GTPase ADP-ribosylation factor 1; cAMP: cyclic adenosine monophosphate; ATP: adenosine triphosphate.
Cells were preincubated with inhibitors for 30 min and switched into inhibitor-free buffer (10 min) before Cry4B toxin treatment (20 min). Controls included treatment of M5 cells with Cry4B alone (no inhibitors) which initiated cell death, treatment of H5 (untransfected) cells with Cry4B (with and without inhibitors) which represented < 1% dead cells and treatment with inhibitors alone (no Cry4B) none of which occasioned cell death.
Trypan blue staining was used to calculate the percentage of dead cells in the total population. +represents 80% ± 5% cell death; − indicates no cell death. Data represent the mean ± standard deviations of six independent experiments performed in triplicate.
Effects of selective inhibitors on intracellular signaling and cell death
Because RNase activity in the High Five cells contributed to low RNAi efficiency, we elected to use a series of specific inhibitors to determine what components are involved in cytotoxicity. In this study, all inhibitors were added to the M5 cells before toxin addition. Cells treated with inhibitors that did not prevent cell death underwent the same morphological changes (blebbing and swelling) as those cells not exposed to the inhibitors, and they did not preclude cell death as revealed by Trypan blue exclusion analysis (Table 2). The inhibitors included bafilomycin A1 (selectively inhibits vacuolar H+-ATPases), 30 z-VAD-fmk (inhibits apoptosis by blocking the processing of CPP32, a cysteine protease), 31 Pefabloc (irreversibly inhibits serine proteases), 32 TPCK (irreversibly inhibits serine, cysteine, and threonine proteases), 33 and EGTA (chelates Ca2+ with a very high specificity [Kd = 60.5 nm] compared to Mg2+ [Kd = 1–10 mM]). In short, M5 cells treated with these inhibitors proceeded to cell death when exposed to Cry4B in the same manner as cells exposed to toxin alone (see Figure 4(c) for reference). Importantly, the Cry4B toxin was not internalized at either stage of cytotoxicity (blebbing or swelling) as revealed by fluorescence microscopy (not shown). Also, no fragmentation of DNA in the toxin-treated cells was observed. These observations together with the microscopic and inhibitor studies demonstrate that neither apotosis nor endocytosis is involved in cell death. Rather, oncosis is the most accurate mechanistic description of the dying cells which are characterized by membrane blebbing and cell swelling – manifestation of the depletion of cellular energy reserves and failure of ionic pumps in the plasma membrane. 34
Role of cAMP in Cry4B-induced cell death
Cyclic AMP is a second messenger instrumental in the normal operation of cellular pathways that support the health and well-being of all living cells. The proper level of intracellular cAMP, regulated by the balance between AC and cyclic nucleotide phosphodiesterase activities, is critical to a cell’s response to various external stimuli, such as hormones, toxins, and neurotransmitters. 12 For A. gambiae, AC is activated downstream of BT-R3 by interacting with the α-subunit of Gαs, which is released upon the binding of Cry4B to BT-R3. In turn, activated AC stimulates cAMP-dependent PKA, and elevation of intracellular cAMP levels is indicative of initiation of the AC/PKA pathway. 12 Figure 4(c) summarizes the level of cAMP in Cry4B-exposed M5 cells. As a result of toxin exposure, there was an upsurge in cAMP production from 0.2 to 2.5 pmole/well, a 12.5-fold increase as the cells entered the membrane blebbing stage that remained constant through the swelling stage until cell lysis. Forskolin (FSK, 0.2 µM), a direct activator of membrane AC, 35 elicited a similar response in cAMP production (not shown). As indicated in Table 2, Mg2+ is indispensable to Cry4B-induced cell death. For this reason, we were interested in knowing what effect EDTA has on Cry4B-induced cAMP levels in M5 cells. Pretreatment of M5 cells with EDTA (5 mM) followed by the addition of Cry4B virtually eliminated any increase in cAMP levels compared to cells not treated with EDTA (not shown). Obviously, chelation of Mg2+ crippled production of cAMP. Furthermore, the cells did not progress through the stages of membrane blebbing and cell swelling characteristic of oncotic cell death as visualized in Figure 4(c). Also, that the level of cAMP remained unchanged in untransfected H5 cells treated with Cry4B further substantiates that the binding of Cry4B toxin to BT-R3 is central to enhanced production of cAMP. Most certainly, increase in the level of cAMP correlates with toxin-induced death of the M5 cells.
Involvement of Gαs and AC in Cry4B cytotoxicity
AC converts 5′-ATP to 3′,5′-adenosine monophosphate and pyrophosphate. Membrane-bound ACs typically are composed of two clusters of six transmembrane domains separating two intracellular, overlapping catalytic domains that are targeted by Gαs, the stimulatory G-protein α-subunit. Most 2′,5′ dideoxyadenosine 3′-polyphosphates, such as 2′,5′-dideoxyadenosine 3′-diphosphate (ddADP) are physiological inhibitors of AC activity.36,37 As surmised from the results in Table 2, Gαs and AC are the components of a signaling pathway that lead to cell death. M5 cells preincubated (30 min) with cell-permeable NF449 (1 µM), a potent purinergic receptor and Gαs-selective G protein antagonist which suppresses the rate of GTP binding to Gαs and inhibits the stimulation of AC activity,38,39 were 67% less sensitive to the Cry4B toxin than untreated cells (Bar 2, Figure 5). Also, ddADP (40 µM) dramatically reduced the number of cells undergoing Cry4B-induced cell death by 78% (Bar 3, Figure 5). Control cells (Bar 1, Figure 5) were those administered Cry4B toxin at 79.3 nm (the concentration required to kill 50% of the M5 cells) in the absence of inhibitors. Notably, the cAMP analogue pCPT-cAMP (200 µM) and the AC activator FSK (0.2 µM), neither of which alone was sufficient to mediate toxicity, synergistically enhanced the cytotoxic effect of Cry4B (74% and 96%, respectively; bars 6 and 8, Figure 5). Even in the presence of the AC inhibitor ddADP (40 µM), pCPT-cAMP heightened the number of dead cells to 70% (Bar 7, Figure 5), compared to 50% viability of toxin-treated control cells (Bar 1, Figure 5). Obviously, the activation of Gαs protein and the concomitant stimulation of AC increased production of second messenger cAMP, corroborating the direct involvement of AC and cAMP in cell death.
Molecular components involved in cytotoxicity.
Involvement of PKA, NKA, and exocytosis in Cry4B cytotoxicity
PKA (aka cAMP-PKA) adds phosphate groups to proteins and, in so doing, delivers cellular signals or messages in a cascade-like manner that regulate energy utilization in cells. 40 Binding of Cry4b to BT-R3 stimulates production of cAMP (Figure 4(c)) which, in turn, activates PKA. As seen in Table 2 and Figure 5 (Bars 4 and 5), pretreatment of M5 cells with the PKA inhibiters H-8941–43 and PKAI 14–22-amide44,45 protected the cells from death. On preincubation with the two inhibitors followed by the addition of Cry4B toxin, H-89 (5 µM) and PKAI 14–22-amide (8 µM) blocked cell death (2% and 6% dead cells: Bars 4 and 5, respectively), demonstrating abolition of Cry4B toxin action by PKA. Remarkably, all the features of oncosis – membrane blebbing, cellular swelling, and cell lysis – were prevented by PKA inhibition, underscoring the prominence of cAMP-dependent PKA in Cry4B toxin action. Clearly, Cry4B binding to and stimulation of BT-R3 coupled to the Gαs protein relays a molecular signal in a sequence of events beginning with AC/PKA activation.
We believe that NKA, a specific PKA-dependent effector, is stimulated by Cry4B and facilitates downstream activity associated with cell death. NKA is an ATP-powered ion pump that establishes concentration gradients for Na+ and K+ ions across the plasma membrane by pumping Na+ from the cytoplasm and K+ from the extracellular medium. Such gradients are involved in a variety of essential processes – notably, generating action potentials. Curiously, the distribution of NKA in insect tissues varies among species. For example, the midgut of lepidopterans (moths) has relatively low levels of NKA46,47 but is much higher in neuronal tissue. 48 The enzyme occurs in Malpighian tubules, indirect flight muscles, tubular muscles, and throughout the nervous system but not in the midgut of Drosophila melanogaster. 49 Mosquitoes, instead, have high levels of NKA in their midguts, for example, A. aegypti 50 and anopheles mosquitoes A. stephensi and A. gambiae. 51 Apparently, ion concentration gradients are maintained in insect midgut epithelial tissue deficient in NKA by a combination of H+/K+-ATPase and anion-dependent transport mechanisms. 51 To determine the presence of NKA activity in M5 cells, the amount of inorganic phosphorus produced by hydrolysis of ATP was measured colorimetrically in a reaction mixture described in “Materials and methods.” For such measurement, 100 µL of NKA assay solution (Assay Genie) was added to cell preparations contained in single wells of microtiter plates to which 200 µL of chromogenic agent was added after incubation of the mixtures for 45 min. The activity of NKA in toxin-treated cells increased 3.4-fold (0.5→1.7 µmole/microtiter well) compared to cells prior to toxin addition (Figure 4(c)). Pretreatment of M5 cells with the NKA inhibitor ouabain (0.5 mM) in a buffer containing 5 mM MgCl2, 5 mM ATP, 50 mM NaCl, and 25 mM KCl to which Cry4B was added had virtually no effect on cell viability (4% non-viable cells, Bar 9, Figure 5; Table 2). Because Mg2+ is essential to NKA activity, 52 EDTA (5 mM) was added to the reaction mixture. The resultant inhibition of NKA activity correlated with no cell death and attendant membrane blebbing and cellular swelling (not shown). Addition of Mg2+ (5 mM) to the EDTA-treated cells partially restored NKA activity (0.5 µmole/microtiter well) with ensuing cellular blebbing and swelling (not shown).
Exocytosis involves trafficking of secretory vesicles to the plasma membrane and fusion with the membrane, discharging their content into the extracellular space and incorporating newly synthesized proteins into the plasma membrane. To determine whether trafficking of newly synthesized BT-R3 is occasioned by exocytotic action as observed with BT-R1, 24 M5 cells were incubated with Exo1 (72 µM), a specific cell-permeable exocytosis inhibitor, 53 followed by the addition of toxin. Cells treated in such a manner retained their normal shape and size, and essentially no cell death (2%) occurred (Bar 10, Figure 5; Table 2). Evidently, Cry4B toxin-induced cell signaling promotes exocytotic trafficking of BT-R3 to the cell surface. Increase in BT-R3 molecules on the cell surface provides the Cry4B toxin additional binding targets. Thus, enrichment of receptor molecules on the cell surface recruits more toxins, amplifying the signal cascade initialized by toxin–receptor interaction.
Discussion
In this study, we provide the first evidence of a bacterial toxin engaging NKA through receptor-mediated activation of AC/PKA signaling that leads to cell death. Furthermore, activation of the AC/PKA signal transduction pathway by the Cry4B toxin propels exocytosis of the cadherin GPCR BT-R3 together with other downstream biochemical events. Stimulation of Gαs and AC along with increased levels of cAMP and NKA and activation of PKA (Figures 4 and 5) are prominent features of cAMP-PKA involvement in insect cell death. Preventing the production of cAMP by the inhibitors of Gαs (NF449) and AC (ddADP) significantly reduced Cry4B cytotoxicity, whereas the activator (FSK) and the stimulator (pCPT-cAMP) of cAMP sensitized the cells and enhanced cytotoxicity. Pretreatment of M5 cells with inhibitors of PKA (H-89 and PKAI 14–22-amide), NKA (ouabain), and exocytosis (Exo1) protected the cells from Cry4B toxin action (Figure 5). The mechanism of Cry4B-induced cell death involves several signaling activities and biochemical events some of which are exclusive to the cell membrane and are directly related to G protein activation. The ensuing downstream activities are manifested by physical cellular changes marked by increased levels of cAMP and NKA activity. The sequence of physical (blebbing and ruffling) and morphological (cell swelling) changes correlates to pronounced increases in cAMP and NKA (Figure 4(c)). Moreover, monomeric binding of Cry4B to BT-R3 is linked to Mg2+-dependent signaling, which is established upstream of the blebbing stage. EDTA, not EGTA, completely abolished toxin-induced death of the M5 cells (Table 2) – no cellular blebbing and swelling as depicted in Figure 4(c). In contrast, cells pretreated with EGTA were fully susceptible to the Cry4B toxin, indicating that Ca2+ is not involved although it most likely is required to maintain the structural integrity of BT-R3 (note, the number of calcium-binding motifs distributed throughout Domain 1 of the receptor, Figure 2) and adhesion of midgut epithelial cells as described for BT-R1.54,55 Remarkably, addition of Mg2+ to the EDTA-treated cells restored NKA activity associated with the cytological changes accompanying cell death. Ca2+ had no such effect. These results combined with the inhibitor studies presented herein demonstrate the direct involvement of Gαs, AC, cAMP, PKA, NKA, and exocytosis in the cell death pathway.
A model for Cry toxin action is presented in Figure 6 and is based on binding of the first messenger Cry4B to BT-R3 and downstream activation of the second messenger cAMP. Illustrated is the activation of AC by interaction with the α-subunit of the Gs protein (αs). αs is released from the heterotrimeric αβγ-G-protein complex and binds to and activates AC. As a consequence of AC activation, cAMP is generated which, in turn, activates the effector cAMP-dependent PKA, ultimately stimulating NKA. NKA acts as a Na+/K+ pump, maintaining a gradient of a higher concentration of sodium extracellularly and a higher level of potassium intracellularly. Sustaining this concentration gradient is crucial for a variety of physiological processes and is essential to stabilizing the resting membrane potential of the cell, regulating the cell volume and ensuring proper signal transduction. Increasing or inhibiting NKA activity can have a deleterious effect on various cellular functions, resulting in diverse pathological states and cell death. NKA also is a scaffolding protein and, as portrayed in the model, lies downstream of BT-R3 and AC within the cell membrane where it is in position to relay the initial message in an accelerated manner from the cell membrane to the nucleus. It also is strategically placed to influence various signal transduction cascades. One such cascade involves the enhanced exocytotic trafficking of BT-R3, presumably carried by intracellular secretory vesicles (aka membrane-bound transport vesicles) to the plasma membrane. Major components of such vesicles are membrane trafficking proteins, which are substrates for phosphorylation by cAMP-PKA, 56 and most likely are involved in transport and trafficking of BT-R3 to the plasma membrane. It may be that fusion of the secretory vesicle membranes with the plasma membrane and the secretion of BT-R3 from the fused vesicles is modulated by cAMP-PKA phosphorylation of the membrane trafficking proteins. Thus, cAMP-PKA is central not only to the signaling activities associated with cell death but also to hastening the terminal event itself. Additional studies are needed to determine involvement of trafficking proteins in BT-R3 exocytosis. As verified by the Exo1 inhibitor experiments (Table 2, Figure 5), exocytosis of BT-R3 is required for effective cell killing because inhibition of receptor transport by Exo1 blocks toxin-induced cell death. The consequent accumulation of BT-R3 on the cell surface provides a staging area for additional toxin binding and facilitates recruitment of additional toxin molecules which, in turn, amplify the original signal in a cascade-like manner. BT-R3 is among a small number (5–10%) of exclusive GPCRs that possess an N-terminal signal peptide. 57 One important function of signal peptides is regulation of the density of GPCRs in the plasma membrane as well as in receptor dimerization and coupling selectivity.57,58 BT-R3 features an N-terminal signal peptide (12LR37) containing a putative peptidase recognition site at 20CQ21 (Figure 2). Having this signal peptide assures efficient and coordinated binding of Cry4B toxin to the vastly expanded population of BT-R3 molecules on the cell surface as a result of enhanced exocytosis. Escalation in toxin binding amplifies signaling kinase PKA activity, which modifies downstream effectors/executioners that drive the biochemical events culminating in oncotic cell death as evidenced by rearrangement of the cytoskeleton (membrane blebbing and ruffling) and unregulated ion channeling via disruption of the Na+/K+ pump (cell swelling).
Proposed model for Cry4B toxin action.
The killing efficiency of Cry4B for live intact larvae of A. gambiae, A. aegypti, and C. pipiens is extremely high as evidenced by the comparative toxicities of both native and recombinant proteins (Table 1). The average LC50 value for the three mosquitoes is 250 ng/mL, compared to an average value of 3.0 ng/mL established previously for the same three species using whole parasporal crystals purified from Bti. 2 It is unsurprising that the parasporal crystals have a higher level of toxicity. They contain the three Cry toxins Cry4A, Cry4B, and Cry11A each of which is quite effective against larvae of the three mosquito species. This phenomenon almost certainly contributes to the lack of observed resistance by A. gambiae to Bti. In addition to the cumulative toxicity of the three proteins, they are less exposed to direct assault by mosquito midgut juice heavily laden with a variety of proteolytic enzymes. Because no field trials have been performed with any of the three individually purified toxins, little can be said about mosquito resistibility to the toxins. However, the consequence of widespread and extensive use of the three toxins singularly in all likelihood would generate selective pressure on any mosquito population thusly exposed. The upshot would be an increase in resistance frequency. Although the molecular mechanisms of insect resistance to Cry toxins generally are diverse and complex, some of the primary contributing factors involving Cry4B may well include target GPCR modification, alteration in membrane permeability, disruption of ion pump proficiency, active site modification of AC, PKA, and NKA, and other associated enzymes as well as genomic duplication. Utilization of other Cry toxins produced by various subspecies of Bt in concert with Bti Cry toxins has not been studied but such a strategy might hold merit in limiting or decreasing resistance frequency in mosquito.
Working with purified receptor and toxin facilitates the identification and localization of the toxin-binding sites in BT-R receptors. For example, the binding site within the tobacco hornworm receptor, BT-R1, for the Cry1Ab toxin has been defined, mapped, and its structure resolved. 13 As is true for Cry1Ab binding to BT-R1, binding of Cry4B to BT-R3 is localized in the proximal-most cadherin repeat in Domain 1 – EC11 in BT-R3 and EC12 in BT-R1. Although defining the specific sequence of amino acids in BT-R3 was not an objective of this study, we have evidence (not shown) that places the Cry4B toxin-binding site exclusively within 1359IS1464 of EC11. Current studies in our laboratory involve fine mapping the EC11 module and determining the structure of the toxin-binding site in BT-R3.
According to the WHO’s World malaria report 2015, “mosquito control is the only intervention that can reduce malaria transmission from very high levels to close to zero.” Most assuredly, controlling mosquito vectors is a highly effective means to prevent transmission of malaria. Because of increasing resistance by mosquitoes to chemical insecticides, and due to the paucity of effective and efficacious drugs and vaccines against malaria parasites, biorational control of mosquito populations is a commonsense approach to fighting malaria. Thus, construction and development of mosquito control agents based on Bti Cry toxins that interact with mosquito GPCRs and bring about deleterious effects to the mosquito is the most promising strategy. The signaling pathways modulated by GPCRs as portrayed in Figure 6 provide a variety of potential insecticide targets. In addition to the receptors themselves, various molecular components that constitute the intracellular pathways activated by the binding of ligands such as Bt Cry toxins to GPCRs are prospective candidates as well.
Footnotes
Author’s Contributions
Both authors participated in the experimental design, performance of the studies, analysis, and interpretation of the data and writing of the manuscript. LAB procured funding for the studies.
Declaration of conflicting interests
The author(s) declared no potential conflicts of interest with respect to the research, authorship, and/or publication of this article.
Funding
The author(s) disclosed receipt of the following financial support for the research, authorship, and/or publication of this article: This work was partially supported by a grant from the National Science Foundation (Award No. 0412257) to LAB and by institutional funds from the University of Texas at Dallas awarded to LAB