
Abstract
This study problematizes the common discourse that rapid and widespread Latina/o demographic growth in the United States is a driving force in realizing higher education equity gains. Using equity indices for students, faculty, and administrative leaders at the state level, we present a portrait of changes in Latina/o participation in higher education over the last decade and propose a classification scheme for understanding variation across states at the intersection of changes in both demographics and equitable participation.
The rapid and widespread growth of the Latino population in the United States is a well-documented demographic phenomenon that warrants the increasing but overdue attention it is receiving. Latina/os comprised 16.7% of the U.S. population in 2011, up from 12.5% in 2000, a 47.5% increase. Widely cited projections indicate an increase to 29% of the population by 2050 (Passel & Cohn, 2008; Pew Hispanic Center, 2013). Notwithstanding this growth in the general population, Latina/os remain underrepresented in college at 19% of the student body at 2-year public colleges and only 12% in public 4-year colleges (“Racial and Ethnic Representation,” 2014). Despite increases in K-12 enrollment, high school graduation rates, and college-going rates (Fry & Lopez, 2012; Fry & Taylor, 2013; Murnane, 2013), persistent racialized barriers outside and inside of higher education work against the educational attainment of Latina/os (Crisp & Nora, 2010; Solórzano, Villalpando, & Oseguera, 2005). This inequity exists across all higher education sectors (National Center for Education Statistics, 2013) but especially implicates the public postsecondary sector charged with serving the public good.
Issues of equity in public higher education are worse among the faculty and administrative ranks than for students. Nationally as of 2011, only 5.1% of faculty members at public 2-year higher education institutions were Latina/os and 4.3% at public 4-year institutions. Of the executive administrative and managerial ranks, only 5.7% were Latina/os in public community colleges and 5.1% in the public 4-year sector (“Race and Ethnicity of College,” 2014). As opposed to increases in Latina/o student enrollment in both numeric and relative terms among the student body, the proportion of Latina/o faculty and executive leadership ranks has seen very low gains despite moderate increases in the overall numbers hired and retained (Harvey & Anderson, 2005; Urrieta & Chávez-Chávez, 2010).
This inequitable state of affairs for Latina/o enrollment, persistence, hiring, employee retention, and leadership in higher education, is for the most part well documented. However, most published empirical studies that address the issues and their implications are conducted at the local or state level, with widely reported national-level trends serving only as the backdrop to particular empirical or theoretical studies, in the very way this article begins—this despite widely available disaggregated data. Perna, Li, Walsh, and Raible (2010) emphasized that our understanding of the magnitude of the problem is limited precisely due to the rapid rate of overall population growth combined with variations in this change across the 50 states and variations in changes in the educational attainment rates of Latina/os throughout the sequence of credentials needed to qualify for further education and employment. Although traditional Latina/o population centers such as Texas, Florida, and California, to name the three most populous Hispanic states, are projected to confer increasingly more degrees to Latina/os compared with other states (Santiago, 2010), the greatest rate of growth is in new Latino destinations throughout the United States rather than in traditional gateways (Frey, 2014; A. Singer & Suro, 2002). This phenomenon, called by some the New Latino Diaspora (Hamann & Harklau, 2010; Murillo & Villenas, 1997), comprises new immigrants and multigenerational U.S. residents alike, driven by myriad forces unique to each state and region. Where are the inequities in higher education most pressing within and across higher education in light of the New Latino Diaspora? And how do persistent inequities among higher education faculty and administrators relate to a rapidly changing student body in various contexts? Besides descriptive data analysis and some work to make projections of likely growth and attainment rates (Kelly, 2005; Santiago, 2010, 2011), there is virtually no published scholarly research regarding variation across all U.S. states and across time to be able to understand whether and if so how differences in Hispanic demographic growth are related to college equity and—consequently—the local context for practitioners, policymakers, researchers, and communities working to make inroads on fostering more equitable access and success for Latina/os.
The purpose of this study is to problematize the common discourse that rapid and widespread Latina/o demographic growth is necessarily a driving force in realizing Latina/o higher education equity gains of the last decades. The study aims to reveal where inequitable participation of Latina/os in higher education has been and may continue to be relatively most pressing, with particular attention to so-called new Latino destinations beyond traditional gateway states. By calculating equity indices for students and for faculty and administrative leaders, we first present a state-level portrait of changes in Latina/o participation in higher education; second, we determine how those state-level trends relate to local demographic changes; and third, we propose a classification scheme for understanding how states differ in terms of the interplay of demographic changes and equitable participation in higher education for Latina/os.
Understanding Changes of (In)equity for Latina/os in Higher Education
Abundant empirical analyses show an increase in the proportion of student enrollment and achievement by Latina/os throughout the PK-16 educational pipeline. At the same time, without drastic changes in the education landscape, the representation of Latina/os in higher education is not expected to reach equitable levels, let alone keep pace with Hispanic demographic growth (Chapa & De La Rosa, 2006; Nora & Crisp, 2009; Sáenz & Ponjuan, 2009; Santiago, 2010; Villalpando, 2010). These observations describe two contrasting aspects of the same phenomena, but each depends on different frames of reference and leads to different understandings of equity.
To make sense of both concurrent trends, researchers have proposed using measurements of educational (in)equities that account for demographic growth in a given location and over time (Perna et al., 2006; Price & Wohlford, 2005). For instance, Santos and Acevedo-Gil (2013) unpacked some of the trends behind the substantial growth of Latina/os in California public higher education. They found that the representation of Latina/o faculty and administrators within California public universities has reflected neither the growing Latina/o population in California nor the related growth in the undergraduate student body. Furthermore, the inequities were greater in the more prestigious University of California system than in the California State University system and the gap has been growing over the last decade despite increases on both fronts. Perna and colleagues (2010) in their study of changes in equity for Hispanics in public higher education in Florida and Texas likewise found the most pronounced gaps in Latina/o participation to be at the public flagship institutions. They considered not only student enrollment compared with the proportion of high school graduates but also the proportion of full-time faculty and administrators compared with the proportion of college graduates.
Most of the research on issues of higher education equity for underrepresented minorities (URMs) has tended to focus, perhaps naturally, on students and the implications for equitable student access, learning environments, and outcomes. Indeed, the literature presents compelling evidence for the impacts that diversity among the faculty and administrators can have on URM students and the wider college community through mentorship, advising, recruitment, and culturally informed leadership, among other activities (Alger & Carrasco, 1997; Castellanos & Jones, 2003; Cole & Barber, 2003; Fairlie, Hoffmann, & Oreopoulos, 2011; Hagedorn, Chi, Cepeda, & McLain, 2007; Moody, 2004; Pascarella, Edison, Nora, Hagedorn, & Terenzini, 1996; Umbach, 2006; Urrieta & Méndez Benavídez, 2007). However, a holistic understanding of equity is inclusive of students, faculty, and administrators.
Equitable participation of Latina/os among the faculty and executive administrative ranks is an important aspect of the discourse on equity in its own right, one that is receiving more attention (Castellanos & Jones, 2003). Most of this emergent research explores the discriminatory barriers, career paths, tenure and promotion processes, and influences on retention of Latina/os. But another aspect of equity is the impact a diverse faculty and leadership corps can have on the broader structures and nature of academe. An example of this nascent body of research would be Gonzales’s (2015) research on the possibilities for faculty at Hispanic-serving institutions (HSIs) to reshape the production and legitimization of knowledge within academia. Gonzales posits that by drawing on a funds of knowledge theoretical framework (Kiyama, 2010; Moll, Amanti, Neff, & Gonzalez, 1992), researchers and practitioners can explore ways to recognize, transmit, and convert funds of knowledge—which are historically accumulated and culturally developed bodies of beliefs, attitudes, understanding, and practices (Bensimon, 2007)—into forms of social capital. That social capital can in turn be mobilized to achieve certain outcomes, allowing HSI scholars to “enter, challenge, or even . . . shift discourse” (Gonzales, 2015, p. 129) within the classroom and beyond it.
Finally, a discussion of equity in higher education participation by Latina/os necessarily involves a consideration of stratification of opportunity across higher education sectors (Posselt, Jaquette, Bielby, & Bastedo, 2012). Researchers have widely noted that Latina/os overwhelmingly opt to enroll in community colleges compared with other sectors (Kurlaender, 2006), even as there is a woeful underrepresentation of Hispanic community college faculty and administrators (Gutierrez, Castañeda, & Katsinas, 2002). Although community colleges arguably offer access to thousands of Latina/os who might not otherwise attend college, evidence shows that program differentiation can impede true equitable opportunity (Bastedo & Gumport, 2003), and these institutions too often fail to serve as a gateway to bachelor’s degree attainment by Latina/os through their transfer function (Nora & Crisp, 2009), especially for the large proportion who are assigned to developmental coursework (Crisp & Nora, 2010). State and federal policy contexts also contribute to the “unique . . . relationship between Latinos and the community college system” (Flores, Horn, & Crisp, 2006, p. 72), including the fact that increasingly more community colleges are becoming designated HSIs, now making up over half of HSIs nationwide (Núñez, Crisp, & Elizondo, 2015). Núñez and colleagues report that as many as 39% of Hispanic community college students attend these institutions.
Method
This study utilizes descriptive and inferential analyses of longitudinal data from 2003 to 2013 for public institutions of higher education in all U.S. states. The descriptive portion is patterned after the example of Perna and colleagues’ (2010) study regarding the status of equity for Latina/os Florida and Texas higher education, but we extend the study to all U.S. states where data were available. We build upon methods in previous studies by estimating several longitudinal regression models to understand the relationship of equity changes with overall Latino demographic growth that has been uneven in different areas of the country. A prominent understanding in academe and the media is that increased rates of Latina/os attending college is in many ways a function of booming demographic growth, yet there is reason to suspect college enrollment and equity, as related to growth, may vary as widely as do the contexts of each state.
Throughout the study, we leverage the concept of academic equity indices (AEIs; Bensimon, Hao, & Bustillos, 2003, 2006) to quantify Latina/o participation in higher education (cf. Perna, Fries-Britt, Gerald, Rowan-Kenyon, & Milem, 2008; Perna et al., 2010; Perna et al., 2006; Price & Wohlford, 2005). These metrics were developed for institutional accountability and policy development, among other uses, in part because they are succinct and readily interpretable. An AEI is a ratio calculated by dividing a particular group’s proportional representation in an institution vis-à-vis a reference group. For instance, to determine the equity index of Latino enrollment, the proportion of Latina/os among the student body is divided by the proportion of those eligible to enroll. A ratio of 1 reflects equitable representation, below 1 indicates inequity, and larger than 1 indicates a situation surpassing numerical equity. Because the index simultaneously takes into account changes in the proportion of a group of interest (the numerator) and the proportion among a reference group (the denominator), it provides a mechanism to summarize and review comparable data across space and time (Perna et al., 2010).
Past studies (e.g., Perna et al., 2010; Perna et al., 2006) used the reference population of high school graduates for enrollment indices as this is a minimal college eligibility requirement. Because high school graduation rates vary—on average—according to racial, ethnic, and socioeconomic differences, this narrower reference group does mask wider disparities but reflects the portion of the educational pipeline that colleges have most control over: access rather than preparation. We go beyond the younger cohort of 18- to 24-year-olds used by previous authors and use a reference group of 18- to 64-year-olds in recognition that 40% of community college students and 21% of undergraduates at public 4-year colleges are 25 or older, according to 2012 figures from the Integrated Postsecondary Education Data System (IPEDS). Public colleges have the mission to serve, and indeed do serve, millions of individuals from this segment of the population. Naturally, people from different age groups are more or less likely to want or be able to attend college, and so this broad reference group may potentially overestimate inequitable representation in enrollments. However, excluding nontraditional age students is also problematic (Dellow & Romano, 2002), and the risk of overestimation is tempered by excluding those without a high school diploma. Following the example of Perna et al. (2010), an enrollment equity index is calculated in this manner:
where i represents one of three public college sectors (community colleges, state flagship universities, other 4-year colleges), or all sectors combined, j represents 1 of the 50 U.S. states, and k represents a year between 2003 and 2013. For example, using 2012 figures for community colleges in Nebraska (a so-called new Latino destination) from the U.S. Census Bureau’s Current Population Survey (CPS), which estimates that 11% of high school graduates identified as Latina/o, and IPEDS, which shows 7% of enrolled students were Latina/os, the enrollment equity index for that year was 0.63, calculated this way:

Bensimon and colleagues (2003, 2006) originally proposed a scorecard of multiple AEIs, in terms of four facets of equity assessment: access, retention, excellence, and institutional receptivity. Retention and excellence indices measure equity in student outcomes, whereas access (such as the enrollment index above) and institutional receptivity indices measure equity in participation. Due to data availability and the focus here on institutional demographics in relation to background demographics, we limit this study to indices of participation. In addition to a student enrollment equity index, we utilize two other indices of institutional receptivity: the faculty and administrative composition versus college degree holders (a personnel equity index) defined as

and the faculty and administrative composition versus student composition (an institutional parity index) defined this way:

The reference group for the personnel equity index, following the example of Perna and colleagues (2006; Perna, Gerald, Baum, & Milem, 2007; Perna et al., 2010), are bachelor’s degree holders for two reasons: (a) Although graduate degrees are typically required for most faculty and executive administrative positions in research-oriented institutions, a substantial portion of instructors and administrators in community colleges and workforce-oriented institutions have bachelor’s degrees or less (American Association of Community Colleges [AACC], 2015); and (b) equity in general terms in public higher education “will only be achieved when the distribution of racial/ethnic groups among faculty and administrators mirrors [at a minimum] the distribution of racial/ethnic groups among a state’s bachelor’s degree recipients” (Perna et al., 2010, p. 152). Moreover, this reference group is appropriate for gauging equity in the public education sector according to directives of affirmative action for recipients of federal monies in which “hiring goals are used to target and measure the effectiveness of affirmative action efforts” and are established “based on the availability of qualified applicants in the job market or qualified candidates in the employer’s work force” (U.S. Department of Labor, 2002, Sec. D).
In both of these institutional receptivity indices, faculty members and executive administrative and managerial personnel—but not general administrative staff—are combined together for a single count of college personnel in light of their complementary roles in managerial and fiscal control over resources, policies, procedures, and initiatives (Greene, 1988). The institutional parity index indicates the degree to which colleges have a critical mass of Latina/o faculty and leaders on hand who might influence the overall institution’s capacity to reap the benefits of growing diversity (Bernal & Villalpando, 2002; Hagedorn et al., 2007; Reeves & Hamann, 2008) and influence student outcomes by drawing on, sharing, and mobilizing their own funds of knowledge (Bensimon, 2007; Gonzales, 2015).
Data
This study uses 10 years (2003-2013) of data regarding U.S.-based public institutions that participate in Title IV financial aid programs. From IPEDS we collected data on the numbers of undergraduate student enrollments, faculty members (full-time and part-time instruction/research/public service appointments), and managerial staff (full-time and part-time executive/administrative and managerial appointments) and aggregated counts to the state level. To account for sector differences, we used Carnegie classifications in IPEDS to distinguish 2-year from 4-year colleges. In addition, as a proxy for the category of highly selective/competitive institutions that Astin and Oseguera (2004) and Posselt et al. (2012) used in their studies on stratification in higher education, we distinguished the most prestigious tier of institution(s) defined by a merged list of the College Board’s list of flagship universities and the Carnegie classifications of universities with very high research activity. We excluded even-numbered years as colleges are only required to report biannually (in odd-numbered years) the numbers of employees by primary occupational activity, race/ethnicity, and gender.
Following the example of Flores (2010) and Flores and Chapa (2009), we turned to the CPS’s Merged Outgoing Rotation Group (MORG) files from the U.S. Census Bureau for representative estimates of the demographic makeup and educational attainment rates of state residents yearly since 2003. The CPS uses a relatively smaller sample size than other census surveys but goes back further and has been more stable over time. Data limitations are mitigated by using the yearly CPS MORG files, which have 3 times as many records as the Basic Monthly Files, and by using statewide aggregates (Chapa & Valencia, 1993). Nonetheless, due to relatively small sample sizes in some states, we excluded any estimates of 5,000 individuals or less. Because the evidence shows (Flores & Chapa, 2009) that there is variation in state political contexts that influence the degree to which foreign-born noncitizen (FBNC) Latina/os can access and are welcomed in higher education, and there is variation in the proportion of FBNC Latina/os by state, we disaggregated the demographic estimates using a proxy for undocumented status suggested by Flores (2010). Namely, we defined as FBNC Latinos those who indicated being foreign-born and not a citizen of the United States (as opposed to native born, born in U.S. territories or of U.S. citizens, and/or naturalized), self-identified as Hispanic, had at least one parent who is foreign-born, and listed a Latin American country of origin. As Flores notes, this categorization is not ideal as it includes, for instance, legal residents and refugees, along with legal residents but who otherwise do not have proper authorization to live permanently in the United States. However, it is the only nationwide data with any level of detail of undocumented immigrants. In 2013 on average, for the 40 states with reliable estimates, 3.6% of each state’s residents were such FBNC Latina/os (min = 0.6%, max = 10.8%, SD = 2.5%). The second group of Latina/o state residents are either (a) native, born in the United States; (b) native, born in Puerto Rico or U.S. outlying areas; (c) native, born abroad of American parents; or (d) some other category. In 2013, on average, 7.7% of each state’s (n = 40) residents fit this category (min = 1.2%, max = 38.4%, SD = 8.1%).
Courtesy of Excelencia in Education (n.d.), we obtained historical data for the cumulative numbers of public colleges and universities designated as HSIs by state to account for any aggregate effect on equity rates as they enroll and putatively serve more Latina/os (Núñez, Hurtado, & Calderón Galdeano, 2015).
Analytical Approach
Our analyses, as in past work using equity indices, are fundamentally descriptive in nature. We first consider the components of the equity indices, that is, trends in eligibility (for students, the proportion of Latina/o high school graduates; for college personnel, and the rate of Latina/o bachelor’s degree holders) and participation (representation) in higher education. Previous research shows there is a divergence of trends in eligibility and college-going rates despite improvement in each separately (Castellanos & Jones, 2003; Lee et al., 2011; Villalpando, 2010) as students and potential students are hindered by persistent racialized barriers (Solórzano et al., 2005). Equity indices, as summary expressions of the relationship between proportional eligibility and proportional representation, allow us to investigate the space between to determine the extent of the gap and whether it is widening, closing, or holding steady over time.
Second, we calculate regression models to test whether there is a significant relationship between equity changes and demographic changes over time and across states. To test the overall correlation, we calculate fixed effects regression models, which, like simple paired-comparisons t tests, yield means comparisons while controlling for unmodeled invariant characteristics of states in their diverse contexts (Allison, 2005). Then, to discover the degree to which states vary in the overall trend, we calculate random effects (multilevel) models. Finally, following a procedure modeled on A. Singer and Suro’s (2002) classification of metropolitan areas, we classify states according to their historical growth and equity trends. This provides a way to understand the relative urgency and opportunities among groups of states that may share similar circumstances that lead to particular policy or practice implications. Further analytical particulars are provided in context with the series of findings.
Limitations
As detailed as this study aspires to be in mapping the variation of Latina/o higher education equity nationwide, even the state level hides much nuance. Reliable estimates for the educational attainment rate for Hispanics are hard to come by even for many states, let alone for counties or metro- and micropolitan areas. These regression analyses are relatively basic and do not account for many potentially important factors that influence the rates at which Latina/os attend college and are employed as faculty and executive administrators. For instance, the analysis does not account for state differences in changing laws, tuition policies, and financial aid policies relevant to immigration (Flores, 2010), which are incredibly difficult to operationalize across all states and over time.
Analyses and Results
Descriptives: Relationship of Changes in Demographics and Equity
As depicted in Figures 1a through 1f, and detailed more fully below, changes in equity for Latina/os in higher education have divergent trends for students compared with the faculty and administrative leadership ranks. Nationwide from 2003 to 2013, there was a trend toward more equitable representation of Latina/os among the student body. But proportional Latina/o representation among the faculty and executive administration ranks was flat despite small gains in absolute numeric terms. These two trends together resulted in steady overall decreases in on-campus parity for the proportional representation of Latina/o students vis-à-vis Latina/o faculty and leadership personnel. When the equity indices are disaggregated by sector, there are substantial differences between the 2-year and 4-year colleges, though there is little difference between flagship research universities and the rest of the 4-year college sector.

Numerator and denominator components (1a, 1c, 1e) of equity indices (1b, 1d, 1f) plotted over time.
In Figures 1a, 1c, and 1e, we see a plot of the numerators and denominators used to calculate equity indices for all public colleges. Not shown are lines connecting individual state data points over time, which would appear as a mesh of overlapping lines throughout the plot. Instead, only national averages are plotted. Because of the skewed distribution of proportional Latina/o demographics between states, the axes of Figures 1a, 1c, and 1e are on a logarithmic scale to better discern the relative trends. The average numbers are indicated with an interpolation line. So, for instance, looking at Figure 1a, we see that in 2003, on average, 8.9% of states’ high school graduates were Latina/os—the denominator for an equity index indicated with the lighter gray data markers. By 2013, that figure had risen to 12.4%. In the same time period—the numerator indicated with black data markers—the average proportion of states’ enrolled college students who were Latina/os went from 6.0% to 10.0%. Both trends were positive, but with representation among the college student body rising more rapidly.
Accordingly, the enrollment equity index, which is a single expression of the dual trends, has a positive slope as shown in Figure 1b, rising to an average of 0.84 (SD = 0.22) in 2013 for all sectors combined. In Figures 1b, 1d, and 1f, we see the single ratios of the indices plotted over the same decade time span. The equity indices for all public higher education institutions are shown in black markers and data labels. And, by removing the individual state values from these plots, we have space to show the disaggregated sector trends too. Thus, in Figure 1b we see that community colleges have relatively higher enrollment equity indices than 4-year institutions. As seen in Figure 1d, community colleges in contrast have on average lower relative personnel equity indices, resulting in relatively much lower and drastically falling institutional parity indices as seen in Figure 1f.
For community colleges, the institutional parity index by 2013 had dropped to only 0.28 on average (SD = 0.10). The enrollment equity index for Latina/o community college students the same year had risen to 0.90 (SD = 0.25), representing a gap of 0.62 in these two measures. This is the widest gap in these equity indices for the different college sectors over the decade. In 2003, the same indices were, respectively, at 0.46 (SD = 0.18) and 0.75 (SD = 0.29) on average—a gap of 0.29. Therefore, though the proportions of Latina/o faculty, college leaders, and students increased in absolute terms, one feature of the demographic wave of young Latina/o students enrolling in college is that they were continually less likely to have encounters with Latina/o instructors and executive leaders. And this trend has been especially salient in the community college sector.
The data plotted in Figure 1, as revealing as they might be, mostly confirm trends noted elsewhere of rising Latino enrollment and flat hiring/retention of Latina/o faculty and leaders. However, one notable finding is that the Personnel Equity indices are substantially lower for community colleges compared with other sectors. This is contrary to national figures that show there is a larger share of Latina/o faculty and administrators in the public 2-year sector than the 4-year sector (“Race and Ethnicity of College,” 2014). What those national figures hide, though, is variation across states. Because we calculated the indices based on state tallies, we see that as opposed to common knowledge, community colleges on average are much less equitable in their faculty and administrative ranks than their 4-year college counterparts within states.
Another way to understand the changes in equity is to use geographic information system (GIS) tools to view the data by place, not just time (Santos & Acevedo-Gil, 2013). Figure 2 shows the percent change by state in enrollment equity indices (2a), faculty and administrative personnel equity indices (2b), and institutional parity indices (2c), as compared with the percent change in overall Hispanic population growth by state (2d). Looking across these figures, we can visualize the variability geographically. Comparing Figure 2d—the overall percent growth of Hispanics—with each of the three other maps showing percent changes in equity indices, it appears that changes in equity are not necessarily aligned with demographic growth.
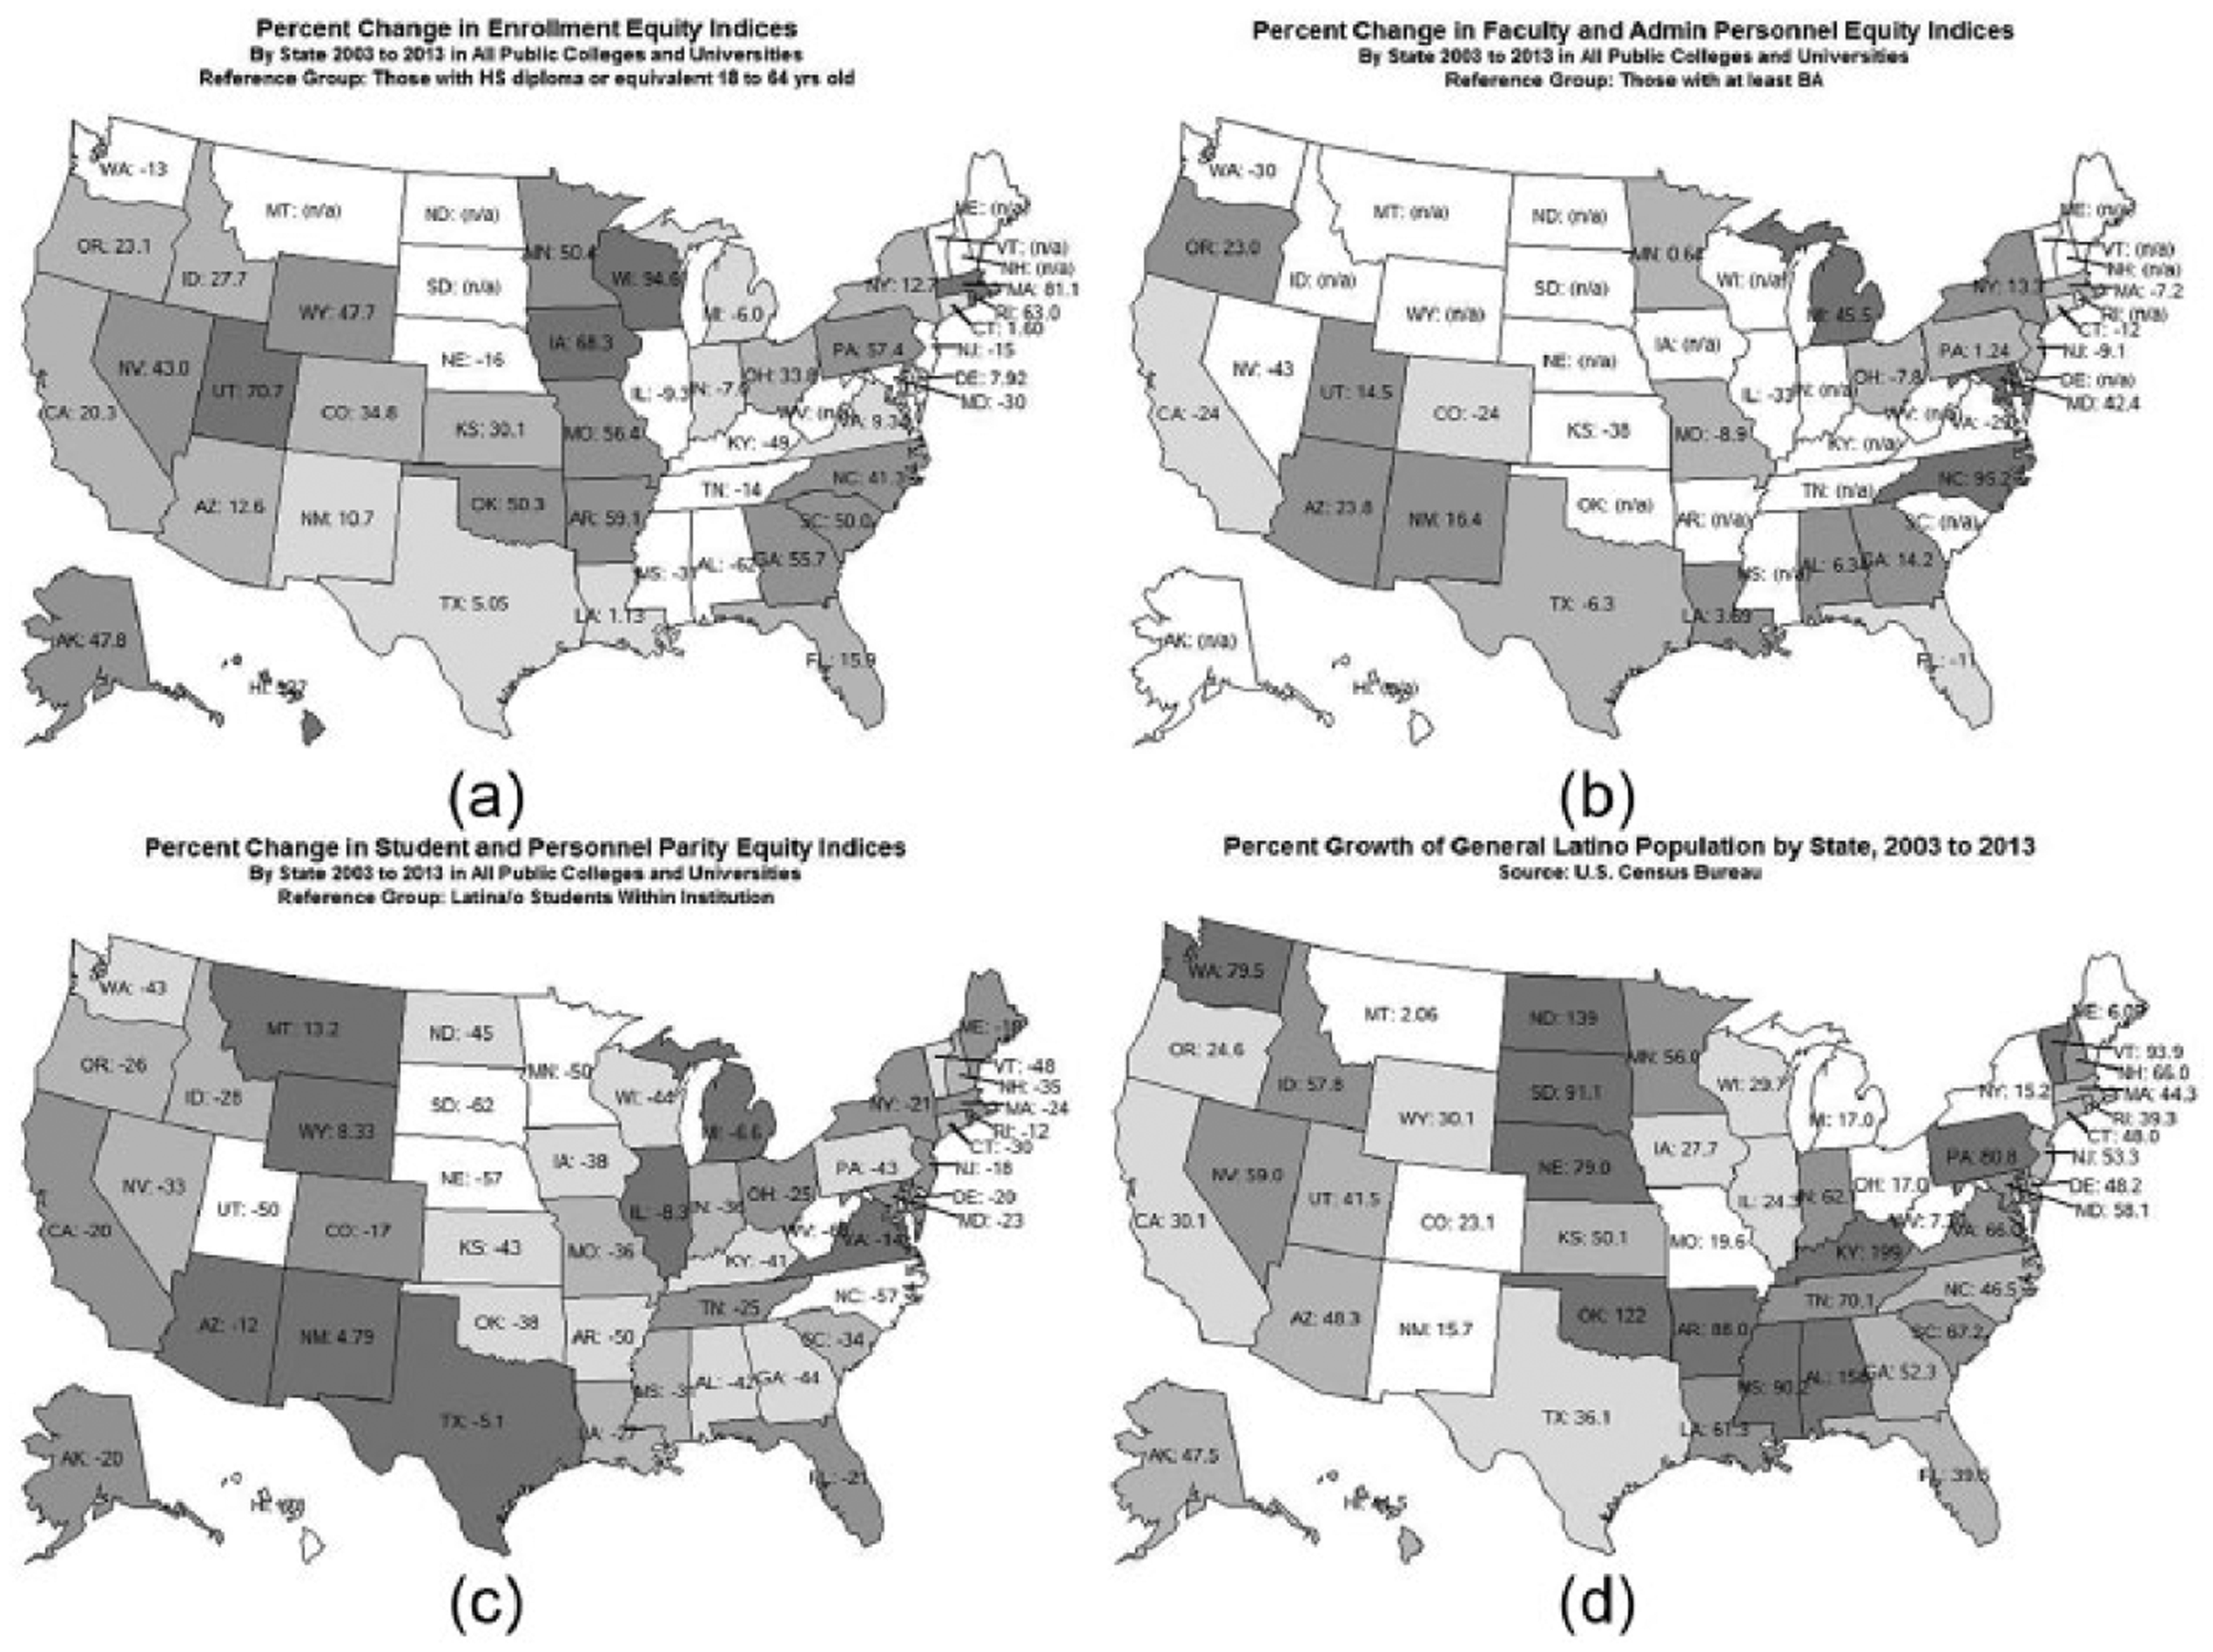
Percent change in enrollment equity (2a), personnel equity (2b), and institutional parity (2c) indices, compared with percent change in Hispanic population growth (2d), by state 2003 to 2013.
Fixed Effects Regression: Correlation of Equity Changes and Demographic Changes
Despite general growth in enrollment equity nationwide, and flat or dropping equity for Latina/o faculty and administrative leaders, Figure 2 shows there is a wide variety of trends across states that may not be correlated with demographic growth on a state-by-state basis. For instance, several states which experienced some of the fastest growth in the Hispanic population (Figure 2d), such as Alabama, Kentucky, Mississippi, Nebraska, and Washington, were also among the states that saw a relatively large decrease in enrollment equity (Figure 2a). At the same time, there were states such as Minnesota, Nevada, North Carolina, and Oklahoma which also saw rapid growth but still experienced gains in enrollment indices. To test whether there is a significant relationship between demographic change and changes in equity, we begin with a simple correlational test of the variables over time. This is possible through a fixed effects regression model, which, like simple paired-comparison t tests, yields correlational statistics while controlling for unmodeled invariant characteristics of states in their diverse contexts (Allison, 2005, 2009; Hillman & Orians, 2013).
Fixed effects models present certain noteworthy benefits over other regression techniques for nonexperimental research. In correlational and quasi-experimental studies, researchers typically try to compensate for the lack of randomization by controlling for important variables that could influence the dependent variable. Researchers follow theory and previous empirical studies to select and operationalize such controls. However, there is always a limitation to the quantity and quality of available covariates. A fixed effects model overcomes this limitation by controlling for all possible characteristics that are unvarying over time. For instance, there are state-specific factors such as the number, variety, and hierarchy of institutions, program offerings, and other features of colleges that change very slowly. Broader societal and economic conditions are also stubbornly persistent over time and give rise to the structural and culturally unique situations of states and their people. Similarly, there is tremendous heterogeneity in the Latino communities in different parts of the country. The character of each community, state, and region depends to a great deal on who precedes new generations (Tienda & Mitchell, 2006), whether Native Americans, Pueblos Indígenas, Europeans, Africans, Asians, or Oceanic peoples.
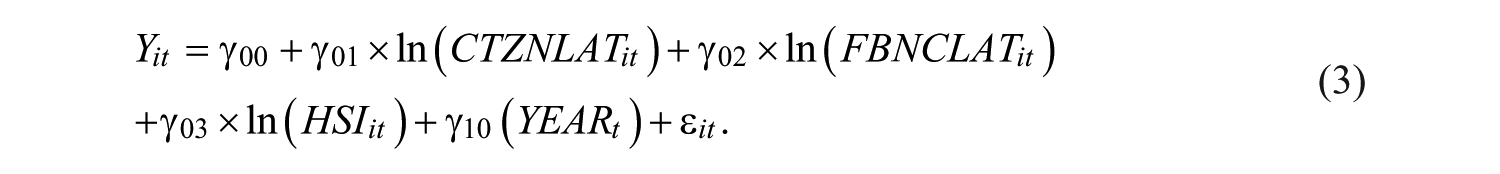
Many of these broad societal and economic circumstances that influence the educational opportunities for Hispanics are relatively time invariant and unique to each state. Fixed effects models do not work for estimating coefficients of time-invariant variables but do allow for estimation of time-variant variables. Our model is expressed in the following equation:

where Y is the equity index, i refers to different states and t refers to measurements for odd years from 2003 to 2013. The CTZNLAT and FBNCLAT variables are the percentages of citizen and undocumented Latina/os in the state population. HSI is the number of public HSI institutions per state. The parameter µ is an intercept that varies over time, α is the unobserved state fixed effects, and ε is a random disturbance term.
For the enrollment equity index, results in Table 1 show that there was positive growth every 2 years in enrollment equity (coefficient = 0.03, p < .001). However, there was a coefficient of −0.27 for the log of percent Hispanic population (p < .001), whether citizen or FBNC Latina/os. Log transformed coefficients are interpreted in terms of a log percentage increase multiplied by the coefficient value. So, we can interpret this case to mean that, for instance, a 10% increase in the proportion of Latina/os in a given state (whether, say, from 9.0% to 9.9%, or 15.0% to 16.5%) was found to be associated with 0.01 point decrease (−0.27 × loge1.10 = −0.01) in the enrollment equity index. Therefore, counter to the overall trend, enrollment equity was actually associated with a downward trend as a function of Hispanic population growth. How can these seemingly contradictory findings be reconciled? This requires looking into the variability across states, which, as described below, have seen widely divergent trends hidden beneath national averages. But first, of note are the other two models. The growth of the Hispanic population was not found to be related to any change, negative or positive, of the equitable representation of faculty and executive administrators. Indeed, it was found that time itself was not a significant factor, meaning that essentially there has been no headway at all over the last decade in increasing the equitable representation of Latina/o faculty and college leaders. For the institutional parity index, there was a negative association with time, as reflected in the descriptive plots of Figure 1 (coefficient of −0.02, p < .001). When the percent Hispanic population per state was expressed as a single figure—citizen and FBNC Latinos combined—in these latter two models (not reported in tables), the growth was significantly related (p < .05) to a negative trend in equity indices.
Fixed Effects Model Estimates of Changes in Equity Indices.
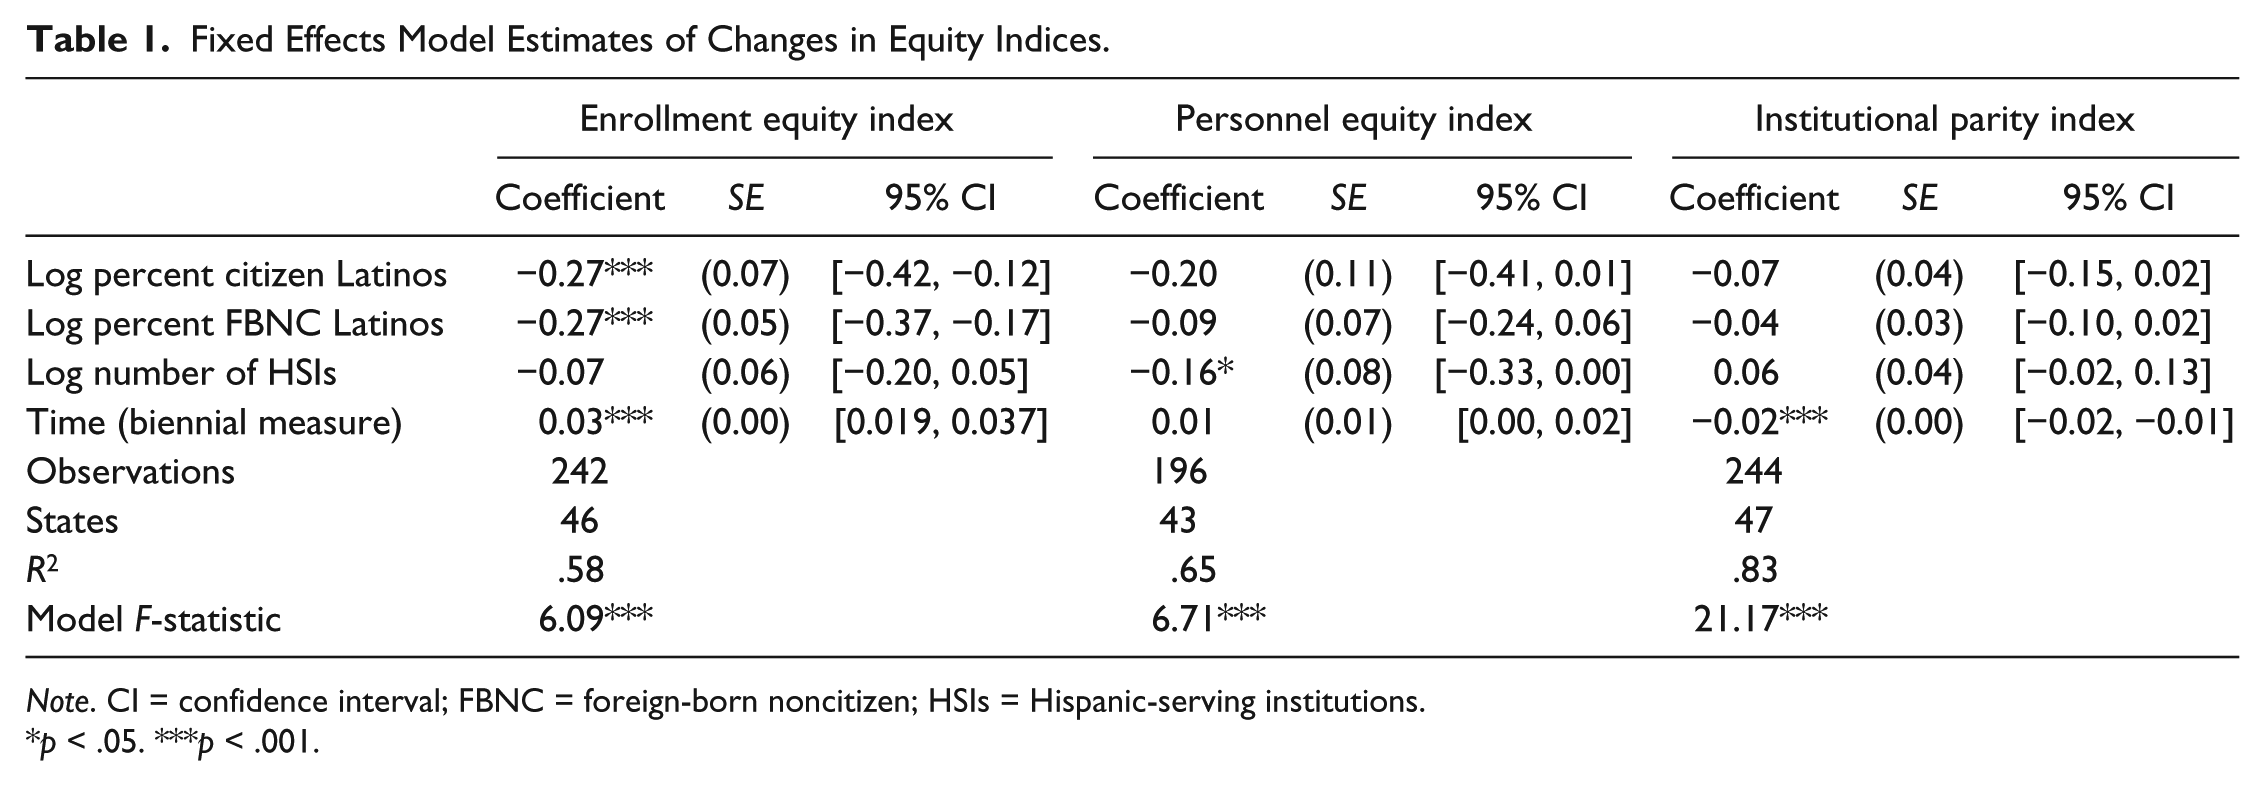
Note. CI = confidence interval; FBNC = foreign-born noncitizen; HSIs = Hispanic-serving institutions.
p < .05. ***p < .001.
Random Effects Regression: Variability of Equity and Demographic Change Among States
With so much variability among states, as observed in the descriptive statistics and leading to perhaps counterintuitive findings for the fixed effects of Latina/o equity relative to background demographics, it naturally leads to a consideration of random effects models. Random effects models are close cousins of fixed effects models. Both share the advantage over conventional ordinary least squares (OLS) regression of using robust standard error estimates for within-observation correlation (Allison, 2005). Random effects models though, like their name says, allow us to estimate random coefficients between sites. We first calculated unconditional means (null) models to determine the variance components between and among states, as in

where γ00 is the sum of the overall mean of state-level intercepts, u01 is the state-level random deviations from that mean, and ε is a random within-state residual (J. D. Singer, 1998). The random intercept and residual are reported in Table 2 from which we can calculate the proportion of total variance between states—the intraclass correlation (ICC). The ICCs confirm that equity indices vary substantially across states, with more than a third of the proportion of variance of enrollment equity indices between states (ICC = .381) and more than half of the variance of personnel equity indices (ICC = .584) and institutional parity indices (ICC = .586) between states.
Variance Components of Random Effects Model (Null) of Changes in Equity Indices.
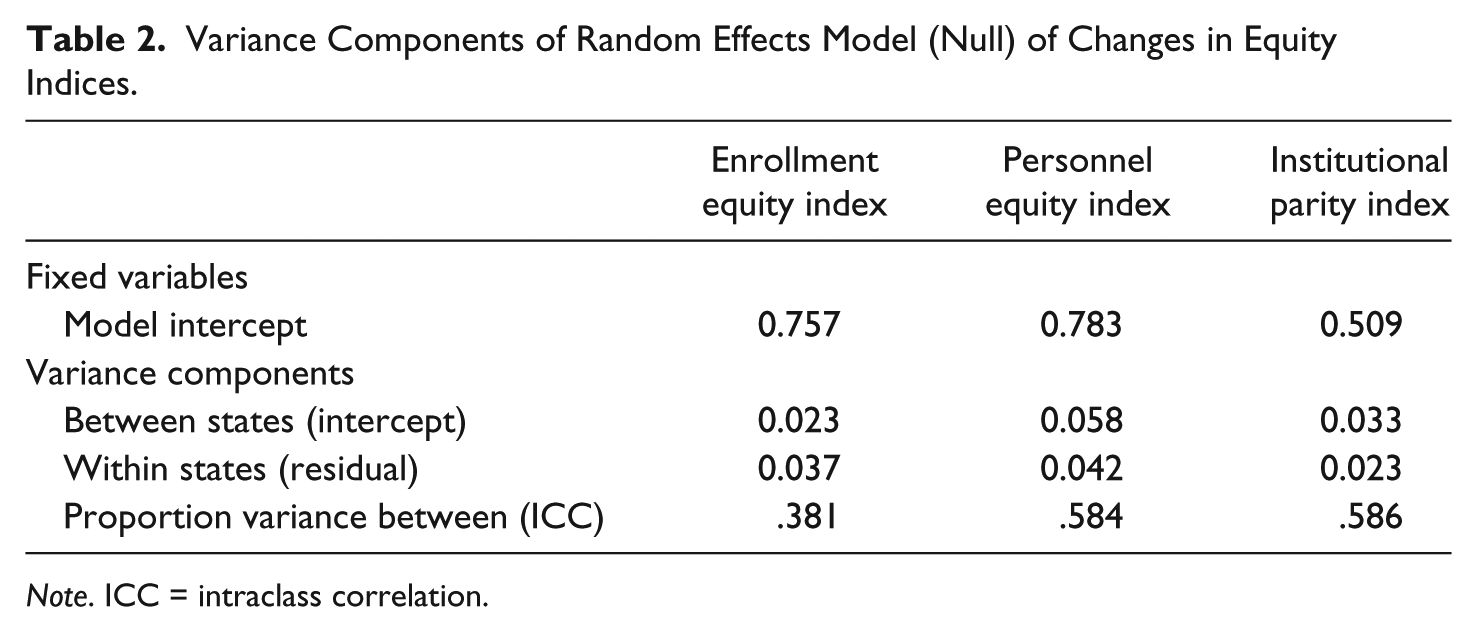
Note. ICC = intraclass correlation.
These results and those from the descriptive analyses suggest that both the intercepts and perhaps slopes of the population growth variables may vary among states, and so we estimated models with random effects for all parameters across the three indices. However, results showed no significance for a random effect of the percent Hispanic population, suggesting that the regression slope for background demographic changes may not be statistically different across states. Rather, the differences across states were due to varying intercepts and other variables not modeled. By adjusting the model for a random intercept and residual only, as in Equation 3, we found the statistics reported in Table 3.
Random Effects Model Estimates of Changes in Equity Indices.
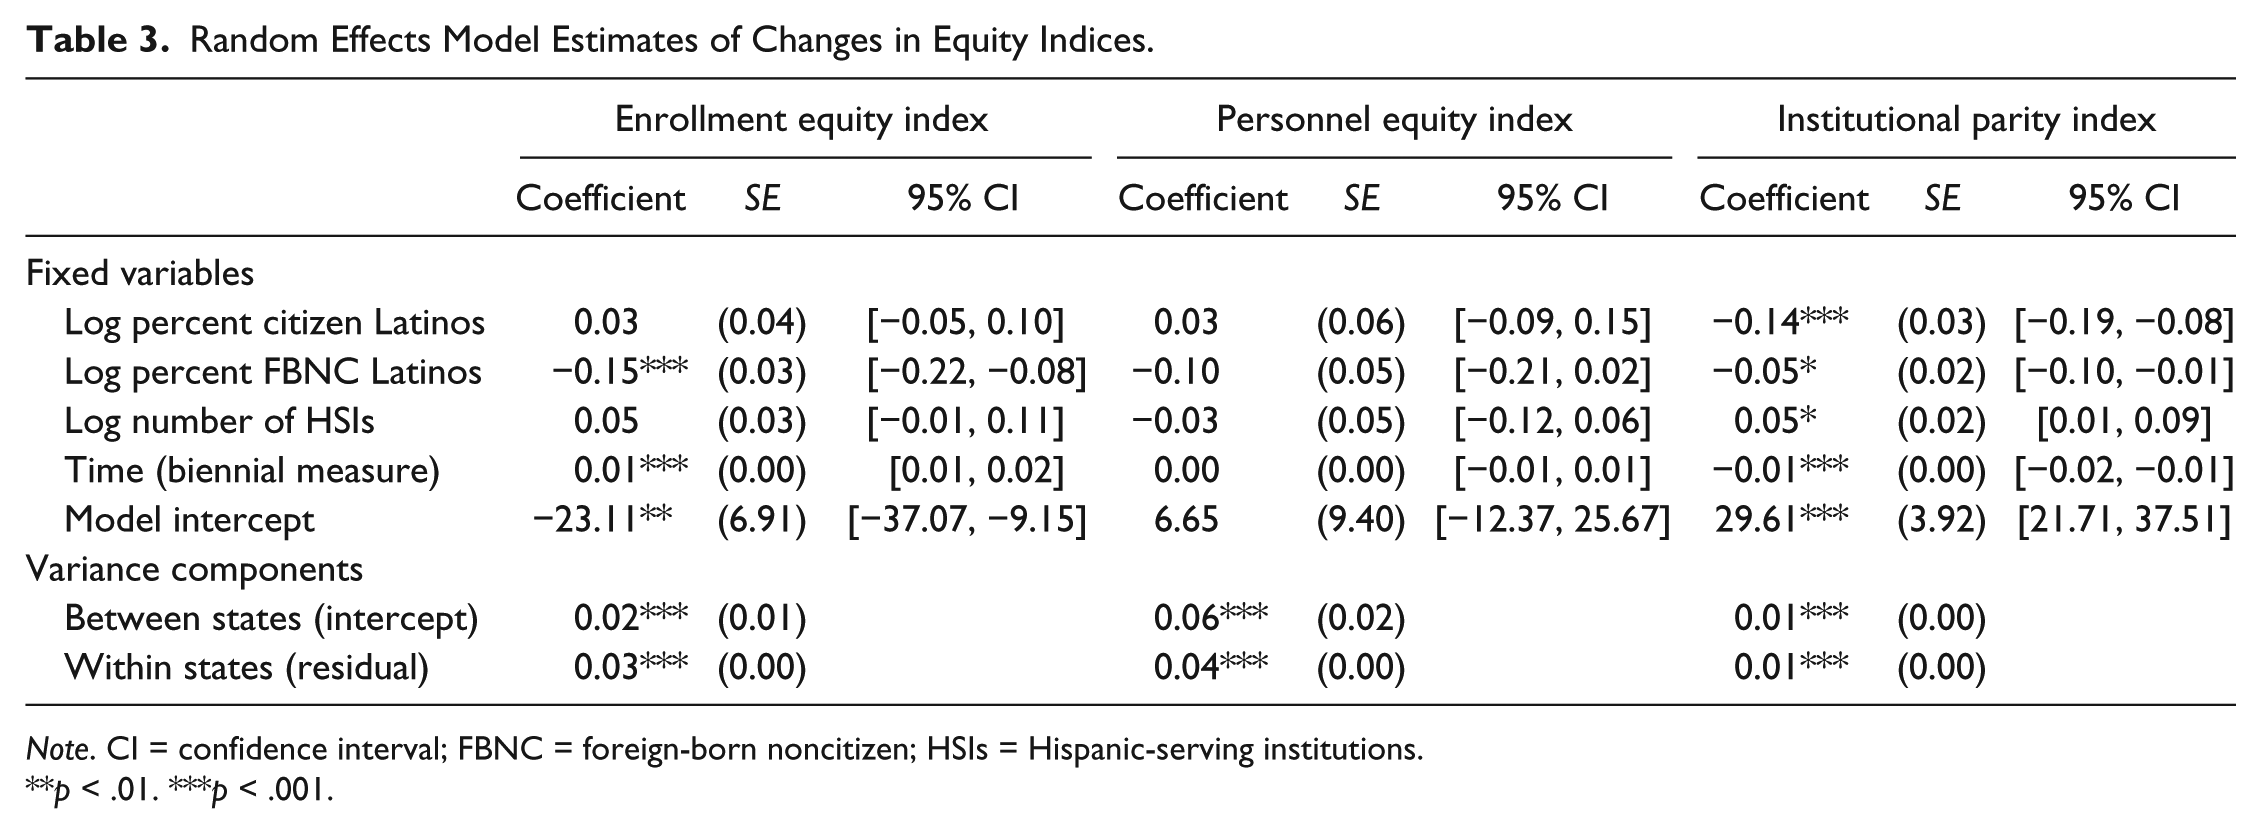
Note. CI = confidence interval; FBNC = foreign-born noncitizen; HSIs = Hispanic-serving institutions.
p < .01. ***p < .001.
The results show that there is a negative association of the log of percent Hispanic population with both enrollment equity indices and institutional parity indices, but mainly associated with the growth in FBNC Latina/os in the former case and citizen Latina/os in the latter. Why the two variables would be related in a different way to the two equity indices is not clear. But what is clear in both cases is that growth among Latina/os is either not related to a change in equity or is negatively related, contrary to common understanding.
Unpacking the Variability: Four Types of Latina/o Growth/Equity Profiles
A. Singer and Suro (2002) of the Pew Hispanic Center and Brookings Institution proposed an influential four-way classification of metro areas based on whether their Hispanic population numbers exceeded or lagged the national average in 1980 and whether their Hispanic population growth exceeded or lagged the national average from 1980 to 2000. This scheme is a pragmatic way to make sense of a variety of circumstances arising from either a robust or emerging population base and, simultaneously, either a robust or modest growth rate. Similarly, a four-way scheme for making sense of the two intersecting continua of population growth and equity changes may be useful for interpreting the variety of changes in equitable Latina/o participation in higher education.
For instance, Figure 3 plots the percent change in the enrollment equity indices by the percent growth of Hispanics. With the plot divided in quadrants, we can classify which states have, roughly speaking, either fast or moderate growth and either expanding or stagnant equity for Latina/o students. The growth axis is split at the mean percent growth. The enrollment equity index axis is split at the mean percent change so as to uphold a higher standard that is just more than zero. However, the quadrant division for the personnel equity index axis (Figure 4) and the institutional parity index axis (Figure 5) was set to 0% change, as the average in both cases was negative, and anything less than positive change is by definition not expanding.
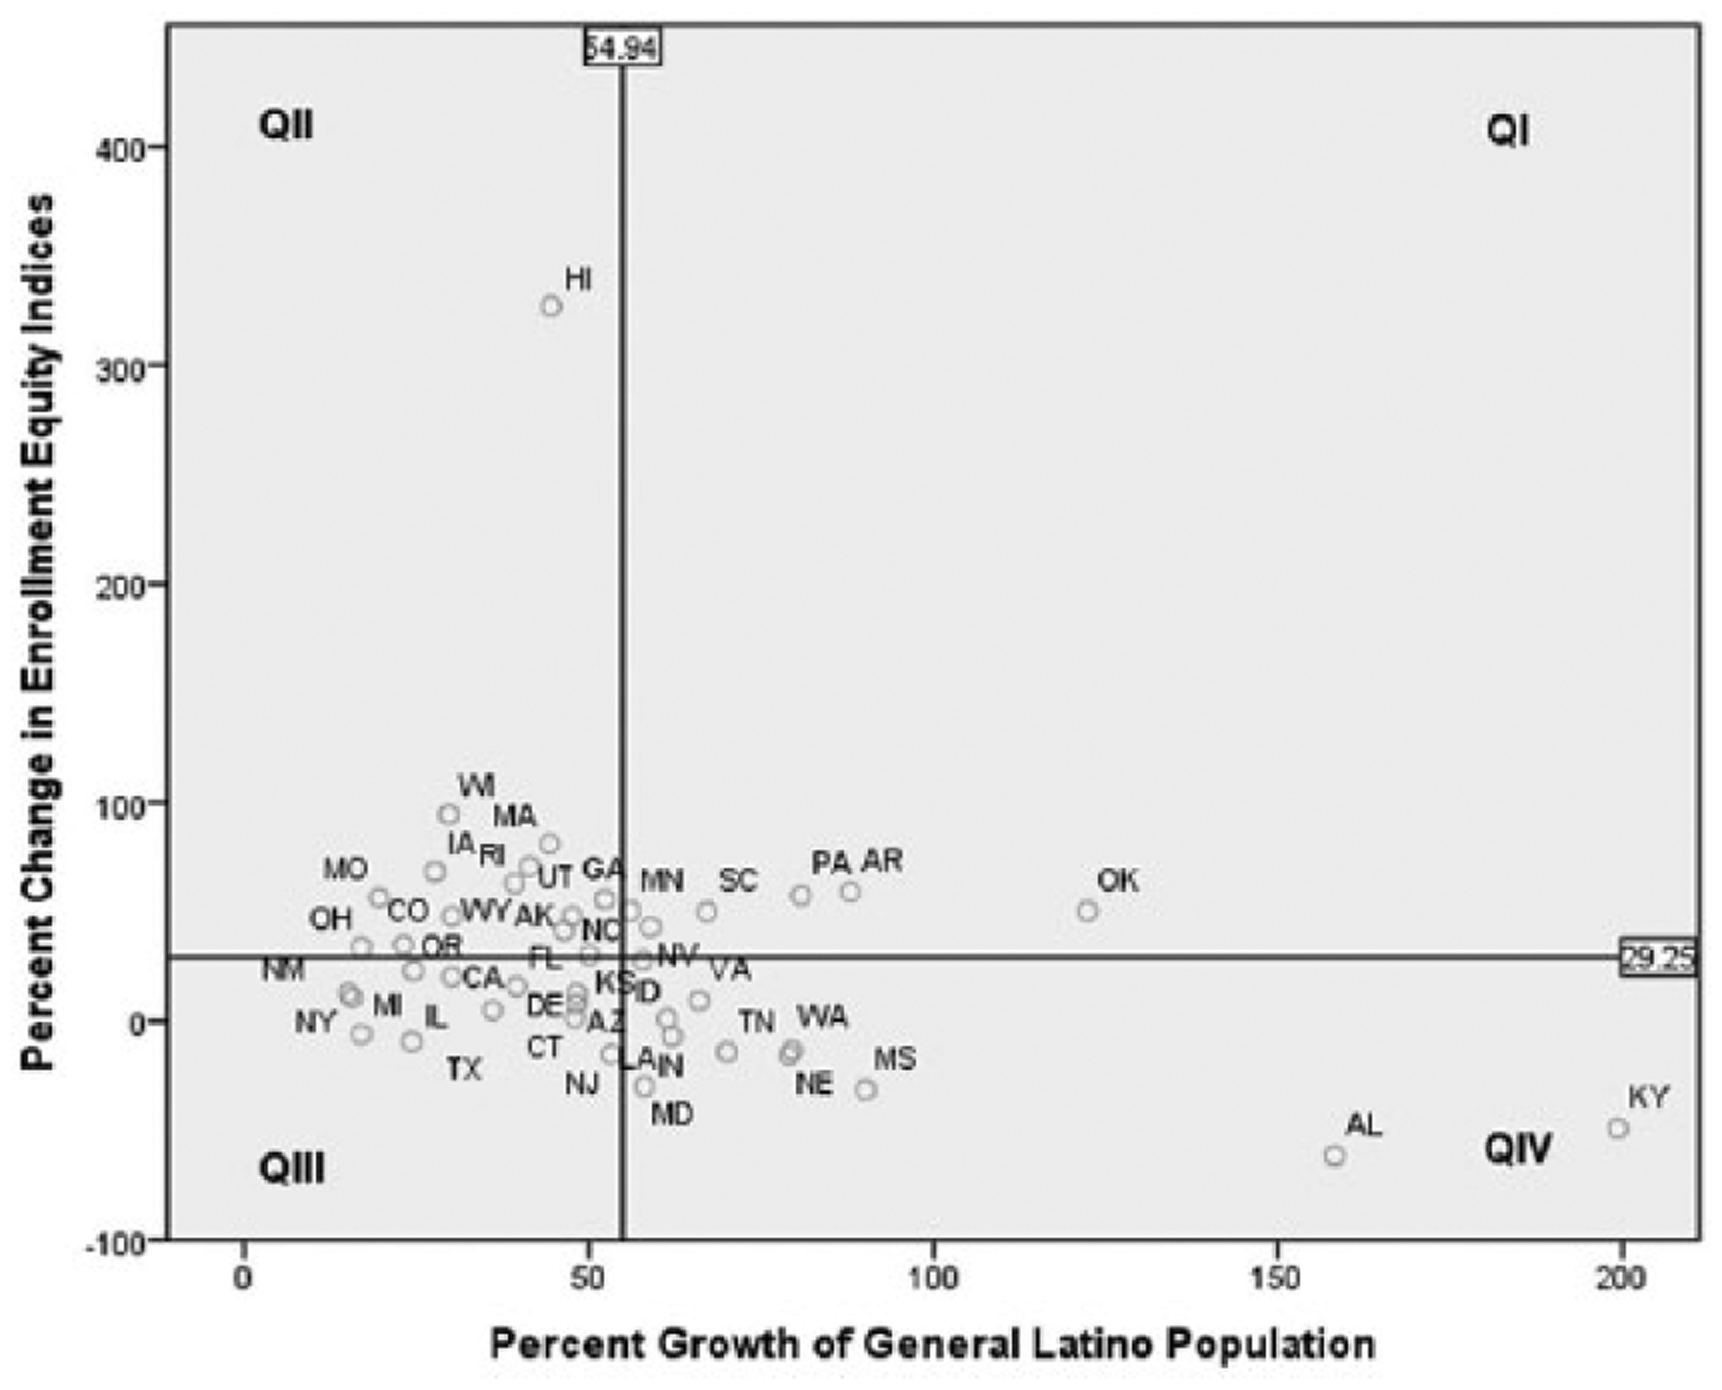
Change in enrollment equity versus change in population growth for Latina/os.

Change in college personnel equity versus change in population growth for Latina/os.
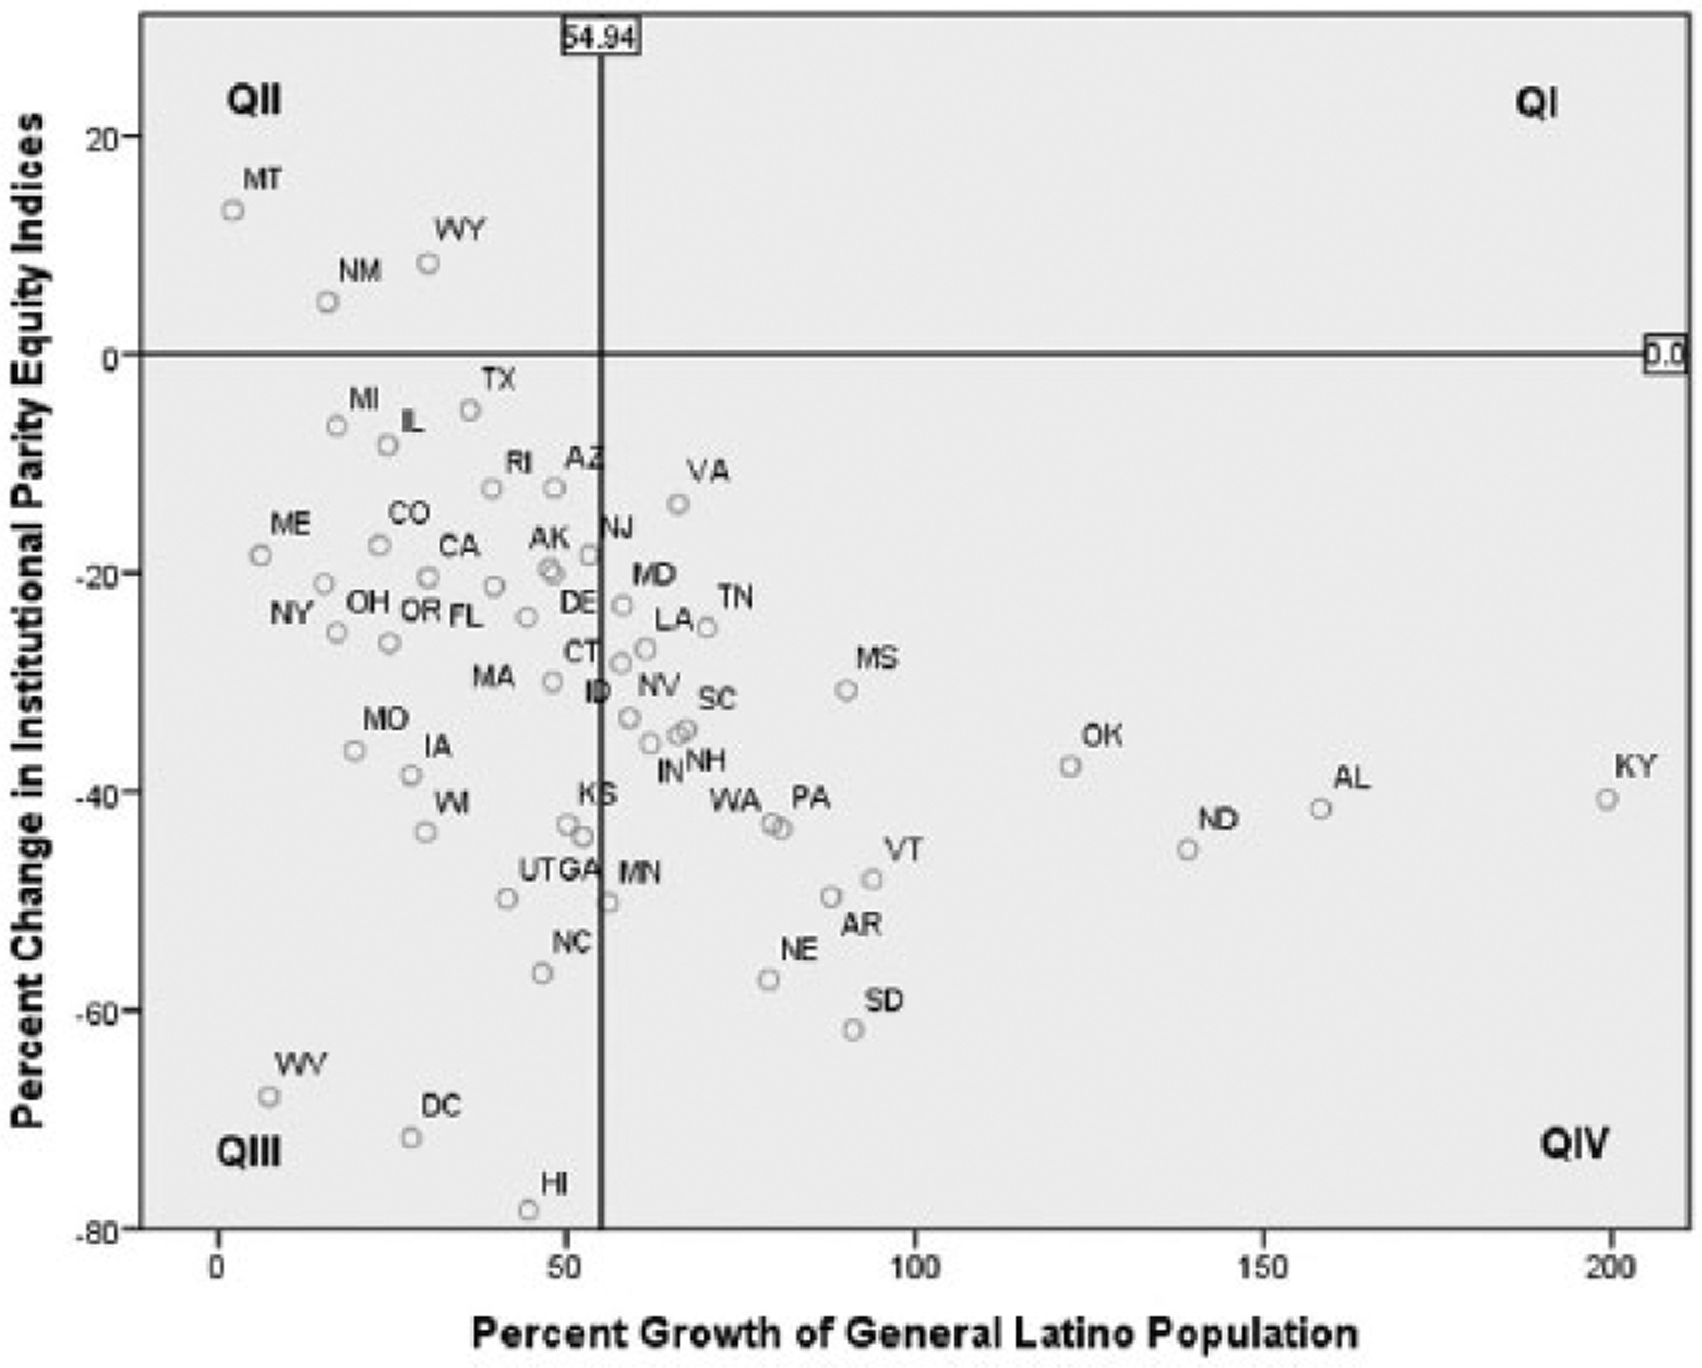
Change in institutional parity versus change in population growth for Latina/os.
The cause of the negative regression slopes for enrollment equity indices can be seen in the preponderance of states in the top left quadrant (QII) and those in the bottom right quadrant (QIV) of Figure 3. Despite overall gains nationwide (most states are above the line of 0% change), the bulk of states that saw gains in equity indices were also below the average Hispanic growth rate. Conversely, several states that had fast demographic growth saw some of the largest drops in enrollment equity indices. Taken together, the bulk of state data points line up along a rough negative trend line. There were only six states with both fast growth of Latina/os and expanding equity (QI), for Latina/o students: Arkansas, Minnesota, Nevada, Oklahoma, Pennsylvania, and South Carolina. Only two states—Minnesota and Pennsylvania—had fast growth and expanding equity for both students and for faculty and administrative leaders (cf. QI in Figures 3 and 4). And there were no states with fast growth and expanding equity in institutional parity (Figure 5). Indeed, only three states—Montana, New México, and Wyoming—all with below-average Hispanic growth, had any increase at all in institutional parity.
Discussion
Two decades ago, Chapa and Valencia (1993) concluded from their study of trends in Latino population growth and education of the preceding two decades that “it is quite clear that the more Latinos grow, the more they get behind” (p. 184). Based on the results of this study, this statement may well extend to the situation today for Latina/os in higher education. Recent reports (Fry & Taylor, 2013) indicate Hispanic high school dropout rates are at an all-time low and that a greater share of recent Latina/o high school graduates are going to college compared with their White counterparts. Coupled with rapid demographic growth throughout the nation, there is good reason to believe that the future is promising for increasing participation by Latina/os in higher education. However, the enrollment and academic attainment of Latina/os must rapidly increase just to keep pace with demographic growth (Ortiz, Valerio, & Lopez, 2012; Santiago, 2010, 2011). By problematizing the widely reported increase of the participation of Hispanics in higher education as related to their increasing share among the U.S. population, this study found that on a state-by-state basis, contrary to national trends, demographic growth was actually negatively associated with changes in equity for Latina/o students over the last decade.
The overall national increase appeared to be a function of expanding equity among a majority of states, which happened to also see less-than-average Latino population growth. The wide variety of fast or moderate growth among states, coupled with either expanding or stagnant equity, underscore the importance of disaggregating national trends to understand state differences in enrollment equity changes.
The study also underscores the stagnant hiring and retention rates of Latina/os among the faculty and administrative leadership ranks. Going back decades, the representation of Hispanics in these influential campus groups has been stubbornly flat (Castellanos & Jones, 2003). This study confirmed this situation continues today in public higher education, at least numerically. That is, average equity rates across states show the paltry representation of Latina/o faculty and administrators just barely keeping pace behind the slowly increasing proportion of college degree holders who are Latina/os, but without closing the gap. But there was little evidence the trend is related to relative demographic growth. Rather, the phenomenon may ultimately be more closely related to enduring barriers to Latina/o student achievement (Llagas & Synder, 2003; Nora & Crisp, 2009) and hiring and retention of those Latina/os (Turner, González, & Wood, 2008) that vary among states in ways not captured by these analyses.
These two intersecting trends of generally increasing equity for Latina/o student enrollment (mainly in states with relatively moderate Latino population growth but declining where there is fast growth) and stagnating but random equity trends for Latina/o faculty and administrators, means that there are few general trends shared between states. The institutional parity index may be the best of the three measures we studied for telling this story of variation within the New Latino Diaspora. For one, the institutional parity index is closely associated with variations in demographic growth (compared with models for other indices, this variable’s coefficient had a lower standard error). In addition, this one measure simultaneously accounts for trends in changes to equitable participation of Latina/o students, faculty members, and administrators. As a measure of institutional receptivity, it constitutes a relatively holistic view of equity. Second, in practical terms, the data for calculating this index are the most complete and perhaps reliable: As opposed to survey data estimates used for the enrollment equity and personnel equity indices that introduce much error and missing data, the institutional parity index comes from IPEDS data that are obligatory institutional census counts with nearly 100% response rates (Ginder, Kelly-Reid, & Mann, 2014). This is especially important for parts of the country with relatively small populations that are sometimes poorly estimated in survey research. Finally, the institutional parity index refers to conditions within institutions. Thus, it reflects clearly the conditions of equity, sometimes deplorable (Bensimon, 2007), over which colleges have the most direct influence and stewardship regardless of their setting.
In deriving implications of our findings, we return to the idea that frameworks such as funds of knowledge and social and cultural capital are valuable conceptual perspectives for conceptualizing of equity concerns broadly and for interpreting even demographic studies like the current one—even when their application requires an iterative, reflective, and perhaps indirect process (Rios-Aguilar, 2014). The risk of falling into a predominant deficit-oriented discourse is ever present. The interpretation of numbers and proportions of participation are by definition relative to other people or times. It can be challenging to not invoke constructs such as the achievement gap, student success, and other rhetorical shorthand. These familiar approaches, though typically well-intentioned, emphasize the discourse of Black and Brown weakness—vis-à-vis supposed White strength—and the achievement of persons of color as exceptional—rather than expected—even as they de-emphasize institutional and societal responsibility (Ladson-Billings, 2007). We authors are aware that we may not live up to the ideal of avoiding this discourse in all aspects of this article, but we are sensitive to it and seek to understand academic equity in the context of larger systemic power structures within educational systems.
Kiyama, Rios-Aguilar, Sarubbi, and Mora (n.d.), in a content analysis of the literature, observe that studies that employ frameworks of forms of capital and funds of knowledge are too often characterized by a lack of conceptual clarity and specificity. Aggregated demographic figures utilized in this study do little to afford the specificity needed to apply a framework of forms of capital, field, and habitus. Funds of knowledge, however, has some central tenets that may apply when interpreting changes in growth and equity rates, even in broad terms. One is that the social history of households and communities and the productive or labor activities of their members in formal and informal economies are at once the generating force of knowledge and practices and the funds themselves used for exchanges within social networks. Those funds are only formed and made exchangeable through ongoing lived experiences within a context of institutions, mediating artifacts, and goal-oriented activities (Kiyama et al., n.d.). The applicability of this concept to the growth and movement of Latina/o households and communities in various geographical settings seems relatively straightforward: It takes time and perhaps a critical mass of people (Gonzales, 2015) to mobilize funds of knowledge to have full access to existing structures, let alone change their nature. Numerical demographic change does not reveal details about activities in homes, neighborhoods, communities, classrooms, college business offices, auditoriums, recruiting centers, board rooms, faculty senates, and other settings where equity in higher education is fostered or repressed. But demographic change necessarily entails those activities.
Implications and Conclusion
The picture that our results paint regarding the status of equity for Latina/os in higher education leads to a few implications for practice and for research. The institutional parity index lays bare the rapidly widening gap between incoming Latina/o students and the proportion of Latina/o faculty and administrators across all states. This index highlights how current participation trends, though positive, will not achieve equitable higher education participation for Latina/os within the foreseeable future without exceptional effort and structural changes (Chapa & De La Rosa, 2006; Santiago, 2011; Villalpando, 2010). If past trends continue, findings suggest that while many states with relatively moderate Hispanic population growth might indeed expect to see more Latina/o students enrolling in greater proportion to their representation among residents, this is not the case for most states, and for virtually all states it is unlikely that colleges will be able to achieve greater equity among faculty and administrator ranks without robust and sustained efforts to recruit and retain qualified Latina/o personnel (Ponjuan, 2011). The demographic boom of Hispanics has not yet produced a critical mass of college graduates among the higher education labor pool, nor do findings here suggest that it might in the near future.
Findings show that changes in Hispanic demographics and changes in higher education equity may be related, but the overall trend is not positive as popularly understood. Rather, it is an inverse relationship that may hold true throughout the United States, with variation due mostly to the relative local base status of equity for Latina/os. This means no public college, regardless of whether in a state experiencing moderate or fast Hispanic growth, has the luxury of waiting for local growth of Latina/os to diversify its campus and still contribute to actively increasing equitable participation of Latina/o students, faculty, and administrators. These implications are especially pressing for the community college sector where Latina/os are more likely to attend compared with other sectors (Kurlaender, 2006) and which our findings show has distinctly lower equitable representation of Latina/os among faculty and administrators compared with other sectors. This growing disparity illustrates one way that “democracy’s colleges” are challenged to embody and reflect democratic and multicultural values they aspire to (Rhoads & Valadez, 1996). And it confirms there is indeed a genuine “crisis” in community college leadership that Gutierrez and colleagues (2002) identified a decade ago and, findings reveal, may only have intensified since.
In terms of research implications, despite the longitudinal analyses this study employs, the findings are fundamentally descriptive, and so the study does not necessarily yield evidence of causal relationships. This, however, follows from how equity indices were designed to be used within accountability systems that could be leveraged to uncover inequities and motivate investment of resources to uncover and address the causes (Bensimon et al., 2003). Our study contributes to the research literature by problematizing the common discourse that widespread Latina/o demographic growth is a driving force in realizing Latina/o higher education equity gains. We propose a way to contextualize equity indices using the very background population trends that so often figure in the framing of equity studies. By plotting changes in equity indices by population growth, we reveal a complex and varied equity landscape for states nationwide, which also provides a framework with which to explore it. For instance, researchers have often considered institutional-level characteristics for understanding differences in Latina/o student outcomes (Arbona & Nora, 2007; Hurtado, 1994; Rodríguez & Galdeano, 2015). This study suggests that it may be worthwhile to consider differential outcomes in peer institutions in states with similar and divergent growth rates and equity trends to further investigate contextual factors. Perna and colleagues (2010), in their study of higher education equity for Latina/os in Florida and Texas, noted the importance of disaggregating equity indices by state and by sector in just two states. They found that in Florida and Texas, inequity was most pronounced at public flagship universities. Our findings, however, show that nationally, equity rates at prestigious flagship and research universities were similar to other 4-year colleges and that inequity was instead most pressing in community colleges. But given the variation in state trends of equity rates, our findings suggest that the equity landscape of Florida and Texas may not be typical of other states at all. Rather, they are likely to have circumstances similar to states with relatively moderate Hispanic growth rates coupled with relatively stagnant equity gains. Other states are experiencing very distinct patterns of growth and equity changes—some more favorable than others. A large portion of the research on Latina/o equity issues and emerging trends look to places like California, Texas, and Florida as harbingers of what is to come in the rest of the country. The findings here raise questions as to whether or to what degree the comparison with other states is appropriate in some cases. If current demographic trends continue, other states may ultimately follow a path trod by California, Texas, and Florida, but in the meantime, local differences in degree and kind of demographic changes and equity gains or losses may need to be considered on their own terms.
Footnotes
Declaration of Conflicting Interests
The author(s) declared no potential conflicts of interest with respect to the research, authorship, and/or publication of this article.
Funding
The author(s) received no financial support for the research, authorship, and/or publication of this article.