
Abstract
We study the impact of peer effects on the academic achievement of economics students in Pontifical Catholic University of Ecuador (PUCE) Ecuador, for both semesters of 2018. The estimates from our random-effects model show a significant influence of the average-group, high-achieving, and low-achieving peers. These results are robust with the presence of socioeconomic, academic, and teaching quality covariates. The findings suggest that systems that prioritize course enrollment according to previous scores may exacerbate a peer-driven bias in student performance.
Introduction
Despite recent efforts to improve the quality of higher education, students from developing countries show low academic performance, influenced by associated factors. Starting with the seminal study by Coleman (1966), there is a consensus in the literature that academic achievement is significantly influenced by contextual factors, thereby conditioning drop out or academic success rates (Vélez 2005 in Vargas, 2007). While embodied in the student’s socioeconomic, cultural, cognitive, and emotional dimensions (Vargas, 2007), these factors can be analyzed in a hierarchical structure. The structure starts at the personal and family level, followed by the group or course level, and the educational institution level (Vargas, 2007). The latter includes relevant factors such as teaching quality, the student–teacher relationship, and infrastructure conditions as commonly significant determinants of individual scores (Vargas, 2007).
At the personal level, the most cited factors influencing academic performance include parental education, the number of household members, and socioeconomic status (SES; Coleman, 1966). In addition, ethnicity and, more recently, gender disparities remain significant with respect to academic performance (Kao, 2019). At the course or classroom level, peer effects have been suggested as statistically significant determinants of individual scores (Vargas, 2007). Peer effects may be defined as the impact of the study group over the learning environment and individual academic achievement (Illanes, 2014). Therefore, the learning environment and personal factors affecting classmates (peers) may affect individuals according to which group they belong to. Despite evidence of the importance of peer effects, especially in developing low-achieving environments (Izaguirre & Di Capua, 2020), no research on peer effects has been conducted yet in Ecuador.
In 2018, Ecuador had a dropout rate in higher education of 32%, the third-largest in the region. The Pontifical Catholic University of Ecuador (PUCE) is one of the top universities in the country, and as of 2018 hosted 19,828 students. Following its catholic and humanitarian values, PUCE grants scholarships to students in low SES and vulnerability conditions, seeking to offset their dropout while promoting equality of opportunity and inclusive education (PUCE, 2019). However, a recent study by Buenaño et al. (2021) suggests that not only the SES but also internal institutional and academic variables may be key determinants of student outcomes at PUCE. Mancheno et al. (2017) pioneered a study at the School of Economics at PUCE, which observed a positive relationship between academic performance and the SES and a negative influence from class size. Considering that PUCE institutionalized a course enrollment system that prioritizes course selection, based on the scores achieved during the previous semester, we hypothesize that this mechanism produces a bias by concentrating high-achieving students and segregating low-achieving students in dissimilar groups. As a consequence, this enrollment system may also produce a bias against individual performance by means of peer effects arising from high and low-achieving students. Accordingly, our research question asks: how much do peer effects influence the academic achievement of economics students at PUCE? We aim to shine a light on the academic debate regarding the significance of peer effects as well as contribute consistent educational policy tools that seek to improve the academic achievement of higher education students in the developing world.
The article has the following sections: Section 1 reviews the theoretical and empirical literature relating to education and peer effects; Section 2 describes the methodology, estimation model, and data characteristics; Section 3 reports the results discussions; and Section 4 provides conclusions and recommendations for further policy and practice.
Literature Review
Theoretical Background
The study of human capital started with the pioneering work of Schultz and Becker (1964) who proposed that individuals invest in education to increase their future productivity and income. After this study, according to Hanushek (2020), the analysis of human capital took two different pathways. The first would focus on skill development for the labor market, with an aim to increase future income, as suggested by the Mincer (1970, 1974) earnings function.
The second approach would not measure skills by school attainment but rather by cognitive skills proxied by standardized tests scores, which are determined by educational factors. The Coleman (1966) report pioneered the correspondence between school resources and academic outputs. This approach motivated authors such as Bowles (1970) and Hanushek (1979) who suggested a functional relation between input combinations and academic outputs, that is, an educational production function. Moreover, Hanushek (1979) considered inputs such as nutritional status, family background, school characteristics, teaching abilities, and the influence of the other students, that is, peer effects. Among these contextual factors, there is a consensus on the significance of SES on academic achievement (Broer et al., 2019). Thereafter, this approach to human capital became policy motivated, as the drivers of educational outcomes or skills could either be traced back and directly influenced by policy makers or be identified as contextual, such as family background, learning abilities, and peer effects (Hanushek, 2020).
Given the aforementioned theoretical frameworks that highlight the significance of education and peer inputs, and the particularities of the course enrollment system in PUCE, we are interested in investigating the influence of peer effects arising from this selection mechanism over the academic achievement of students at the School of Economics at PUCE Ecuador.
Empirical Review
As peers play a fundamental role in motivation, aspiration, and interaction, it is expected that they significantly influence group learning (Hanushek et al., 2003). Macneil et al. (2009) found that peer performance averages have a positive and significant effect on learning processes throughout the test score distribution. However, as appraised by Vigdor and Ludwing (2010), peer effects may not only boost the learning process but also jeopardize it, for example, through class interruptions, namely, when students are emotionally engaged (Wang et al., 2018). Accordingly, a recent study by Facchinello (2019) found that beliefs and grades are significantly affected when students are assigned to better classes, that is, when courses have exceptional leading peers.
For Latin America and the Caribbean, a recent study by Izaguirre and Di Capua (2020) concluded that the magnitude and significance of peer effects in primary education depend on the course and the school type. According to Barrera (2010), peer effects are significant in Colombian high schools, while Ferrera (2013) suggested that the SES, parents’ education, and peer scores are the strongest determinants of academic performance.
At the higher education or university level, research has shown that peer effects vary according to course type. Carrell et al. (2009) pioneered a controlled experiment on peer effects and found that they were significant in mathematics and sciences but not significant in physical education and foreign languages. Later, Lavy et al. (2012) included parameters for the top 5% and bottom 5% of students. They observed a negative influence from low-performance peers, but little or no influence from high-performance peers. Finally, Androushchak et al. (2013) noticed that higher ability peers showed a positive effect in economics, mathematics, and their individual grade point average (GPA), whereas no effect was found from low-ability peers. We build on these studies, with particular inspiration from Lavy et al. (2012), to develop our own random effects estimator to be applied to the Ecuadorian higher education context, specifically in economics students at PUCE, as described in the next section.
Method
Data Source
The study investigates causal effects between peer effects and academic achievement at the School of Economics at the PUCE. First, academic data, including grades, courses, and lecturers, were obtained from the School of Economics. Moreover, the Institute of Economic Research at PUCE structured a teaching “Hetero-evaluation” indicator at the faculty level, for the year 2018, by surveying students on the teaching performance inside the classroom. Finally, the Student Welfare Department at PUCE provided socioeconomic information about each student. The latter is possible due to the SES study performed each semester at PUCE, as part of its scholarship program and humanitarian objectives, which assigns students into socioeconomic categories and charges differentiated tuition fees. In this respect, Category A implies the lowest SES, while Category F is the highest. We used 1,033 observations for the estimation model. All data corresponds to the first and second semesters of 2018. This includes missing data from the first- and eighth-semester students, from 2018-02 and 2018-01, respectively, since there is no ex-ante and ex-post semester to compare.
Identification Problem
We compiled a comprehensive database with the courses from both semesters and another with consecutive courses. By applying the IDs of each student and their corresponding course, we created groups for each semester, which also identified the course they took in that semester and the one that followed in the next semester. Thus, a comprehensive identifier was defined for each student, the student ID, the group of consecutive courses they took in the first semester and the consecutive course they took in the next semester, the current course, and whether they repeated the course or not. Following this categorization, it was not possible to include students in their seventh and eighth semesters because at the School of Economics students take elective courses from their seventh semester. This identification process was key to performing regression analysis on our panel dataset to enable an observation per period per person.
Variables Description
The variables applied in this study define personal, socioeconomic, and academic characteristics from students at the School of Economics at PUCE. We followed the recommended consensus in the literature to apply contextual factors of academic achievement, including the SES (Androushchak et al., 2013; Broer et al., 2019). Consequently, we applied controlled variables, including the number of household members, parental income, and family expenses as proxies for the SES. By additionally applying a panel dataset and our random-effects model, these covariates isolated the causal effects of socioeconomic variables on the student’s academic performance.
Moreover, variables of students’ personal characteristics were used to account for their individual features and how these influenced their academic performance. Therefore, following Vargas (2007), Lavy et al. (2012), and Androushchak et al. (2013), we applied variables such as the number of credits taken in the semester (numbers of courses taken), any disabilities or illnesses registered for the SES process at PUCE, and the type of high school that the student attended. Finally, we used score data from each student for each course at four grade stages per semester. Consequently, it was also important to account the number of absences in each course and the lecturer who taught the course in that semester.
Finally, we conducted a survey to a 95% representative sample of 110 students at the School of Economics at PUCE to collect information about teaching quality perception as a proxy for teaching quality. The survey was conducted in Spanish. Considering the severe acute respiratory syndrome coronavirus 2 (SARS-COV-2) pandemic, the survey was sent via email and completed online, showing an average response rate of 72.37%. The survey contained 10 questions regarding teaching attributes in the employment of methodology, tools, academic standards, flexibility, among others. Each question included a list with the names of lecturers at the School of Economics at PUCE, according to the course in which the student enrolled. For example, students were asked to rate the quality of teaching tool implementation (blackboards, virtual classrooms, didactic books) on a scale between −5 (the worst) and +5 (the best). This enabled us to build a teaching quality indicator by adding all the positive and negative votes for each lecturer and ranking them accordingly. A “high quality” lecturer (highteachqual) earned a maximum of 221 votes and a “low quality” (lowteachqual) lecturer earned a minimum of −187 votes, with a standard deviation of 77.02 votes. Subsequently, this variable was normalized with a mean of 0.46 and a standard deviation of 0.189, thereby creating our main teachqual indicator. As the results of real teaching evaluation have a privacy policy restriction at PUCE, we performed a statistical validation at the 10% confidence level, between our hightechqual and lowteachqual indicators and academic performance (see Appendix Table A1).
For further validation of our teaching quality indicator, while complying the mentioned privacy policy, we performed multiple random effect regressions between our indicator and an official teaching “Hetero-evaluation” indicator (heval; see Appendix Table A2 and Figure 1). The heval indicator was structured and shared by the Institute of Economic Research at PUCE (2018b) and contains the results for the Hetero-evaluation process at the faculty level for the year 2018. The Hetero-evaluation at PUCE surveys students on “the teaching performance inside the classroom, taking into account the methodology and pedagogics of each lecturer” (PUCE, 2017, p. 25). The heval indicator for 2018 has an average of 86.97 points and a standard deviation of 7.59 points out of 100 possible points. This variable was normalized with a mean of 0.75 and a standard deviation of 0.19. This indicator did not reveal any personal data of the lecturer; therefore, we were only able to match heval with own indicator at the course level. However, this was sufficient to perform the mentioned regression analysis in Appendix Table A2, where a strong and statistically significant correlation at the 99% confidence level, between our teachqual indicator and heval, was observed in all models. Finally, one of our robustness check estimations in Table 2 excludes any teaching quality indicator, confirming the consistency of our results. Our main findings, described in the next sections, thus remained robust.
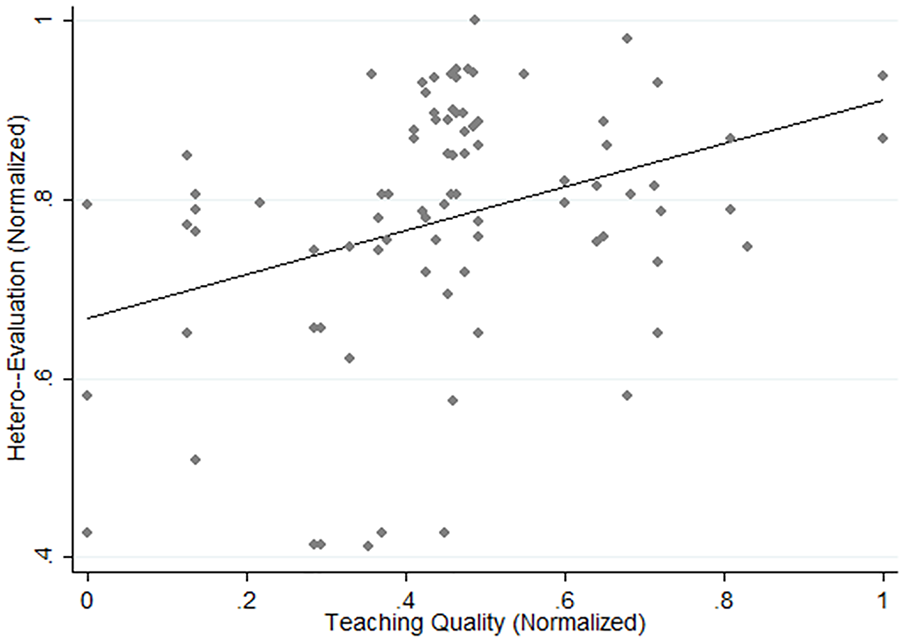
Correlation between teaching quality (teachqual) and hetero-evaluation (heval).
Descriptive Statistics
The PUCE (2018c) categorizes the SES of the student according to family income, assets, household members, expenditures, and debt, among other factors. This information, not only self-declared but also cross-checked via tax information, is used by the university to charge differentiated tuition fees and subsidize the students from low-income households. For the sample of 190 students applied in our study, 24.20% belong to Category A, the lowest SES, with an average monthly income of US$793.33. Category B has 23.14% of students, with an average income of US$1318.89, while 26.04% belong to Category C, with an average income US$1593.15. The higher SES categories include 17.62% of students in Category D, 7.55% in E, and 1.4 % in F, with average incomes of US$2.103.58, US$3.692.59, and US$5.000.00, respectively. We also consider a variable of family income per capita for each student (incomepc), which consists of the sum of all sources of income divided by the number of household members. The incomepc variable shows an average of US$427.19 and a standard deviation of ±US$334.59. This relatively high variance is consistent with the socioeconomic disparities reflected in the SES categorization.
The average number of credits taken by each student is 21.19 or an average of 5 courses per semester. The grades consist of three intersemester exams over 10 points and a final exam over 20 points, which together account for a semester grade over 50 points. For our sample, the average semester grade was 36.29/50 points, 7.5/10 points for the intersemester exams, and 14.25/20 points for the final exam. As suggested by Lavy et al. (2012), we also identify top- (phigh) and bottom-achieving students (plow). Considering that each course has an average of 15 students, we asserted that the upper and lower boundaries should increase to 10%, instead of 5%, as adopted by Lavy et al. (2012) in a much larger sample. It is worth noting that our results remained robust with the application of 5% boundaries, as reported in Appendix Table A3. Therefore, plow represents students at the bottom 10% of the group performance (lowest grades) while phigh represents students of the top 10%.
Estimation Model
Our models are consistent with the foundations provided by the educational production function by Hanushek (1979), as defined in Equation 1:

The model considers academic performance of student i, at the school j (

Moreover, the model by Lavy et al. (2012) displayed in Equation 3 proposed a production function with peer effects of high and low-achieving students at ages 11 and 14.

Their estimated achievement for student
Finally, by applying our Equation 4, we estimate the effects of high and low-achieving university peers influencing student performance at the School of Economics at PUCE. We do so by estimating the academic performance (

The model estimates
We estimate Equation 4 via a random-effects regression. We apply random effects because the personal error components do not correlate with each other and are not correlated with time (Wooldridge, 2013). The random-effects estimator is useful if we assume that the unobserved heterogeneity is not correlated with the controls. Therefore, we applied a Hausman test, against the hypothesis of applying a fixed effects estimator, which would instead eliminate the unobserved heterogeneity. The results on the Hausman test in Appendix Table A4 suggest the use of a random-effects estimator. Finally, this estimator assumes no perfect linear relationship among the explanatory variables (Wooldridge, 2013). This assumption was verified through our test in Appendix Table A5.
Results and Discussion
Estimation Results
According to the model introduced in Equation 4, we estimated the peer effects of the average, low-ability, and high-ability students (Peers, plow, and phigh) on individual academic performance. We controlled for the number of credits chosen by each student for each semester, gender (female), incomepc, siblings, and teachqual. We observe that
As reported in Table 1, the observed estimated coefficient for low-ability peer effects is −13.31 and for high-ability peer effects is +8.89. Both coefficients are statistically significant at 99% confidence level. This implies that, when the student belongs to the low-achievement group, the student final grade is expected to decrease by 13.31 points. For students who belong to the high-achievement group, their final grade is expected to increase by 8.89 points. Finally, the observed estimated coefficient for average peer effect is +0.70, implying a small yet positive and statistically significant effect at the 99% confidence level. The observed estimated coefficients of the family’s incomepc and identifying as female are positive and statistically significant at the 99% confidence level, whereas the observed coefficients of siblings and teachqual are not statistically significant. We posit that the latter may be explained by a greater influence of teaching attitude over academic performance, than the effect of perceived teaching quality (Heck & Marcoulides, 2006).
Peer Effects on the Academic Performance of PUCE Students.
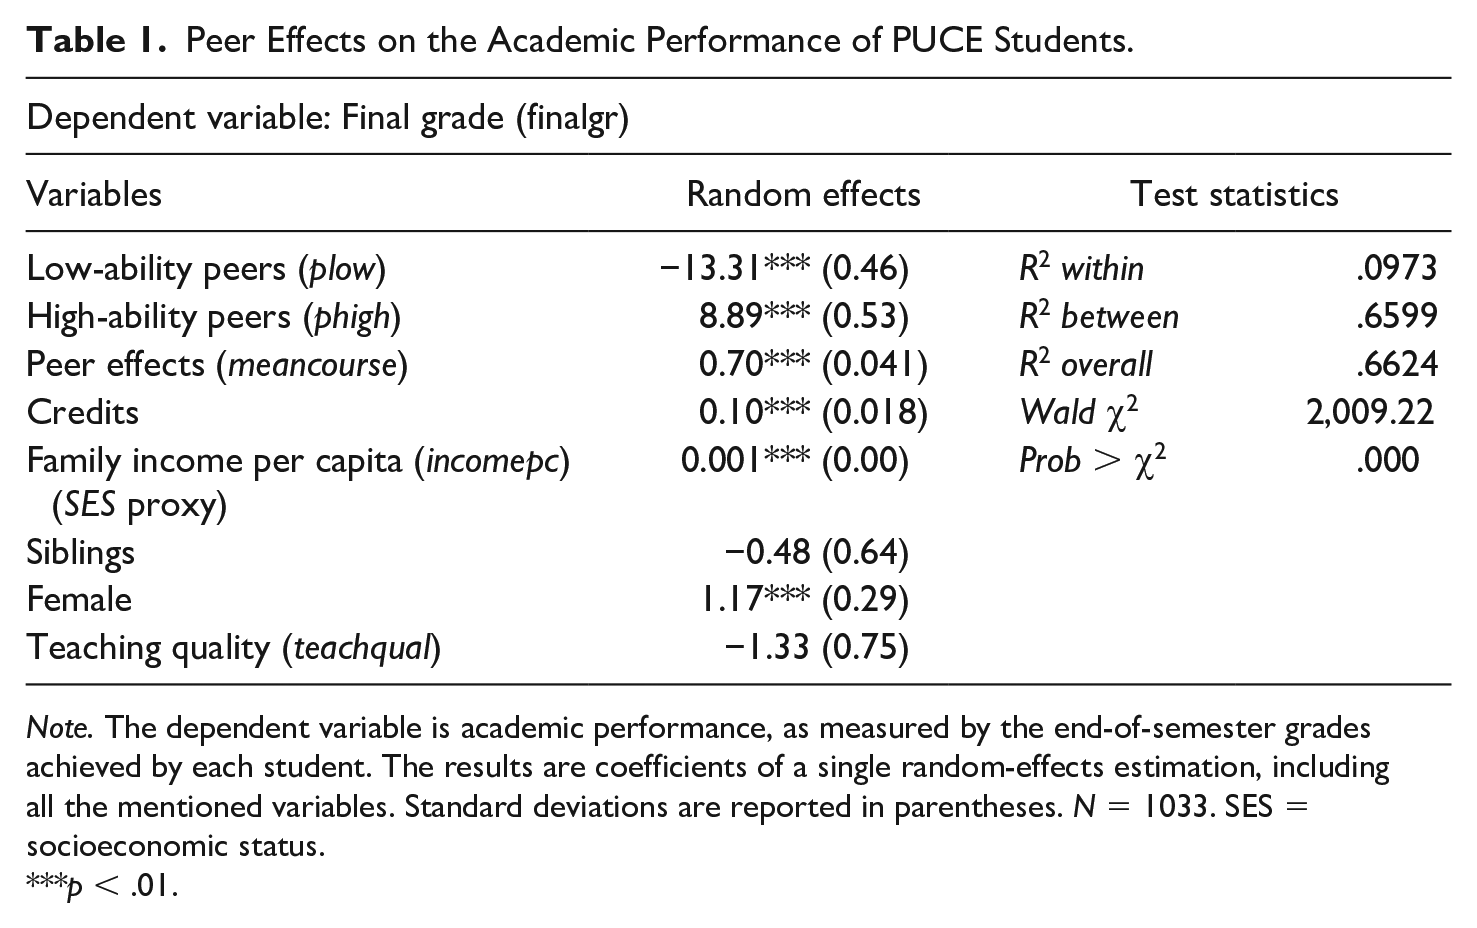
Note. The dependent variable is academic performance, as measured by the end-of-semester grades achieved by each student. The results are coefficients of a single random-effects estimation, including all the mentioned variables. Standard deviations are reported in parentheses. N = 1033. SES = socioeconomic status.
p < .01.
Robustness Check Estimations
To reinforce the strong and statistically significant relations observed in the variables of interest (Table 1), as suggested by Gonzalez-Gordon and Resosudarmo (2019), this study implemented robustness check estimations that included new relevant controls, aiming to address omitted variable bias. As depicted in Table 2, the first model for robustness check (1) replaced income per capita (incomepc) with expenditure per capita (expenditupc). This validates that the SES effect is being captured from either side of the circular flow of income. The second model for robustness check removed teachqual (2) from the original equation, while the third and fourth models removed credits (3) and female (4). These estimates are the result of individual random effects regressions. The results for the four models depicted in Table 2 are consistent with the results of the variables of interest observed in Table 1. In other words, low-ability students have a strong and significant negative influence on academic performance, high-ability students have a strong and significant positive influence on academic performance, and the average academic performance is also positive and statistically significant at the 99% confidence level.
Robustness Check Estimations.

Note. The dependent variable is academic performance, as measured by the end-of-semester grades achieved by each student. The results are coefficients of four different random effects estimations, including the covariates shown in the Table.
p < .01.
Discussion
The findings of this article are consistent with findings in the literature. The research by Lavy et al. (2012) concluded that peers from the bottom 5% negatively affect academic performance, while the peers from the top 5% contribute to the learning process. This finding was reinforced by the fact that these authors observed an average peer quality coefficient of 0.30 in their model, which heavily decreased to 0.12 when the top and bottom 5% of students were included. The latter suggests that, as also revealed in our research, the data tails can capture better the peer effects.
Moreover, the study by Androushchak et al. (2013) also confirmed that each student benefits from a group of high-achieving students. While they concluded that peers with higher academic performance have a positive effect on individual grades in economics and mathematics, the effect for low-achieving students was negative but not statistically significant. By contrast, our study revealed that not only did high-ability peers influence their classmates positively but also that low-ability peers affected them negatively. Furthermore, our findings of the average peer effects were consistent with Hanushek et al. (2003). They observed that average peer achievement positively and strongly influences the learning process and individual grades of the group. Aligned with Hanushek et al. (2003), our main results suggest that it is important to consider student reallocation policies, possibly accompanied by tutoring programs. The PUCE implemented an academic and accompaniment tutoring program in 2017. However, the findings of our study highlight the possibility of reevaluating the course enrollment system at PUCE, as it is associated with a peer-driven bias on individual academic performance.
Conclusion
In this article, we evaluated the peer effects on academic performance, motivated by a course enrollment system at the PUCE. We use a panel of academic and administrative data from the total student population at the School of Economics at PUCE, for both semesters of 2018. Subsequently, we applied a random-effects model to estimate the marginal effects of average, high-ability, and low-ability peer performance on the individual academic achievement of each student. Personal, socioeconomic, and teaching-quality control variables were included. Finally, we performed robustness check estimations and statistical data validations.
Our results revealed that individual academic achievement is strongly influenced by peer groups. Moreover, the course enrollment system at PUCE is not only creating a bias by concentrating and segregating high-achieving and low-achieving students but also a statistically significant peer-driven bias on individual academic performance. The observed estimates suggest that individual grades were strongly influenced by the grades of their high- (top 10%) and low-ability peers (bottom 10%). The average peer effects were positive and statistically significant yet not large. The family income per capita, the number of credits taken by the student, and their gender (female) also displayed positive and statistically significant coefficients in our study. Thus, we can affirm that individual academic achievement is significantly influenced by their peer groups: the average, top, and bottom group effects. Moreover, our study suggests a strong warning against course enrollment systems that prioritize course selection by students with the highest grades from the previous semester, as this polarization may trigger or exacerbate peer effects that significantly influence student performance across semesters and perpetuate segregation in student performance.
Recommendation
As a data limitation, we should acknowledge that our student cohort did not have the exact same timeframe for declared (and verified) family income. This is because students at PUCE report their income for socioeconomic re-categorization at the SES system every two years. However, we expect that the majority of families did not experience significant income changes across this short time of the study. This limitation would become very relevant when more data periods are analyzed, which we expect to do in a further study. Moreover, the dataset provided by the SES system unfortunately did not provide province of origin. Future studies could include this variable when available as literature shows a lack of consensus on the influence of this variable on academic achievement. Finally, beyond our significant socioeconomic and peer effects, we did not have access to information on life habits, including sleep, exercise, and eating behaviors, which may also influence student performance. Nevertheless, as literature shows, these habits are already correlated with ability, that is, to our unobserved variable, which we addressed with the estimation method, robustness checks, and tests applied in this study.
This research contributed to the ongoing debate regarding the degree, level, and significance of peer effects with respect to the academic performance of university students. It is therefore necessary to review and strengthen current university and government educational policies, ensuring consistency with our findings relating to strong peer influence, and aiming to improve the academic achievement of higher education students. Moreover, the results of our research concurred with the literature consensus: Socioeconomic effects are strong determinants of academic performance. Therefore, we support the application of inclusive policies in favor of students from low socioeconomic conditions and vulnerability, such as the PUCE scholarship program, as these promote equality of opportunity for students and their peers.
Footnotes
Appendix
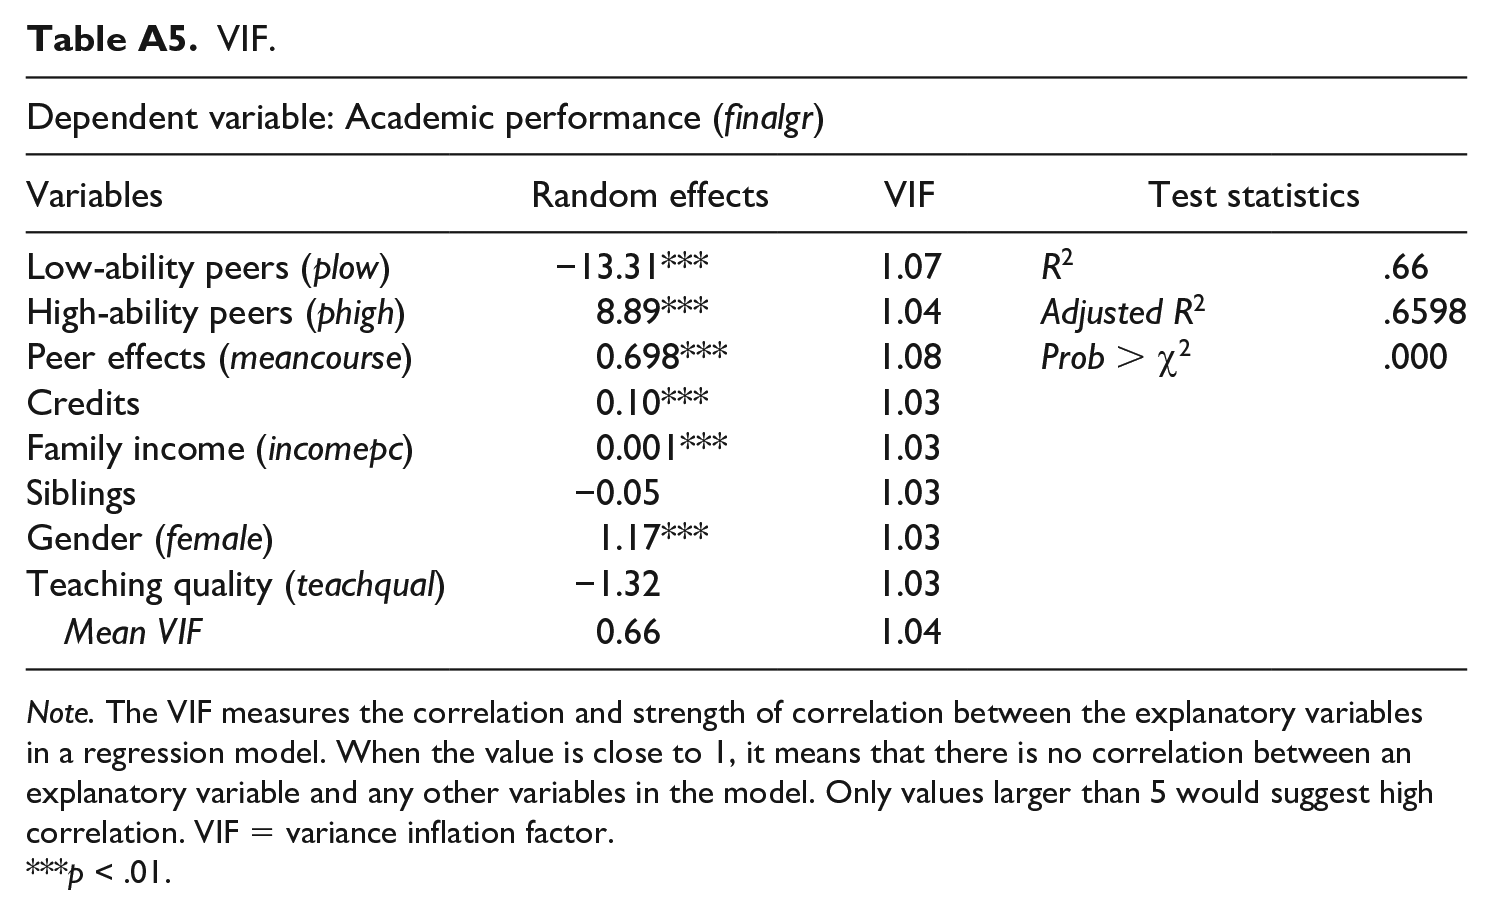
VIF.
| Dependent variable: Academic performance (finalgr) | ||||
|---|---|---|---|---|
| Variables | Random effects | VIF | Test statistics | |
| Low-ability peers (plow) | −13.31*** | 1.07 | R 2 | .66 |
| High-ability peers (phigh) | 8.89*** | 1.04 | Adjusted R 2 | .6598 |
| Peer effects (meancourse) | 0.698*** | 1.08 | Prob > χ2 | .000 |
| Credits | 0.10*** | 1.03 | ||
| Family income (incomepc) | 0.001*** | 1.03 | ||
| Siblings | −0.05 | 1.03 | ||
| Gender (female) | 1.17*** | 1.03 | ||
| Teaching quality (teachqual) | −1.32 | 1.03 | ||
| Mean VIF | 0.66 | 1.04 | ||
Note. The VIF measures the correlation and strength of correlation between the explanatory variables in a regression model. When the value is close to 1, it means that there is no correlation between an explanatory variable and any other variables in the model. Only values larger than 5 would suggest high correlation. VIF = variance inflation factor. ***p < .01.
Acknowledgements
The assistance in data release toward this research, by the School of Economics, the Institute of Economic Research, and the General Students Office at the Pontificia Universidad Católica del Ecuador (PUCE), is hereby acknowledged.
Declaration of Conflicting Interests
The author(s) declared no potential conflicts of interest with respect to the research, authorship, and/or publication of this article
Funding
The author(s) received no financial support for the research, authorship, and/or publication of this article.
Author Biographies
References
Supplementary Material
Please find the following supplemental material available below.
For Open Access articles published under a Creative Commons License, all supplemental material carries the same license as the article it is associated with.
For non-Open Access articles published, all supplemental material carries a non-exclusive license, and permission requests for re-use of supplemental material or any part of supplemental material shall be sent directly to the copyright owner as specified in the copyright notice associated with the article.