
Abstract
The article presents the results of a study investigating the growth of metropolitan London from the second half of the nineteenth century to the present. A high-resolution longitudinal land-use database, assembled from historical Ordnance Survey maps, is used to trace the patterns of land development in a 200 km2 area of West London from 1875 to the present. The land-use database is then employed to develop a cellular automata model, which explores the impact of key forces shaping the patterns of metropolitan growth. The analysis highlights the interplay of three critical factors: (1) the preurban spatial structure determined by the patterns of settlements and infrastructure predating the expansion of the metropolis; (2) the urban code representing a set of consistent rules that describe the spatial interaction of land uses with elements of the built environment; and (3) the mixture of planning and development policies advanced by public and private initiatives related to infrastructure investments, density regulation, and open space preservation. Contrary to the popular view rendering the growth of London as an outcome of uncoordinated private initiatives and market-based forces, the study advances the argument that planning played an important role in shaping the patterns of metropolitan expansion. Our analysis reveals, however, that the impact of planning was strongly conditioned by the elements of the preurban spatial structure and the mechanisms of the urban code.
Introduction
Since the beginning of the industrial age, metropolitan areas have been the fastest growing concentrations of population consuming the majority of the planet’s resources. 1 Today, as contemporary societies struggle to face the dual challenge of global climate change and depleting natural reserves, it is imperative to improve our understanding of the phenomenon of metropolitan growth by casting a sharp light on its patterns and determinant forces.
This study examines the historical evolution of metropolitan growth in London in search of answers to three basic questions: (1) How do metropolitan areas emerge and grow in terms of the imprint of urban activities on the ground? (2) What are the main forces shaping these spatial patterns? and (3) What has been the role of planning in this process?
The first question appears to be a trivial one; yet, to this day, there are no comprehensive historical accounts documenting with high level of spatial and temporal accuracy the growth of any metropolitan area. Curiously, urban science has made surprisingly little progress beyond the generic conceptualizations of urban growth offered by Burgess, Hoyt, and Harris and Ullman more than half a century ago. 2 Metropolitan growth patterns have been described with greater detail in historical accounts of the evolution of particular places within metropolitan areas; 3 with selective examples from various urban areas used to illustrate specific historical processes and trends such as suburbanization or globalization; 4 or with metropolitan-wide aggregate statistical data painting the general picture of urban growth, but unable to capture the spatial detail and richness of activity patterns on the ground. 5
The absence of metropolitan-wide studies based on data with high spatial and temporal resolution has impeded our understanding of how cities grow and change in two important ways. First, it has limited our ability to refine existing theories of urban growth, which remain rather general in their description of metropolitan growth patterns. Suburbanization, for instance, has been identified as a global phenomenon, 6 but such broad generalizations fail to capture the rich variety of urban/suburban form documented in different parts of the world. 7 Second, the absence of high-resolution historical data places a significant limitation on the validation of theories that link urban spatial patterns with specific socioeconomic forces, particularly those that help us understand the impact of planning on urban development.
Through new analytical tools, it is possible to depict the dynamics of metropolitan growth more precisely. By developing a unique longitudinal land-use database, we were able to trace the emergence and growth of London’s metropolitan fabric with a high level of spatial and temporal resolution over an extended historical period. The study spans the course of three centuries, which witnessed sweeping changes in modes of production, technology, political regimes, and cultural norms. Our aim was to capture the interplay between natural processes of self-organization and purposeful transformations of the built environment directed by public policies and development regulations.
A Methodology of Analysis
London is an appropriate case study for analyzing metropolitan growth since it was the first modern metropolis of the industrial age. As such, London became a model emulated by many cities around the globe. The massive decentralization of population and economic activities, which took place in Greater London during the industrial period, mirrored the suburbanization of other large cities in the Anglo-Saxon world 8 and beyond, with lasting impacts on contemporary development patterns around the globe.
The selection of West London as an area of concentrated analysis within the metropolitan territory of Greater London was dictated by the time and resource constraints of the project. The study area, covering 200 km2 of West London, was a major axis of London’s historic growth. 9 The large spatial extent of this study area encompassed a rich mixture of local jurisdictions, which ensures that the recorded development patterns comprise a broadly representative sample of London’s metropolitan fabric. The east boundary of the study area is defined by the edge of the compact city in the initial study year of 1875, which at that time coincided roughly with the western edge of Hyde Park. The study area expands 20 km westward to the edges of London’s Green Belt defining the boundary of contemporary Greater London (Figure 1).
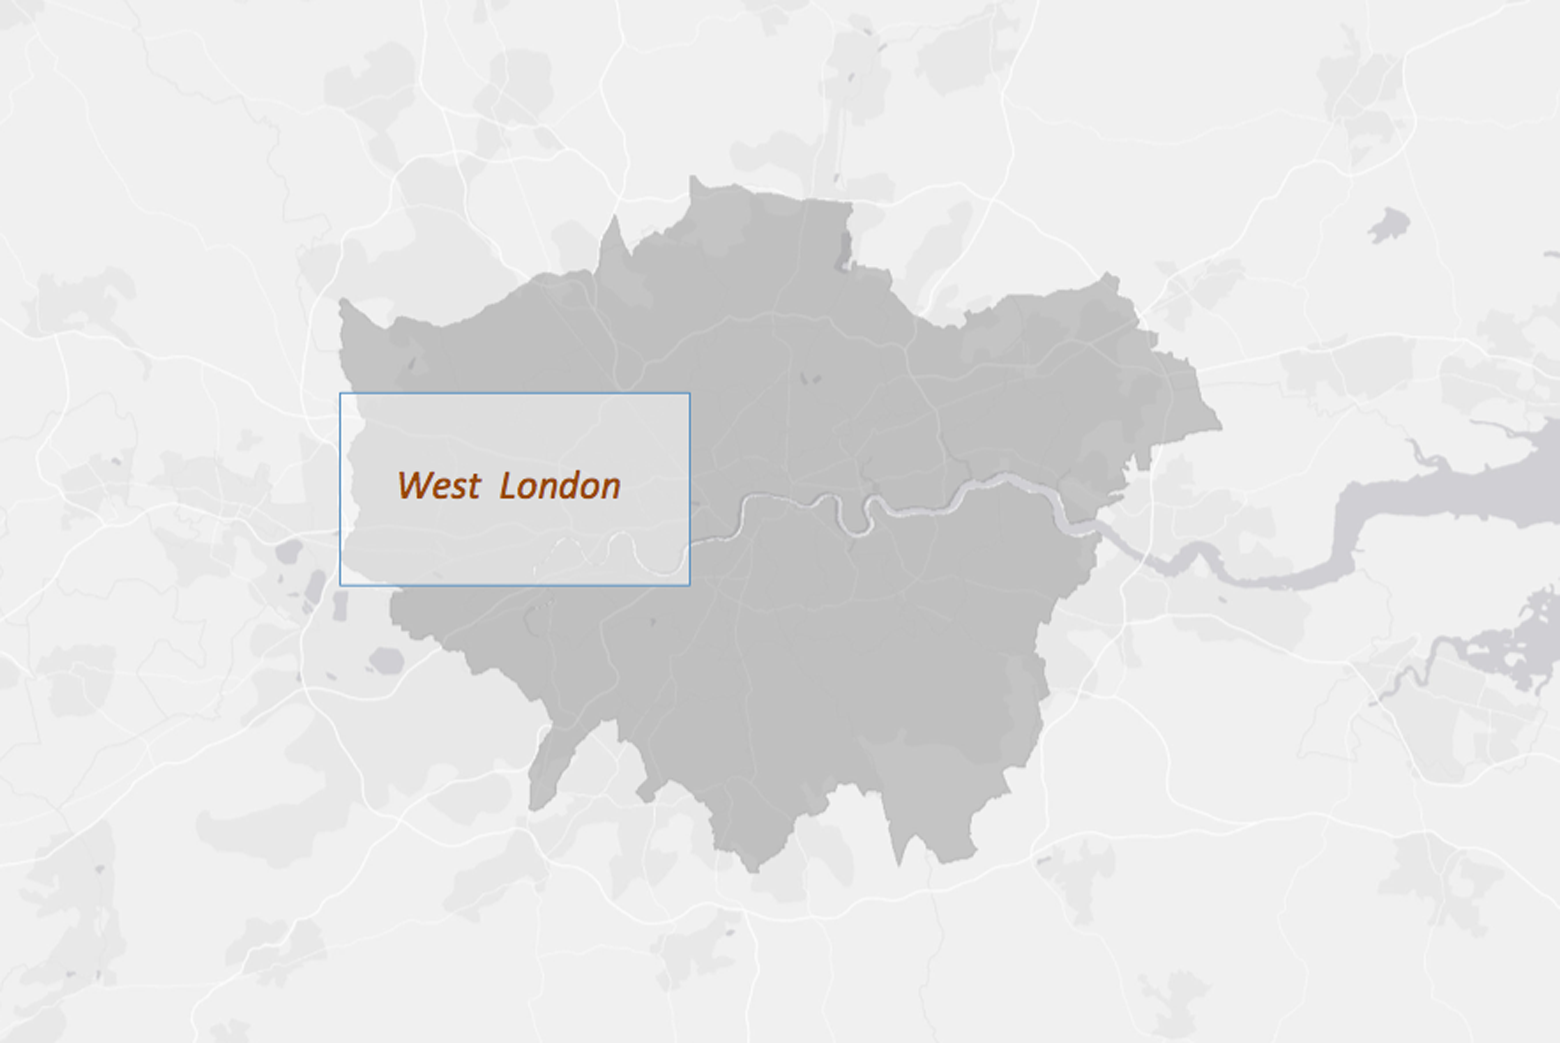
Study area.
In order to develop a land-use change database, we used historic Ordnance Survey (OS) maps at a scale of 1:2,500 recorded in roughly twenty-year increments (1875, 1895, 1915, 1935, 1960, 1985, and 2005). 10 The amount of detail represented on the maps allowed identification of nearly sixty land-use classes with a high level of spatial and interpretational accuracy. By extracting and piecing together the land-cover data recorded in the original OS maps, we generated land-use map series of the study area in seven time slices. This allowed us to reconstruct in a systematic and consistent way the dynamics of land development from the initial year of 1875 to the present. In order to improve the accuracy of our land-use data, we cross-referenced the results of our map interpretation with several land-use databases for Greater London. 11 In addition to the development of the land-use database, we reconstructed meticulously the evolution of the infrastructure network in the study area. This process included the digitization of each roadway, railway, and waterway shown on the OS maps; and a recording of the location and opening date of each railway and underground station.
In order to grasp the dynamics and trends in the spatial interactions between land uses and the built environment, we analyzed the spatial distribution of land uses relative to several factors including: distance to the Central Business District (CBD), major roads, railway and underground stations, and suburban centers. The insights gained from this analysis were used as a basis for the development of a cellular automata (CA) model of metropolitan growth. 12 The advantages of using a CA-based model compared to other, better established and more conventional land-use modeling techniques are related to the ability of CA systems to capture the complexity of the urban pattern at the highest level of spatial resolution. 13
For the development of the CA model, we chose to use METRONAMICA. A critical advantage of this modeling system, compared to other popular CA systems such as SLEUTH, is its ability to model the spatial behavior of a variety of urban land uses. 14 In order to simplify the model to a manageable set of variables, we aggregated the land-use data to nine main classes, whose spatial dynamics were simulated by the model (Table 1).
Land-Use Classification.
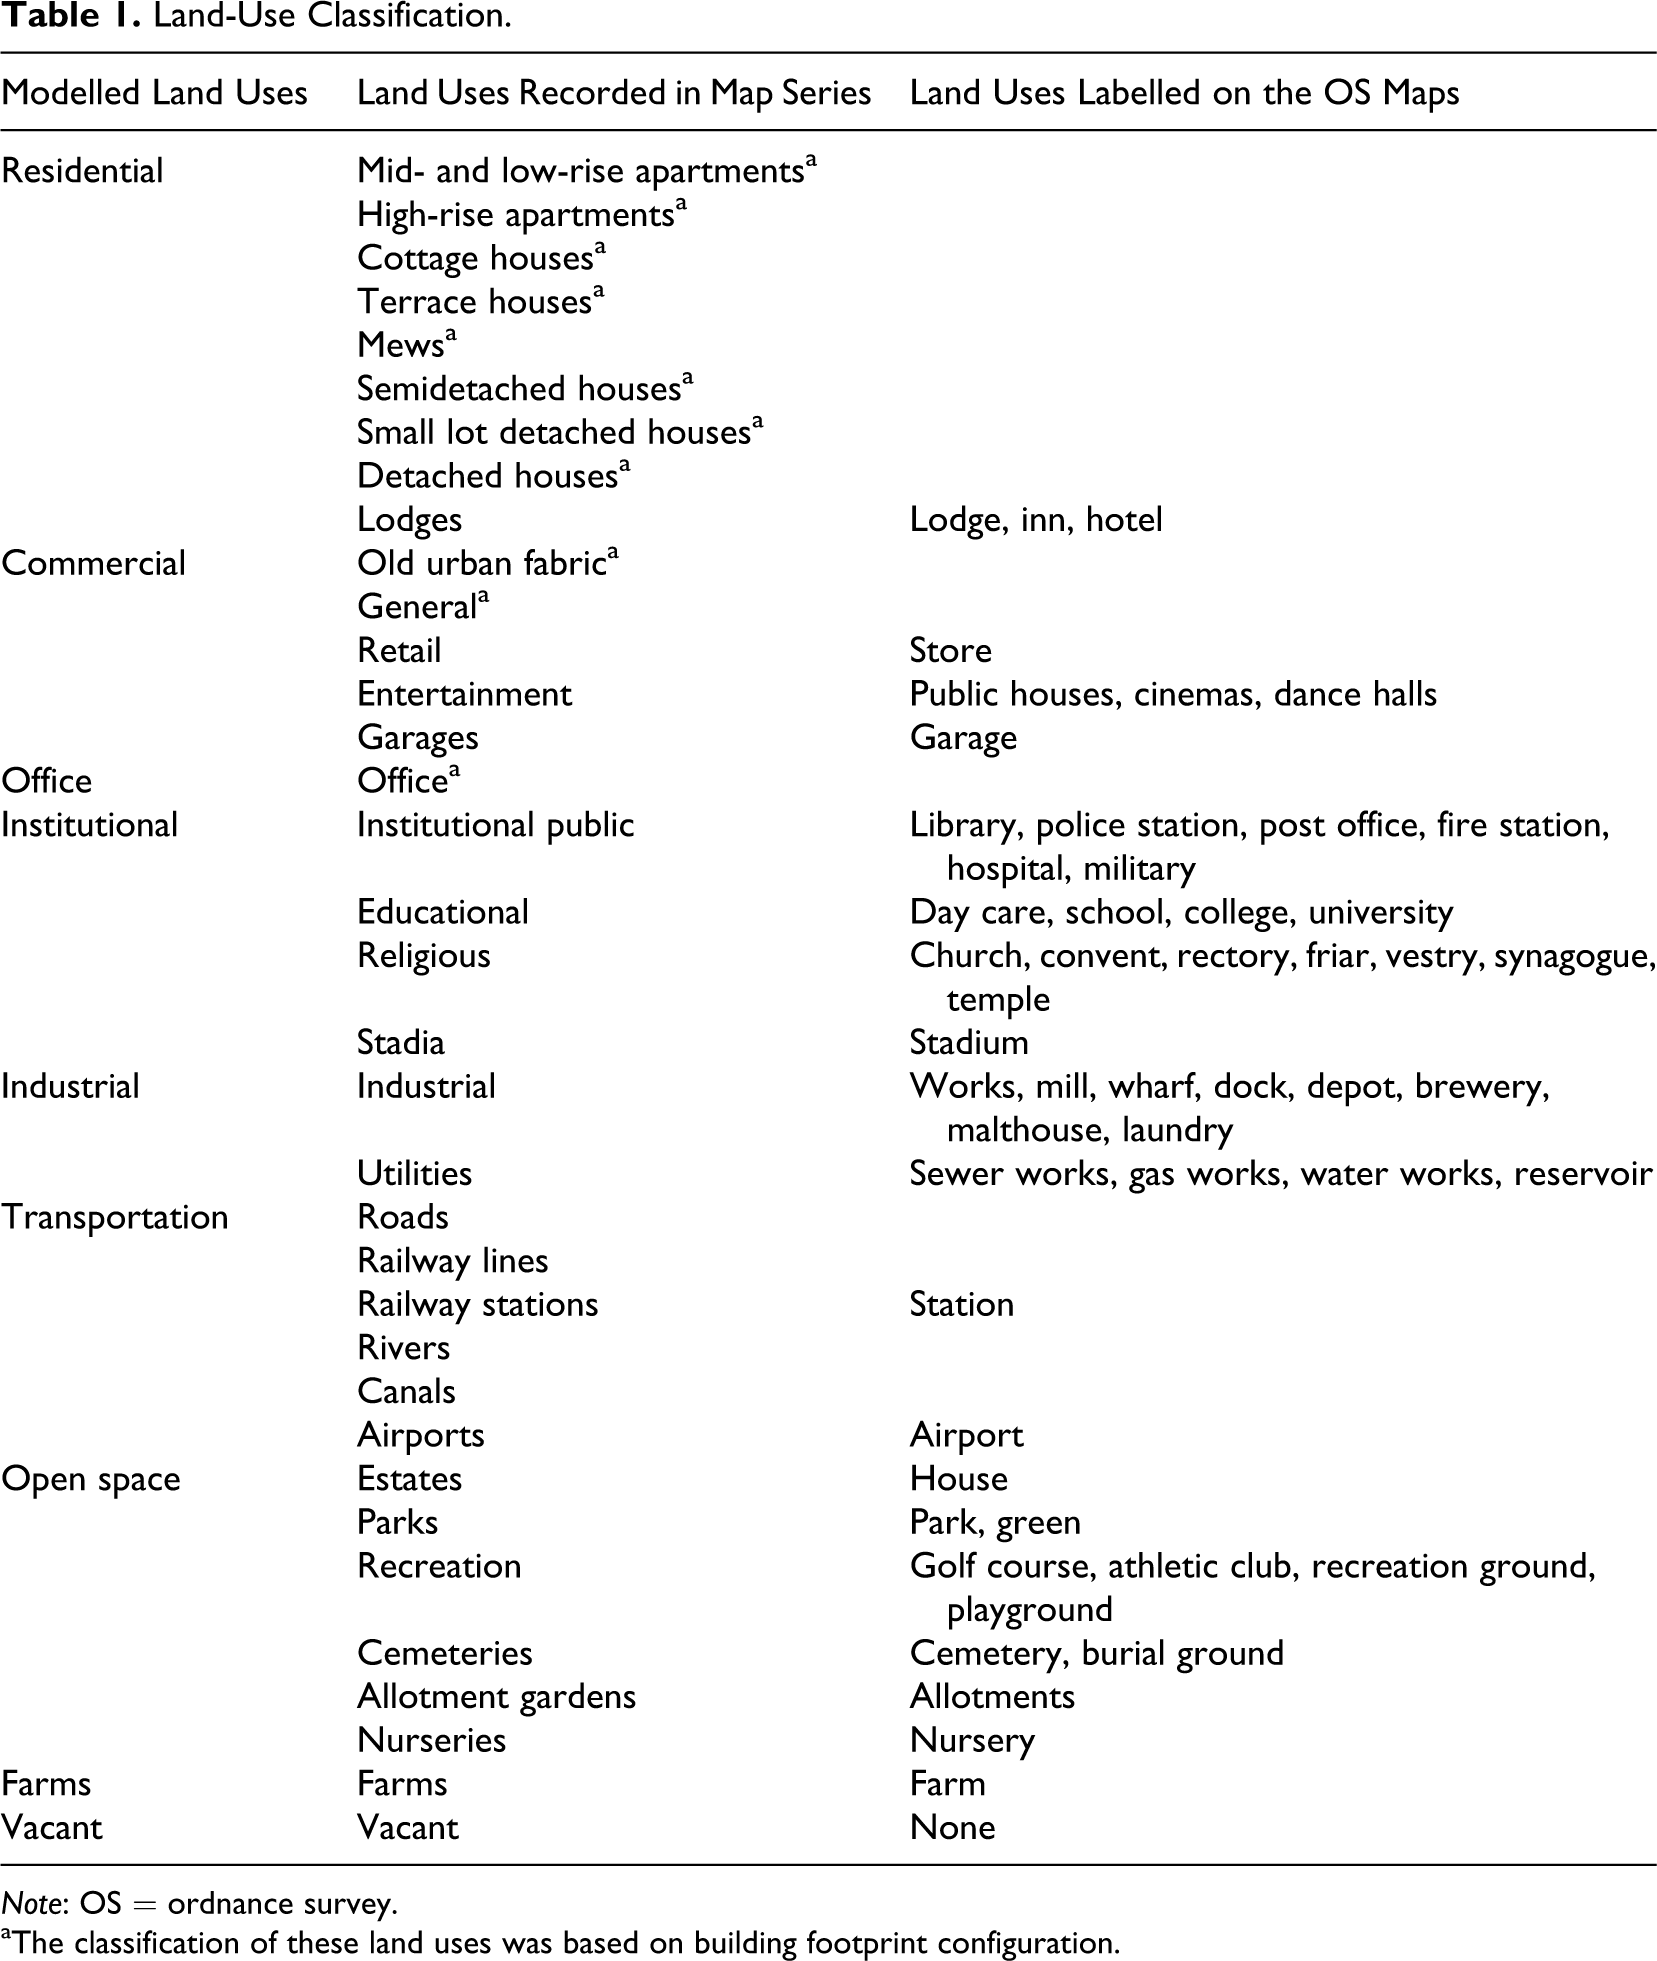
Note: OS = ordnance survey.
aThe classification of these land uses was based on building footprint configuration.
The integration of policies and planning in our model included the following policy-driven initiatives: (1) infrastructure improvements through expansion of existing road and rail networks; (2) the imposition of density regulations on new development; (3) the adoption of the Green Belt concept; and (4) the introduction of open space preservation controls. Our analysis was informed by a review of the extensive literature on the history and planning of London, which we carried out by examining relevant scholarly articles, books, and monographs, as well as main planning and policy documents addressing the growth of the metropolis from the Victorian age to the present.
Growth Patterns
The analysis of West London’s growth patterns documented in our historical map series revealed a highly dynamic and complex evolution of London’s metropolitan fabric, with well-pronounced differences in the patterns of spatial expansion characterizing each historical period.
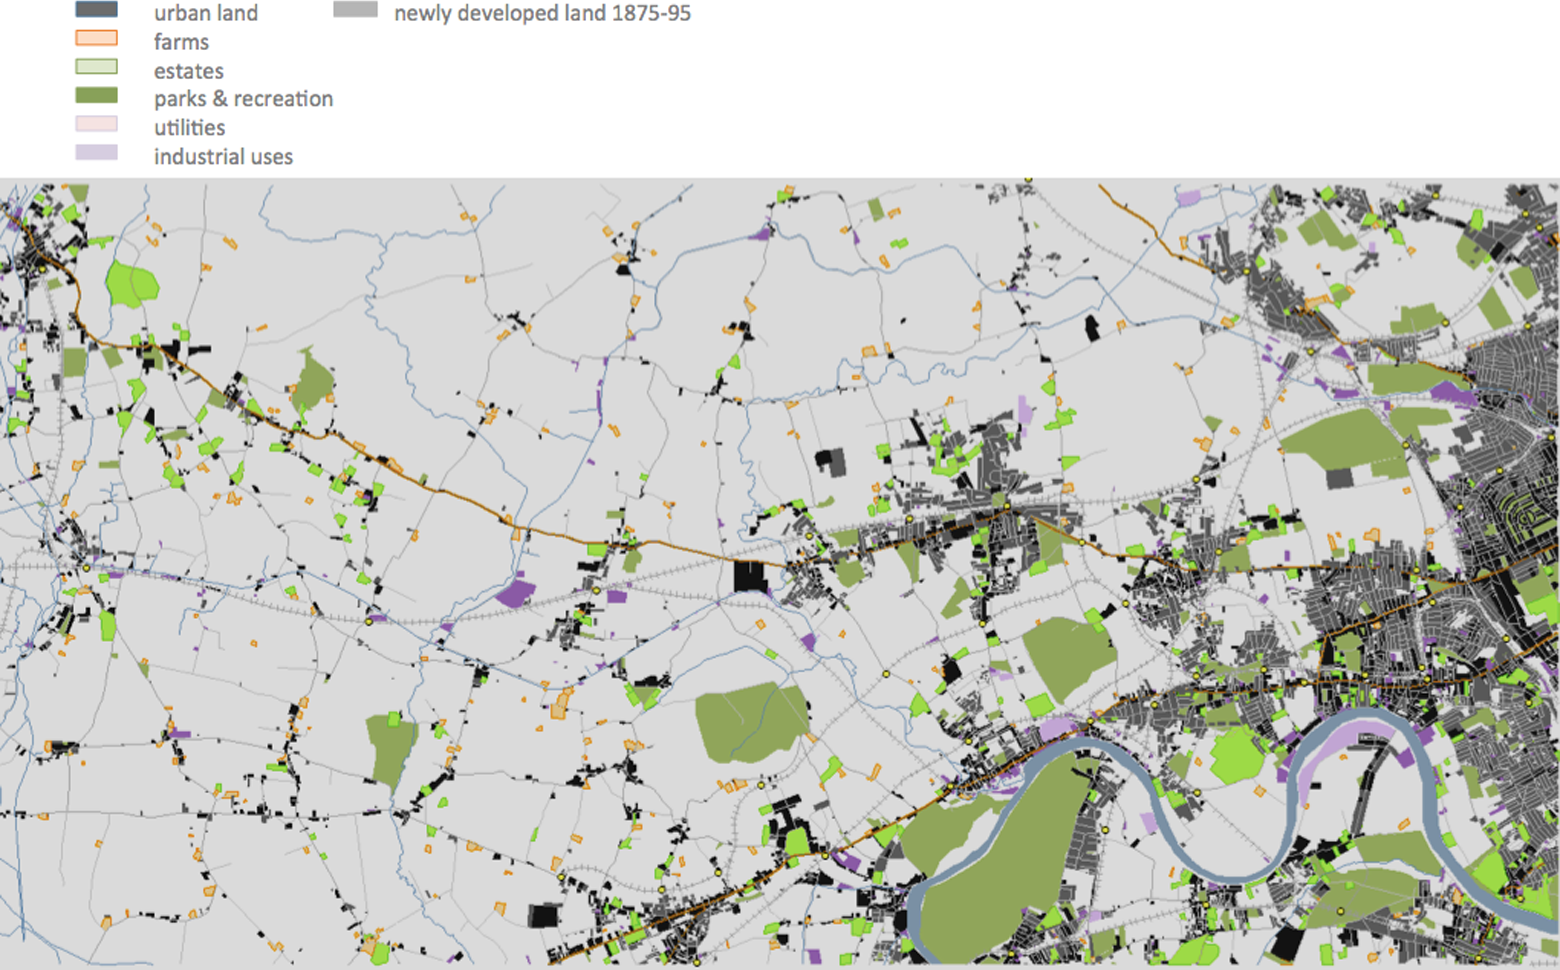
The earliest set of OS maps available for our study area documents development in West London in the mid-1870s. Earlier maps showing the urban pattern of London and its environments do exist, but these were excluded from our study due to their lower level of spatial detail and inconsistencies between the different map sources in the cartographic representation of the built environment. For the purposes of our study, the OS maps from the mid-1870s satisfied our goal to document the preurban phase of development in West London. Indeed, our first land-use map shows that less than 5 percent of the study area was appropriated for urban uses at that time (Figure 2). This period coincides roughly with the beginning of the accelerated suburbanization of London linked in many studies with the introduction of suburban railway services during the 1860s. 15
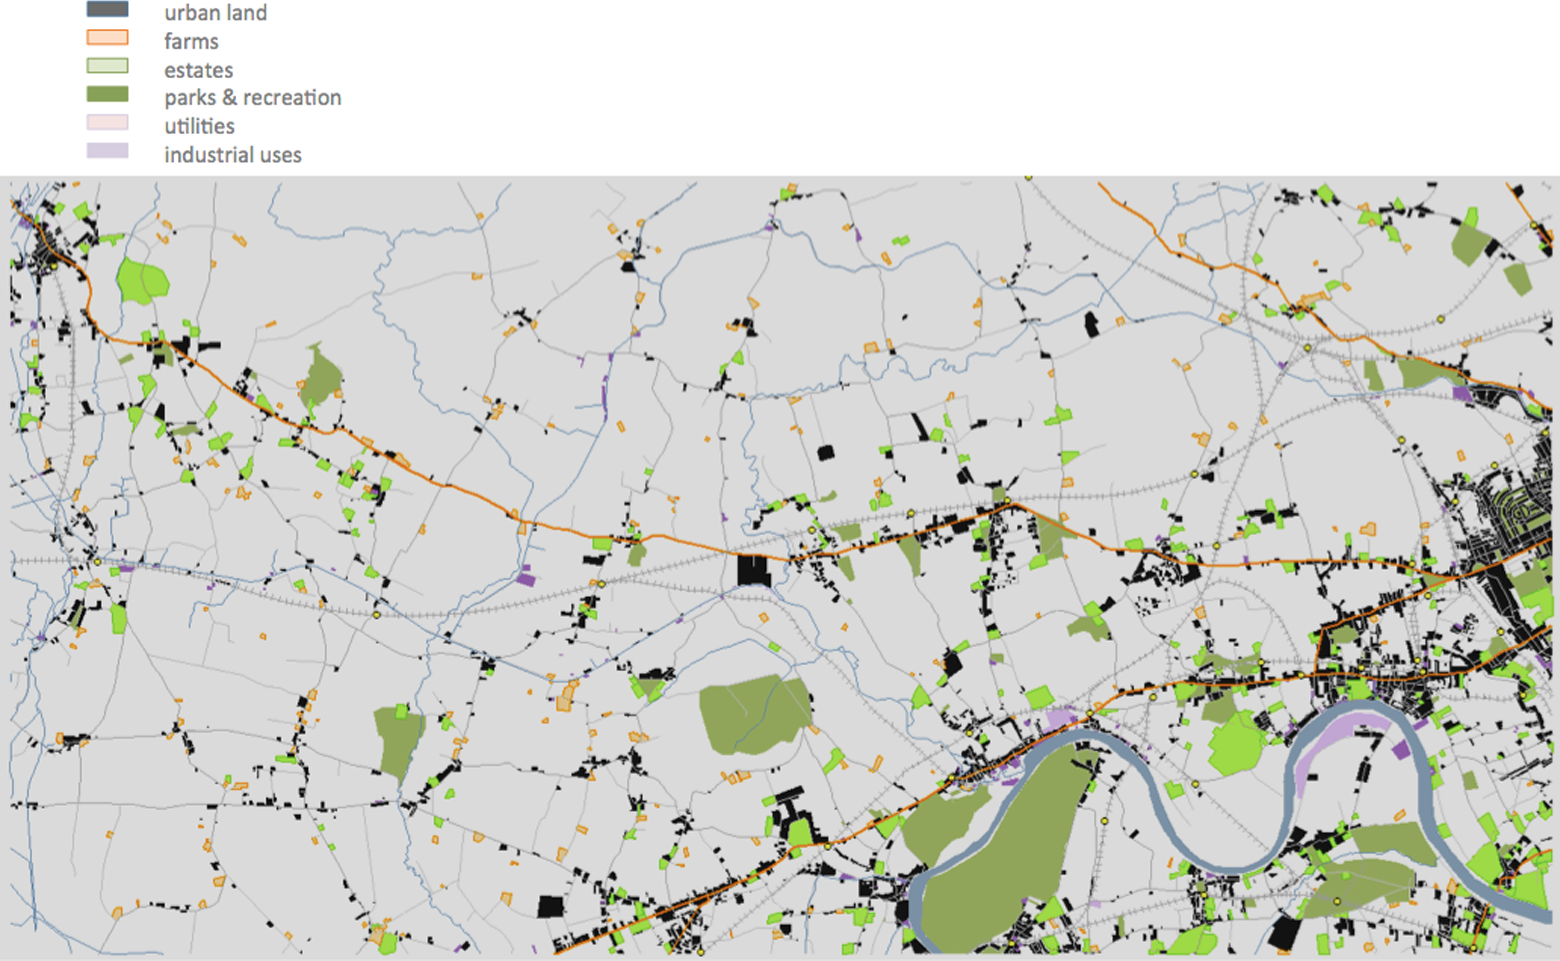
Land use in West London, 1875.
According to our map series, in the next twenty-year period (1875–95), the amount of urbanized land in the area of West London doubled in size (Figure 3). This pace of development was sustained in the next twenty years, with a similar amount of land converted to urban uses between 1895 and 1915. Our study confirmed the conclusions reached by other researchers, that the suburban expansion of London reached its climax in the interwar period. 16 Between 1915 and 1935, the amount of developed land in West London doubled compared to the quantities of land urbanized in each one of the preceding two 20-year periods. The conversion of land to urban uses continued at a slightly slower pace during the next twenty-five years, returning to pre-1915 levels between 1960 and 1985. During the last twenty-year period (1985–2005), the amount of land converted to urban uses dropped to the lowest levels recorded in our time series.
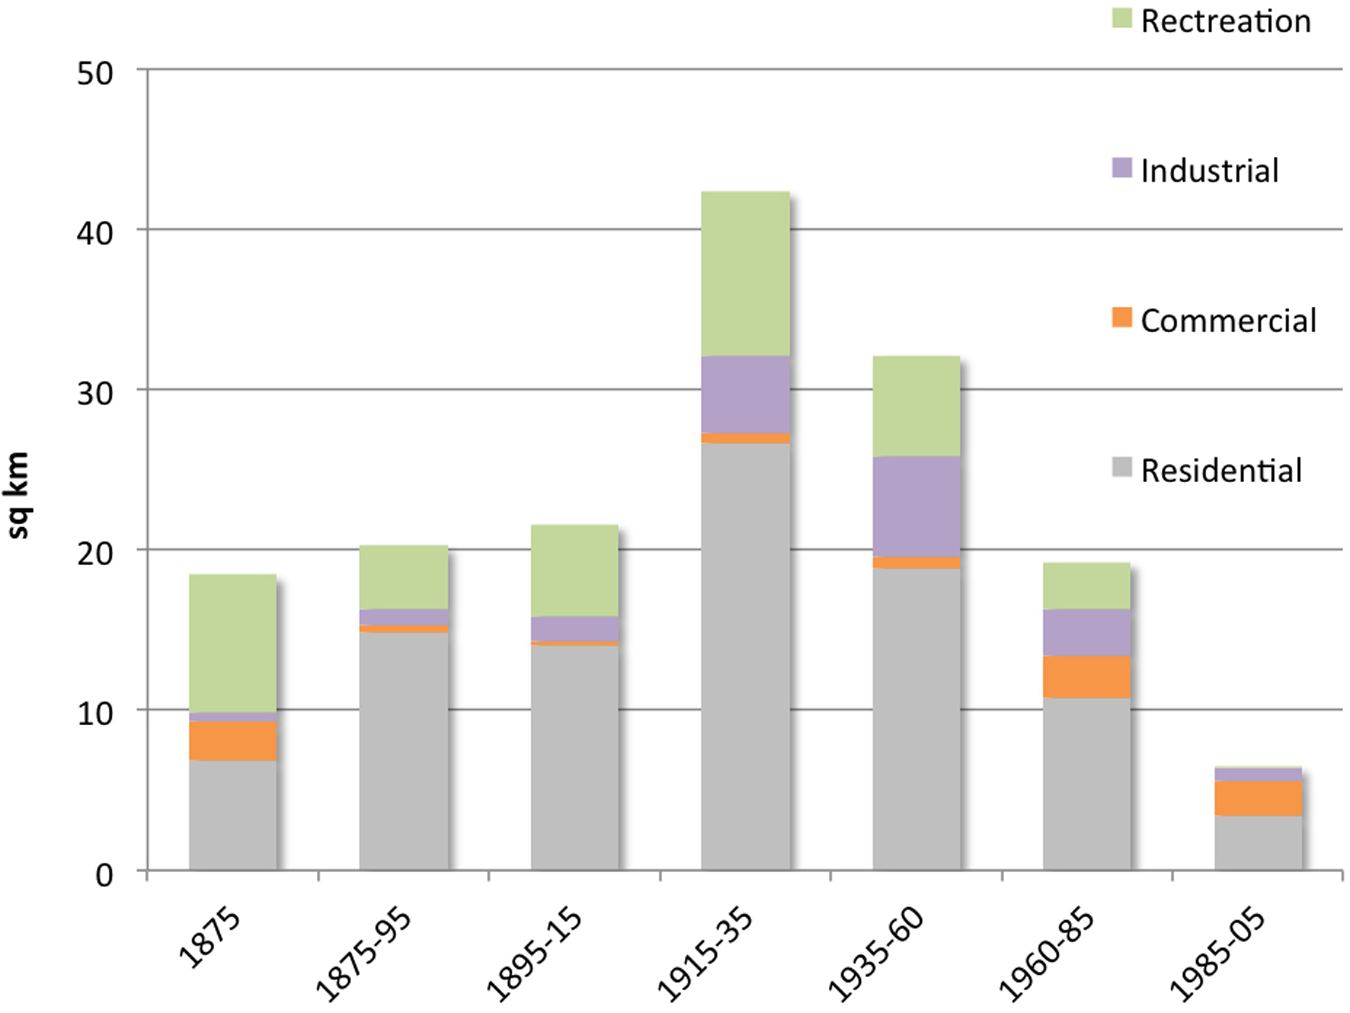
Land development by study period.
The database reflects only the amounts and patterns of land absorption and excludes other indicators of urban growth such as increases in population and employment through densification of already urbanized land. Indication of densification is indirectly reflected in the database which shows an increase in the share of multifamily housing (Figure 4) and a general trend toward conversion of lower-density (detached single family) to higher-density (terraced and multifamily) residential uses.
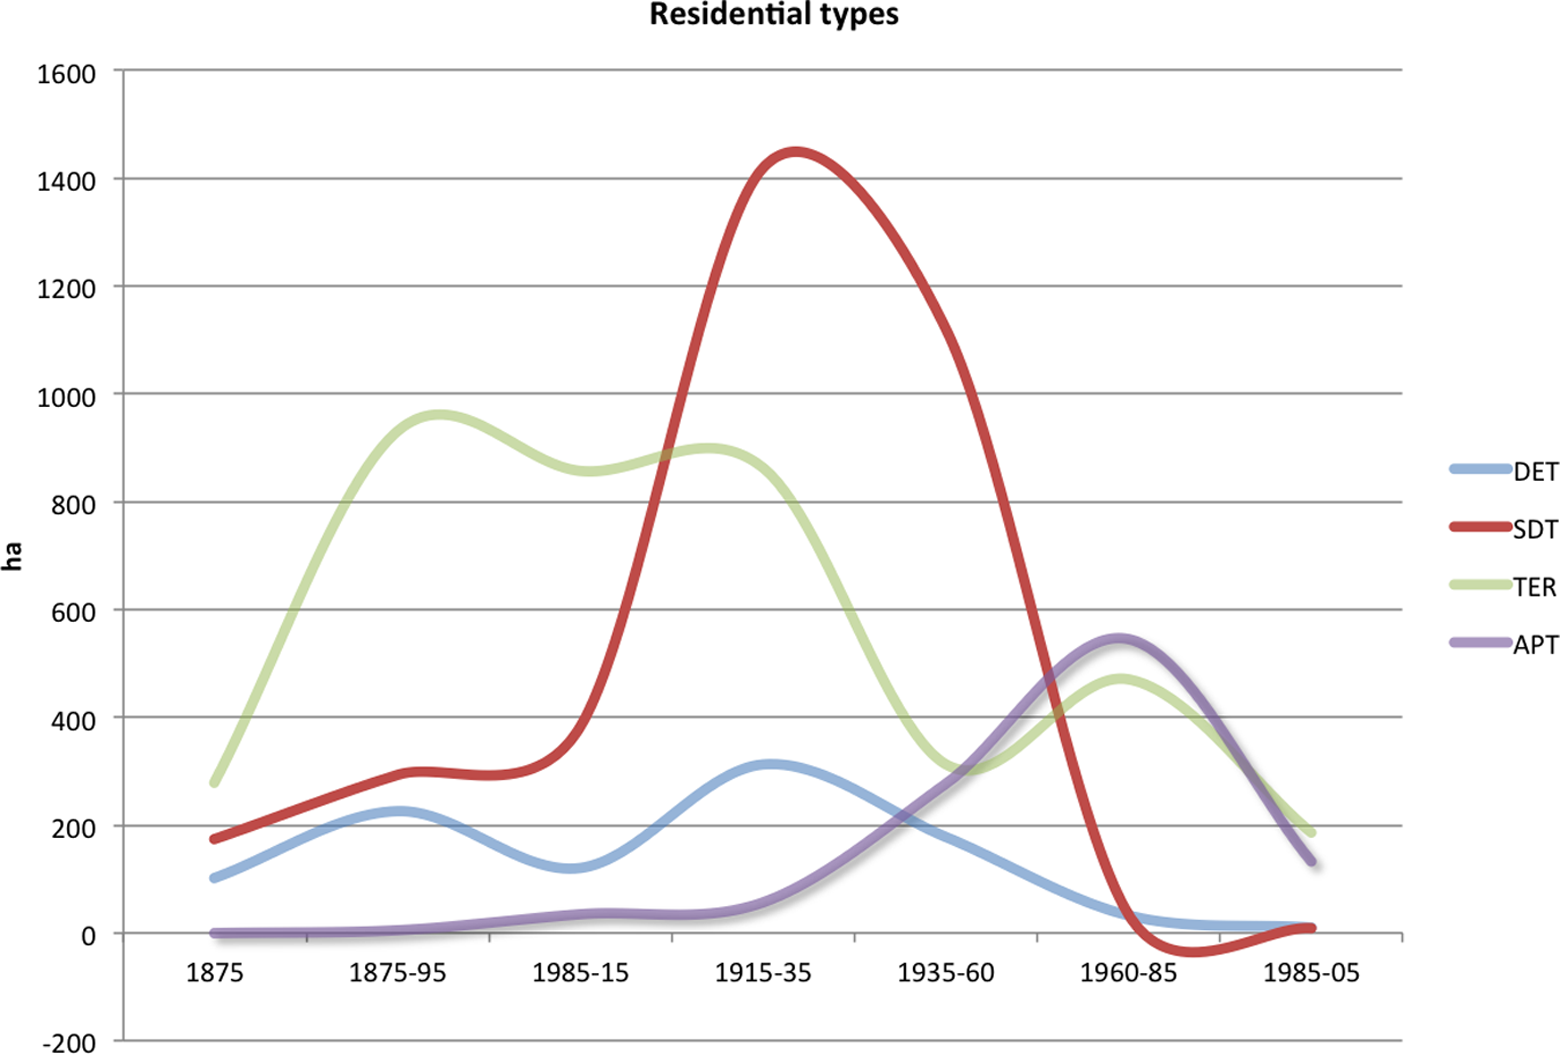
Land developed by residential building types, 1875–2005.
The earliest map from 1875 shows a highly dispersed development pattern composed of small patches of urbanized land scattered throughout the study area (Figure 2). This spatial distribution is characterized by: (1) a general decrease in the size and frequency of the clusters of urban development with distance from the metropolitan center; (2) a concentration of the majority of development in nodes strung along the two main roads (Uxbridge and London Roads) radiating west from the city; 17 and (3) a constellation of highly dispersed and significantly smaller clusters of development located along the secondary roads crisscrossing the study area.
The next two map series (1895 and 1915) indicate a growth pattern marked by two concomitant processes (Figures 5 and 6). The first one is represented by the outward expansion of the compactly built-up city territories, which by that time began to coalesce with the closest suburban nodes identified on the 1875 map. The majority of the remaining growth is absorbed in the rest of the suburban centers, with a general tendency of those centers located closer to the city to grow faster than the ones located further away. The least amount of growth recorded between 1875 and 1915 is in the group of small and dispersed clusters representing villages and hamlets located away from the main radial roads. A notable new phenomenon during the years preceding World War I (WWI) is the emergence of the first growth nodes located off the course of the main roads. The development of these three settlements (Southall, Hayes, and West Drayton), all nested along the Great Western Railway line, is also marked by the appearance of clusters of industrial uses in their vicinity (Figure 6).
Land use in West London, 1895.

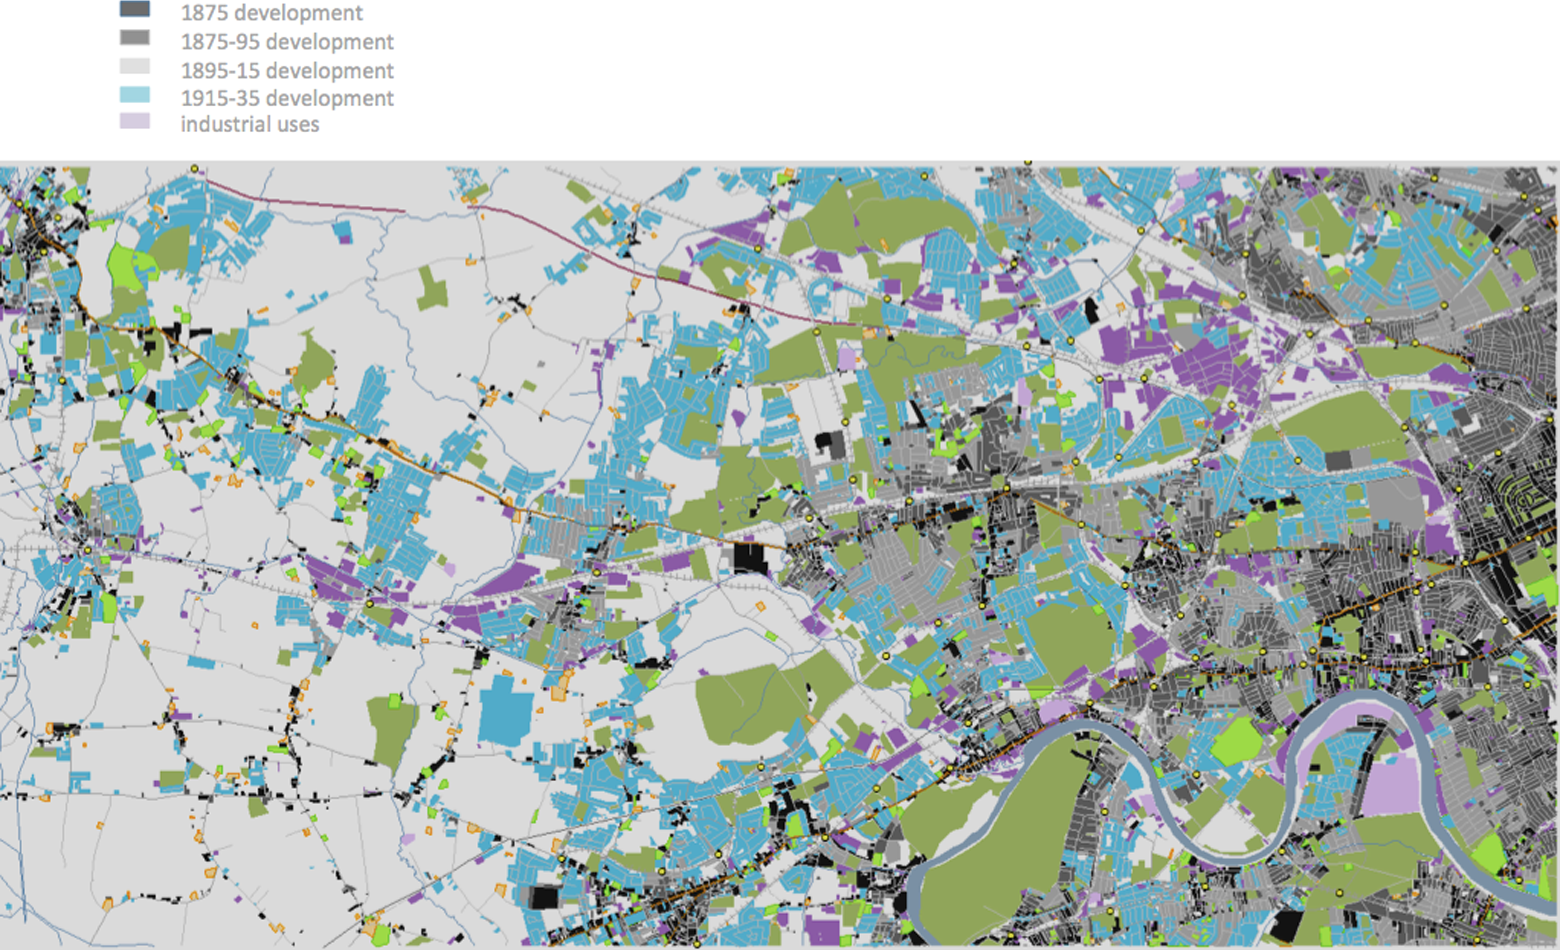
Land use in West London, 1915.
The patterns of land development during the interwar period appear to diverge from the spatial dynamics observed during the preceding forty years (Figure 7). The general trend for the newly developed territories during this period is for land uses to become less constrained by the gravitational forces of the metropolitan core, the secondary suburban centers, and the main roads. Large amounts of land are settled in areas located at considerable distance from the main elements of the spatial structure, including territories with limited access to railway stations, indicating a diminished importance of accessibility to rail services or established settlement centers. These tendencies are more clearly pronounced during the subsequent period (1935–60), with the majority of new growth taking place in the outer, less-developed western half of the study area (Figure 8). Another clear trend is the consolidation of industrial development in three growth corridors stretching westward along the tracks of the railway lines leading out of London.
Land use in West London, 1935.
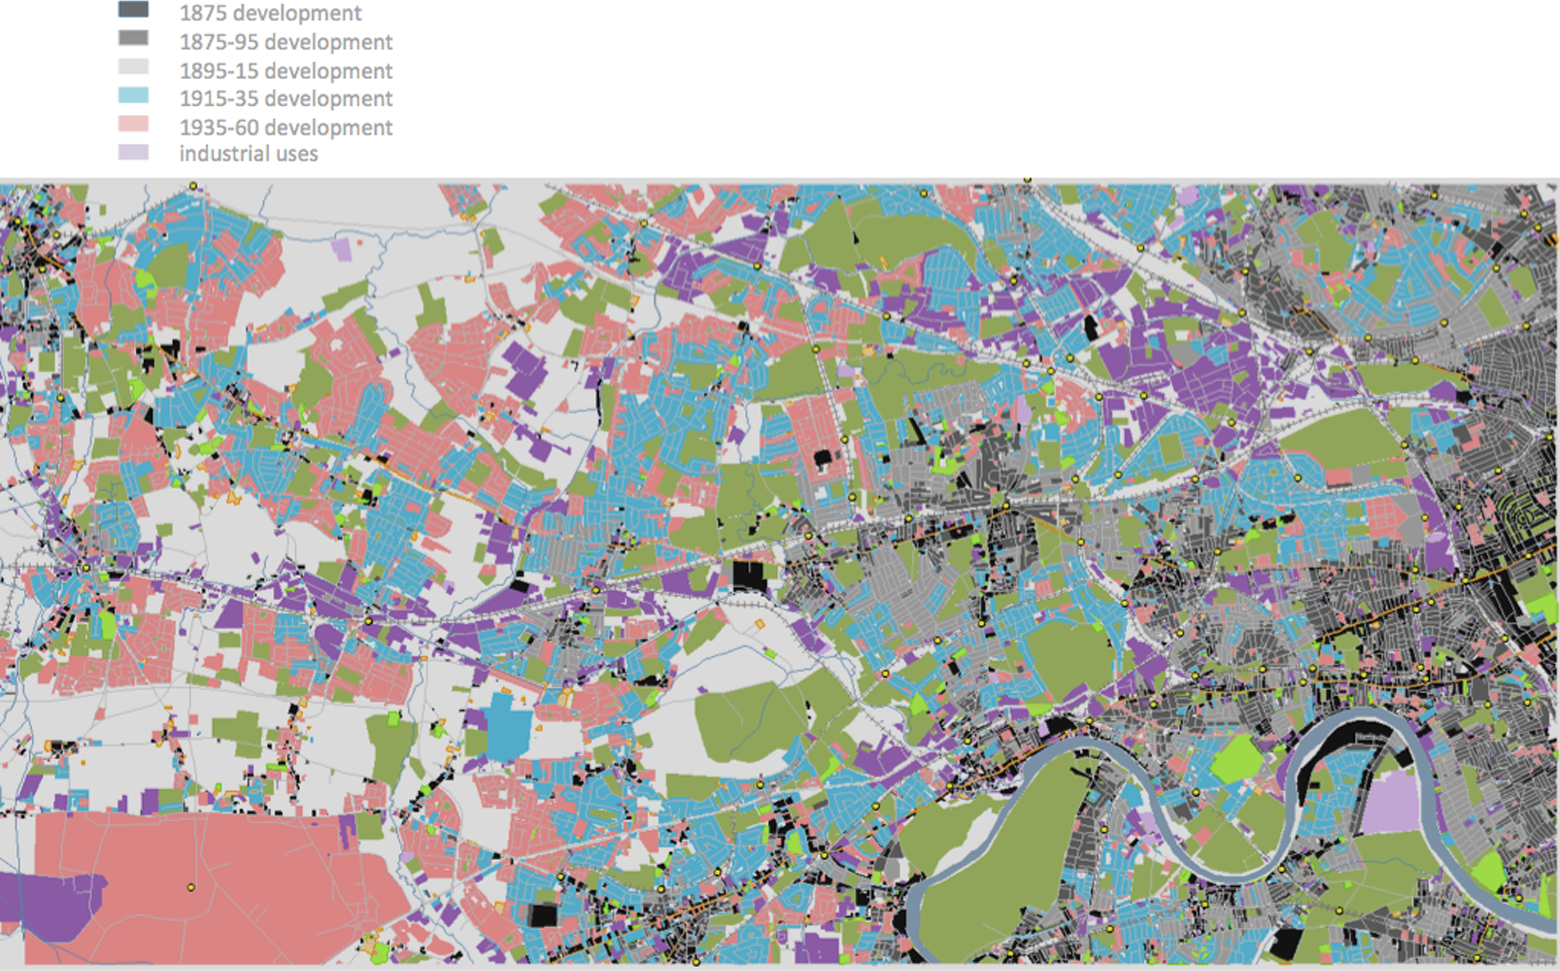
Land use in West London, 1960.
Development during the last two periods, covering the years since 1960, reflects a seemingly different spatial logic altogether. The patches of newly developed land are smaller and more evenly distributed across the study area (Figure 9). They appear to be filling in the areas left underdeveloped during the preceding decades, indicating a weakening relationship to the main elements of the spatial structure. In this sense, these recent patterns of growth seem to deepen the tendencies identified in the interwar and post–Word War II years for increasing erosion of the linkages between the elements of the existing spatial structure and the location of new development.

Land use in West London, 1985 and 2005.
Indeed, a comparison of the maps featuring the areas of land absorbed by new development during the six study periods indicates clear shifts in the patterns of urban growth over the course of the last 130 years. Our visual analysis of the map series discerned three distinct phases characterized by three different patterns of growth: (1) nucleation (1875–1915); (2) diffusion (1915–1960); and (3) infill (1960–2005; Figure 10). These periods roughly correlate with the trajectory of metropolitan expansion in terms of rates of land absorption, with the initial period of suburbanization marked by fast growth (1875–1915), culminating in the explosive expansion in the middle period (1915–60), followed by a sharp decline in growth rates (1960–2005; Figure 3). It is notable that these three phases broadly correspond as well with three phases in the population growth of London’s outer suburbs—the accelerated suburban expansion from the mid-1800s to WWI, the explosive growth of London’s suburbs during the interwar period, and the slow growth period represented by the decline of population from the early 1960s to the 1990s (Figure 11).
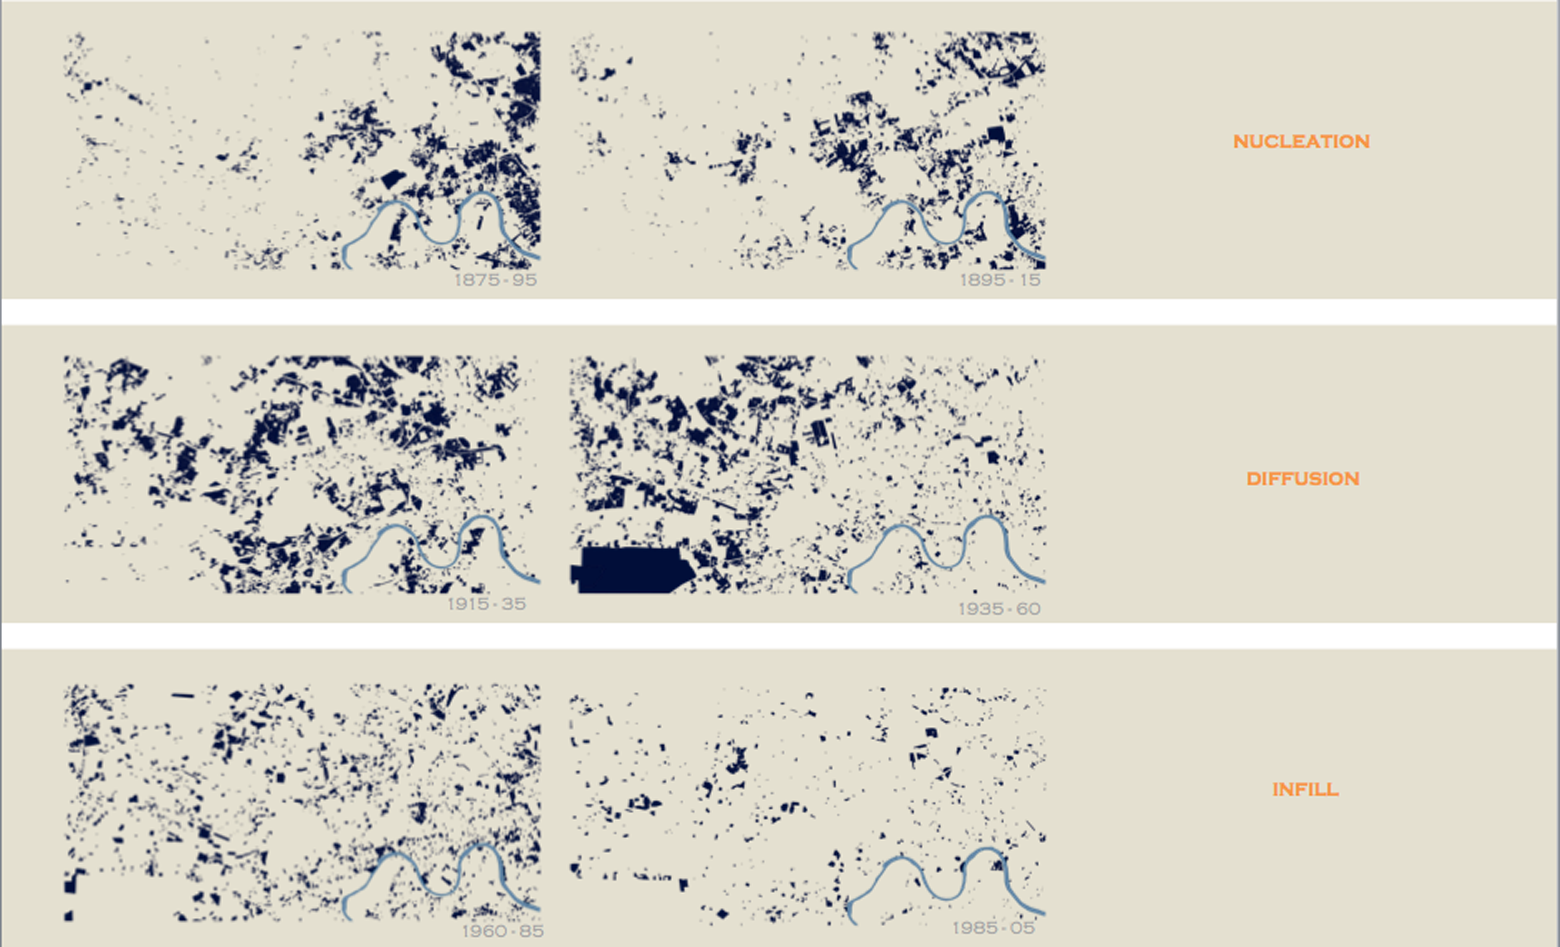
Land development patterns 1875–2005.
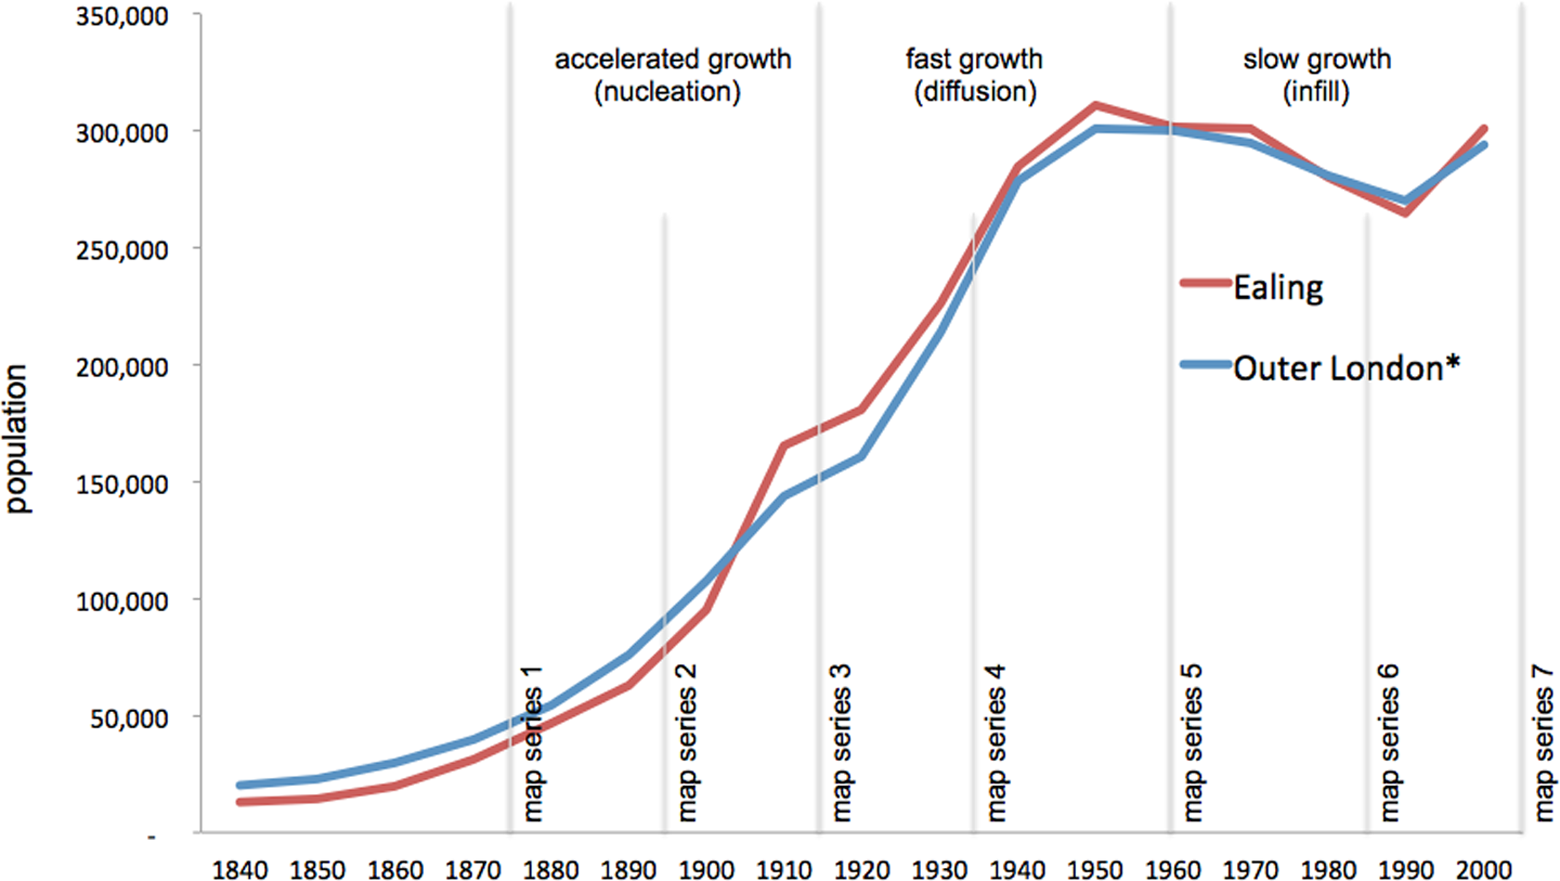
Population growth in West London and outer boroughs (normalized).
The availability of the historical OS maps in twenty-year increments poses certain limitations on the accuracy of the analysis in terms of capturing the spatiotemporal dynamics of urban growth. While the snapshots of urban growth derived from the available map series are relatively equally spaced in time, their date of origin is somewhat arbitrary in view of the critical points in time when urban growth patterns and trends shifted direction (Figure 11). However, while a finer-grain data capturing land-use changes in smaller increments would have increased the accuracy of describing the dynamics of urban growth, it is very unlikely that it would have painted a substantially different picture of West London’s expansion calling for a different periodization. The general temporal correspondence between the observed shifts in spatial patterns and the population dynamics reflected in the census data supports the division of London’s growth according to the three distinct periods outlined above.
Analysis of Determinant Forces
Our analysis of the land-use dynamics in West London revealed the presence of systematic and consistent relationships between the distribution of land uses and the main components of the metropolitan spatial structure—the urban activity centers and the principal elements of the transport system which connect them. The importance of these relationships is hardly a surprise, as it has provided the theoretical foundation for most land-use studies throughout the twentieth century. However, a rather unexpected finding was the consistency in the interactions between land uses and the established spatial structure. The stability of these relationships across time is astounding in view of the vast changes in the political, economic, technological, and cultural contexts which took place during the 130-year study period. Indeed, the three distinct phases of growth described previously (nucleation, diffusion, and infill) did not imply such consistency. Instead, these three phases suggested a process of continuous adjustments in the logic of land-use distribution, with a trend toward progressive loosening of the role played by the main elements of the established spatial structure (the CBD, secondary centers, railway and road network) as key factors determining the patterns of land appropriation.
The identified consistency of the spatial relationships between the major elements of the metropolitan spatial structure and the patterning of land uses contradicts some commonly accepted views about the growth of London. For instance, the popular view that the interwar period was defined by an unprecedented escalation of decentralization and sprawl 18 seemed, on a first glance, to be confirmed by the patterns of residential growth documented in our time series. Compared to the previous periods, the development that took place between 1915 and 1935 appeared indeed much more dispersed relative to the location of the CBD and existing railway stations (Figure 12a). However, when we excluded the already developed territories and plotted the 1915–35 residential growth only in relation to the land available for development in 1915, the distribution of new residential development relative to distance to the CBD and railway stations remained surprisingly similar to the previous periods (Figure 12b). The consistency of the spatial relationships between the key elements of the metropolitan spatial structure and the distribution of land uses was clearly pronounced in all of the charts plotting these relationships (Figure 13).

Residential development relative to location of railway stations 1915–1935.
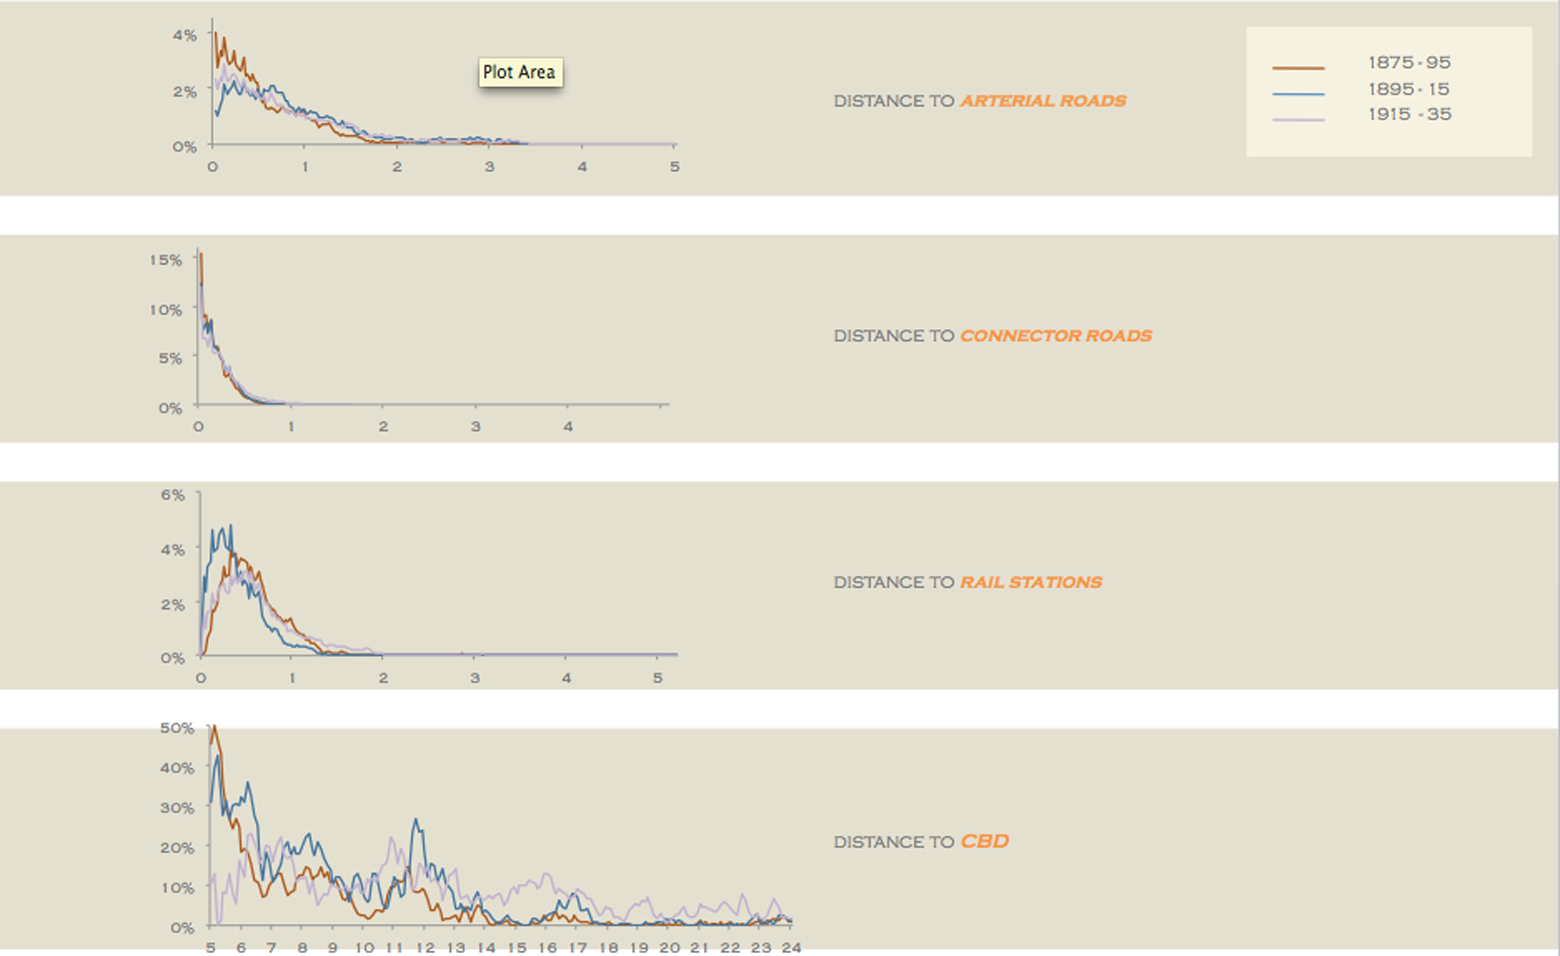
Distribution of residential development relative to main factors.
The observed stability of the spatial interactions between the patterns of land-use distribution and the elements of the urban spatial structure indicated that these linkages transcend socioeconomic circumstances in the sense that they precede and operate autonomously from shifts in economic, political, and technological regimes. In order to affirm the validity of this controversial finding, we developed a CA urban growth model based on the historical land-use data recorded in our map series. Given the stability of the observed spatial relationships, it was plausible that we could translate these into a set of rules and predict contemporary patterns of land development based on data from the end of the nineteenth century. With this challenge in mind, we set the model to use the 1875 land-use data as a starting point and calibrated the model’s parameter values with reference to the land-use patterns recorded in the following two map series (1895 and 1915). Having calibrated the model based on this forty-year period (1875–1915), we let the simulation run from our initial year of 1875 to the present day without changing the rules governing the behavior of land uses.
It is important to clarify, at this point, that we designed the model is a constrained CA system in the sense that the simulated land-use dynamics are influenced by a number of exogenous inputs. 19 In our case, this meant that important model parameters such as the amount of growth by particular land use and the evolution of the transportation networks were not simulated by the model internally, but introduced as external inputs which influenced the model results. Thus, through the course of the 130 years covered by the simulation run, the model is updated for every twenty-year period with information derived from the map series related to: (1) the demand for development for the next twenty-year period for each of the land-use classes; (2) changes in the accessibility network (the appearance of new major roads, railway lines and railway stations); and (3) the actual patterns of land development in certain land-use classes not actively modeled in our simulation (airports, parks, military bases, prisons and other large institutional uses). 20
The results produced by our model exceeded by far our most optimistic expectations. The simulation of West London’s growth generated highly realistic land-use change patterns (Figure 14). The model predicted with high degree of spatial and temporal accuracy the allocation of land uses in each one of the study periods, capturing the three phases of urban growth from nucleation, to diffusion, to infill. In addition, our simulation successfully reproduced key pattern formation phenomena such as the development of industrial corridors and the emergence of commercial clusters in the suburban outskirts in the second half of the twentieth century.

Comparison of actual and modeled growth patterns.
The success of the model in predicting contemporary development patterns based on parameters of spatial interaction derived from late nineteenth-century data offers strong support for the idea that the ordering of urban activities in space is conditioned by rules that transcend historical circumstances and reflect deeper structures of spatial organization. This set of rules, which we refer to as the urban code, describes the spatial behavior of land uses in relation to key elements of the built environment. The code reflects the forces of attraction or repulsion for each land-use class relative to distance to major infrastructure elements and urban activity centers. It describes as well the magnitude of attraction and repulsion between each pair of land-use classes by measuring the decay of these functions across space. All of these relationships, when statistically and mathematically described, appear to be surprisingly resilient to changes in socioeconomic context. Using these relationships as rules governing the spatial behavior of land uses, our model provided strong support for the argument that the urban code influences the patterns of urban growth analogous to the way in which a genetic code predetermines the evolution of a living organism.
The understanding that spatial structures and relationships operating on a micro level determine the characteristics of much larger complex systems is a key concept in genetics. In the field of urban studies, such explorations have been carried out since the 1960s and 1970s (even though without explicit reference to genetics). 21 More recently, the idea about the existence of a genetic code in urban development has entered the academic discourse through the work of several scholars employing CA methods for simulating the dynamics of urban growth. 22 The concept, however, has not been discussed in relation to other important determinants of metropolitan form, and more specifically in terms of the interaction between the urban code with urban policies and planning. A main goal of our project was to identify and explore these types of interactions.
The Role of Planning
The integration of urban policies and planning in our model of West London’s growth was done on several levels. First, we introduced key policy decisions with direct impact on urban growth patterns as exogenous inputs (described in the previous section). These inputs reflected executive acts related to the development of the physical infrastructure (input 2) and key regional facilities (input 3) needed for the effective functioning of the growing metropolis. Second, we included as an exogenous input in our model the demand for land (input 1). While this demand is not solely influenced by planning regulations, it is impacted by planning policies nevertheless as density controls determine the total amount of land required to accommodate growth.
Our analysis of urban policies and planning focused on the period spanning the implementation of such initiatives from the height of the Victorian era to the middle of the twentieth century. The rationale for our emphasis on this particular time frame was based on two main considerations. First, this was the period when the overwhelming majority of London’s growth took place. The end of this period in 1950s marked the peak of population growth in both Greater and West London, after which population in both areas experienced a continuous decline until the 1990s. This growth trajectory is reflected in our analysis of the historical land-use data, which showed that over 85 percent of the developed land existing today and an even greater share of the road and rail infrastructure in West London were developed by 1960. Second, with the exception of the construction of the motorway infrastructure in the 1970s, our analysis indicated that the measures adopted in London’s plans since the mid-twentieth century did not have significant impact on the patterns of London’s growth. 23 Given these considerations, we decided to concentrate our attention on planning and development policies implemented during the most critical period in the evolution of London’s metropolitan form, spanning the 100 years from the mid-nineteenth to the mid-twentieth centuries.
Since the second half of the nineteenth century, development densities in West London have been influenced by a mixture of controls imposed by national legislation, local government regulations, and ideas dominating town planning and community development. The Public Health Act of 1875 is an early example of such regulatory intervention. The set of requirements included in the act generated a new type of urban form, which became known as the by-law housing of late nineteenth-century London. 24 Subsequent planning initiatives during the early twentieth century were aimed at reducing the densities generated by the by-law housing from 40 to 10 units per acre. 25 This dramatic reduction in density standards impacted the rate of residential land absorption. Thus, while fluctuations in the number of residents, dwellings, and jobs were determined largely by economic and demographic forces, the amount of land required to accommodate urban activities was a function of the maximum density of development permitted by local authorities.
The density of development in West London, as well as Greater London, was strongly influenced by another factor directly linked to urban planning initiatives—the amount of open space and its distribution within the metropolitan fabric. The virtues of living in close proximity to open space were a main driver of London’s suburbanization going back to seventeenth century and the Great Fire of London. 26 As the rate of London’s decentralization accelerated rapidly during the second half of the nineteenth and the beginning of the twentieth centuries, it became clear that the very presence of open space as a key asset was threatened by rampant urban expansion. 27 Recognizing this possibility, local governments in London’s periphery became actively engaged in assembling and securing land for parks and recreation. 28 By the 1920s, the inclusion of allotment gardens became an essential ingredient of planning new communities and a standard planning practice. With the passing of the Allotments Act in 1925, this practice was codified into law requiring mandatory provision of open space and allotments by setting minimum standards. The efforts to preserve open space were buttressed further by the introduction of agricultural zoning in the late 1920s and the advancement and implementation of the Green Belt concept since the late 1930s. 29
In our simulation, the areas protected by the Green Belt, open space and agricultural zoning were treated as territories where residential, commercial, or industrial developments were explicitly prohibited. These open space zoning regulations impacted strongly not only the overall density of development but also the patterns of land-use distribution as well. Both of these impacts were successfully captured by the model, reflecting the coevolution of London’s open space system and its patterns of metropolitan growth.
While the focus in developing our model was on planning regulations from the late nineteenth and the first half of the twentieth centuries, our model reflected planning initiatives of the post–WWII era as well. Our simulation took into account the provision of open space and transport infrastructure throughout the study period as these policy-driven activities directly impacted the patterns of land-use distribution. Similarly, we traced the impact of large institutional facilities established through planning initiatives. However, our model indicated that, with the notable exception of the Heathrow Airport, the impact of these uses was rather localized, influencing only the development of properties in their immediate vicinity.
Post–WWII planning regulations were also incorporated indirectly in our model through their influence on development densities and, subsequently, on the amount of land developed in each period. This is clearly demonstrated by the fact that while the 1985–2005 period recorded the least amount of newly developed land compared to any of the other twenty-year periods, the outer suburbs of London (including those in our study area) actually gained population (Figures 3 and 11). This phenomenon was facilitated by an increase in permitted development densities as such policies were adopted by boroughs of London towards the end of the twentieth century.
The results of our simulation revealed that the most powerful method of influencing the patterns of London’s metropolitan growth was through infrastructure planning. While access to drainage was of critical importance in the initial period of suburban development, by the end of the nineteenth century accessibility to the transportation infrastructure became a leading force influencing the patterns of land appropriation. 30 The continuing improvements of the transportation networks were a result of planning initiatives carried out by both public (road network) and private (railway system) agencies, with the later one playing a leading role in shaping the patterns of metropolitan growth. 31
One of the most intriguing findings of our study highlights the longevity and importance of the preurban road infrastructure, which not only formed the spatial framework for the subsequent metropolitan expansion, 32 but to this day continues to serve as the backbone of the transportation network in Greater London. Our analysis of the evolution of the road network revealed that the overwhelming majority of the main roads was laid out long before the advance of (sub)urbanization. Indeed, during the course of the last 130 years, very few new elements have been added to West London’s preexisting road infrastructure (Figure 14). A study that we conducted recently confirmed that this observation holds true for the remaining parts of London as well.
Our simulation indicated that the twentieth-century additions to the main road infrastructure had relatively minor impact on shaping West London’s growth patterns, especially in comparison to the role played by the development of the railway system. This finding is not surprising considering the small share of major roads built in London since the mid-1800s and the fact that arterial road building and land-use planning in the beginning of the twentieth century were done without any intent for coordination. The main roads built in the interwar period followed the low-lying interstices between the existing main and radial roads where relatively undeveloped and cheap land could be found.
Our study confirmed, on the other hand, the strong linkages between the growth of the railway networks and the patterns of urban land development. 33 Moreover, although the main elements of the railway system in West London were established by the beginning of the twentieth century, 34 our simulation demonstrated that railways continued to exert strong influence on the patterns of growth throughout the next 100 years. These findings offered further support for our conclusion that the preurban spatial framework, the urban code, and urban policy and planning formed a potent set of forces, which determined to a great extent the patterns of growth in metropolitan London. Yet, the interplay of these forces has received disproportionately little attention in urban literature.
Conclusions
Our examination of the patterns of land development in the area of West London from 1875 to the present allowed us to trace the emergence of metropolitan form with a high level of spatial accuracy and detail.
We found that the preurban spatial structure, determined by the geographic distribution of settlements and infrastructure predating the expansion of the metropolis, played a critical role in shaping the patterns of urban growth in West London. This structure provided the spatial framework for subsequent development, continuing to serve as a backbone for the physical expansion of the metropolis to the present. This phenomenon has received surprisingly little attention in urban literature considering the powerful influence it yields on the generation of urban form and the distribution of urban activities in space.
The search for explanations regarding the strong influence of the preurban spatial structure on the patterns of urban growth led us to identify systematic spatial relationships that we call the urban code. This code represents a set of rules that guide the interactions between land uses and the built environment and which show surprising resilience to changes in socioeconomic circumstances. The operation of this code as an underlying force in the process of ordering urban activities in space should not be interpreted as a subversive power, undermining the significance of planning. It is rather a generative force, which interacts with other determinants of urban growth patterns, most notably urban policies and planning, by conditioning the degree of their influence.
Contrary to the popular view rendering the growth of London as an outcome of uncoordinated private initiatives and market-based forces, our study supports the argument that planning played a significant role in shaping the patterns of metropolitan expansion. The influence of planning, particularly in the early days of its development as a social practice in Britain, has been traditionally underestimated in studies of London’s growth. Our model of West London's growth demonstrated that a set of public and private policies and planning, combined with the impact of the preurban spatial structure and the urban code, played a critical role in shaping the fabric of modern day London.
The insights gained from a better understanding of the forces shaping metropolitan growth patterns are critical prerequisites for increasing the efficiency of resource allocation and the effectiveness of public policies designed to guide urban development. For these reasons, we argue that planners should be cognizant of the role played by past development in shaping the future patterns of growth, and more specifically they should understand the workings of the urban code as a pervasive and enduring force structuring urban space through time.
Grasping the mechanisms through which the urban code exerts its influence on the patterns of metropolitan growth can help us to understand the logic underlying the formation of aggregate spatial phenomena described in the classic models of urban growth. The formation of concentric rings identified by Burgess, the consolidation of corridors depicted by Hoyt, and the emergence of polynucleated spatial structure predicted by Harris and Ullman are key spatial properties of the modern metropolis. These properties were identified in our analysis of West London’s historical maps and captured in our model which simulated the growth of the area. The fact that simple rules can be employed to replicate with considerable degree of spatial accuracy the patterns of metropolitan growth over the course of 130 years (including phenomena as concentric expansion, corridor formation, and multinucleation) is a good indication of the presence of deep level forces interacting with socioeconomic factors and urban growth policies to structure urban space.
In order for the insights advanced here to firm up into a theory, more research needs to be done to refine the concept of the urban code and to validate it in other urban contexts. A small but growing body of current research 35 lends support for this idea, which holds the promise of advancing our understanding of how cities grow and develop. This knowledge can inform our actions toward setting and achieving realistic sustainable development goals.
Footnotes
Declaration of Conflicting Interests
The author(s) declared no potential conflicts of interest with respect to the research, authorship, and/or publication of this article.
Funding
The author(s) disclosed receipt of the following financial support for the research, authorship and/or publication of this article: The research leading to this publication has received funding from the European Community’s Seventh Framework Program [FP7/2007-2013] under grant agreement number 220151.