
Abstract
Analysis of predictive validity of the risk/needs assessment used by a criminal justice agency is paramount. The validity of the Positive Achievement Change Tool (PACT) across gender/race/ethnicity in a juvenile sample was examined. Results demonstrate recidivism increases as PACT score increases, with minor exceptions. Findings suggest similar prediction of referral/arrest and adjudication/conviction across subgroups. 95% confidence intervals overlapped for all subgroups on 13 of 19 measures examined. However, which factors predict recidivism across subgroups differ. Criminal history was the most prevalent predictor, while no factor predicted White female offending. “Gender-responsive” item inclusion measuring abusive/traumatic circumstances did not improve prediction.
The assessment of delinquency risk and prediction of offending has an extensive history in criminological research. The extant literature has analyzed the extent to which many tools have achieved their primary goals, examining validity and accuracy of prediction (Auerhahn, 1999, 2006; Blackmore & Welsh, 1983; Chaiken & Chaiken, 1982; Cohen, 1983; Greenwood & Abrahamse, 1982; Monahan, 1981; von Hirsch & Gottfredson, 1984). More recently, analyses of the effectiveness of popular assessment instruments have focused on the area of gender differences in predictive ability (Olver, Stockdale, & Wormith, 2009; Schwalbe, 2008; Smith, Cullen, & Latessa, 2009). Thorough understanding of predictive validity and accuracy issues is essential as assessment of delinquency risk and prioritization of dynamic risk factors for intervention and case planning is only as useful as the tools are accurate.
Predictive Ability
Risk assessments have often been grouped into four generations (Andrews & Bonta, 2003). First-generation assessment is characterized by clinical/professional judgment of risk o re-offend. Second-generation assessment tools advance to actuarial assessment using static predictors. These are atheoretical statistically derived tools where the predictor variables are weighted based on the strength of their association to the outcome being predicted. The weak predictive validity of first-generation assessment in comparison to later generations has been consistently demonstrated. In examination of three meta-analyses, an average mean r of .12 across six recidivism outcomes was found for first-generation tools and a mean r of .42 for general recidivism for second-generation tools (Andrews, Bonta, & Wormith, 2006; see also Bonta, Law, & Hanson, 1998; Dawes, Faust, & Meehl, 1993; Gottfredson & Moriarty, 2006; Grove & Meehl, 1996; Grove, Zald, Lebow, Snitz, & Nelson, 2000; Hanson & Bussiere, 1998; Hoge, 2001; Mossman, 1994). Third-generation tools incorporate dynamic, changeable predictors. Finally, both static and dynamic predictors, as well as protective factors are incorporated into the fourth-generation assessments. Fourth-generation tools use reassessment/reassessments to gauge rehabilitation progress and reduction in criminogenic needs (Andrews et al., 2006). An essential component of fourth-generation assessments is a clear linkage between the results garnered from the tool to case management plans. This allows for individualized strengths to be built upon, and responsivity factors and learning styles to be considered when determining appropriate interventions (Andrews & Bonta, 2003; Bonta, 2002).
Recently, the field has moved to reporting effect sizes in terms of area under the curve (AUC), using receiver–operating characteristic (ROC) analysis. The AUC statistic illustrates the probability that a score (e.g., on a risk assessment instrument) of a randomly selected case from one population (e.g., a youth who recidivates) will be higher than a randomly selected score from a second population (e.g., a youth who does not recidivate; Rice & Harris, 2005). An additional benefit is that the AUC is less affected by fluctuating or low base rates (e.g., historically lower recidivism rates for females).
Several meta-analyses have examined the predictive validity of risk assessments used with juvenile offending populations (Olver et al., 2009; Schwalbe, 2007; 2008). Schwalbe (2007) reported a mean weighted effect size of AUC of .635 (k = 21, N = 3,335) for second-generation assessments, and .646 (k = 21, N = 4,965) for third generation. Only two studies in the Schwalbe (2007) meta-analysis were conducted on samples over 1,000 juveniles using third-generation tools, reporting AUC scores of .64 and .719. The largest study using the popular Youth Level of Service/Case Management Inventory (YLS/CMI) reported by Schwalbe (2007) included 960 youth with an AUC of .579. Olver, Stockdale, and Wormith (2009) report weighted effect sizes of r = .32 (k = 19, N = 5,722) for general recidivism for the Youth-Adapted Level of Service Inventory (LSI) and r = .28 (k = 20, N = 2,335) for the Youth-Adapted Psychopathy Checklist.
Gender and Race/Ethnicity Differences in Predictive Ability
Gender is one of the single best predictors of delinquency, with males more likely to recidivate regardless of time period, age, country, or culture (Farrington, 1986; Gottfredson & Hirschi, 1990; Moffitt, 1993). There is no consensus on whether the same risk assessment instruments (termed gender neutral) should be used to predict male and female offending (Holtfreter, Reisig, & Morash, 2004; Reisig, Holtfreter, and Morash, 2006). Some research has demonstrated assessment tools to be equally predictive of female offending (Gendreau, Goggin, & Smith, 2002; Olver et al., 2009; Schwalbe, 2008; Smith et al., 2009). Schwalbe (2008) and Olver and colleagues (2009) examined juvenile-only samples, while Gendreau, Goggin, and Smith (2002) analyzed a 67% adult sample and Smith, Cullen, and Latessa (2009) a strictly adult sample. While finding the overall risk classification of the tools able to predict male and female offending, some examinations have revealed differences in significance of specific risk factors with adult samples (Palmer & Hollin, 2007).
Some tools have incorporated “gender-responsive” factors such as trauma, abuse, and relationships, though empirical testing of these instruments and those factors’ relationship to recidivism has been limited (Salisbury, Van Voorhis, & Spiropoulos, 2009). Salisbury, Van Voorhis, and Spiropoulos (2009) examined the contribution to prediction of gender-responsive factors for female parolees. They found poor performance of second-generation static scales at predicting recidivism. Including dynamic factors improved prediction considerably. Inclusion of gender-responsive factors improved the ability to predict prison misconduct, though the factors did not improve prediction of recidivism above the Level of Service Inventory–Revised (LSI-R) composite score alone (Salisbury et al., 2009). They conclude simply adding gendered pathways-related item “patches” to existing tools is not advisable in the advancement of gender-specific assessment.
One objective of using actuarial risk assessment is to decrease gender and racial biases, while providing valuable and accurate information for practitioners (Hoge, 2002; see also Gottfredson & Gottfredson, 1988). Increasing consistency through actuarial and structured processes where identical data in all cases will produce identical results may help reach that goal. However, Schwalbe and colleagues note, the “goal of promoting racial, ethnic, and gender equality …may remain unfulfilled if the predictive validity of risk assessment instruments differ by gender or race/ethnicity” (2006, p. 306). Racial differences have been found in predictive ability and risk factor significance for several tools, (Fass, Heilbrun, DeMatteo, & Fretz, 2008; Gavazzi, Yarcheck, & Lim, 2006; Schwalbe, Fraser, Day, & Cooley, 2006).
The current study adds to the literature by examining predictive ability across gender and race/ethnicity of substantially large subgroups. The data permitted analysis of White, African American, and Hispanic differences, rather than a simple White/Black dichotomy. The current study examined juvenile offenders rather than adult offenders, as was the case for the vast majority of previous gender and race/ethnicity predictive validity research as indicated above. Following the lead of Salisbury and colleagues (2009), this study was able to measure the effect of adding gender-responsive items which had yet to be examined with juveniles.
Current Focus
The current study provides an in-depth examination of gender and race/ethnicity differences in the predictive validity of a fourth-generation risk assessment, the Positive Achievement Change Tool (PACT). This study fills an important void in the literature as no peer-reviewed studies have evaluated the PACT, which is used by one of the largest juvenile justice systems in the United States, with respect to race/ethnicity. Previous analyses have assessed the validity of the PACT in recidivism prediction for juveniles (Baglivio, 2009). The PACT’s predictive ability was compared across gender and race/ethnicity categorizations for all juveniles who completed Florida Department of Juvenile Justice (FDJJ) n.d,. probation supervision from July 1, 2007, through June 30, 2008.
We examined which risk factor domains of the PACT predict recidivism across gender and race/ethnicity. Each youth was tracked 365 days from the date he or she completed probation for both subsequent referral/adult arrest, as well as subsequent adjudication/adjudication withheld/adult conviction. A 12-month follow-up is customary, though some argue for 18-month tracking for validation, as used in the Washington State Juvenile Court Assessment (WSJCA) validation (Barnoski, 1997; Barnoski, 2004). The 12-month follow-up standard matches the current practice of the FDJJ and is therefore most appropriate for this study with respect to guiding policy decisions.
We proposed several hypotheses. First, that the PACT would be equally effective in predicting recidivism for all youth and therefore gender/race neutral. It was posited youth with a higher overall risk to re-offend score as well as higher scores on each of the PACT risk domains would recidivate at a higher rate, regardless of gender or racial/ethnic classification. Next, we hypothesized that both the criminal history subscore (prior official criminal history and seriousness of offenses) and the social history subscore (individual, family, and environmental factors) would be significant predictors of recidivism regardless of gender or racial/ethnic classification.
Additionally, it was hypothesized that males and non-White youth would re-offend at a higher rate. However, the inclusion of the PACT overall risk to re-offend score was hypothesized to reduce the strength of the relationship between race and recidivism. Finally, the authors hypothesized that similar risk domains and individual gender-responsive items would significantly predict recidivism across gender and racial/ethnic classifications. Gender or race/ethnicity differences that may appear are hypothesized to be the result of the prevalence of some social history measurements (e.g., higher rate of abuse among females) utilized in the instrument scoring, rather than predictive accuracy of the instrument.
Method
The data used in this study included all youth who successfully completed probation in fiscal year 2007–2008, demographic and referral information (equivalent to an adult arrest), and most recent PACT assessment to supervision completion.
The PACT
The PACT is a fourth-generation actuarial risk/needs assessment designed to predict a youth’s overall risk to re-offend, as well as to rank-order criminogenic needs/dynamic risk factors. There are two versions of the PACT: the Pre-Screen, with 46 items, and the Full Assessment consisting of 126 items. Both versions produce identical overall risk to re-offend classifications (low, moderate, moderate-high, high) for any given youth. The overall risk to re-offend score is based on a matrix of the criminal history and social history subscores (see Table 1; see also Baglivio, 2009, for further explanation of PACT domains and scoring). The PACT assesses static, dynamic, and protective factors, rank orders criminogenic needs which are automated into a case plan, and requires reassessments to gauge rehabilitative progress.
PACT Scoring Matrix and Domains
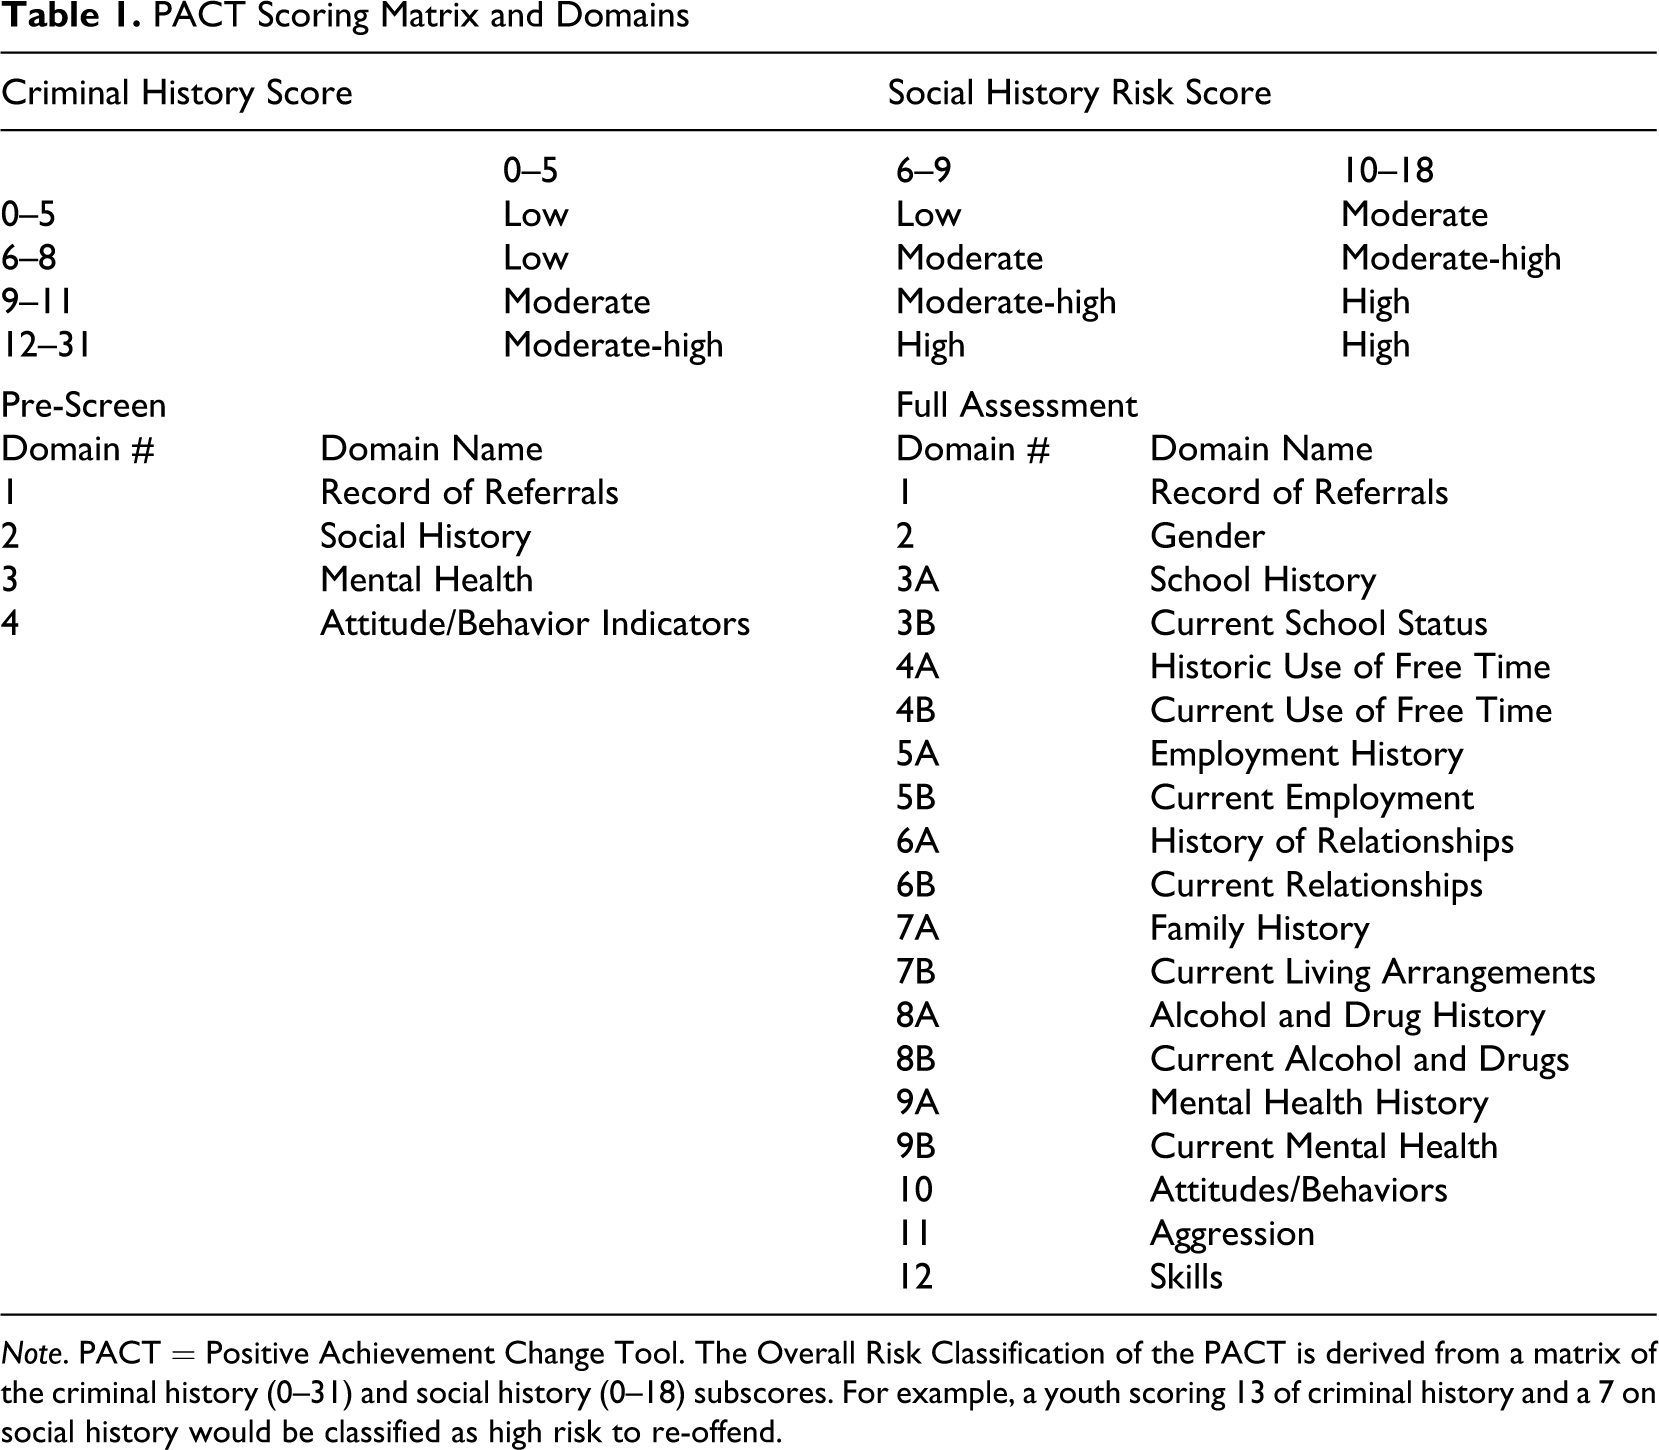
Note. PACT = Positive Achievement Change Tool. The Overall Risk Classification of the PACT is derived from a matrix of the criminal history (0–31) and social history (0–18) subscores. For example, a youth scoring 13 of criminal history and a 7 on social history would be classified as high risk to re-offend.
The Pre-Screen and Full Assessment both produce a criminal history subscore (extent and seriousness of prior offending and justice system placements) and a social history subscore (individual, family, and environmental risk factors). The overall risk score and the criminal and social history subscores for an individual youth are always identical for both the Pre-Screen and the Full Assessment, as only the questions in the Pre-Screen used for scoring are used in the Full Assessment for scoring (e.g., if the same youth was administered a Pre-Screen and a Full Assessment, the overall risk score, the criminal history, and the social history scores would be identical). The PACT Full Assessment consists of 12 domains, 11 containing questions composing the social history score and 1 of which is used to produce the criminal history score (see Table 1 for PACT domains by assessment type). Each of the 12 domains has a risk score, and most have a protective score.
The PACT is heavily adapted from the validated WSJCA which has been in use since 1998 (Washington State Institute for Public Policy, 2004). The FDJJ, together with a proprietary vendor, used the WSJCA as a guide and altered questions to reflect terminology used in Florida, as well as added questions related to mental health, depression, and suicide. This process was similar to the development of the Youth Assessment and Screening Instrument (YASI), which is also based on the Washington model (Orbis Partners, 2000). The PACT has similar domains and formatting as the Washington model (as does the YASI). The PACT contains domains reflective of the “Central Eight” risk factors espoused by Andrews and Bonta (2003).
The current policy of the FDJJ is to assess each youth entering the system using the PACT Pre-Screen. Youth scoring moderate-high or high risk to re-offend on the Pre-Screen are assessed using the Full Assessment. Every youth scoring moderate-high or high is reassessed using the PACT Full Assessment every 90 days. Every 180 days a low or moderate risk to re-offend youth on probation supervision is reassessed. Any time a youth scores moderate-high or high risk, reassessment will use the Full Assessment.
The data for this study included one PACT assessment for each youth and whether the youth received a subsequent juvenile referral or an adult arrest (for youth reaching their 18th birthday) within 365 days. Adjudication/adjudication withheld or conviction (adult) as a result of the referral/arrest occurring within the follow-up was also included. We did not need to control for any placement time or “street time” as all youth completed services and were in the community with access/opportunity to offend. Each youth was tracked 365 days from the date he or she successfully completed probation.
Sample
The PACT assessment closest to the date of successful probation completion for each youth was used. This allowed for a comprehensive assessment of each youth just prior to completion (within 30 days), before each youth being tracked for 365 days. There are several reasons for using the final PACT assessment as well as a pool of probation completers rather than a more customary “probation intake” sample. The FDJJ annually reports recidivism rates of all successful completions of placements. Our intent was to provide meaningful and practical information regarding the risk profiles of those youth and whether the PACT accurately predicts re-offense upon completion of all probation services received. Using initial assessments would be useful for examining the PACT’s prediction of probation success, but only if services received are statistically controlled. An analysis of that type would be helpful for determining the ability of various services to decrease risk, but only if the PACT is proven to accurately predict recidivism in the first place, hence the intent of the current study. This study was a necessary first step to subsequent examining of changes in risk factors over time based on service provision.
The current study examined the entire population of youth completing FDJJ probation supervision during a fiscal year across a highly diverse state with both rural and urban communities. During the 2007–2008 fiscal year, 15,168 youth completed probation supervision and were tracked 365 days (mean age of 16.4 years, standard deviation [SD] 1.52). White non-Hispanic males made up 34.1% of the sample, 28.1% were Black males, 12% Hispanic males, 11.5% Black females, 11% White non-Hispanic females, 2.7% Hispanic females, 0.5% “other” males, and 0.2% “other” females. The smallest subgroup samples were the Hispanic females (n = 405), “other” males (n = 21), and “other” females (n = 25). Due to the low number of youth in the “other” classifications (n = 25 females, n = 71 males), all subsequent analyses will exclude these subgroups. The remaining youth (n = 15,072) were followed 12 months post completion of FDJJ probation supervision and examined for subsequent offending.
Analyses
Analyses examined two dichotomous-dependent measures. The first was official delinquency in the form of a new referral/adult arrest within the 12-month follow-up period (coded 0 no to 1 yes). The second was an adjudication, adjudication withheld, or conviction as a result of the new referral/arrest that occurred within the 365-day follow-up (coded 0 no to 1 yes). It was not necessary for the adjudication or conviction to occur within the 12-month follow-up, but the referral/arrest that lead to the adjudication or conviction must have. Therefore, we examined official offending with juvenile referral or adult arrest (as some youth turned 18 within the follow-up period, adult arrests were included) and official adjudication/conviction. This enabled us to uncover differences in the PACT predictive validity between youth that were and were not arrested and those that were and were not convicted. The adjudication/conviction is a more restrictive measure and results in more conservative estimates (Schwalbe, 2006).
The first step in the analysis was to examine the percentage of youth within each risk level that recidivated. The next step in the analysis was to conduct ROC analysis and examine the AUC statistic using the PACT overall risk score, criminal and social history subscores, and domain scores for both dependent measures. The current study sought to advance analysis of domain scores and delve deeper into analyses of individual items. Therefore, we examined whether the overall PACT risk level, subscores, domain scores, and gender-responsive items predict recidivism. Logistic regression was used, as both dependent measures were dichotomous, to examine improvement in classification accuracy as recidivist or nonrecidivist (Nagelkerke R 2) by including gender-responsive items in conjunction with the PACT composite score. Initially, only the overall PACT score was entered into the model. Following Salisbury and colleagues (2009) gender-responsive items were then included to examine changes in R 2. The data allowed inclusion of very distinct items, such as physical abuse, sexual abuse, and neglect, rather than the customary “abuse” yes/no dichotomy.
Results
The percentage of youth falling into each overall risk classification was similar to those reported in an initial PACT validation study, using a different sample of youth (Baglivio, 2009). This demonstrates consistency in the state of Florida. The risk score (coded 1–4, low to high risk) had a mean of 1.527 and an SD of 0.881 for the full sample. The overall risk to re-offend score for each gender/ethnicity subgroup is shown in Table 2. When disaggregated by gender and race/ethnicity, we observe more Black males than any other group scoring high risk and more Black females scoring high risk than other female subgroups. These findings are consistent with previous research (Schwalbe et al., 2006).
Overall Risk to Re-Offend by Gender/Ethnicity
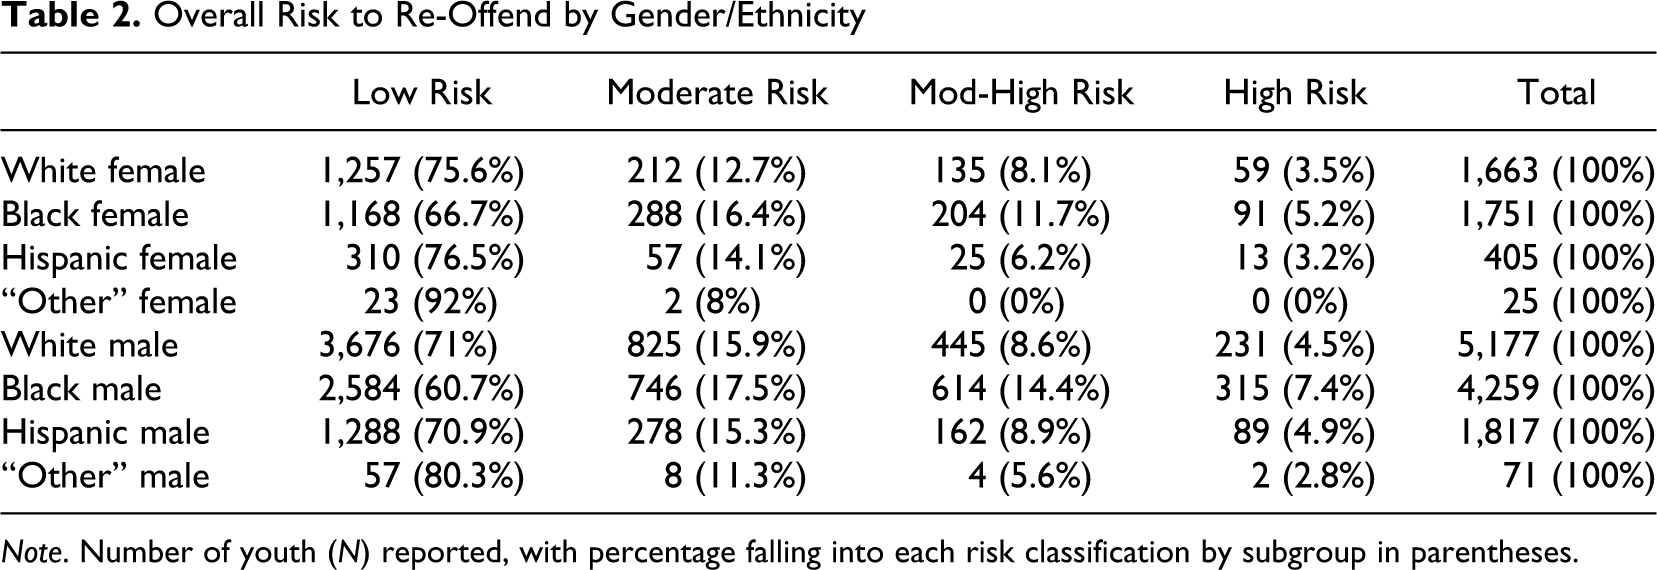
Note. Number of youth (N) reported, with percentage falling into each risk classification by subgroup in parentheses.
As mentioned, not only does the PACT Full Assessment produce an overall risk and criminal and social history subscores, it also produces domain risk scores and domain protective scores (with the exception that protective scores are not produced for the criminal history, gender, or current use of free time domains). The N for the domain risk scores is 5,862, which is the number of youth administered the Full Assessment, and 15,168 for the criminal, and social history subscores which includes both the Pre-Screen and Full Assessment, since they both produce those scores. Pearson correlations between domain risk scores and between individual items are available upon request to the author.
Table 3 shows the recidivism rates for both measures for the full sample, and by gender and race/ethnicity subgroup. For the full sample, recidivism as measured by both subsequent referral/arrest and by adjudication/conviction occurred as expected. Low-risk youth re-offend at the lowest rate followed by moderate, then moderate-high, then high. These results signify that for the full sample of youth completing FDJJ probation supervision, the PACT is operating as intended. The PACT classifications hold true when measured by both official arrest and conviction. While simplistic, this analysis is perhaps the most important measure of whether the instrument is operating as intended.
Subsequent Referral/Arrest and Adjudication/Conviction by Risk Level and Subgroup
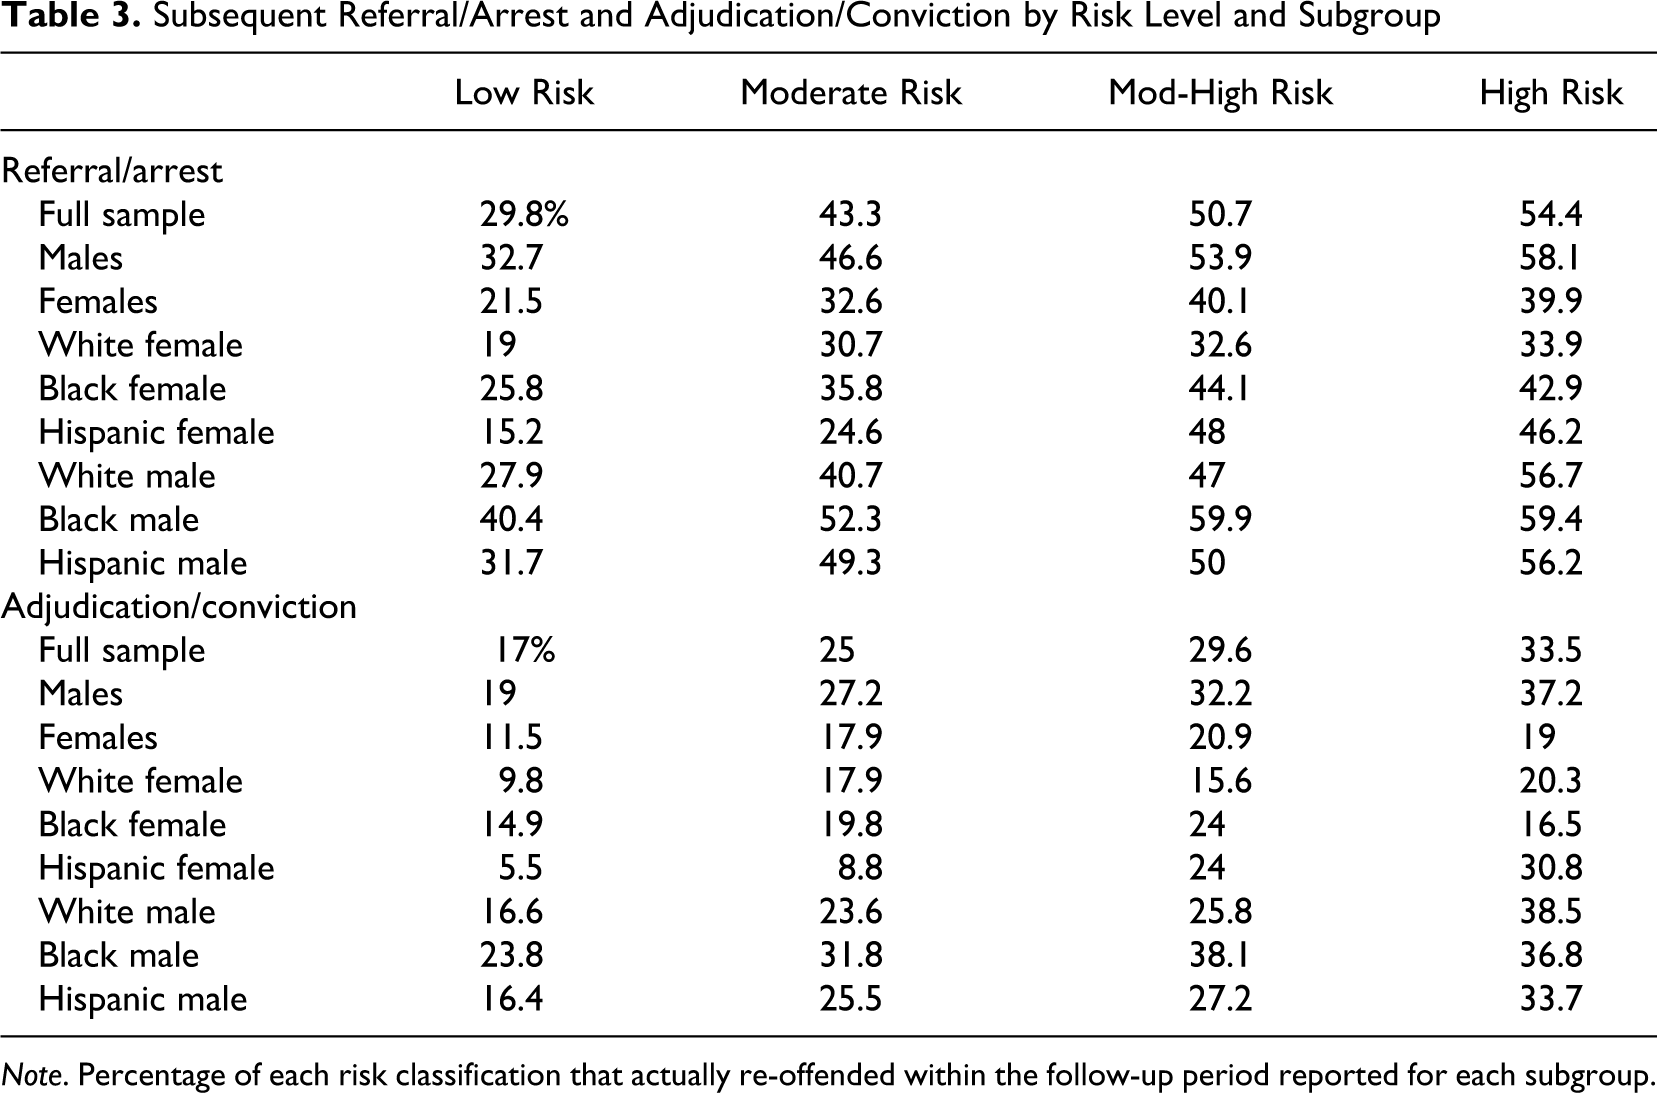
Note. Percentage of each risk classification that actually re-offended within the follow-up period reported for each subgroup.
Table 3 also shows these results hold true for the male-only sample, Hispanic male sample, and White male sample. However, all female samples and the Black male sample evidenced some discrepancies from expectation on either one or both measures. These results demonstrate some deviation from expectation when examining specific gender and race/ethnicity subgroups, especially between the PACT distinction of moderate-high and high-risk youth. This finding is particularly interesting given the lack of a moderate-high classification in the WSJCA, upon which the PACT was based. The percentages of youth that re-offend also show that males are more likely to re-offend at every risk level than females. Low-risk Hispanic females had the lowest percentage recidivate than any other group (as measured by both arrest and conviction). High-risk Black males had the highest percentage arrested, while high-risk White males had the highest percentage to be subsequently convicted.
Predictive Ability by Gender and Race/Ethnicity
The AUC for the full sample model was .578 for adjudication/conviction and .590 for referral/arrest. This is lower than the AUC of .64 reported for the WSJCA (upon which the PACT was based), although felony recidivism was the dependent measure with an 18-month follow-up in that examination (Barnoski, 2004). The AUC reported here of .590 is consistent with a previous PACT validation study, using a completely different sample, which showed an AUC of .593 for subsequent referral (Baglivio, 2009). In fact, the male-only sample AUC statistic of .590 is exactly the same as the male-only AUC statistic in the previous PACT analysis (Baglivio, 2009). With the exception of the AUC for conviction of the Hispanic females, the PACT predicts subsequent arrest better than subsequent conviction for all other subgroups (results not shown for brevity).
Appendix A shows the AUC statistic across subgroups for referral/arrest. ROC analysis for criminal history and social history subscores, as well as each domain are also reported. The AUC for the PACT predicting arrest are between .569 and .615, within the .41 to .79 range for second and third-generation tools used with juveniles found previously (Olver et al., 2009; Schwalbe, 2007). Perhaps the most useful insight comes from examination of the 95% confidence intervals. Intervals that overlap indicate no substantive differences in prediction across the gender and race/ethnicity subgroups. Where intervals do not overlap, differences are illustrated. Overlap of every gender and race/ethnicity subgroup for the PACT overall risk score was found, indicating the PACT is equally effective across all subgroups. In fact, 13 of the 19 measures examined showed overlap for every gender and race/ethnicity subgroup.
The main differences appear in the social history subscore, current relationships, family history, alcohol/drug history, attitudes/behaviors, and skills (see Table 4). The social history subscore is a stronger predictor of subsequent referral/arrest for Hispanic females than all other subgroups with the exception of Hispanic males. The current relationships domain evidences no overlap in confidence intervals between White females with the full sample, males, Black females, and White males, indicating a weaker prediction for the White females. Family history is a stronger predictor for Hispanic females than all other subgroups, with the exception of Black females, where the intervals overlap. Alcohol and drug history is a weaker predictor for females in general than for White and Hispanic males. Attitudes and behaviors are weaker predictors for White females than for all of the male subgroups and the full sample. The skills domain is a stronger predictor for males than for White females. All other confidence intervals for the subgroups overlap for each measure.
Differences in Risk Factor Significance Across Subgroups
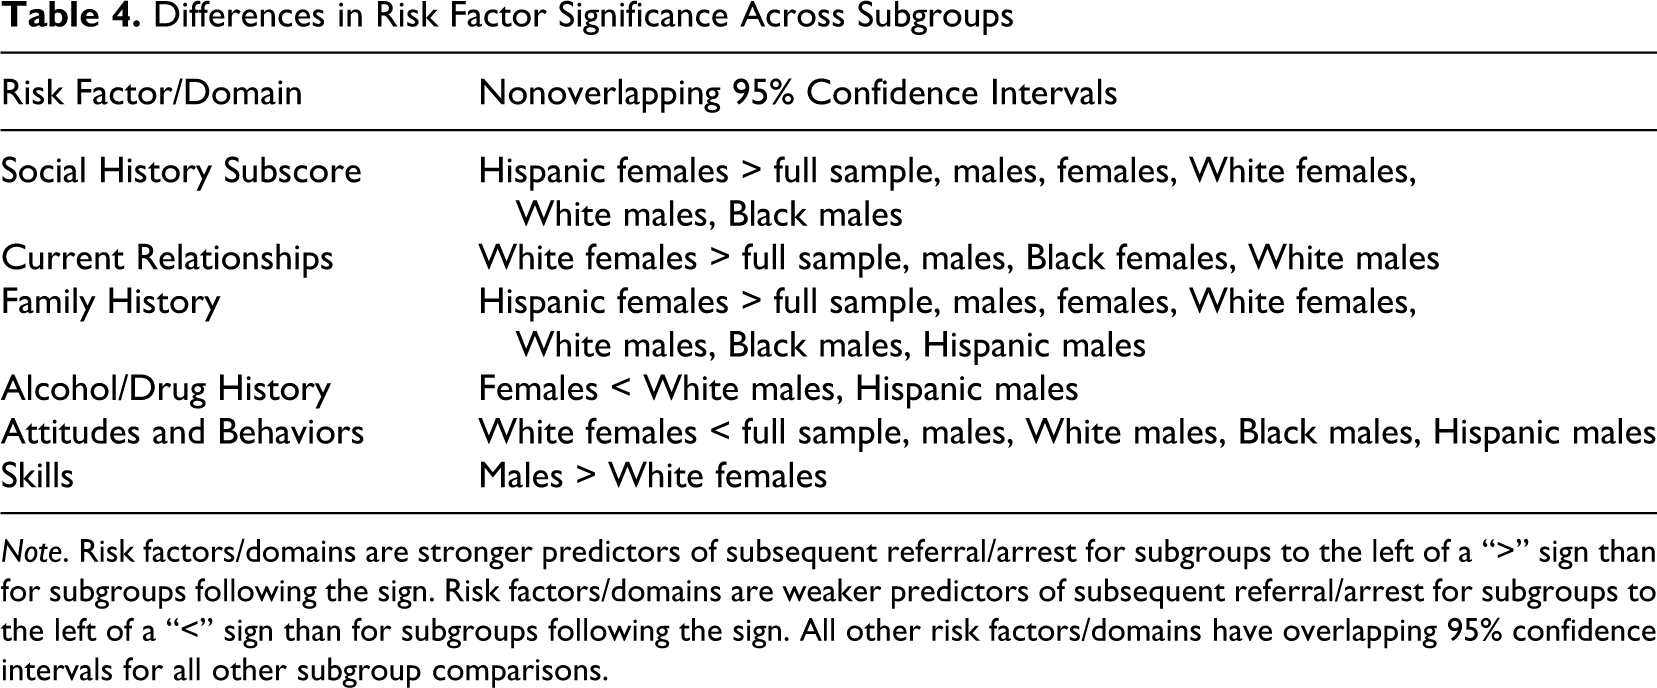
Note. Risk factors/domains are stronger predictors of subsequent referral/arrest for subgroups to the left of a “>” sign than for subgroups following the sign. Risk factors/domains are weaker predictors of subsequent referral/arrest for subgroups to the left of a “<” sign than for subgroups following the sign. All other risk factors/domains have overlapping 95% confidence intervals for all other subgroup comparisons.
Predictive Significance of Major Risk Factors
Eleven separate regression models were examined to predict the dependent recidivism measures. The first model used the PACT overall score, gender, and a dichotomous White, non-White race variable to predict arrest and conviction separately. All three variables were significant (p < .001) predictors of recidivism for both dependent measures, with R 2 much larger for predicting arrest than conviction (.073 and .049 respectively, results not shown for brevity). Higher risk youth, males, and non-White youth were more likely to recidivate after completing probation supervision (arrested and convicted). Odds ratios (ORs) indicated gender (OR = 1.859 for arrest; 1.876 for conviction) having the strongest relationship to recidivism for both arrest and conviction. The overall risk score (OR = 1.458 for arrest; 1.358 for conviction) had a stronger relationship to recidivism than race (OR = 1.272 for arrest; 1.231 for conviction), suggesting the PACT may reduce the influence of race.
The second model used gender, race, and the criminal and social history subcomponent scores. All variables were significant (p < .001) and in the hypothesized direction, with gender (OR = 1.789 for arrest; 1.812 for conviction) still having the strongest relationship with recidivism (results not shown for brevity). However, for both dependent measures, the social history score (OR = 1.093 for arrest; 1.072 for conviction) had a stronger relationship to re-offending than the criminal history score (OR = 1.074 for arrest; 1.065 for conviction). This suggests individual, family, and environmental factors have more importance than static previous offending in the prediction of juvenile recidivism using the PACT.
Table 5 illustrates the significant predictors for each subgroup separately entering risk domain scores into regression models for both dependent measures (Models 3–11). Gender (OR = 1.961 for arrest; 1.873 for conviction) was the strongest predictor for the full sample model, followed by race (OR = 1.258 for arrest; 1.13 for conviction) then criminal history (OR = 1.059 for arrest; 1.059 for conviction). Of note, race was not a significant predictor for the female-only sample of arrest or conviction. Criminal history was the most prevalent predictor, significant for all models except White female conviction, Hispanic female arrest or conviction, or Black female conviction. No domain predicted White female conviction, and only criminal history predicted White female arrest. This illustrates a limitation of PACT domain scores to predict White female recidivism, similar to research where only one factor predicted White female recidivism (Schwalbe, 2006).
Logistic Regression: Recidivism and Risk Factors
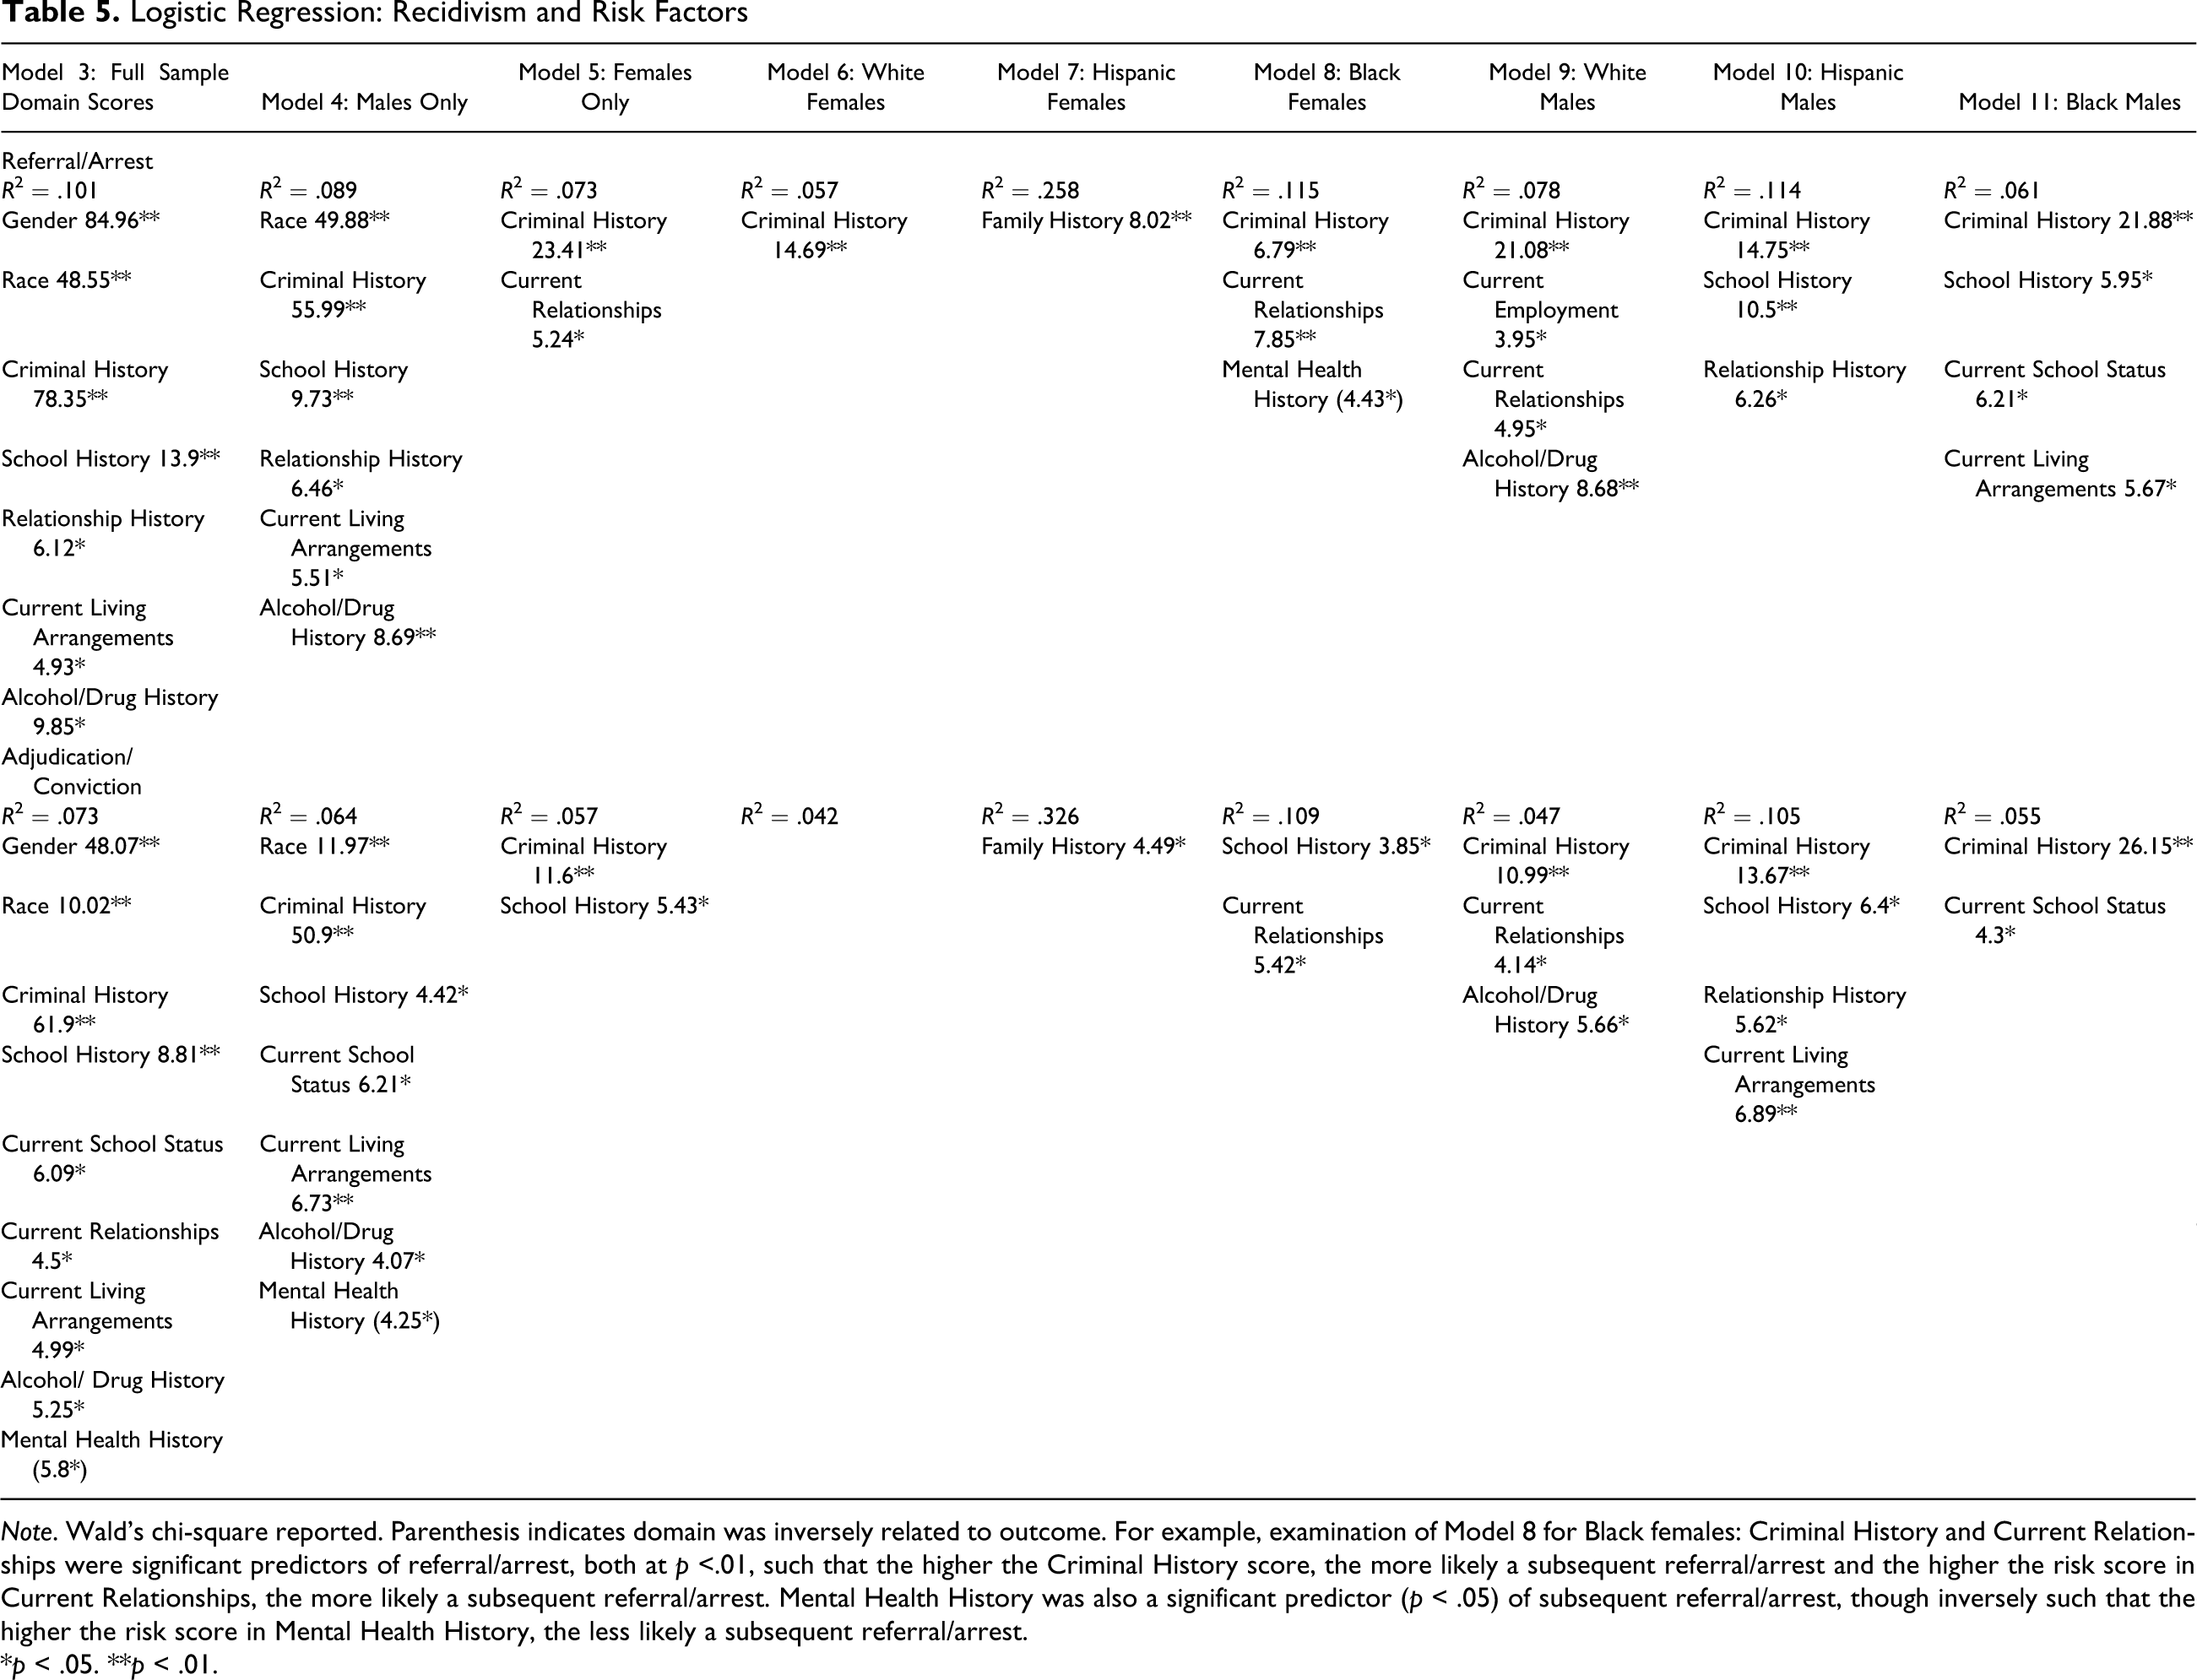
Note. Wald’s chi-square reported. Parenthesis indicates domain was inversely related to outcome. For example, examination of Model 8 for Black females: Criminal History and Current Relationships were significant predictors of referral/arrest, both at p <.01, such that the higher the Criminal History score, the more likely a subsequent referral/arrest and the higher the risk score in Current Relationships, the more likely a subsequent referral/arrest. Mental Health History was also a significant predictor (p < .05) of subsequent referral/arrest, though inversely such that the higher the risk score in Mental Health History, the less likely a subsequent referral/arrest.
*p < .05. **p < .01.
As the R 2 illustrates, less classification accuracy was evidenced for White female recidivism for both dependent measures. In contrast, R 2 for both measures when examining Hispanic females is substantially higher than all other subgroups. However, only family history appeared for the Hispanic females, where it was significant for both measures. Mental health, when significant, was always inversely related to recidivism, with higher scores indicating reduced likelihood of re-offending. Common risk factors such as relationships and school problems appeared sporadically, while others such as antisocial attitudes and skills were absent. These findings illustrate composite scores are greater than the sum of their parts as domains are more or less significant for subgroups yet overall risk scores equally predict across subgroups as evidenced by overlapping confidence intervals in the ROC analysis.
Predictive Analysis by Gender for Individual Items
Logistic regression was used to examine prediction improvement by including gender-responsive items in conjunction with the PACT composite score. Physical abuse history (no/yes), history of witnessing violence (not witnessed, witnessed, family member killed), sexual abuse history (no/yes), neglect history (no/yes), mental health diagnosis and problems (no/yes), suicidal ideation (no/thoughts/attempts), history of a traumatic event (no/yes/flashbacks), history of depression (no/occasional/consistent/impairment in tasks), and a history of running away (no/1 time/2 or 3 times/4 or 5 times/over 5) were included for each subgroup. Inclusion of these items was based on prior research indicating a need to examine the relationship to future offending of abuse, mental health indicators, and trauma-related factors (Salisbury et al., 2009). Furthermore, there has been a lack of examination of the relationship of these factors to offending for juveniles.
The PACT composite score was a significant predictor of subsequent arrest for the full sample (p < .001), with an R 2 of .041. Inclusion of the gender-responsive items improved the model to an R 2 of .046 (results not shown for brevity). Other than the PACT composite score, only a history of witnessing violence was significant (p < .05) in the hypothesized direction, meaning youth with a greater history of witnessing violence were more likely to be subsequently arrested. Youth who were sexually abused and neglected were significantly less likely to be subsequently arrested examining the full sample.
The PACT composite score and gender-responsive items were included in models for each subgroup (results not shown for brevity). The PACT score remained a significant predictor of arrest for all subgroups with the exception of Hispanic females. Inclusion of the gender-responsive items doubled the R 2 for the Hispanic female subgroup, though only having a traumatic event history (p < .05) and more instances of running away (p < .05) were significant predictors. No gender-responsive items were significant for the female-only, White female, or Black male subgroups with R 2 increases of .000, .001, and .001 after inclusion (respectively). Inclusion of the items increased the R 2 for Black females by .006, as Black females with a history of sexual abuse (p < .05) were less likely to be arrested. White males with a neglect history (p < .01) were less likely, and those with more instances of running away (p < .05) were more likely to be arrested (R 2 increase of .005 after inclusion). Hispanic males witnessing violence (p < .01) were more likely to be subsequently arrested (R 2 increase of .01).
The inclusion of gender-responsive items improved the performance of the model for Hispanic females only (405 of the 15,168 youth). History of physical abuse, mental health problems, history of suicidal ideation, and history of depression were never significant, and sexual abuse history always inversely related to re-offending when it was significant. The insignificance of gender-responsive items in improving prediction models beyond the PACT score for the vast majority of youth completing probation supervision demonstrates a lack of need for gender-specific tools to predict recidivism.
Discussion
Practitioners cannot know whether they are accurately matching youth to services in the absence of evaluations that indicate how well assessments perform by gender and race/ethnicity. This study served to partially fill that gap by examining the predictive ability of the PACT across subgroups. We examined both subsequent referral/arrest and subsequent adjudication/conviction, both juvenile and adult official records, for the total population of youth completing probation during an entire year. Reporting multiple dependent measures advances the ability of the field to make comparisons across outcomes which has to this point been lacking in the field (Cottle, Lee, & Heilbrun, 2001). Results indicate the PACT overall risk score significantly predicts both dependent measures of recidivism. This is the second study, with different juvenile samples, to examine the PACT’s predictive validity. Few instruments have been examined for the same population with multiple samples (Schwalbe, 2007), especially using juvenile offenders.
The AUC ranged from .569 to .615 for the subgroups, using referral/arrest as the dependent measure and overall risk score as the predictor, with overlapping confidence intervals for all groups. The AUC of the PACT is similar to that found in previous research examining predictive validity of risk assessments with large juvenile samples (Olver et al., 2009; Schwalbe, 2007). However, an AUC in the mid to high .50s is fairly modest and considered “small” in magnitude of effect size (Rice and Harris, 2005). The AUC found may be indicative of using a more selective sample (successful probation completions) than customary intake samples. Future research should extend the follow-up period given recent meta-analytic research has found AUC statistics for a popular assessment are reported higher when using an 18-month follow-up (Andrews et al., 2011). Future endeavors should also examine alternative scoring of the PACT in an attempt to increase predictive ability.
The social history and the criminal history subscores of the PACT both significantly predicted subsequent arrest and conviction. Importantly, examining ORs shows the social history subscore had a stronger relationship to recidivism than the criminal history subscore in logistic regression models. This result is identical to that found in previous examinations of the PACT, as well as other empirical research. Previous meta-analyses found a mean effect size of .13 for dynamic predictors and .11 for static predictors (Gendreau, Little, & Goggin, 1996). This finding consistently suggests the merits of rehabilitation, the principles of effective intervention, and the need for targeting dynamic factors.
The consistent finding from previous analysis that over 65% of youth are classified as low risk sheds light on the advantages of adhering to the risk principle of targeting higher risk youth (Baglivio, 2009). In times of economic hardship, this is essential for all juvenile justice systems. Targeting higher risk youth makes economic sense and has been empirically shown to be most successful for recidivism reduction. It has the added bonus of reducing the net-widening potential of using risk/needs tools when youth are matched to (often intensive) services based on results without regard to risk level.
Interestingly, the inclusion of gender-responsive items improved the prediction model of simply using the PACT overall score for the Hispanic female subgroup only. The current study advanced from previous analyses of gender differences in predictive ability in that abuse was not only included, but furthermore various forms of abuse were separately reported. The lack of significance of the gender-responsive items for juveniles leads to similar conclusions as Salisbury and colleagues state in which, “gender-responsive proponents face a daunting struggle advocating for issues that are prevalent and unfortunate but unrelated to future offending” (2009, p. 576).
Still, while generic risk factors are predictive for both men and women, some argue it is the contextual experience of those risk factors that is essential to understanding female criminality (Hannah-Moffat, 2009; see also Morash & Chesney-Lind, 1991; Resnick, Ireland, & Borowsky, 2004). In keeping with the “gendered pathways” line of research, the current relationships domain significantly predicted subsequent arrest of the female only subsample, and arrest and conviction of the Black female subsample. Though beyond the ability of the current data, future research should examine whether the significance of “relationships” is due to delinquent peer associations in general or perhaps intimate relationships with delinquent males. Proponents of the contextual experience argument suggest adding gender-responsive item patches to existing tools are misguided. Ironically, the creation of any female risk assessment instruments from the ground up and subsequent empirical evaluation is surprisingly lacking. Future research is necessary to examine whether tools built based on gender-responsive theory outperform existing tools.
The results presented here suggest that using the PACT assessment can assist the agency, at least to a limited degree, with reducing disparities based on race/ethnicity and gender. The current study was not able to examine whether the differences found between gender and race/ethnicity subgroups were due to the shortcomings of the instrument or to external factors in the criminal justice system itself. Scholars have suggested the weakness in the vast majority of risk assessment research of not controlling for intervening variables (Schwalbe et al., 2007). Differential law enforcement practices (surveillance, detection, arrest practices) across gender and race/ethnicity subgroups, judicial decision-making disparities, and a host of other discretionary practices all affect estimates of predictive validity of risk assessment instruments. Future research would be well served to attempt to quantify and examine the effects of intervening variables for more accurate validity estimates. Future research should examine whether specific interventions show measurable reduction in criminogenic needs. Tying services and interventions received back to the youth’s individualized case management plan is critical. Given that the case management plans are automated from the PACT results in Florida, the integral factor will be whether the youth received those services and at what dosage. Andrews, Bonta, and Wormith (2006) suggest, “Substantial improvements in the predictive criterion validity of risk assessments may reside in reassessments of dynamic risk factors” (p. 16; see also Andrews & Robinson, 1984). Research to date on dynamic validity is almost nonexistent (Bonta, 2002).
While not without its limitations, the current study assessed the predictive validity of the PACT on a juvenile offending sample achieving similar results to previous analyses. This study adds to the literature on risk assessment accuracy by using a large, diverse population, rural and urban, of juvenile offenders across an entire state. Furthermore, the current study was a reevaluation of predictive validity of the PACT with juvenile offenders, with the addition of being across gender and race/ethnicity, which is extremely rare in the literature. Examinations such as these are of critical importance to policy and practitioners interested in whether tools are appropriate for the population they have been implemented with. Continuous examination of the instruments and processes used by a juvenile justice agency is critical to maximizing their potential benefits.
Footnotes
Appendix A
Area Under Curve (AUC) With Subsequent Referral/Arrest as Dependent Measure
| Risk Level/Domain | Full Sample | Males | Females | White Females | Black Females | Hispanic Females | White Males | Black Males | Hispanic Males |
|---|---|---|---|---|---|---|---|---|---|
| Overall risk | .590 [.580, .599] | .590 [.579, .601] | .582 [.561, .603] | .569 [.535, .604] | .579 [.549, .608] | .615 [.541, .690] | .585 [.568, .602] | .582 [.565, .600] | .586 [.558, .613] |
| Criminal history subscore | .611 [.601, .620] | .608 [.597, .618] | .611 [.591, .631] | .602 [.570, .635] | .598 [.569, .627] | .642 [.576, .708] | .593 [.576, .609] | .604 [.587, .621] | .599 [.571, .626] |
| Social history subscore | .590 [.580, .599] | .590 [.579, .600] | .570 [.549, .591] | .574 [.541, .607] | .552 [.523, .582] | .685 [.621, .750] | .590 [.573, .607] | .584 [.567, .601] | .601 [.574, .628] |
| School history | .580 [.565, .595] | .580 [.563, .596] | .575 [.542, .608] | .527 [.471, .582] | .583 [.537, .629] | .643 [.544, .742] | .552 [.524, .579] | .571 [.544, .598] | .619 [.583, .656] |
| Current school | .530 [.514, .545] | .533 [.516, .550] | .518 [.483, .552] | .510 [.454, .565] | .532 [.484, .580] | .449 [.341, .557] | .498 [.469, .526] | .544 [.527, .582] | .527 [.488, .566] |
| Use of free time | .524 [.508, .539] | .526 [.509, .544] | .525 [.491, .559] | .478 [.423, .534] | .554 [.506, .601] | .537 [.438, .641] | .528 [.500, .556] | .525 [.498, .552] | .523 [.484, .561] |
| Employment history | .513 [.498, .529] | .520 [.503, .537] | .500 [.466, .534] | .490 [.435, .546] | .508 [.461, .566] | .514 [.411, .618] | .534 [.505, .562] | .507 [.480, .534] | .529 [.490, .568] |
| Current employment | .502 [.486, .517] | .501 [.484, .519] | .502 [.468, .536] | .499 [.443, .555] | .505 [.457, .552] | .500 [.398, .602] | .505 [.477, .534] | .498 [.471, .526] | .501 [.462, .539] |
| Relationship history | .543 [.528, .558] | .543 [.526, .560] | .536 [.502, .569] | .505 [.448, .561] | .560 [.514, .606] | .543 [.442, .645] | .542 [.514, .569] | .535 [.508, .562] | .572 [.534, .609] |
| Current relationships | .570 [.555, .585] | .573 [.556, .590] | .562 [.528, .596] | .491 [.434, .549] | .608 [.562, .654] | .571 [.472, .671] | .577 [.550, .605] | .553 [.526, .581] | .572 [.535, .610] |
| Family history | .533 [.517, .548] | .544 [.527, .561] | .562 [.529, .595] | .501 [.444, .557] | .580 [.535, .626] | .715 [.624, .805] | .557 [.529, .585] | .529 [.502, .556] | .543 [.505, .581] |
| Living arrangements | .574 [.559, .589] | .588 [.571, .605] | .567 [.535, .600] | .522 [.468, .576] | .578 [.532, .623] | .649 [.559, .739] | .576 [.548, .604] | .585 [.558, .612] | .577 [.539, .615] |
| Alcohol/drug history | .558 [.543, .573] | .564 [.547, .581] | .514 [.480, .548] | .526 [.470, .581] | .523 [.475, .571] | .574 [.471, .677] | .590 [.563, .618] | .561 [.534, .588] | .599 [.562, .637] |
| Alcohol/drug use | .532 [.517, .548] | .536 [.518, .553] | .500 [.467, .534] | .498 [.442, .554] | .508 [.460, .555] | .511 [.407, .615] | .546 [.518, .574] | .532 [.505, .559] | .546 [.507, .585] |
| Mental health history | .513 [.498, .528] | .523 [.505, .540] | .503 [.469, .538] | .497 [.440, .553] | .508 [.461, .556] | .583 [.475, .691] | .543 [.515, .571] | .523 [.496, .550] | .528 [.490, .567] |
| Current mental health | .505 [.490, .520] | .504 [.487, .522] | .513 [.479, .547] | .519 [.462, .576] | .514 [.466, .562] | .502 [.399, .604] | .507 [.479, .535] | .504 [.477, .531] | .507 [.468, .546] |
| Attitudes/behaviors | .578 [.563, .593] | .587 [.570, .604] | .549 [.516, .583] | .486 [.430, .542] | .581 [.535, .627] | .607 [.510, .704] | .590 [.562, .618] | .572 [.545, .599] | .586 [.548, .624] |
| Aggression | .558 [.542, .573] | .571 [.554, .588] | .550 [.517, .583] | .508 [.453, .563] | .557 [.511, .603] | .621 [.525, .718] | .570 [.542, .599] | .553 [.526, .580] | .585 [.547, .623] |
| Skills | .557 [.542, .572] | .562 [.544, .579] | .535 [.502, .569] | .485 [.430, .540] | .552 [.505, .598] | .581 [.477, .686] | .562 [.534, .590] | .548 [.521, .575] | .547 [.509, .586] |

Note. AUC statistic for subsequent referral/arrest reported, with 95% confidence interval in parenthesis.
Authors’ Note
The views expressed in this manuscript are those of the authors and not necessarily the Florida Department of Juvenile Justice.
Declaration of Conflicting Interests
The author(s) declared no potential conflicts of interest with respect to the research, authorship, and/or publication of this article.
Funding
The author(s) received no financial support for the research, authorship, and/or publication of this article.