
Abstract
Recent findings indicate that including White offenders in the sample biases the predictability of risk and needs assessment instruments. As a result, this study examines the predictability of the Los Angeles County Needs Assessment Instrument (LAC) on a sample of African American and Hispanic juvenile probationers. Given that the extant literature focuses on regression analysis, to the curtailment of error analysis, this study also provides a unique examination of predictive error. The results suggest that the instrument under examination predicts better for Hispanics than African Americans. Of the two minority groups, the needs assessment instrument demonstrated the greatest effect size for Hispanic probationers. The LAC performed 16% better than chance predictions when classifying Hispanic juveniles. The area under the curve value was nonsignificant for African American juvenile probationers. The situating of our research findings, their limitations, suggestions for future research, and policy implications are discussed.
Despite widely accepted racial/ethnic differences within the United States economic, health, educational, and criminal justice systems, minorities are continuously compared to members of the dominant White majority group in offender assessment validations. In a recent review of forensic risk assessment meta-analyses, Singh and Fazel (2010) concluded that, in cross-racial/ethnic assessment comparisons, the inclusion of White offenders in a sample increases the effect size of the predictive instrument under question, ultimately limiting the ability of the instrument to predict accurately for minority groups. Consistent with the research (Gabbidon, Higgins, & Potter, 2011; Schlager & Simourd, 2007; Warren, Chiricos, & Bales, 2012) examining bias within policing, the judicial process, and corrections, which demonstrates that African American and Hispanics are more disadvantaged and likely to be processed through the criminal justice system, we extend the question of racial/ethnic predictive equity to juvenile needs assessments. In short, we examine the predictability of a needs assessment instrument on African American and Hispanic juvenile probationers.
The extant juvenile risk assessment research has centered on the regression analysis of comparisons between White, African American, and Hispanic offenders. To date, however, there have been no examinations of a needs assessment instrument’s ability to equitably predict rearrest without undue error being associated with the offender’s racial classification (i.e., commonly referred to as classification error or assessment bias). In fact, recent findings have suggested that as the proportion of White participants in a sample increases, so do the needs assessment instrument’s predictability, therefore, masking the instruments ability to predict supervision and treatment services for minority groups (Singh & Fazel, 2010; Singh, Grann, & Fazel, 2011). In short, the literature proposes that the inclusion of White offenders in risk validation samples overinflates the needs estimates and underestimates the predictive validity of risk screening instruments on minority offender populations (Gendreau, Little, & Goggin, 1996; Leistico, Salekin, DeCoster, & Rogers, 2008). As a result, this research is the first to examine the predictive validity of a needs assessment instrument on the two largest juvenile minority probationer populations without the influence of the dominant racial group that has been found to bias the predictive estimates. We also examine the relative predictive error across both the groups, a test often overlooked by previous predictive validity studies and their cultish allegiance to regression analyses. By examining error, we address the limitation of regression analysis, in that it does not allow for an intentional understanding of the nature and extent of predictive accuracy (i.e., error).
Race and Ethnicity in Juvenile Needs Assessment Predictability
Unlike needs assessment instruments utilized on adult offenders, to date, few juvenile needs assessment instruments have been validated for use on racial/ethnic groups. Among those needs assessment instruments examined for their ability to accurately classify juvenile offenders are the North Carolina Assessment of Risk (NCAR; Schwalbe, Fraser, Day, & Arnold, 2004; Schwalbe, Fraser, Day, & Cooley, 2006; Schwalbe, Fraser, & Day, 2007), the Youth Level of Service/Case Management Inventory (YLS/CMI; Onifade, Davidson, & Campbell, 2009), and the Los Angeles County Needs Assessment Instrument (LAC; Turner & Fain, 2003). These instruments were created to (1) provide supervising officers with a more objective assessment of the offender’s risk of reoffending and needs for service, (2) allocate scarce resources in aiding case classification, (3) reduce individual biases and prejudices associated with case dispositions, sanctions, and intervention strategies, and (4) provide a protection against accusations of agency or officer subjectivity. The effect sizes, as determined by the area under the curve (AUC), across the previously mentioned instruments ranged from .599 to .729. Despite results that indicate predictive racial/ethnic equity, research demonstrates that there is no single instrument that predicts probation outcomes (i.e., supervision success and rearrest) better than any other (Singh & Fazel, 2010; Singh et al., 2011), nor have they been examined without the inclusion of members from the majority White offender and societal populations, in which again the research has demonstrated bias in the predictive estimates.
The NCAR and YLS/CMI needs assessment instruments have been validated for use on African American and White juvenile offenders (Onifade et al., 2009; Schwalbe et al., 2004, 2006, 2007). Although data were available for Asian Americans, Hispanics/Latinos, Native Americans, and others, they were all excluded because their sample sizes were too small to justify inclusion. Despite utilizing different cutoff scores, both instruments classified most juvenile offenders as low or medium risk (Onifade et al., 2009; Schwalbe et al., 2004). With sample sizes ranging from 484 to 9,534 and follow-up periods from 9 to 24 months after the initial assessment, 23% to 42% of the probationers were rereferred to court and/or readjudicated. Although both instruments were significant predictors of rearrest, regression analysis revealed that the need items were less likely to predict rearrest for African Americans than White youths.
To date, the LAC is the only needs assessment instrument validated on African American, Hispanic, and White juvenile probationers (Turner & Fain, 2003). The LAC classified most juvenile offenders as low risk. With a sample size of 813, Turner and Fain (2003) examined rearrest at 6, 12, and 18 months after the initial assessment of the LAC, finding that 19% to 36% of the probationers were rearrested while on probation. Significant correlations were found between the total needs score and rearrest at 6 months (r = .18), 12 months (r = .20), and 18 months (r = .19) postassessment of the LAC. To determine the extent to which race had an independent effect on recidivism, Turner and Fain (2003) found no significant differences between African American, Hispanic, and White juvenile probationers in the instrument’s prediction of rearrest. Without an examination of the instrument’s error across each racial/ethnic group, it remains to be known whether there are differential rates of predictive error (i.e., false positives and false negatives).
The Current Study
This quasi-experimental study examined archival data from a sample of African American and Hispanic probationers in order to determine the predictive validity of the LAC. The authors examined the ability of the LAC need items, age, supervision levels, and racial/ethnic categorizations to accurately predict new arrest. The degree and extent of error (i.e., misclassifications) among each racial/ethnic group were also examined. Extending from previous research, which contends that African American and Hispanic probationers have distinct pathways to reoffending (Gabbidon & Taylor-Greene, 2009), we surmise that the LAC need items predicting reoffending may differ according to race/ethnicity. Therefore, the uniqueness of this study is fourfold, we (1) assess any new arrest within 18 months of the LAC being administered, (2) determine the relative difference between the LAC need items predictability for African American and Hispanic juvenile probationers, (3) examine classification errors among each racial/ethnic group, and (4) investigate the influence of the respective racial/ethnic categorization on the overall instrument’s predictability.
Method
Participants
The current study used archival data collected by Turner and Fain (2003) from a sample of 813 juveniles sentenced to probation in Los Angeles County, California. Resulting from the small number of females within each respective racial/ethnic group, coupled with the gendered pathways to delinquency (Gavazzi, Yarcheck, & Chesney-Lind, 2006; McClellan, Farabee, & Crouch, 1997), we decided to exclude females (n = 206). Due to their small sample size and consistent with the extant literature that proposes the need to examine the predictive validity of risk assessment instruments without the influence of White offenders, those males self-identifying themselves as either White (n = 85) or mixed race (n = 41) were excluded. As a result, the final sample size consisted of 480 African American and Hispanic male juvenile probationers. Probationers averaged 16 years of age (range = 12 to 18; Table 1). The majority (47%) of the juvenile probationers were 16 to 17 years of age and 64% of them were classified as limited supervision (i.e., low risk of recidivism warranting decreased levels of supervision and treatment programming; Andrews & Bonta, 2010).
Sample Characteristics.

Instrument
LAC
The LAC is comprised of nine dichotomously measured dynamic criminogenic need items that serve as the basis for treatment/rehabilitative services. The weighted need items consist of probationers reporting to court or the probation office, paying restitution/fines/fees, substance use, gang affiliation, school status, home/community adjustment, mental health status, participation in community service, and employment status. The sum of the needs items ranges from −5 to 42, with higher scores indicating an increased need for treatment and warranting of a higher level of supervision. Probation officers had the discretion to use overrides in adjusting the level of supervision. Based on the total needs score, youths were classified into one of six levels of supervision: limited (−5–7), minimum (8–11), standard (12–15), transitional (16–19), intensive (20–23), and maximum (24–42).
Recidivism
Recidivism was operationalized as any new arrest resulting from a felony or misdemeanor offense, status offense, and/or technical violation of probation. New arrest data were retrieved by assessing each youth’s criminal record through the local law enforcement electronic database. Technical violations were accessible through agency archived data. Consistent with the extant literature, which holds that longer follow-up periods are more amenable to assessing offender behavior patterns, we utilized a follow-up period of 18 months (Andrews et al., 2011; McGrath & Thompson, 2012).
Data Analysis
This study proceeded in four steps to examine the predictive accuracy of LAC. First, we used chi-square tests to identify significant associations between the LAC need items and the outcome measure. Given that chi-square requires the expected cell frequencies be greater than 1 and that 80% of the cells have expected frequencies greater than 5, we combined the risk categories within each need items to avoid violating this assumption. For example, the LAC need item “employment status,” which includes the categories of vocational training, employed, unemployed, and not seeking employment, was dichotomized to reflect those probationers who were either employed or not. In addition, to ascertain whether youths with the presence of risk (i.e., not employed) recidivated at a higher rate than youths with the absence of risk (i.e., employed), this study presented the percentage of juvenile probationers recidivating for each need item possibility.
Despite its simplicity, a two by two contingency table has been found to be the most appropriate measure of classification errors, because it illustrates false negatives and false positives for a specified risk category (Whiteacre, 2006). In order to determine the extent of classification errors, two-by-two contingency tables were constructed at the 7th, 15th, and 23rd cutoff scores. These cutoff scores were chosen to assess the extent to which they affected classification errors for African American and Hispanic juvenile probationers across lower and higher levels of supervision.
Logistic regression examines the influence of continuous and/or categorical independent variables on a dichotomous-dependent variable by estimating the probability of the event’s occurrence, in our case, rearrest. In the third step, we used binary logistic regression to investigate the relationship between the items on the LAC and the outcome measure under question (i.e., rearrest). For each observation, the logistic regression estimates a probability value between 0 and 1. This predicted probability is based on the value/values of the independent variable/variables and the estimated coefficients. If the predicted probability is greater than .50, then the outcome is predicted to be 1 (i.e., rearrest happened); otherwise, the outcome is predicted to be 0 (rearrest did not happen; Hair, Black, Babin, Anderson, & Tatham, 2006).
For the purposes of this study, the regression coefficient (b), standard error (SE), and odds ratio (Exp (B)) will only be displayed for independent variables that are significantly related to the outcome measure. Independent variables with positive regression coefficients (e.g., b = .756) represent an increase in the predicted probability, while negative regression coefficients (e.g., b = −.756) serve to the contrary. The SE represents the mean differences expected due to sampling variation. The Exp (B) represents how much the probability will change, given a one unit increase in the independent variable (Tabachnick & Fidell, 2007). For example, as a probationer’s risk score increases by one unit (i.e., 1 point), he or she has a 5% greater odds of being arrested.
In the final step, this study conducted receiver–operating characteristic (ROC) analyses to estimate the predictive validity of the LAC needs score. ROC is the most commonly used technique in predictive validity studies due to it being less dependent on base rates and/or selection ratios (Mossman, 1994; Schwalbe, 2007). ROC analysis allows researchers to examine the sensitivity (i.e., true positive probability) and specificity (i.e., false positive probability) for a given assessment instrument (Lussier, Verdun-Jones, Deslauriers-Varin, Nicholls, & Brink, 2010). In predictive validity research, the ROC provides the AUC value, the probability that a randomly selected probationer in the sample who reoffends will have a higher score on the needs assessment instrument than a randomly selected probationer who does not reoffend (Barbaree, Langston, Blanchard, & Cantor, 2009). The AUC varies between .00 and 1.00, with values of .50 representing prediction that is no better than chance and values of 1.00 indicating perfect prediction of both true positives and true negatives (Lussier et al., 2010). In other words, the closer the AUC is to 1.0, the stronger the accuracy. It should be noted that (1) the AUC of juvenile risk assessment instruments ranges from .53 to .78, with an average AUC of .64 (Schwalbe, 2007), (2) no instrument will ever predict reoffending with 100% accuracy or have an AUC = 1.0, and (3) recent findings have found that no single instrument has superiority over any other in predicting reoffending (for a detailed discussion see Singh et al., 2011).
Results
Chi-square tests were used to determine the degree to which the weighted need items were related to recidivism for each racial/ethnic group. As indicated in Table 2, 5 of the 9 needs items (home/community adjustment, χ2(1) = 5.80, p < .05; community service, χ2(1) = 4.46, p < .05; gang association, χ2(1) = 22.09, p < .05; restitution, χ2(1) = 9.28, p < .05; and school performance χ2(1) = 5.06, p < .05) were significantly associated with recidivism for Hispanic probationers. Interestingly, none of the need items were associated with recidivism for African American probationers. With regard to the above-mentioned LAC-weighted need items, the percentage of youths with the presence of risk (i.e., factors that increase the chance of new arrest such as gang member) reoffended at a higher rate compared to those youths with the absence of risk (i.e., factors that decrease the chance of new arrest such as youths not affiliated with gangs).
The Relationship Between Needs Items and New Arrest (N = 565).
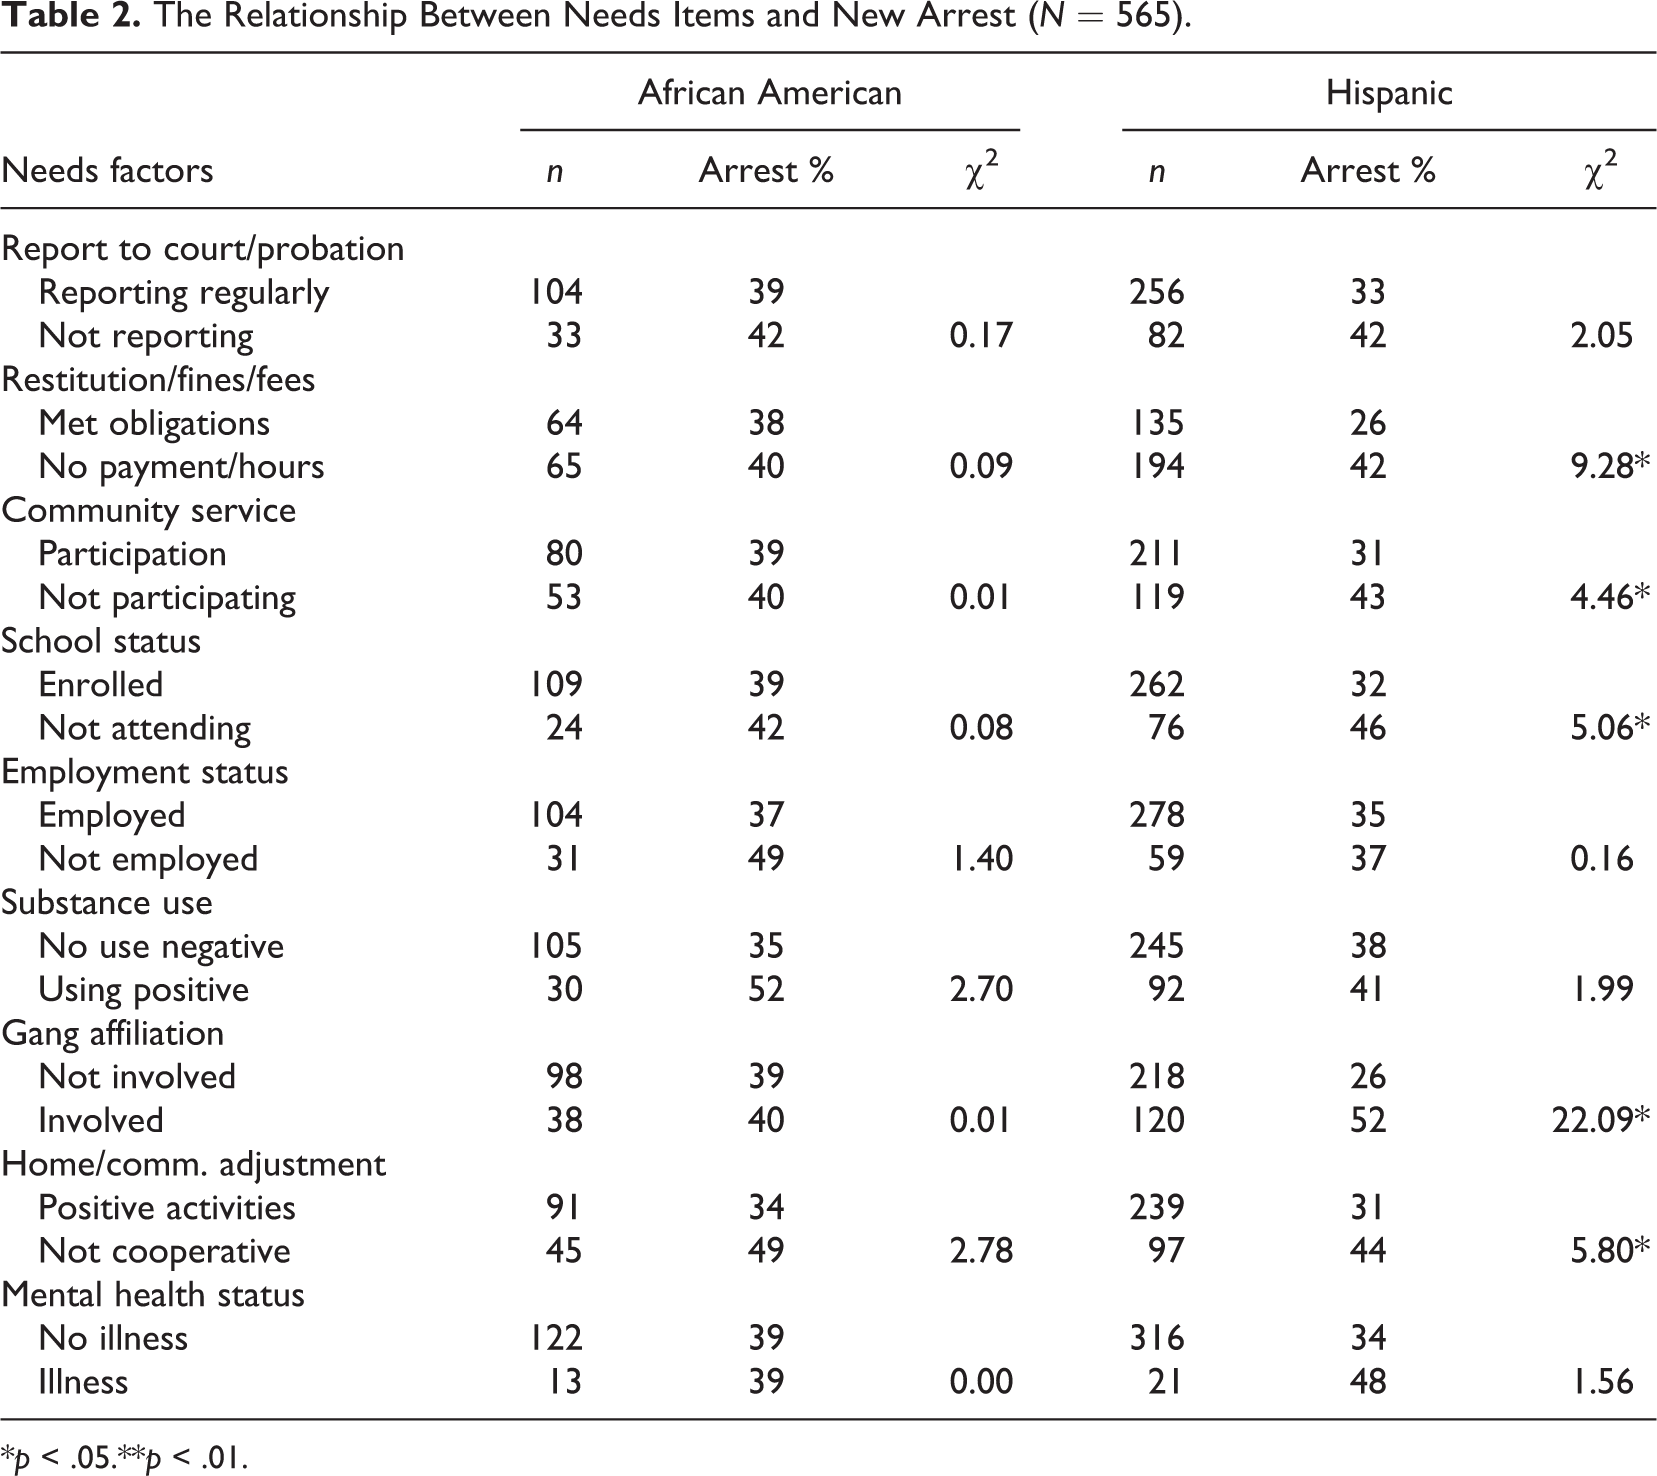
*p < .05.**p < .01.
Classification Errors
In order to practically assess classification errors among the predicted needs levels for each racial/ethnic group, two by two contingency tables were constructed at 7th, 15th, and 23rd cutoff scores. Table 3 presents the contingency table evaluating the predicted risk level with new arrest for the seventh cutoff score. The LAC predicted the correct outcomes (true positives and true negatives) for 57% African American probationers and 64% Hispanic probationers. Overclassification errors (i.e., unnecessary limitations on freedom and unwarranted rehabilitative services) were similar among African American and Hispanic probationers, 19% for each racial/ethnic group. Underclassification errors (i.e., missed treatment opportunity to otherwise needy children) for African American probationers were 24% and 17% for Hispanic probationers.
LAC Score—7 or More Predicted Risk and New Arrest.
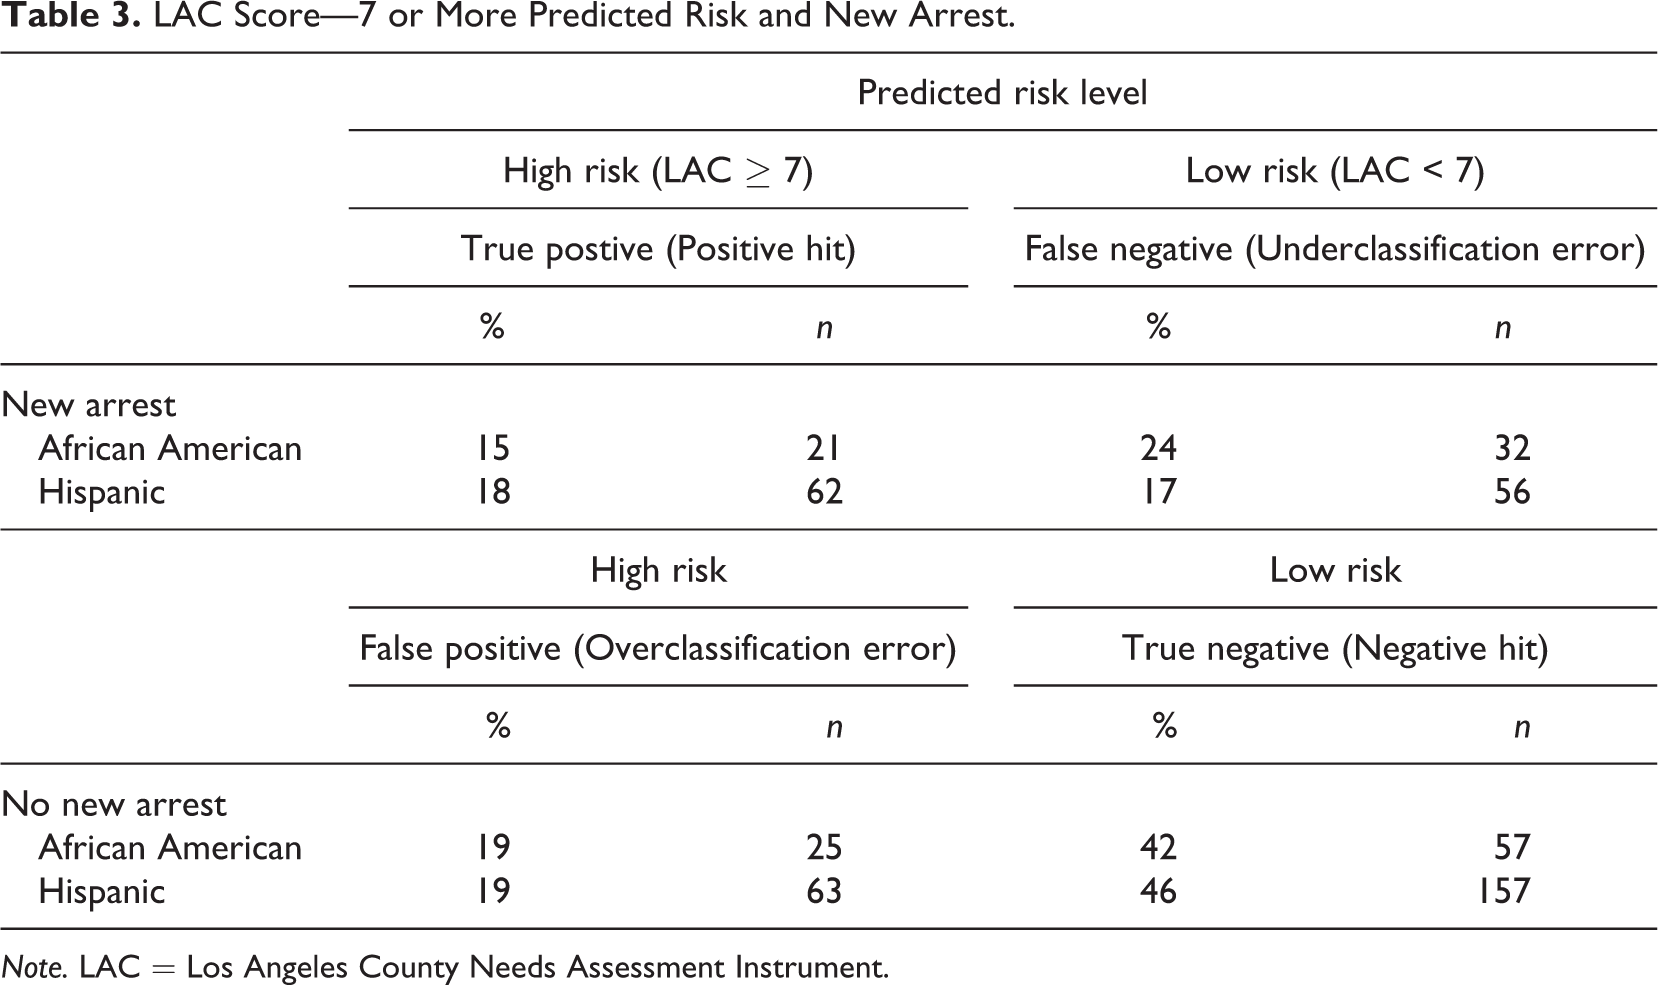
Note. LAC = Los Angeles County Needs Assessment Instrument.
Table 4 presents the contingency table evaluating the predicted risk level with new arrest for the 15th cutoff score. The LAC predicted the correct outcomes (true positives and true negatives) for 61% African American probationers and 62% Hispanic probationers. Overclassification errors were similar among African American and Hispanic probationers, 6% and 7%, respectively. Underclassification errors for African American probationers were 33% and for Hispanic probationers 31%.
LAC Score—15 or More Predicted Risk and New Arrest.

Note. LAC = Los Angeles County Needs Assessment Instrument.
Table 5 presents the contingency table evaluating the predicted risk level with new arrest for the 23rd cutoff score. The LAC predicted the correct outcomes (true positives and true negatives) for 61% African American probationers and 64% Hispanic probationers. Overclassification errors were similar among African American and Hispanic probationers, 3% and 4%, respectively. Underclassification errors for African American probationers were 36% and for Hispanic probationers 32%.
LAC Score—23 or More Predicted Risk and New Arrest.
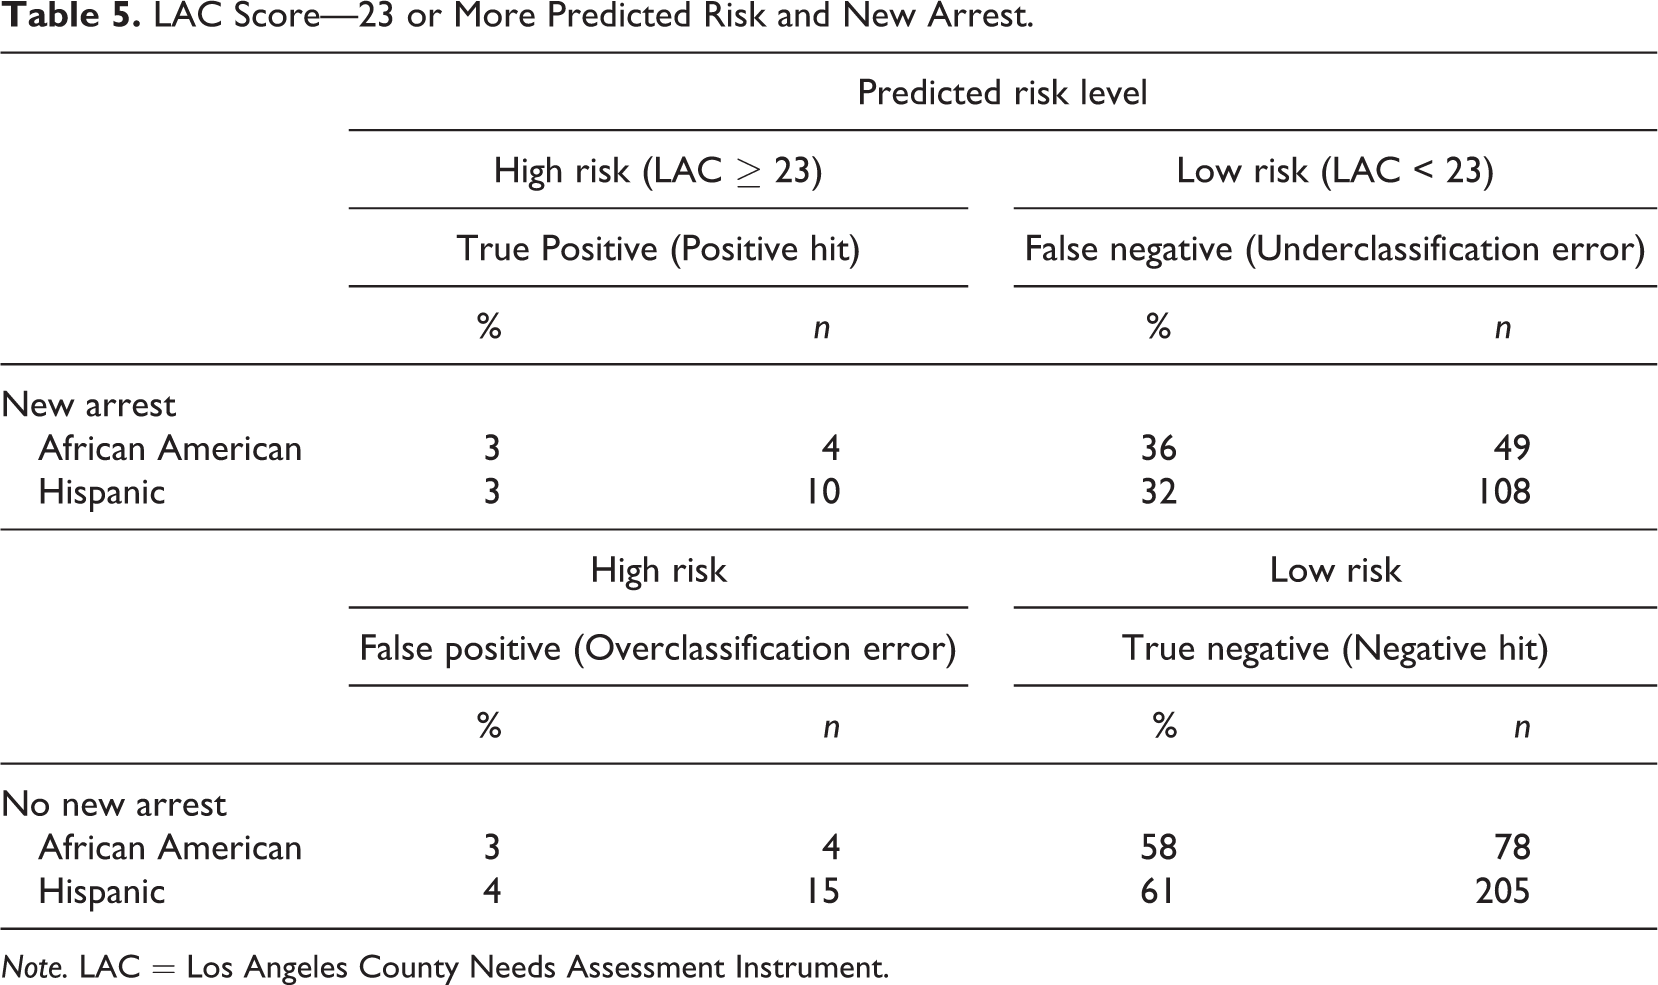
Note. LAC = Los Angeles County Needs Assessment Instrument.
Multivariate Analyses
Logistic regression models were run separately for African Americans, Hispanics, and the overall sample to assess whether the LAC needs items predicted new arrest (see Table 6). With regard to African American juvenile probationers, chi-square test demonstrated that the regression model for African American juvenile probationers was a good fit for the data (model χ2 = 29.27, p < .05). None of the nine LAC needs items or supervision levels contributed to the prediction of new arrest. Consistent with the extant literature, age (control variable) was the only predictor significantly associated with new arrest (SE = .164, p < .001). The younger the African American probationer, the more likely they were to be rearrested; for every 1 year increase in age, their odds of rearrest decreased by 48% (b = −.66, Exp (B) = .51). Overall, the logistic regression model explained 29% of the variance in new arrest for African Americans and correctly classified 71% of the cases.
Logistic Regression Models Assessing the Relationship Between LAC Need Items, Supervision Levels, Age, and New Arrest.

*p < .05. **p < .01. ***p < .001.
Area Under the Curve.

Note. AUC = area under the curve; SE = standard error, CI = confidence interval.
*p < .001.
The second model in Table 6 presents the logistic regression output for Hispanic juvenile probationers. Chi-square test demonstrated that the regression model for Hispanic probationers was a good fit with the data (model χ2 = 111.42, p < .05). Gang affiliation (SE = .334, p < .001), age (SE = .113, p < .001), minimum supervision (SE = 1.141, p < .01), and standard supervision (SE = 1.11, p < .05) levels emerged as significant predictors of new arrest. Similar to young African American probationers, the younger Hispanic probationers were more likely to be rearrested; as Hispanic probationers’ age increased by 1 year, their odds of rearrest decreased by 56% (β = −.83, Exp (B) = .43). Those Hispanic probationers who were affiliated with gangs were 4 times more likely to have a new arrest while on probation than Hispanics not affiliated with gangs (β = 1.49, Exp (B) = 4.47). Hispanic probationers on minimum and standard supervision levels were more likely to be rearrested than Hispanic probationers on maximum supervision (β = 3.13, Exp (B) = 23.04 and b = 2.49, Exp (B) = 12.14, respectfully). This finding is consistent with Tables 3 through 5, which show a trend that the LAC underclassifies Hispanic juvenile probationers. Overall, the model explained 43% of the variance in new arrest for Hispanics and correctly classified 77% of the cases.
As indicated in Table 6, the third model presents the logistic regression analysis for the total sample (i.e., African American and Hispanic probationers), which will allow for the examination each racial/ethnic group’s influence on the LAC’s predictability. Chi-square tests demonstrated that the regression model was a good fit for the total sample (model χ2 = 122.921, p < .05). Age (SE = .088, p < .001) and gang affiliation (SE = .263, p < .001) were significant predictors of new arrest. Probationers were more likely to be rearrested; as age increased by 1 year, their odds of a new arrest decreased by 52% (b = −.73, Exp (B) = .48). For the total sample, the logistic regression model explained 34% of the variance in new arrest and correctly classified 72% of the cases. In brief, the LAC is more accurate at predicting rearrest for Hispanics than African American juvenile probationers.
Receiver–Operating Characteristic
The use of AUC has become common practice in offender assessment, because it addresses the criticism of bivariate correlations and their assumption of an evenly distributed outcome measure in its determination of instrument predictability. The use of AUC also allows the comparison between multiple predictive validity studies. Ranging from .00 to 1.0, AUCs of .50 indicate that the instrument is emblematical of chance predictions, and the closer the AUC is to 1.0, the more accurate the instrument. Consequently, we use the receiver–operating characteristic’s AUC analyses to examine the accuracy of the LAC’s predictability.
As noted in the literature review, the average AUC value for juvenile risk assessment instruments was .64 (Schwalbe, 2007). Our findings indicated that the instrument was not predictive of the total sample (AUC = .63, SE = .03, 95% CI = [.58, .69], p.> .05). The LAC demonstrated an AUC for the Hispanic probationers of .66 (SE = .03, 95% CI = [.59, .71], p. < .001), indicating that the instrument predicted the correct classification 16% better than chance. However, the predictive accuracy of the LAC was nonsignificant for African American probationers (AUC = .58, SE = .04, 95% CI = [.48, .67], p > .05). Therefore, the Hispanic AUC value is consistent with the extant literature. It should also be noted that these findings would lend one to assume that the LAC is not a valid predictor of African American juvenile probationers, the impact of which we will discuss in the subsequent section.
Discussion
A common practice in differential prediction research is the use of regression analysis. Unfortunately, regressing instrument risk/need items on outcome measures (e.g., rearrest and reconviction) does not allow for an examination of predictive error. To date, there have been no empirical examinations of the LAC’s classification errors, and very few (Fass, Heilbrun, Dematteo, & Fretz, 2008; Whiteacre, 2006) in offender assessments, in general. Research has warned that the inclusion of White probationers biases the predictability of a risk assessment instrument, consequently increasing disproportionality in predictive estimates for minority group members. As a result, this study addressed the aforementioned limitations, in that we examined (1) a juvenile needs assessment, without the undue influence of the majority of racial group on an instrument’s predictability and (2) predictive error, an issue rarely examined in offender behavioral assessment.
Our findings demonstrated that gang affiliation, the only needs item out of the instrument’s nine, and the control variables age and supervision level were significantly related to new arrest for Hispanic probationers. On the contrary, none of the nine needs items were predictive of new arrest for African American juvenile probationers. When examining the predictability of the LAC for the total sample, it was determined that the Hispanic probationers improved the overall predictive accuracy of the instrument. As a result, it is recommended that future research seeks to determine the underlying factors that lead to differential racial/ethnic predictive validity, particularly given that predictive bias challenges the objective premise of assessment and the equality of law.
At the time of this publication, there have been only two studies that explicitly examine racial/ethnic differences in classification errors (Fass et al., 2008; Whiteacre, 2006). They both held that minorities were more likely to have classification errors than White offenders. Interjecting on this discussion of differential prediction, our findings indicate that there were no significant racial/ethnic differences in the classification errors for African American and Hispanic juvenile probationers, even after we controlled for their level of need. In other words, our results demonstrate that the LAC is equally reliable in accurately classifying African American and Hispanic juvenile probationers, despite the individual need item’s racial/ethnic predictive differences.
We found the LAC to be a better predictor of rearrest for Hispanics than African American juvenile probationers. Onifade, Davidson, and Campbell (2009) and Schwalbe, Fraser, Day, and Cooley (2006) have suggested that these offender differential prediction validations warrant more complex statistical techniques. In particular, they support the use of multilevel modeling over the traditional logistic regression, due to the former’s ability to decipher the impact of exogenous community-level variables (e.g., neighborhood disadvantage, vacant housing, public assistance, crime rates, and law enforcement surveillance) on the respective outcome measures. Coincidentally, these are also the same variables that have been found to be more common within African American communities, consequently, improving the instrument’s overall predictive equity.
Our findings provide support for the increased need of a multilevel understanding of offender behavior and its objective assessment. Given the multilevel complexity of delinquency, researchers must overcome three caveats associated with multilevel analysis that we would be remiss for not highlighting. First, when controlling for empirically supported individual-level predictors of re-arrest, there must a consideration of the potential for compositional effects that may explain community-level variations on the outcome measure. Whereby, the effects of community-level predictors can then be interpreted as contextual effects that are independent of individual-level effects (Hummelsheim, Hirtenlehner, Jackson, & Oberwitter, 2011). In effect, it must be determined whether the outcomes, across different neighborhoods, are the result of neighborhood characteristics (i.e., contextual effects) or whether individuals with certain characteristics tend to live in particular types of neighborhoods (i.e., compositional effects; Mujahid & Diez-Roux, 2010). Second, the impact of spatial dependence and spatial heterogeneity on differential prediction must be understood. Ignored spatial effects have the potential to bias coefficients, inflate R 2 values, and produce Type I errors in risk needs assessment research (Anselin, 1992).
Finally, a shift in focus from individual-level predictors to community-level analysis, in predictive validity studies ushers in a new practical challenge for researchers. Despite the advances of multilevel analysis and its ability to allow researchers to decipher between individual and environmental factors, obtaining data at the community level can become tedious, at best. So much so that Hall, Ventura, Lee, and Lambert (2003) and Phillips, Hagan, and Rodriguez (2006) hypothesized that this lack of community-level research results from the difficulty in obtaining access to data, subsequently limiting the ability of empirical examinations. Therefore, collecting multilevel data may be a daunting task and which potentially explains the lack of research focusing on differential prediction. Solutions to these issues would increase the likelihood of improving our ability to understand the relative dynamic of individuals nested within their community.
Limitations
With respect to this research’s advances, there are a few limitations that must be considered. Although many of the previous studies have used rearrest as the dependent variable, this measure is considered the least stringent of all measures of recidivism, as it is more likely to reflect a certain degree of disproportionate minority contact (DMC), consequently, inflating the rates of reoffending for racial/ethnic minority groups when compared to other measures of recidivism (Holsinger, Lowenkamp, & Latessa, 2006; Vincent, Chapman, & Cook, 2011). In our case, 71% of the sample was Hispanic. Given the large Hispanic population of Los Angeles County and the increased probability of this group’s arrest, it is not beyond possibility that their increased risk of arrest could potentially impact the results of our inquiry, subsequently biasing the results of the predictive instruments validity (Warren et al., 2012). It is very plausible to conclude that the predictability of the instrument may have been different had we used alternative criterion measures, such as conviction and/or state commitment. As a result, we suggest that future research examine the impact of DMC, self-reported criminal behavior, and/or recommitment, on an instrument’s predictive accuracy by considering alternative outcome measures such as procedural violations, rereferrals, readjudications, and reimprisonments.
A second limitation, which is also found in most differential predictive studies, is the unequal subsample sizes that have been found to increase the likelihood of differential racial/ethnic predictions (Tabachnick & Fidell, 2007). As a result, our findings cannot be generalized beyond the present sample, a cautionary warning for any instrument validation (Andrews & Bonta, 2010). Given the increasing nature of offender diversity, it cannot be assumed that predictive validity of the LAC will hold across other racial/ethnic groups (i.e., Asians, Chicanos, and Pacific Islanders) and jurisdictions (Folsom & Atkinson, 2007; Schwalbe et al., 2006). More work is necessary to determine the need assessment’s ability to equitably predict recidivism between and within various racial/ethnic groups.
Another noteworthy limitation, common among predictive validity examinations, is that we were unable to control for the intervening measures suggested by the instrument (Hosp, Hosp, & Dole, 2011). In other words, each predictive instrument recommends a certain level of supervision and treatment modalities, with the assumption that these recommendations are adhered to. The practical reality is that recommended services are dependent upon availability, efficacy, and offender participation. Therefore, predictive validity results may fall victim to the degree and extent to which the instrument recommendations are adhered to. As such, it is recommended that subsequent inquiry includes measures of rehabilitative program efficacy and longitudinal measures of offender motivation and opportunity for resiliency.
Finally, differential racial/ethnic predictions may also result from sociohistorical–cultural and sociopsychological experiences (Phinney, 1996). Cultural perspectives unique to minority members have been shown to impact their interpretation of the criminal justice experience. Consequently, it is to be expected that when regressing the assessment instruments items on the criterion measure, there will be racial/ethnic variability. This reality has been accepted as common knowledge in most fields of academic inquiry and practical application; interestingly, offender behavioral assessment is yet to accept this adage. To better understand the racial/ethnic predictive differences, researchers must consider an emic approach to understanding arrest among diverse groups of youths.
Implications
Despite the limitations of this study, there are practical recommendations for agencies responsible for the supervision and rehabilitation of juvenile probationers. First, it is imperative that probation departments periodically reassess youth to determine the impact of their applied interventions on reoffending (Andrews, Bonta, & Wormith, 2006; Baglivio, 2009) and adjust the intensity of service delivery, when warranted (Lowenkamp & Bechtel, 2007). In fact, research has shown that periodically revalidating needs assessment instruments significantly increases their predictability (Brown, Amand, & Zamble, 2009).
Second, our findings highlight the need to revalidate the LAC in an effort to minimize the racial/ethnic predictive disproportionalities. Our call for juvenile justice agencies to validate their needs assessment instruments is supported by the extant literature and its findings that the generic needs assessment instrument is less predictive of reoffending than the needs assessment instrument locally developed and validated (Miller & Lin, 2007). An instrument should only be considered valid when it is demonstrated that classification errors and R 2 statistics are proportionate for any of the legally protected groups. On the other hand, when validation is not undertaken by juvenile justice jurisdictions and the instruments are blindly adopted, substantial rates of classification error can occur disproportionately between racial/ethnic groups, consequences of which can lead to the loss of rehabilitative services and unnecessary limitations on freedom (DeMatteo, Marlowe, Festinger, & Arabia, 2009; Whiteacre, 2006). Adhering to these recommendations would decrease the likelihood of misclassification errors, increase predictive accuracy, and successful intervention strategies. More importantly, equitably predicting risk/needs for each racial/ethnic group provides for the protection of rights and adheres to the intent of needs assessment (i.e., objective classification and warranted service delivery).
Footnotes
Declaration of Conflicting Interests
The author(s) declared no potential conflicts of interest with respect to the research, authorship, and/or publication of this article.
Funding
The author(s) disclosed the receipt of the following financial support for the research, authorship, and/or publication of this article: This project was funded by the College of Criminal Justice's Research Fellowship for Doctoral Students at Sam Houston State University for the Summer 2008.