



Abstract
The goals of this study were to test the measurement invariance of the Structured Assessment of Violence Risk in Youth (SAVRY) across sex and to assess whether the same items on the SAVRY influenced practitioners’ judgments about the risk for boys and girls separately. Using administrative data from 292 adjudicated juvenile offenders placed in state custody, we found that the internal structure of risk was invariant across sex. We also found both similarities and differences in the factors used to make judgments about risk across boys and girls. Our results provide support for the use of the SAVRY for boys and girls and supplement previous research examining the predictive validity of the SAVRY, the structured professional judgment framework for juvenile justice risk assessment, and the utility of the SAVRY across gender groups.
The use of risk assessment instruments has become increasingly prevalent within the juvenile justice system. Based on Andrews, Bonta, and Hoge’s (1990) principle of risk-needs-responsivity (RNR), risk assessment assists juvenile justice practitioners in identifying which offenders need treatment (risk), what needs should be targeted (needs), and what treatment strategies should be employed (responsivity). The RNR principles are accomplished by measuring an offender’s level of risk or potential for future involvement in violent or nonviolent behavior (Vincent, Perrault, Guy, & Gershenson, 2012). This information is then used to assist agencies with legal decisions, develop case management plans, make treatment referrals, and allocate resources effectively. In general, research supports the use of risk assessment instruments within the juvenile justice system. Studies have shown that the implementation and utilization of risk assessment instruments have the potential to lead to reductions in disproportionate minority contact (Chapman, Desai, Falzer, & Borum, 2006), reductions in the use of intensive probation and out-of-home placements (Vincent, Guy, Gershenson, & McCabe, 2012), reductions in recidivism (Luong & Wormith, 2011), and increases in appropriate treatment referrals (Vincent et al., 2012).
To date, research on risk assessment in juvenile justice has focused primarily on two main areas, testing the predictive validity of risk assessment instrument and comparing different approaches to risk assessment. In particular, the predictive validity of juvenile justice focused risk assessment instruments has received a great deal of attention in the recent years (Hilterman, Nicholls, & van Nieuwenhuizen, 2013; Singh, Grann, & Fazel, 2011; Vincent, Perrault, et al., 2012). For example, Schwalbe’s (2007) meta-analysis that included 28 different risk assessment instruments and 42 effect sizes found an overall weighted area under the curve effect size of 0.64. Using 49 empirical studies, Olver, Stockdale, and Wormith (2009) also conducted a meta-analysis of the predictive validity of three juvenile justice-focused risk assessment instruments, the, Youth Level of Service/Case Management Instrument (actuarial-based instrument; Hoge & Andrews, 2002), Psychopathy Checklist: Youth Version (captures the severity of psychopathic traits; Forth, Kosson, & Hare, 2003), and the Structured Assessment of Violence Risk in Youth (SAVRY, based on structured professional judgment [SPJ]; Borum, Bartel, & Forth, 2006). Although the SAVRY showed the largest effect sizes for nonviolent and violent recidivism (r = .38 and .30, respectively), the accuracy of all three tools in predicting violent, nonviolent, and general recidivism (r ranged from .0.16 to .38) was supported. Furthermore, Schwalbe (2008a) compared the predictive validity of juvenile justice risk assessment instruments using 20 unique samples and found that the predictive validity, although moderate (r = .26), was similar for boys and girls.
Approaches to risk assessment include unstructured clinical judgment, actuarial assessment (i.e., predetermined formula), and SPJ (i.e., defined guidelines that help make judgments of risk). In regard to juvenile offending, the SPJ framework has been shown to outperform both unstructured clinical judgment and actuarial methods when estimating future behavior (Borum, Lodewikjs, Bartel, & Forth, 2010; Lodewijks, Doreleijers, & de Ruiter, 2008), especially when it is used to predict violence (Hoge, 2002). In addition, the SPJ approach incorporates both static and dynamic risk factors, whereas actuarial assessments apply the same empirical formula to every offender and tend to focus solely on static risk. Actuarial measures have also been criticized for not being able to capture the unique characteristics of each individual offender and, as a result, do not offer the same level of information to assist in case management and intervention planning (Borum, 2000; Litwack, 2001). As a result, the SPJ framework is considered to have great utility in addressing all aspects of the RNR framework within the juvenile justice system (Schwalbe, 2008b; Vincent, Chapman, & Cook, 2011).
Thus, the use of risk assessment instruments, especially the use of the SPJ framework, to predict future violent and nonviolent behavior has been supported across a number of individual and meta-analytic studies. However, a few important questions regarding the use of SPJ-based risk assessment instruments remain and, if addressed, could greatly enhance their utility for juvenile justice decision making. First, the structure of these instruments across important groups of offenders, such as race or sex, has not received a great deal of attention. For example, a wealth of empirical research demonstrates key sex differences in the types of risk and protective factors related to offending (Broidy et al., 2003; Conrad, Tolou-Shams, Rizzo, Placella, & Brown, 2014; Cottle, Lee, & Heilbrun, 2001; Fagan, Van Horn, Hawkins, & Arthur, 2007; Minor, Wells, & Angel, 2008). For example, Funk (1999) examined risk factors among a sample of 1,030 youth placed on probation. She found significant sex differences in both the type and the level of risk factors. Girls had higher levels of family-related risk and boys had higher levels of peer-related risk. Using the North Carolina Assessment of Risk, Schwalbe, Fraser, Day, and Cooley (2006) found significant sex differences across the level and type of risk factors present among a sample of adjudicated juvenile offenders. Direct comparisons of items included on risk assessment instruments also suggest that the risk factors that predict recidivism differ for boys and girls (Baglivio & Jackowski, 2013; Funk, 1999). In addition, Odgers, Moretti, and Repucci (2005) highlight a number of important differences that carry the potential to lead to sex differences in the measurement of risk. These include a lower base rate of serious forms of violent and nonviolent behavior among female offenders, sex differences in the form and target of violent behavior, differences in developmental trajectories for boys and girls, and a lack of sex-specific studies measuring the psychometric properties of risk assessment instruments.
Taken together, these studies suggest that the ways in which “risk” to reoffend manifests itself may be different for boys and girls. However, these sex variations are often masked in analyses of full samples of adolescent offenders that tend to be predominantly male. Thus, it is unclear whether the internal structure of overall risk as measured by assessment instruments is representing risk similarly for boys and girls. Understanding variations in the psychometric properties of risk assessment instruments is critical to ensuring that risk assessment procedures are accurately assessing risk to reoffend for boys and girls and to make sex-appropriate legal, case management and intervention decisions. Therefore, the first goal of this study was to examine whether the structure of a widely used SPJ measure of risk, the SAVRY, varies across sex. Specifically, we tested whether the structure of the four domains included on the SAVRY (i.e., protective factors, historical factors, individual factors, social/contextual factors; see Appendix) were invariant across sex among a sample of adjudicated adolescent offenders.
A second critical issue for advancing our understanding and use of risk assessment in the juvenile justice system is to examine how information about risk and protective factors is used to form judgments of risk for future offending. This is particularly important for assessments using the SPJ framework. Specifically, this framework relies on intensive training and clear guidelines for reliable scoring of individual risk indicators. The clinician then subjectively weighs the risk factors to make final judgments of risk for future behavior. However, the ways in which practitioners weigh item responses to make final judgments regarding future behavior are not well understood (Schwalbe, 2008b). Importantly, although the SPJ approach typically provides guidelines to assist these judgments, professionals are free to vary from these guidelines. Furthermore, some studies have found that (a) practitioners are reluctant to make final judgments of risk based on risk assessment scores (Giles & Millineux, 2000; Harris, Gingerich, & Whitaker, 2004), (b) additional factors such as practitioners’ confidence levels and perspectives on the usefulness of the instrument can significantly impact the accuracy of risk prediction (Douglas & Ogloff, 2003; McNiel, Sandberg, & Binder, 1998), and (c) practitioners do not always choose to use assessment tools as intended (Krysik & LeCroy, 2002; Lyle & Graham, 2000).
As noted previously, the importance of certain risk factors may vary across sex. Accordingly, the way that risk factors are used to make overall decisions of risk may also vary across sex, either based on knowledge of empirical evidence or based on other preconceptions about factors related to offending in boys and girls. For example, moderate levels of a particular risk factor, such as depression, may be considered a “high” risk factor for girls but not for boys (or vice versa) based on research that female juvenile offenders are more likely to display mental health problems compared to male juvenile offenders (Cauffman, 2004; Grande et al., 2012). Alternatively, girls’ behavior may be viewed as being more influenced by contextual characteristics (Cauffman, 2004), and, as a result, the overall risk scores may be more influenced by this type of risk factor for girls compared to boys.
In addition, most risk assessment instruments provide one overall risk score. For example, the summary risk rating (SRR) from the SAVRY was originally developed to assess risk for violent behavior. Although research indicates that adolescents who engage in violent behavior are also more likely to engage in nonviolent delinquent behavior (Farrington, 1998; Loeber & Farrington, 1998), the majority of nonviolent juvenile offenders do not engage in violence (Bartel, 2008). Research also suggests that the risk factors for violent and nonviolent offending may be somewhat different (Funk, 1999; Schwalbe et al., 2006). Therefore, these factors may influence the raters’ method for weighing individual items and making judgments about overall risk, especially if they are only considering one particular type of risk (i.e., violence) and the offender being assessed does not have a history of that type of behavior.
Accordingly, during a recent statewide implementation of the SAVRY, some users of the instrument expressed a need for two SRRs, namely a nonviolent SRR (nonviolent delinquency SRR) and a violence SRR (violence SRR). That is, there was a concern that factors related to probation and intervention outcomes are not always related to aggressive or violent behavior, especially for girls. Thus, a second SRR was developed specifically for this statewide implementation. This study therefore examines two SRRs focusing on risk for future nonviolent behavior and the standard violence SRR used in previous studies. The inclusion of the nonviolent delinquency SRR provides an additional contribution to our understanding of the SPJ framework of the SAVRY by assessing whether the factors used to make judgments about risk are different depending on the type of risk (violent and nonviolent) measured and across boys and girls.
In sum, to adequately understand the meaning of SAVRY risk scores, it is necessary to determine what contributes most to overall risk estimates and to determine whether this differs for boys and girls. Accordingly, the second goal of the current study was to examine whether the importance of certain risk factors in making judgments about risk differs across sex and, if they differ across sex, whether they align with empirical evidence of the sex-specific factors found to be associated with recidivism. Although the predictive validity of the SAVRY has been found to be similar across sex, this study tested whether this is due to the same risk factors influencing the overall risk score for boys and girls or whether raters weigh the factors differently across sex.
Method
Participants
As part of the larger statewide juvenile justice initiative beginning in 2009, all youth admitted to state custody were administered the SAVRY at the time of admission. This protocol was initiated as part of an effort to promote evidence-based assessment procedures for risk and needs assessment within the juvenile justice system. 1 Beginning in 2010, the SAVRY was administered by trained probation officers to all adjudicated adolescents under state custody. The SAVRY was conducted after the adjudicatory hearing and prior to the disposition hearing. All information collected from the SAVRY was then entered into the state agency’s administrative database to assist with case management, treatment referral, and overall monitoring of treatment effectiveness. The data for the current study were obtained from this database.
The sample consisted of 292 juvenile offenders referred to state custody from four counties in a southern state in 2010. The four counties were those participating in the juvenile justice reform initiative. Although not chosen at random, these four counties were selected to participate in the larger initiative because they provide a broad representation of the state in terms of geography, urban and rural residences, and structure of the juvenile justice system. To be placed in state custody, youth are either adjudicated delinquent or deemed to be in need of services as a result of one or more status offenses. Once adjudicated delinquent or identified as a status offender by the local juvenile court, youth are referred to the state agency and are placed on either probation, nonsecure residential treatment, or secure custody. Thus, the sample for this study encompasses both serious delinquent offenders sent to secure custody and youth placed on probation for minor delinquent or status offenses (i.e., running away, truancy, ungovernable behavior).
The sample includes 63 (22%) female offenders and 229 (78%) male offenders. Seventy-nine percent of the female subsample and 82% of the male subsample were non-White (mostly Black). The average age for both groups was approximately 15 (girls = 14.9 and boys = 15.3). Over half of the male subsample was adjudicated for a nonviolent offense, compared with two thirds of the female offenders. Six percent of the female offenders and 27% of the male offenders were placed in secure custody at the time of admission.
Measures
SAVRY
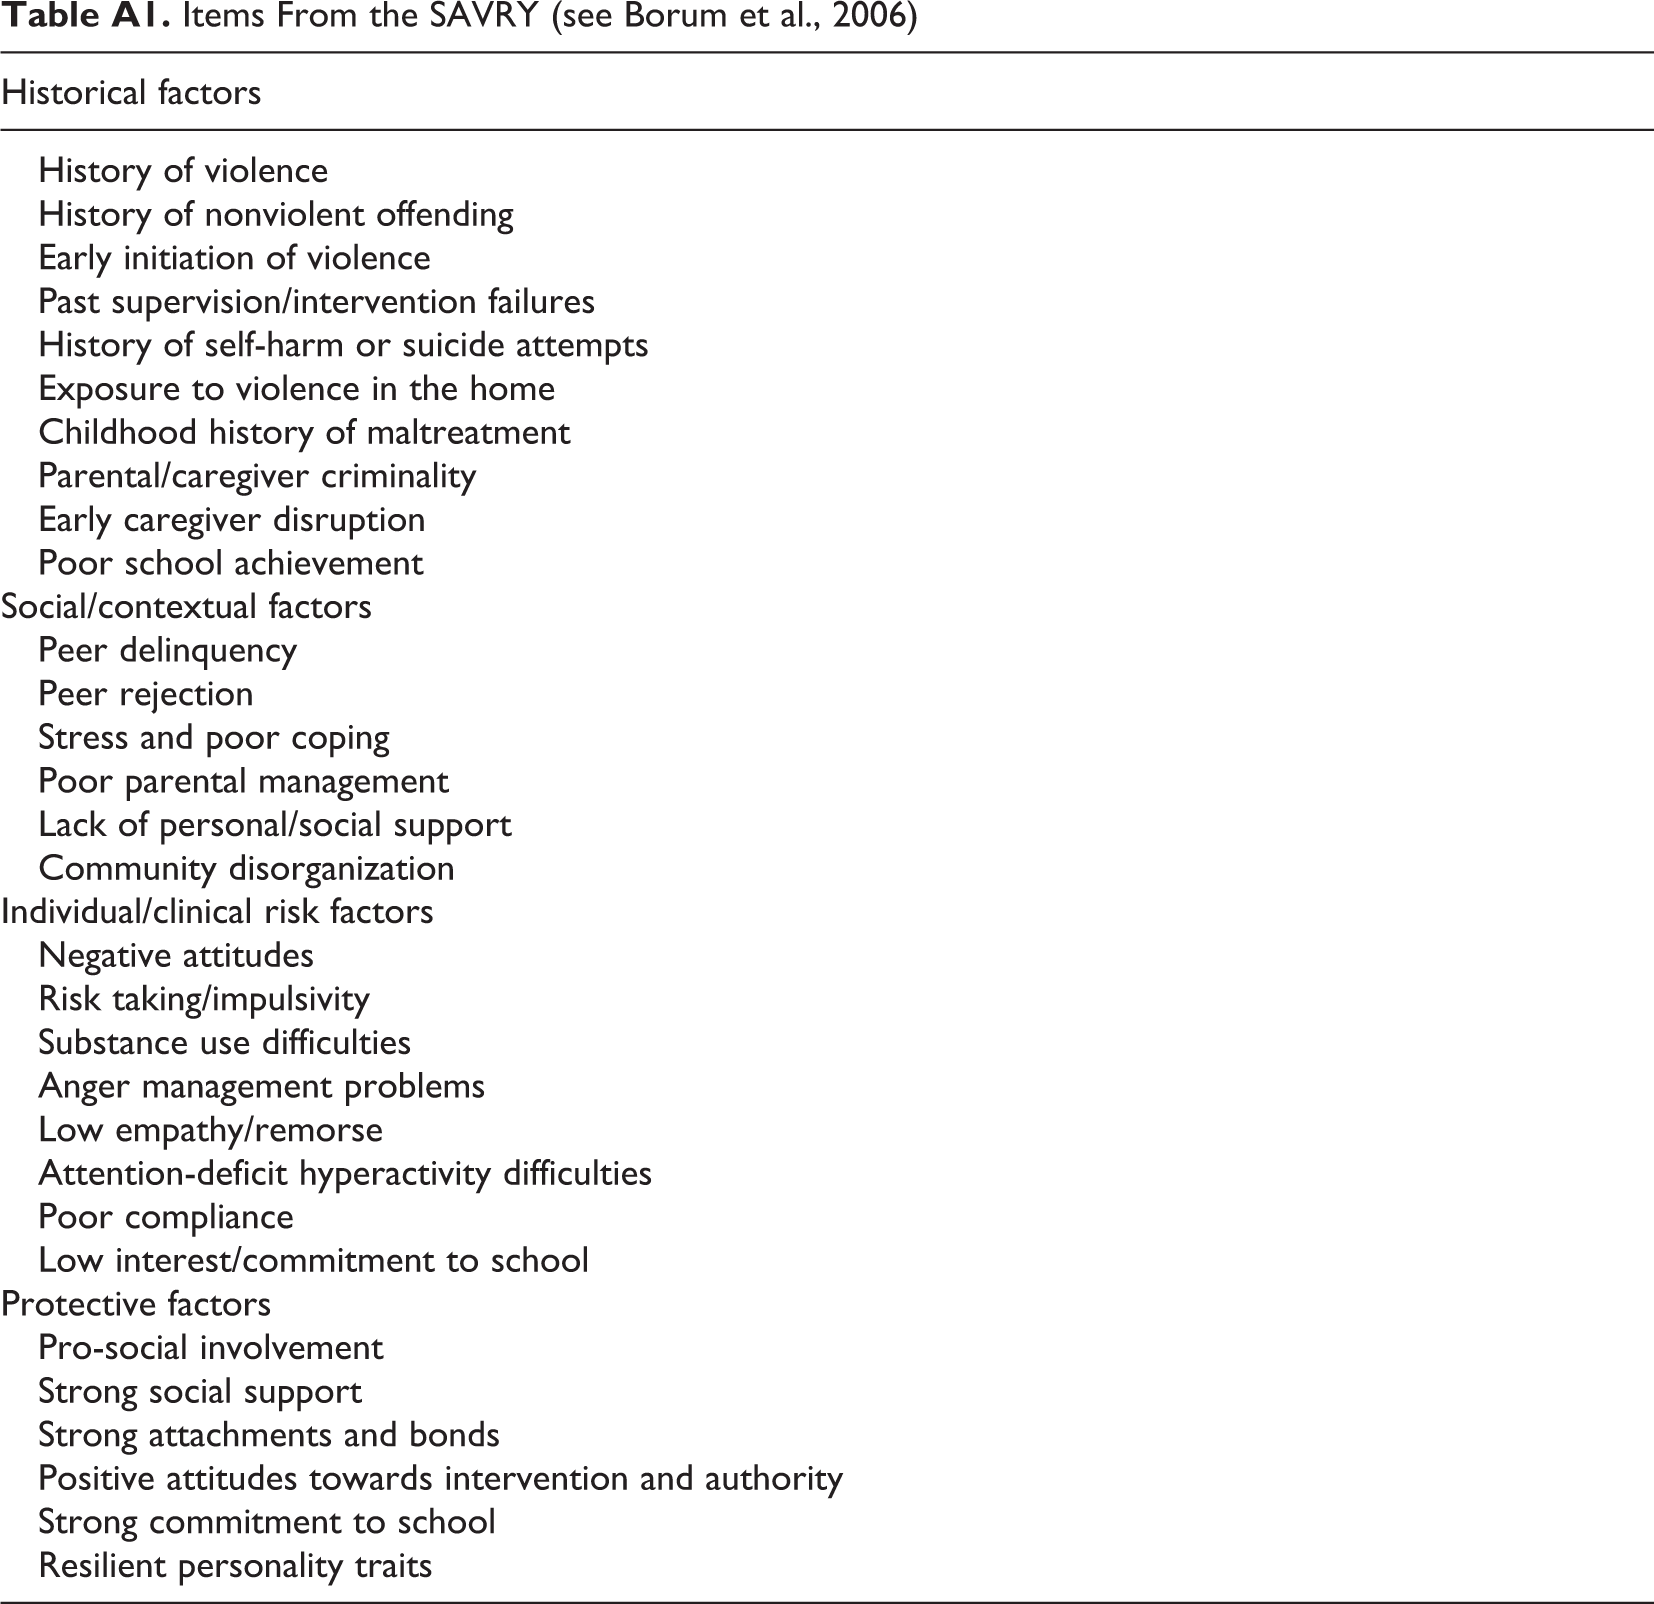
The SAVRY (Borum et al., 2006) was designed to assist juvenile justice practitioners in assessing the risk of future violence and to aid in case management and intervention planning. The SAVRY consists of 24 items measuring risk factors across three domains including historical, social/contextual, and individual risk factors and 6 additional items measuring protective factors (see Appendix). Responses to the items included in the three risk domains are rated as low, moderate, or high. Responses to the items included in the protective domain are coded present or absent. Items within each domain were summed to create four indices representing each of the SAVRY domains (see Appendix). The historical risk index included 10 items (possible range = 0–20) and ranged from 0 to 17, with a mean of 7.2 (SD = 3.5). The social/contextual risk index included 6 items. The range for this index was 0–11 (possible range = 0–12), with a mean of 4.9 (SD = 2.3). The individual risk index consisted of 8 items (possible range = 0–16) and ranged from 0 to 16 with a mean of 7.3 (SD = 3.6). Finally, the protective index included 6 items (possible range = 0–6) and ranged from 0 to 6 with a mean of 2.7 (SD = 1.8).
Structured professional judgments of risk for future violence (violence SRR) and nonviolent delinquency (nonviolent delinquency SRR) were determined by the SAVRY administrators and entered into the state agency’s database. Violence is defined by the SAVRY authors as “an act of battery or physical violence that is sufficiently severe to cause injury to another person or persons, regardless of whether injury actually occurs; any forcible act of sexual assault; or a threat made with a weapon” (Borum et al., 2006, p. 15). Nonviolent delinquency is defined as nonviolent criminal behavior which may include theft, breaking and entering, auto theft, mischief, vandalism, drug trafficking, or fraud (Bartel, 2008). Each SRR has the following three categories: low risk, moderate risk, and high risk. Of the girls included in the sample, 26% were rated low risk, 55% were rated moderate risk, and 19% were rated high risk for violence. Of the boys included in the study, 17% were rated low risk, 58% were rated moderate risk, and 25% were rated high risk for violence. In regard to nonviolent delinquency, 13% of girls and 11% of boys were rated low risk, while 19% of girls and 36% of boys were rated high risk. 2
The reliability of the SPJ framework of the SAVRY has been supported in both research and field settings (Catchpole & Gretchen, 2003; Lodewijks, de Ruiter, & Doreleijers, 2010; Vincent, Guy, Fusco, & Gershenson, 2012). For example, summarizing six studies examining the reliability of the SAVRY, Borum, Lodewikjs, Bartel, and Forth (2010) found that the intraclass correlations (ICCs) ranged from .72 to .95 for SRRs. The SAVRY has also been found to have strong predictive validity for general and violent recidivism across a variety of delinquent samples including youth on probation, held in short-term detention, placed in residential treatment, and referred for a mental health assessment (Borum et al., 2010; Penney, Lee, & Moretti, 2010; Singh et al., 2011; Vincent et al., 2011; Vincent, Perrault, et al., 2012; Welsh, Schmidt, McKinnon, Chattha, & Meyers, 2008).
Data Analyses
Multigroup confirmatory factor analysis (CFA), based on the four SAVRY domains, was used to examine the differences in the latent structure of risk across sex. In CFA, a model that reflects certain assumptions regarding the interrelatedness of the observed items is prespecified. The analysis then determines how well the model, reflecting the hypothesized factor structure, fits the data (Long, 1983). Since the SAVRY is expected to represent risk to reoffend, a priori assumptions about the unidimensional latent structure of risk guide these analyses. Multigroup CFA determines whether the internal structure of the latent factor differs in interpretable ways by testing the invariance of the associations among the observed items across the groups. Model invariance indicates that the relationship between the latent factor and the observed variables is equal across the groups (Widaman & Reise, 1997). The current study sought to examine whether there are sex differences in the latent structure of risk as measured by the four domains of the SAVRY (i.e., historical, individual, social/contextual, and protective).
A number of analytic steps were carried out to address the first research question: Whether or not the SAVRY risk domains showed a similar latent structure across boys and girls. The first step involved identifying a baseline model that fit the data adequately. The baseline model was a one-factor CFA using the full sample of adolescent offenders. Then, an unconstrained (i.e., free) model allowing the model parameters to be freely estimated for each group was performed. The next step involved testing measurement invariance. This step examined a constrained model where the parameter estimates (e.g., factor loadings, factor variances, and factor means) were fixed to be equal across the groups. Then, the modification indices based on the results of the constrained model are used to identify ways to improve model fit by identifying parameter estimates that should be allowed to vary across the groups (freed). Finally, a χ2 test of model difference tests the baseline model (i.e., unconstrained model) against the more restricted (i.e., invariant) model to determine which model is the best-fitting model. A nonsignificant χ2 indicates that a higher degree of invariance is appropriate (i.e., constraining the model does not worsen model fit). In summary, the following three multigroup CFA models were examined: (1) the unconstrained multigroup CFA, (2) fully constrained multigroup CFA, and based on the modification indices of the constrained model, and (3) a partially constrained model based on suggestions from the modification indices. All of the CFA models were estimated using Mplus Version 6.0 (Muthèn & Muthèn, 2010).
In addition to the χ2 difference test used to identify which of these models fit the data best, several fit indices were also considered to assess model fit. Root mean square error of approximation (RMSEA) values of .05 or less indicate a close model fit, and values between .05 and .08 indicate an adequate model fit (Browne & Cudek, 1993; Hu & Bentler, 1999). The comparative fit index (CFI) and the Tucker–Lewis Index (TLI) measure the covariation among the observed items (Tucker & Lewis, 1973). Both TLI and CFI range between 0 and 1. Values greater than .90 indicate an acceptable model fit (Browne & Cudek, 1993). Finally, the χ2 test of model fit indicates whether the specified model’s covariance structure is significantly different from the observed covariance matrix (Byrne, 2001). A nonsignificant p value is desirable. However, the usefulness of χ2 as a measure of model fit is questionable due to its sensitivity to sample size and the distribution of the items (Yu, 2002).
The second research question focused on whether or not the same risk domains influence the overall risk score for boys and girls or whether raters weigh the factors differently across sex. Due to the categorical nature of the SRRs, multinomial logistic regression was used to address this question. This method allowed us to conduct three separate comparisons for each SRR to identify which SAVRY domains distinguished between a score of low risk compared to moderate risk, low risk compared to high risk, and moderate risk compared to high risk. Offenders’ race and the most serious adjudicated offense type (i.e., violent or nonviolent offense) were included as control variables. 3 For all regression analyses, the relative risk ratios (RRRs), which provide a measure of the probability of falling into one group (e.g., low risk) compared to another group (e.g., moderate risk), are reported. All regression analyses were conducted in Stata 13.0 (Acock, 2012). 4
Results
Descriptive Analyses
Table 1 provides the mean scores across the four SAVRY domains for boys and girls. There were no sex differences in the mean level of any of the risk domains. Table 1 also provides the bivariate correlations among the four SAVRY indices, separately for boys and girls. All correlations were significant (p < .01). The correlations among the three risk domains (historical, individual, and social contextual) were positive, and each risk domain was negatively correlated with the protective domain. Thus, a strong association among the four SAVRY indices was observed for both boys and girls. R to Z transformations of the correlation coefficients (Cohen & Cohen, 1983) indicated that the only correlation that was significantly different across sex was the correlation between the individual and the social/contextual domain. This relationship was significantly stronger (p < .05) for boys (r = .62) than for girls (r = .38).
Sex Differences and Bivariate Associations Among the SAVRY Indices.
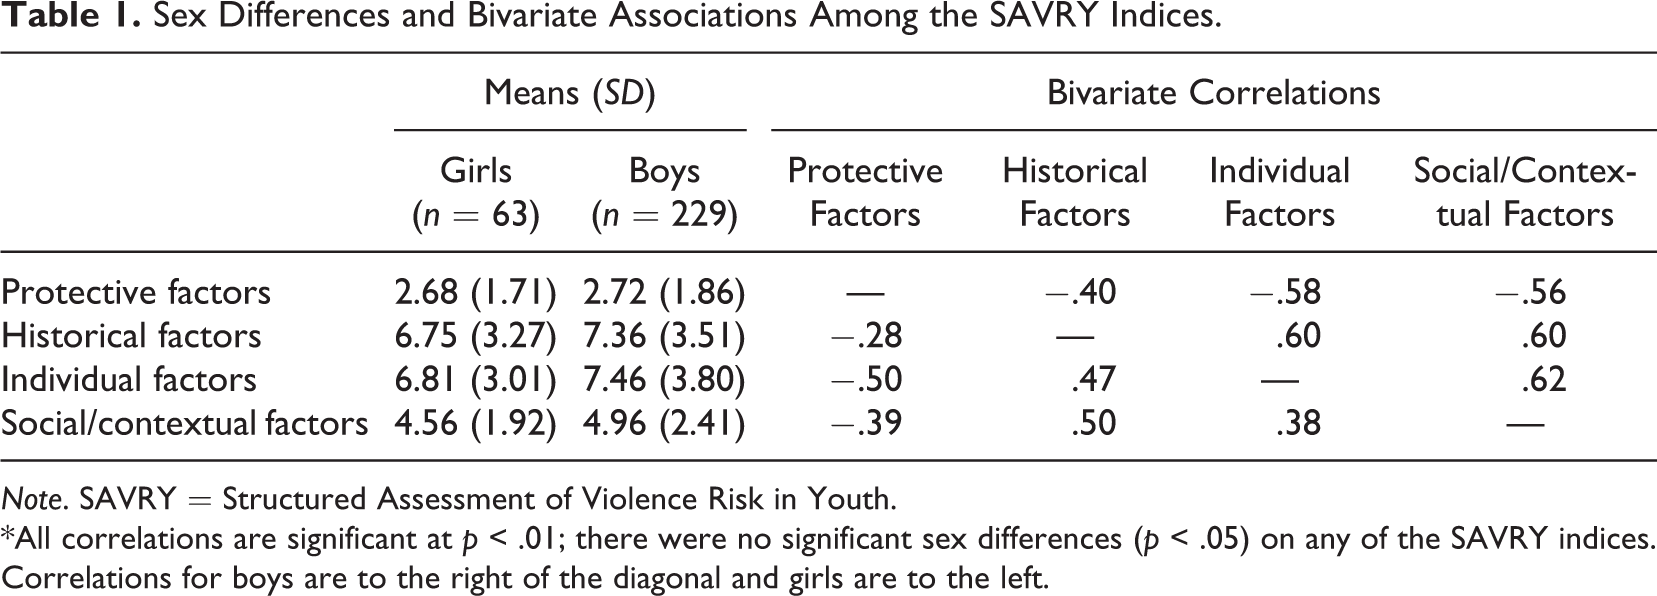
Note. SAVRY = Structured Assessment of Violence Risk in Youth.
*All correlations are significant at p < .01; there were no significant sex differences (p < .05) on any of the SAVRY indices. Correlations for boys are to the right of the diagonal and girls are to the left.
Examining Sex Differences in the Structure of Risk Domains
Our first research question focused on whether there were sex differences in the latent structure of the SAVRY risk domains. This was tested using a multigroup CFA that proceeded in several steps. First, a one-factor CFA was performed using the full sample. The model fit indices highlighted an acceptable fit of the model to the data, χ2(2) = 10.01, p = .01, RMSEA = 0.06, CFI = 0.98, TLI = 0.94. 5 Based on these results, it can be concluded that the four SAVRY indices formed a unidimensional latent factor representative of risk across the full sample of adjudicated adolescents.
The first multigroup CFA model that was estimated was an unconstrained model in which the factor loadings were free to vary across the groups, while the intercept and means were held at zero. Results of this model indicated a questionable fit of the model to the data. Although CFI and TLI were greater than 0.90 (CFI = 0.97, TLI = 0.97), the χ2 test of model fit was significant, χ2(8) = 17.51, p = .03, and RMSEA was high (RMSEA = 0.09, weighted root mean square residual = 0.95). The second multigroup model involved testing measurement invariance. In the constrained model, the factor loadings and intercepts were held equal across the groups. The results of this model revealed an acceptable fit of the model to the data. Although the χ2 test of model fit was significant, χ2(11) = 22.26, p = .02, CFI and TLI were greater than 0.90 (CFI = 0.97, TLI = 0.97) and RMSEA was acceptable (RMSEA = 0.07).
The modification indices for the constrained CFA suggested one important change to the model. It was suggested that, for males only, the historical index be allowed to co-vary with the protective index (model fit indices = 11.19). Substantively, this modification to the constrained model seems justified because, referring back to Table 1, the correlation among the historical and protective indices was somewhat stronger for boys than for girls. Therefore, one final model was examined. This model held the factor loadings and thresholds equal across the groups but allowed the historical risk index and the protective factor index to co-vary for boys only. Compared to the constrained model, the model fit indices showed a model that fits the data quite well, χ2(10) = 10.19, p = 0.42, RMSEA = 0.01, CFI = 1.00, TLI = 0.99.
To determine the best-fitting model, χ2 difference testing was used. Results suggested that, compared to the unconstrained model, constraining the model parameters to be equal across sex did not worsen the fit of the model to the data, χ2(3) = 4.85, p = .18. This is not surprising, given the questionable model fit indices of the unconstrained model. Next, a χ2 difference test was performed to compare the constrained model to the model allowing the historical and protective indices to co-vary for boys. Results of this test indicated that constraining the model worsened model fit, χ2(1) = 10.57, p < .01. This is also not surprising, given the improved model fit indices of the mostly constrained model. Therefore, the mostly constrained model was determined to be the best-fitting model. The parameters from this model are presented in Table 2.
Factor Loadings and Intercepts for the Final Multigroup CFA.
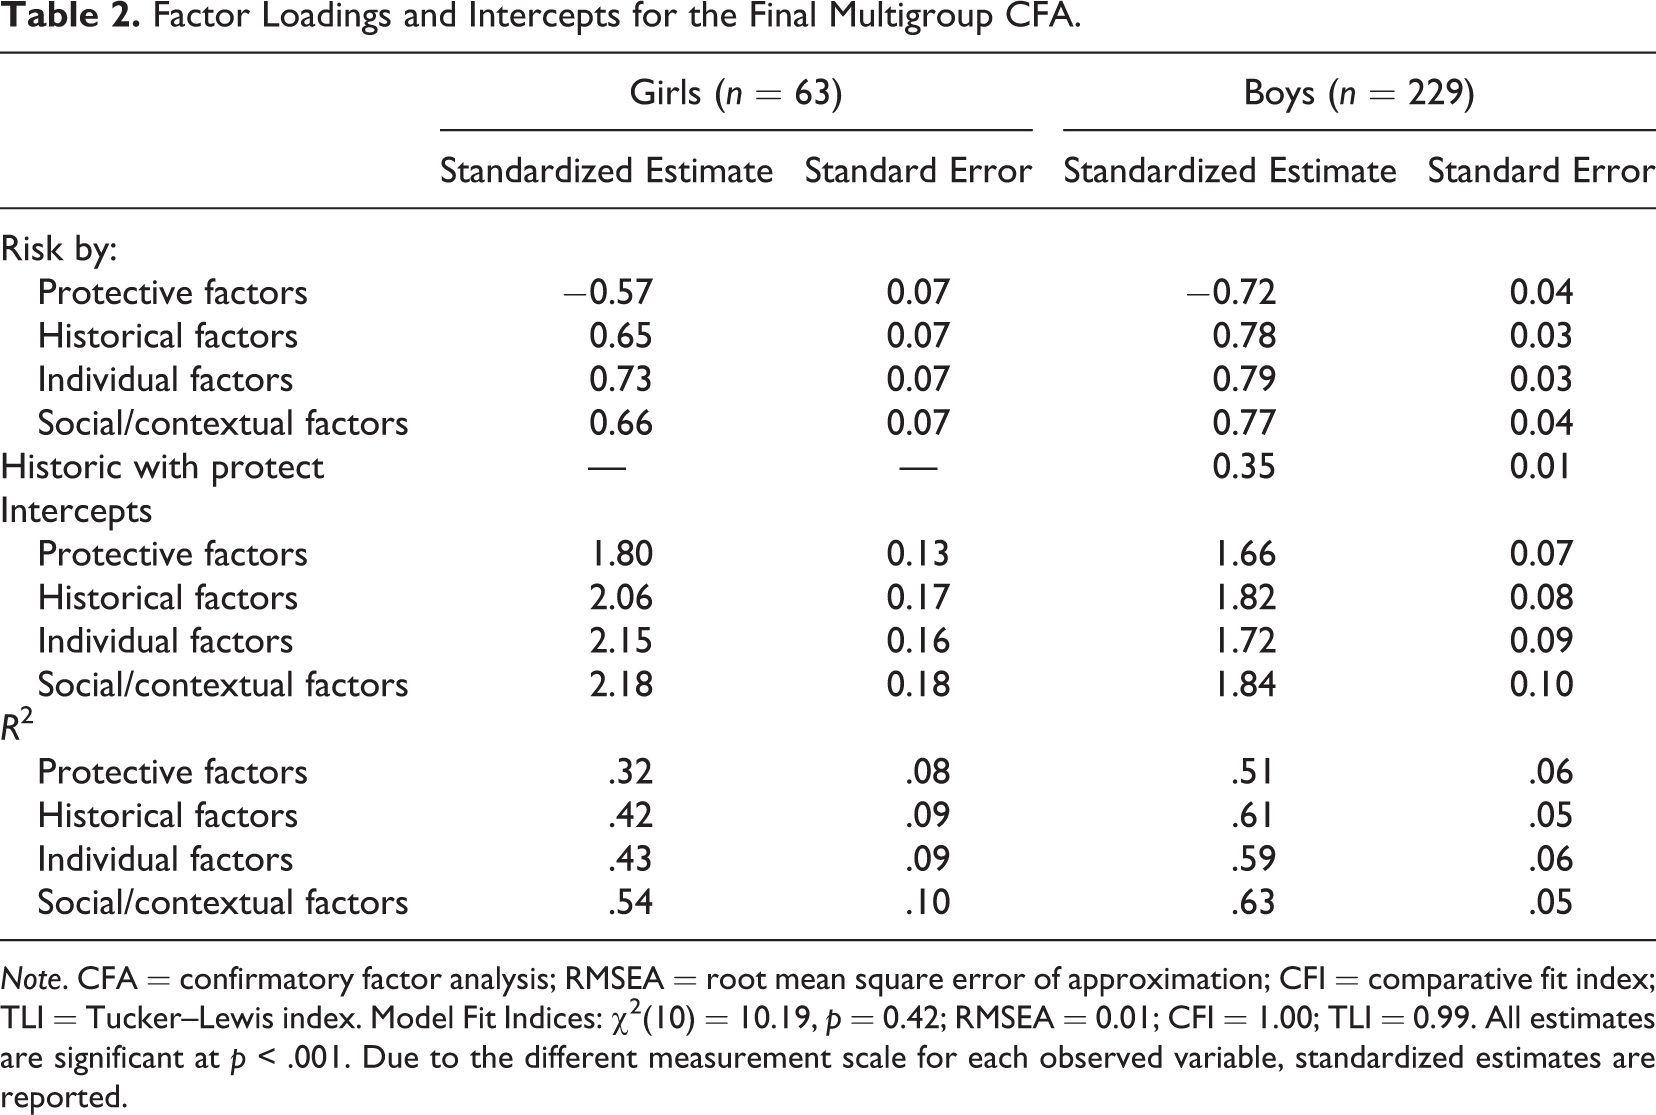
Note. CFA = confirmatory factor analysis; RMSEA = root mean square error of approximation; CFI = comparative fit index; TLI = Tucker–Lewis index. Model Fit Indices: χ2(10) = 10.19, p = 0.42; RMSEA = 0.01; CFI = 1.00; TLI = 0.99. All estimates are significant at p < .001. Due to the different measurement scale for each observed variable, standardized estimates are reported.
The standardized estimates for each group were significant (p < .001) and in the expected direction. The freed correlation among the historical risk and protective indices for boys was also positive and significant. For both groups, the social/contextual risk index was most strongly related to risk (accounted for the largest proportion of variance), and the protective index showed the weakest relationship with the latent factor. Overall, these results suggest that the internal structure (i.e., factor loadings, intercepts) of the latent risk factor as measured by the SAVRY was invariant across sex. However, these results also suggest that the relationship among the historical risk and the protective factor indices is important for boys but not for girls.
Examining Sex Differences in the Use of Risk Domains for Determining SRRs
Multinomial logistic regression was used to identify which domains were judged to be most important in making judgments about risk and whether there are sex differences in the importance of the four SAVRY domains when making judgments about risk. Results are presented in Table 3. Among the female subsample, only the individual risk domain was related to violence SRR. For example, an one-unit increase in the individual factor domain was related to 1.6 higher odds of being rated moderate risk and 3.3 higher odds of being rated high risk (compared to low risk) for violence. Among the male subsample, both the historical and the individual risk domains predicted violence SRR. In regard to risk for nonviolent delinquency, only the social/contextual risk domain predicted the risk level for the female group. An one-unit increase in the social/contextual domain was associated with 2.8 higher odds of being rated high risk compared to low risk and 2.1 higher odds of being rated high risk compared to moderate risk. For boys, the historical and individual risk domains distinguished between the three risk levels of nonviolent delinquency.
Multinomial Logistic Regression of SAVRY Indices and Summary Risk Ratings.
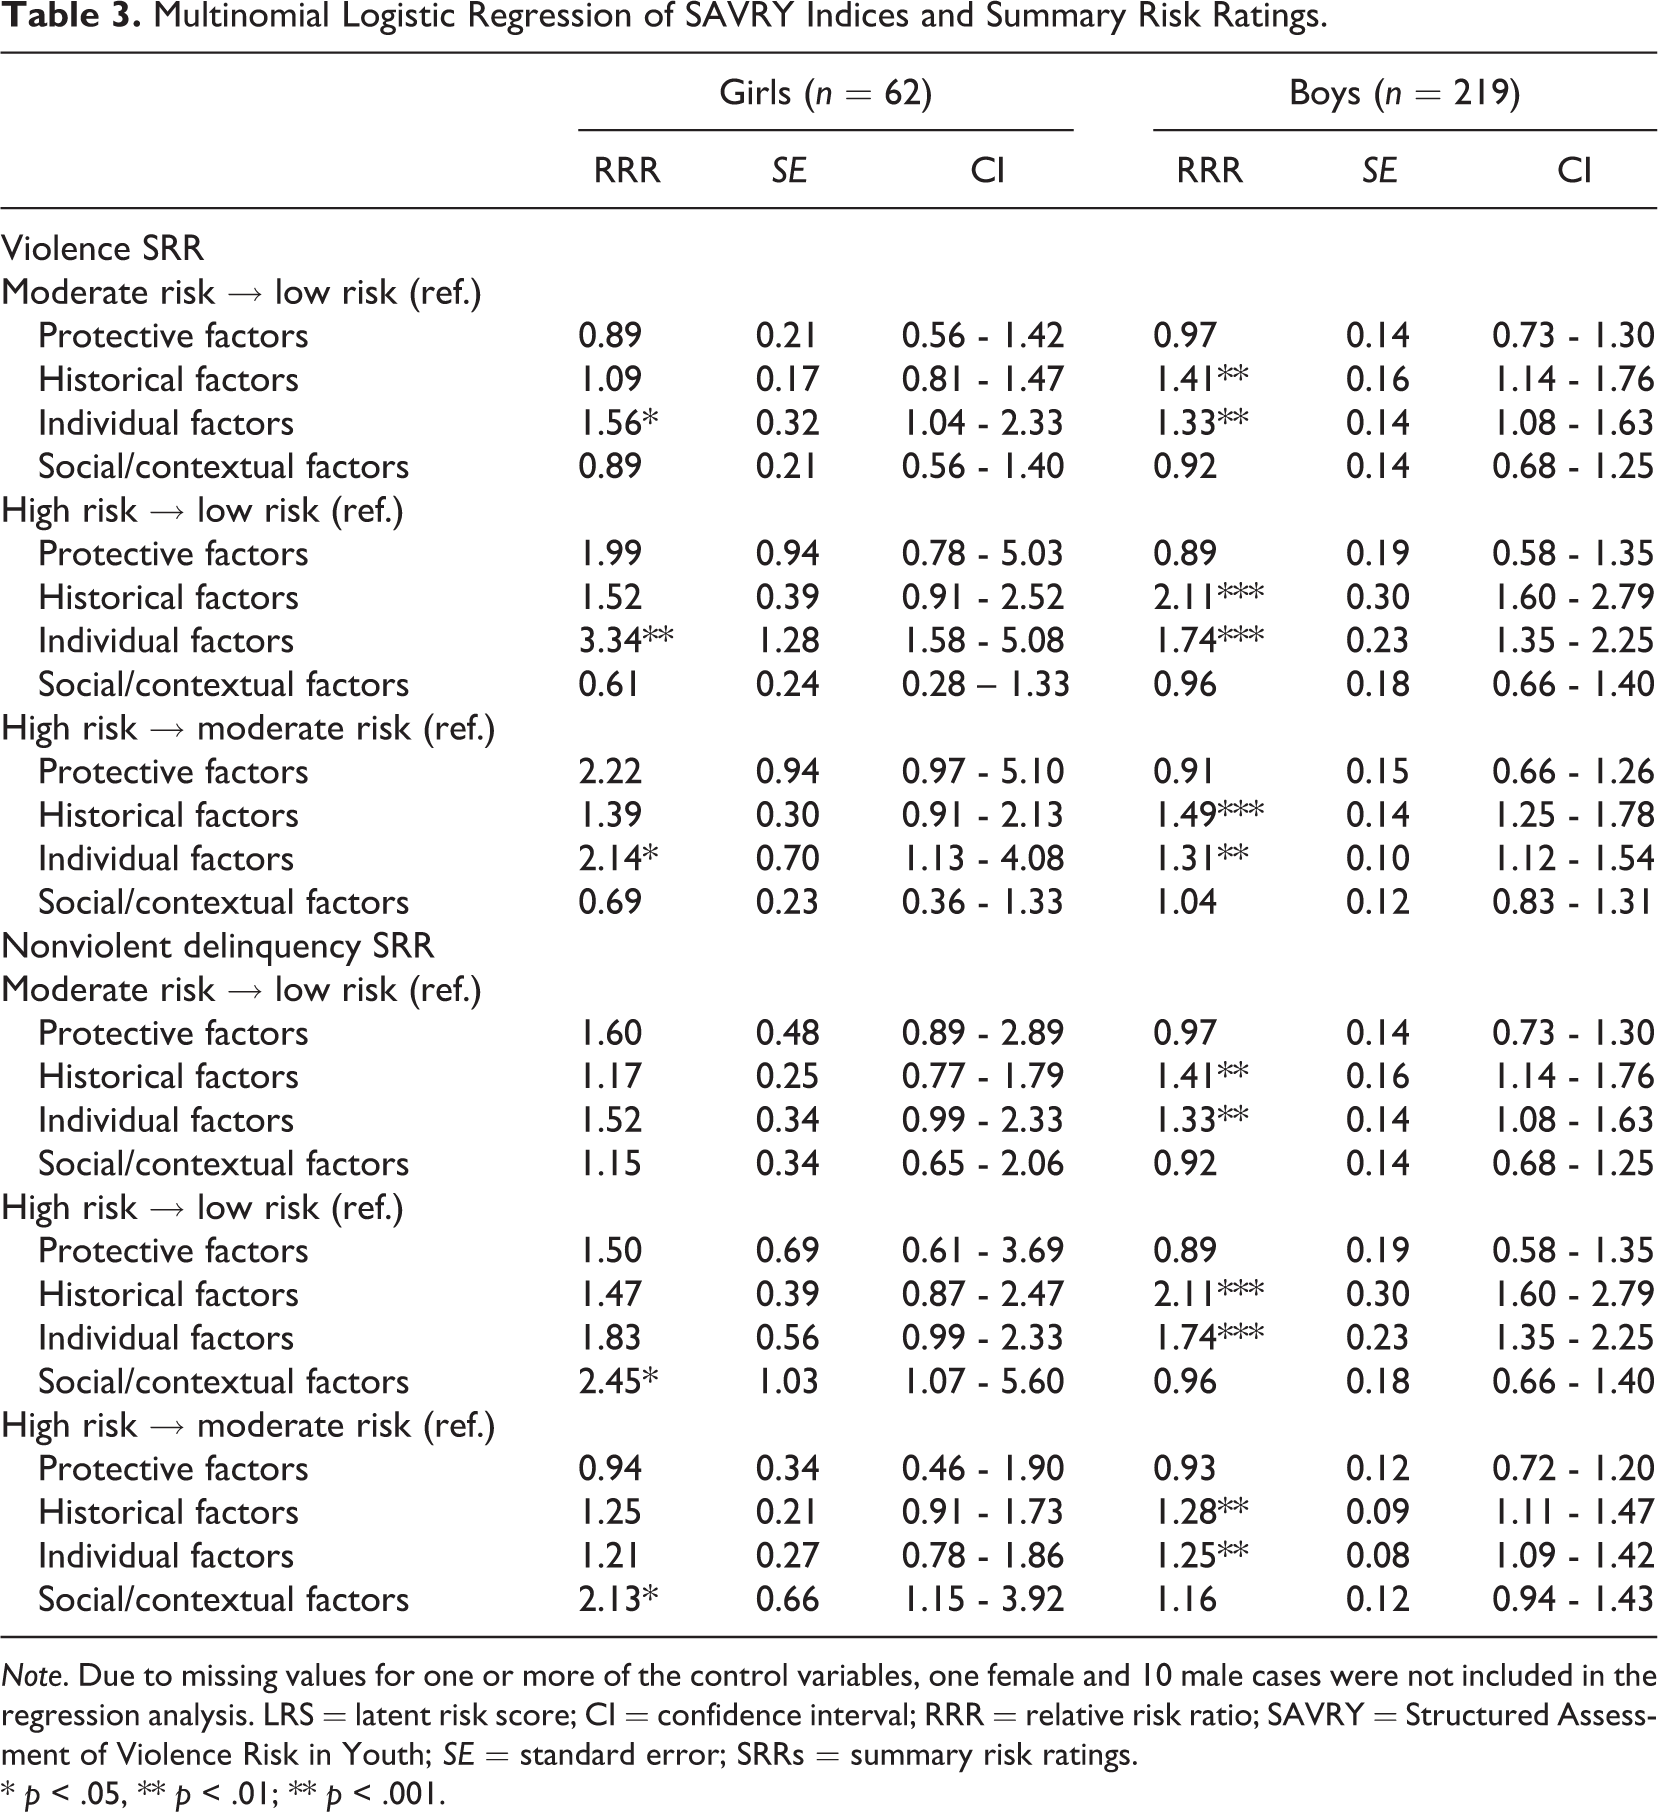
Note. Due to missing values for one or more of the control variables, one female and 10 male cases were not included in the regression analysis. LRS = latent risk score; CI = confidence interval; RRR = relative risk ratio; SAVRY = Structured Assessment of Violence Risk in Youth; SE = standard error; SRRs = summary risk ratings.
* p < .05, ** p < .01; ** p < .001.
Supplementary Analyses
The results of our main study questions suggested that the latent structure of the SAVRY risk indices were invariant across sex, but there were some sex differences in how risk domains were used to determine the SRRs. This led to an important follow-up question of how strongly associated the latent factor of risk (i.e., based on the pattern of intercorrelations among risk domains) was to the raters’ summary estimate of risk (i.e., based on their subjective weighing of risk factors). To address this question, the latent risk factor from the final multigroup CFA (i.e., factor scores) was saved and used as a predictor of SRRs (controlling for race and type of offense). 6 This was done separately for boys and girls, and the results are presented in Table 4.
Multinomial Logistic Regression of Latent Risk Score (LRS) Predicting SAVRY Summary Risk Rating (SSR) Across Sex.

Note. Due to missing values for one or more of the control variables, 1 female and 10 male cases were not included in the regression analysis. LRS = latent risk score; CI = confidence interval; SE = standard error.
*p < .05. **p < .01. ***p < .001.
The latent factor was significantly related to the violence SRR for both boys and girls. For example, among the girls, an one-unit increase in risk was associated with 1.9 higher odds of being rated moderate risk for violence compared to low risk for violence, 3.4 higher odds of being rated high risk compared to low risk, and 1.8 higher odds of being rated high risk compared to moderate risk. For boys, an one-unit increase in risk was related to 1.8 higher odds of being rated moderate risk compared to low risk, 4.1 higher odds of being rated high risk compared to low risk, and 2.3 higher odds of being rated high risk compared to moderate risk. For nonviolent delinquency, similar patterns emerged. The only nonsignificant RRR was distinguishing between low and moderate risk for nonviolent delinquency among the female subsample. In general, these findings suggest that an empirically derived measure of risk based on the four SAVRY domains is strongly associated with practitioners’ judgments about risk.
Discussion
This study sought to contribute to the emerging literature on risk assessment for juvenile offenders, especially assessments that use the SPJ approach. Specifically, the current study examined several research questions related to how decisions on level of risk are made and whether they differ for boys and girls. Our results suggested that, among adjudicated adolescent offenders, the average scores for each of the four risk domains (Table 1), the internal structure of the risk domains measured by the SAVRY (Table 2), and the relationship between statistical indices of risk (i.e., latent construct) and structured judgments (Table 4) did not vary across sex.
However, our findings did highlight some sex differences in the specific SAVRY domains that practitioners used in making their structured judgments of risk. A number of implications can be drawn from these results.
First, according to Lee (2013), comparisons of risk levels and the predictive validity of risk assessment measures across groups of adolescent offenders with different backgrounds (i.e., sex) should be withheld until the measurement invariance of risk is proven equivalent across groups. Thus, prior studies showing the predictive validity of the SAVRY across sex, without knowledge of measurement invariance, did not include all of the necessary information to support conclusions regarding across-group comparisons of predictive validity. The findings of our study provide preliminary evidence of measurement invariance across sex. That is, the internal structure of risk as measured by the SAVRY was found to be similar for boys and girls. These results, combined with research that has found strong predictive validity of the SAVRY across sex (Penney et al., 2010), support the utility of the SAVRY for both boys and girls.
Second, our results also provide further support for the SPJ framework of the SAVRY. We found that an empirically derived measure of risk (i.e., latent factor) was significantly associated with structured judgments about risk for future nonviolent and violent offending for boys and girls. These findings are consistent with previous studies comparing empirically derived measures of risk and summed total scores to structured judgments (Childs, Frick, Ryals, Lingonblad, & Villio, 2014; Hilterman et al., 2013; Penney et al., 2010). Taken together, these studies provide support for the construct validity of the SAVRY risk indices that are based on professional judgments. Given that the SAVRY specifically, and assessments based on the SPJ framework in general, also tends to better capture the unique characteristics of each individual offender to assist in case management and intervention planning compared to actuarial risk assessments (Borum, 2000; Litwack, 2001), such assessments are particularly useful for juvenile justice decision making.
Finally, our results did highlight a few differences in the factors used by raters to estimate risk across boys and girls. Among boys, the historical and individual domains significantly influenced judgments about risk for future nonviolent and violent behavior. These findings align with prior research on recidivism among male juvenile offenders (Baglivio & Jackowski, 2013; Funk, 1999; Gammelgård, Weizmann-Henelius, Koivisto, Eronen, & Kaltiala-Heino, 2012; Minor et al., 2008). For girls, the individual domain also significantly influenced judgments about the risk for future violence, whereas the social/contextual domain significantly influenced judgments about the risk for future nonviolent delinquency. These findings suggest that the SAVRY administrators involved in the current study held similar perceptions of the impact of individual risk factors on the risk for future violence across boys and girls. The same risk domains were also found to be important when making judgments of violent and nonviolent risk for boys, but practitioners seemed to have different perceptions of the factors that relate to nonviolent compared to violence risk among girls. On one hand, studies do suggest that social/environmental risk factors, such as family problems or peer delinquency, are more strongly associated with nonserious or nonviolent reoffending, while individual-level risk factors such as mental health and substance use problems are more strongly associated with violence (Grieger & Hosser, 2013; Mulder, Brand, Bullens, & van Marle, 2011). Thus, the factors related to perceptions of risk for girls, as well as the differences in the factors across type of risk, do align with these previous studies. On the other hand, historical factors such as history of abuse, early onset of offending, and previous criminal history are consistently found to be predictors of recidivism among female offenders (Funk, 1999; Minor et al., 2008; Schwalbe et al., 2006). Since this is the first study to explore the relationship between SAVRY domains and structured judgments of risk and to incorporate judgments of violent and nonviolent risk, additional research is needed before any conclusions regarding the factors that influence judgments about risk for girls can be made. Additional research is also needed to explore the utility of the second risk rating that focuses on risk for nonviolent delinquency across boys and girls. Future research should also expand on our findings by examining the impact of each individual SAVRY item on judgments of risk across sex.
An important shortcoming of this study is the absence of a measure of recidivism. Examining whether the SAVRY domains that were related to judgments of risk were actually related to recidivism, and whether this differed across sex, would have provided an even stronger test of the usefulness of the SPJ framework. This study involved a multisite sample that can be considered a benefit because it provided a larger sample that is representative of the different regions of the state. However, we did not have information on the parish that each youth resided in at the time of the offense. Therefore, this also introduces some heterogeneity across participants, depending on where they were arrested, because it is possible that practices among probation officers may differ across jurisdictions (e.g., making structured judgments). Furthermore, although the size of the female subsample met the guidelines for the analyses used (Hosmer & Lemeshow, 2004), it was relatively small. Therefore, it is important to replicate these findings in larger samples of girls. Also, our results provided some evidence that different factors may be used by raters when considering risk for nonviolent and violent behavior. However, given that this is the first study to use a separate nonviolence risk score, much more research is needed to determine whether these differences can be replicated. Further, the current study used regression analyses to test the relative importance of each risk domain for predicting the structured risk rating provided by probation officers. Although this method was most appropriate for the primary goals of this study, other methods that determine the relative accuracy of each domain in predicting summary risk judgments should be used in future studies.
Finally, although the training of raters focused on enhancing reliability, we did not have indices of reliability of the ratings of SAVRY items or the SRRs used in this study. Without this information, it could be argued that the results of this study suggest that the probation officers who administered the SAVRY perceived the risk for violent and nonviolent behavior to be similar across sex. That is, without knowing whether the probation officers’ perceptions were accurate and reliable, it is difficult to truly determine whether risk is accurately represented. However, this same training (i.e., same methods and trainers) conducted at local probation offices across the same state led to high levels of reliability. Specifically, 36 trained probation officers showed high interrater agreement with the trainers for the summary violence risk score (single measure ICC = .86) as well as for the individual (ICC = .86), historical (ICC = .81), protective (ICC = .83), and social/contextual (ICC = .67) risk domains (Vincent, Guy, Fusco, & Gershenson, 2012). Thus, the results of this study do provide some evidence of the effectiveness of the training that was completed by the probation officers that conducted the SAVRY ratings in the current study.
Within the context of these limitations, our results support the SPJ framework of the SAVRY for risk assessment of both boys and girls in the juvenile justice system. Although our findings identified a few sex differences in the importance given to the SAVRY domains when making judgments about risk, these differences were consistent with empirical evidence on differences in the risk factors related to recidivism for boys and somewhat consistent with the research focusing on girls. These findings suggest that the discretion provided by the SPJ framework allows raters, based on their professional judgment and empirically established criteria, to consider risk and protective factors that are uniquely related to boys and girls as well as different types of offending (i.e., violent and nonviolent delinquency). In other words, the SPJ framework allows the administrator to consider the “totality of the circumstances” including sex-specific risk and protective factors, which is the overall goal of the SPJ model. Taken together, the results of this study supplement previous research examining the validity of the SAVRY, the SPJ framework for juvenile justice risk assessment, and the utility of the SAVRY across sex groups.
Footnotes
Appendix
Items From the SAVRY (see Borum et al., 2006)
| Historical factors |
|---|
| History of violence |
| History of nonviolent offending |
| Early initiation of violence |
| Past supervision/intervention failures |
| History of self-harm or suicide attempts |
| Exposure to violence in the home |
| Childhood history of maltreatment |
| Parental/caregiver criminality |
| Early caregiver disruption |
| Poor school achievement |
| Social/contextual factors |
| Peer delinquency |
| Peer rejection |
| Stress and poor coping |
| Poor parental management |
| Lack of personal/social support |
| Community disorganization |
| Individual/clinical risk factors |
| Negative attitudes |
| Risk taking/impulsivity |
| Substance use difficulties |
| Anger management problems |
| Low empathy/remorse |
| Attention-deficit hyperactivity difficulties |
| Poor compliance |
| Low interest/commitment to school |
| Protective factors |
| Pro-social involvement |
| Strong social support |
| Strong attachments and bonds |
| Positive attitudes towards intervention and authority |
| Strong commitment to school |
| Resilient personality traits |
Acknowledgments
The authors are grateful for the grant support by John D. and Catherine T. MacArthur Foundation. We would also like to thank the Gina Vincent for her consultation during the data collection and analysis phase of this project.
Authors’ Note
However, the research results reported and the views expressed in the article do not necessarily imply any policy or research endorsement by our funding agency.
Declaration of Conflicting Interests
The author(s) declared no potential conflicts of interest with respect to the research, authorship, and/or publication of this article.
Funding
The author(s) disclosed receipt of the following financial support for the research, authorship, and/or publication of this article: Preparation of this manuscript was supported by Grant #11-98149-000-USP funded by the John D. and Catherine T. MacArthur Foundation.