



Abstract
The ability for professionals to override the results of an actuarial risk assessment tool is an essential part of effective correctional risk classification; however, little is known about how this important function affects the predictive validity of these tools. Using data from a statewide sample of juveniles from Ohio, this study examined the impact of professional adjustments on the predictive validity of a juvenile risk assessment instrument. This study found that the original and adjusted risk levels were significant predictors of recidivism, but the original risk levels were stronger predictors of recidivism than the adjusted risk levels that accounted for overrides.
Introduction
Actuarial risk assessments are an important component of evidence-based correctional practices (see Andrews, Bonta, & Hoge, 1990; Harris, Rice, Quinsey, & Cormier, 2015; Howell, 2009). The use of these tools has received a large amount of empirical support from researchers for their ability to predict juvenile recidivism (e.g., Olver, Stockdale, & Wormith, 2009; Schwalbe, 2007, 2008). These tools can also normalize the decision-making process across justice professionals by using a standard set of criteria on which to base decisions of risk. Without a standard set of criteria, professionals use undefined sets of criteria on which to base their decisions, which are typically described as highly subjective due to their reliance on personal biases and beliefs (Holsinger, Lurigio, & Latessa, 2001). Furthermore, clinical decision-making is less reliable because it does not have strong predictive validity in comparison with actuarial instruments (Ægisdóttir et al., 2006; Gottfredson & Moriarty, 2006; Hilterman, Nicholls, & van Nieuwenhuizen, 2014; Oleson, van Benschoten, Robinson, & Lowenkamp, 2011).
Despite a plethora of evidence, which illustrates that standardized risk assessments are superior to clinical assessments in several ways, many actuarial tools still allow the opportunity for professionals to disagree with the tool’s conclusion by overriding an assigned risk score or level. For example, if after completing the assessment the professional disagrees with an assigned risk level (e.g., low-risk), the assessor has the opportunity to use their professional judgment to adjust the risk level (e.g., moderate- or high-risk) to reflect their professional conclusions about the risk of the juvenile. This feature, typically referred to as professional discretion or override, is an essential part of the foundation for effective offender classification (Andrews et al., 1990). The ability to use overrides has become a standard feature on many juvenile risk assessments; however, the impact of these decisions on the predictive validity of actuarial tools has received only a small amount of attention from researchers.
Supporters of overrides claim that the inclusion of professional discretion and expertise can increase the accuracy of the tool by allowing for the inclusion of risk factors and information not considered by the assessment instrument (e.g., disposition of the youth during interactions with justice officials or history of parental abuse). In fact, it can be argued that the very existence of the override process is an obvious recognition that these instruments are not completely exhaustive in regard to the information collected about the subject. Recent commentators, however, have cautioned against the likelihood that clinical decisions designed to supplement an actuarial instrument would improve predictive accuracy (DeClue & Zavodny, 2014; Harris et al., 2015; Wormith, 2014). Utilizing a sample of male and female youth from Ohio who were assessed with the Ohio Youth Assessment System–Disposition Instrument (OYAS-DIS), the current study contributes to the existing body of research on professional discretion by exploring the impact of overrides on the predictive validity of the risk assessment tool.
Literature Review
The risk principle simply states that the level of correctional supervision and treatment should be commensurate with the risk level of the juvenile (Lowenkamp & Latessa, 2004; Lowenkamp, Latessa, & Holsinger, 2006). When risk is correctly identified, the juvenile justice system has a better chance of reducing recidivism (e.g., Vincent, Guy, Gershenson, & McCabe, 2012), but, when risk is incorrectly identified, there is a possibility for negative outcomes. For instance, if risk is overestimated, there is a potential for an “iatrogenic effect”—that is, there is a possibility that a juvenile would become more criminal than had he or she been handled at the correct, lower risk level (Gatti, Tremblay, & Vitaro, 2009; L. B. Lovins, Lowenkamp, Latessa, & Smith, 2007; Lowenkamp & Latessa, 2004). Conversely, if risk is underestimated, it could result in the juvenile having a greater amount of criminal opportunity, given the less restrictive controls that may be in place as the result of a false-negative risk assessment conclusion.
To help identify risk, justice officials should rely on assessments that can validly predict recidivism (Bonta, 2002). Fortunately, there are many tools available for use by practitioners that have been empirically supported by past research (see, e.g., Baglivio & Jackowski, 2013; Barnoski, 2004; Bechtel, Lowenkamp, & Latessa, 2007; Childs et al., 2013; Gretton, McBride, Hare, O’Shaughnessy, & Kumka, 2001; McGrath & Thompson, 2012; Onifade, Davidson, & Campbell, 2009; Schwalbe, 2009; Schwalbe, Fraser, Day, & Cooley, 2006). While these individual studies shed light on the effectiveness of these tools, the overall strength of the predictive validity of juvenile risk assessments is best illustrated by meta-analyses on the topic. Schwalbe (2007) reviewed 28 studies of juvenile risk assessments which were found to be, on average, moderately and significantly predictive of recidivism (r = .25). Schwalbe (2008) quickly followed that work with a meta-analysis focused on gender, in which he found that the effect sizes for risk assessments were similar for males (r = .26) and females (r = .27), highlighting both the validity and generalizability of these tools. In their meta-analysis, Olver, Stockdale, and Wormith (2009) reviewed the predictive strength of three popular juvenile risk assessments: the Youth Level of Service/Case Management Inventory (YLS/CMI), the Psychopathy Checklist: Youth Version (PCL:YV), and the Structured Assessment of Violence Risk in Youth (SAVRY). Consistent with Schwalbe’s analyses, they reported that these tools have similar prediction power (YLS/CMI:r = .32; PCL:YV: r = .28; and SAVRY: r = .32). Taken together, these meta-analyses establish that many juvenile risk assessment instruments being utilized in the juvenile justice system validly predict recidivism and do so with a moderate degree of accuracy.
Professional Discretion and Predictive Validity
Professional discretion is an often overlooked facet of risk assessment, although it was prominently proposed as the fourth of four major principles for the effective classification of offenders by Andrews et al. (1990). Despite this fact, only a handful of studies have explored override adjustments and their impact on actuarial risk tools. One of the first studies to examine the impact of professional discretion was Girard and Wormith’s (2004) review of the Level of Service Inventory–Ontario Revision. Based on their analysis, they reported that overrides did not have a negative effect on the predictive validity of the tool. They found that the adjusted risk levels performed slightly better than the initial risk levels. For instance, when predicting a new conviction, the correlation for the adjusted risk level was slightly higher than that for the original risk level (r = .38 and r = .37, respectively). However, it is important to note that the difference between the two measures of association is quite small and may be due, in part, to the fact that only 3% of the cases had adjusted risk levels.
Wormith, Hogg, and Guzzo (2012) completed a comprehensive review of professional discretion and the Level of Service/Case Management Inventory (LS/CMI), which was applied to a population of 1,905 sex offenders and 24,545 nonsexual offenders. Among the researchers’ observations was that overrides were used in 35.1% of the sex offender cases, compared to just 15.1% of the non–sex offender cases. They reported that the adjusted risk levels had an adverse impact on the predictive validity of the tool by weakening their overall associations with recidivism. When adjusted for overrides, the strength of prediction decreased and, in some cases, dropped to nonsignificant levels. Wormith and colleagues also observed that a majority of overrides happened in an upward direction, while downward overrides were rare. However, in contrast to their findings on upward override, they reported that overrides that were made in a downward manner (i.e., very high-risk risk to high-risk) appeared to slightly increase the validity of the tool when compared to similar individuals who did not have their risk level lowered.
Utilizing a sample of Aboriginal and non-Aboriginal offenders from Ontario, Canada, Wormith, Hogg, and Guzzo (2015) conducted another analysis on professional discretion and the predictive validity of the LS/CMI. They reported that the override function was used in approximately 17% of non-Aboriginal cases and about 9% of Aboriginal cases. Consistent with their previous study, the researchers found that the adjusted risk levels did not perform as well as the original risk levels. For non-Aboriginal offenders, the original risk levels predicted general offending better than final adjusted risk levels (rpb = .41 and rpb = .35, respectively). Similar results were observed for Aboriginal offenders (rpb = .36 and rpb = .34, respectively).
In an analysis of the YLS/CMI on juveniles in Scotland, Vaswani and Merone (2014) found that professional overrides had been used in 14% of the cases and that their use was at the detriment to the predictive validity of the tool. Specifically, the receiver–operating characteristic (ROC) value for the original YLS/CMI risk categories, [area under the curve (AUC) = .69] area under the curve (AUC) = .69, was higher than that for the adjusted risk levels (AUC = .61), indicating that the adjusted risk levels were less effective at predicting recidivism than the unadjusted levels. In another analysis of the YLS/CMI conducted by Carns and Martin (2011) on a sample of offenders from Alaska, the original risk score generated by the tool was significantly correlated with recidivism for male offenders; however, the adjusted risk levels that reflected the overrides were not found to be predictive of recidivism. The researchers suggested that the adjusted risk levels’ lack of prediction was due, in part, to a high percentage of overrides (approximately 28% of the sample).
Based on this small body of research, it can been inferred that, at best, professional discretion will have no adverse effect on the predictive validity of an assessment; however, in reality, the collective results lean more toward the conclusion that the predictive validity of the tool will be negatively compromised with the inclusion of overrides. This study contributes to this existing body of research on overrides by comparing the predictive validity of a juvenile risk assessment before and after the inclusion of overrides. Furthermore, unlike other studies that have reported only an aggregate rate of overrides in a sample, this study illustrates whether the override function is used similarly across different jurisdictions. Given the potential problems that arise when juveniles are given the wrong risk level (e.g., increasing the likelihood of recidivism), more research on the impact of professional overrides is needed.
The Current Study
The current study examines data from the OYAS-DIS. The OYAS-DIS is part of a larger system of risk assessment tools designed to assess youth along several points of the juvenile justice process (e.g., diversion, detention, disposition, residential, and reentry). The OYAS-DIS, specifically, is designed to help inform decision makers after adjudication in anticipation of the disposition phase. The assessment tool is designed to predict new arrests and contains 32 risk measures across 7 domains. Most of the individual measures are binary coded (except one measure of criminal history which ranges from 0 to 2), and overall scores can range from 0 to 33. Based on the scores, youth are categorized into one of the three risk groups: (1) low-risk, (2) moderate-risk, and (3) high-risk. B. Lovins and Latessa (2013) reported that the OYAS-DIS was found to have moderate predictive validity across three samples (construction sample: r = .34, validation sample: r = .26, and total sample: r = .30). Furthermore, rearrest by risk level was observed in the expected direction. Low-risk males, for example, were rearrested in 21% of the cases, while 41% of moderate-risk males and 60% of high-risk males were rearrested.
The current study was designed to investigate several issues surrounding the use of overrides. First, this study explored the prevalence at which overrides were used across 33 individual jurisdictions in Ohio. This adds to the existing research by exploring whether the rates at which overrides were used varied across different jurisdictions using the same tool. Previous research has either focused on one specific jurisdiction or simply reported an aggregate number of overrides across many jurisdictions. Due to this void in the literature, it remains unknown whether counties use the override function at different rates, which may be an important factor to consider when validating risk assessment instruments. Next, using a sample of juveniles, this study examined the impact of professional discretion on the predictive validity of the OYAS-DIS tool by comparing original risk levels created by the instrument to the adjusted levels derived from the overrides. This study extends upon the past body of research on professional discretion and actuarial tools in several ways. One contribution is the inclusion of multiple measures of recidivism including new arrests, technical violations, and a composite measure of both. This allows for the examination of whether overrides have an impact on different measures of recidivism, which may be important when estimating the negative consequences of improper overrides, such as the iatrogenic effect. For example, technical violation could have more of an iatrogenic effect than new arrest as a result of the youth receiving excessive correctional supervision due to the inappropriate risk level. Another strength of this study includes the use of a large, statewide sample of male and female juvenile offenders, which can increase the generalizability of the findings. For instance, by examining a general sample of offenders, this study can speak to whether overrides have an impact on recidivism among many different types of offenders (i.e., property, violent, and drug) and demographic characteristics (i.e., gender, age, and race).
A major contribution of the current study includes the utilization of multiple statistical analyses and procedures to examine these relationships. Similar to past research, this study employed traditional statistical methods of establishing predictive validity such as bivariate analyses (i.e., chi-square) and strength of association tests (i.e., point-biserial correlations and ROC analyses). However, in contrast, this study moved beyond prior research by also conducting more sophisticated statistical analyses. For instance, this study employed multivariate analyses such as binary logistic regression to examine the relationship with original and adjusted risk levels and recidivism controlling for individual- and offense-related characteristics. In addition, while overlooked in the past studies, this analysis conducted statistical tests to determine whether the estimates produced for the original and adjusted risk levels differed significantly from each other. The inclusion of more sophisticated analyses is an important next step in this line of research in order to estimate the extent of the impact that professional discretion has on the predictive validity of actuarial tools.
Methods
Data Collection
Data for this study were collected from three sources. First, in order to obtain data on risk assessments, juveniles were randomly sampled from the OYAS electronic database, which includes individual-level characteristics, including demographics and assessment scores, for all youth who have been administered an OYAS risk instrument. For this study, all youth who were administered a risk assessment between September 1, 2009, and June 30, 2011, in one of the 33 participating counties in Ohio were eligible for inclusion. In order to select the sample for this study, both population and simple random sampling methods were employed. Among the 33 counties where more than 100 youth were assessed with the OYAS-DIS instrument during assessment period, a random sample of 100 youth were selected for inclusion. For counties where less than 100 youth were eligible for inclusion, the entire population of juveniles were included in the sample. This sampling technique was selected in order to produce a final sample that was representative of youth from each of the 33 Ohio counties utilizing the OYAS-DIS instrument. To ensure sample representativeness and generalizability of the results, sampling weights that were based on the respondents’ probability of selection (i.e., the number of cases selected from a county/the number of eligible cases in the county) were calculated and employed in all statistical analyses.
Second, for each selected case, recidivism data were requested from each juvenile’s home county, including requests for information on rearrest and technical violations. This information was obtained via a confidential data collection instrument that was completed by local criminal justice practitioners (e.g., juvenile probation officers and juvenile court officials). Third, for youth who reached the age of majority (18 years old) within a year of their assessment date, recidivism data were obtained by cross-referencing the juvenile’s personal information (i.e., social security number and date of birth) within the Ohio Law Enforcement Gateway system. This sampling and data collection procedure resulted in a final weighted sample size of 11,008 juveniles (unweighted sample = 2,841).
Dependent Variables
Three dependent variables were used in this analysis. A 1-year reference period was utilized for each of the outcome measures. The first measure, new arrest, is a dichotomous measure of any new arrest within 1 year of the assessment date. Approximately 33% of the juveniles were rearrested within this time frame. The second measure, technical violation, is a dichotomous measure of any violation of supervision conditions (with the exception of being arrested on a new charge). Approximately 18% of the sample violated the conditions of their supervision. Finally, any recidivism is a composite measure of new arrest and technical violation. A juvenile was coded as recidivating (any recidivism = 1) if he or she was reported to have a new arrest or a technical violation within the 1-year reference period. Approximately 44% of the sample were either rearrested or violated conditions of their supervision.
Independent and Control Variables
The independent variable used in this analysis was risk level. This measure included three risk categories: (1) low-risk, (2) moderate-risk, and (3) high-risk. Two types of risk levels were examined within this analysis: (1) original risk levels and (2) adjusted risk levels. 1 The original risk levels were produced directly from the OYAS-DIS assessment score. Table 1 provides sample characteristics for the independent and control variables used in this analysis. Based on the original scoring, 60% of youth were coded as low-risk, while 32% were coded as moderate-risk, and 8% were coded as high-risk. The adjusted risk levels take into account the risk levels that were adjusted through professional discretion. Once the levels were adjusted for overrides, 55% of the juveniles were classified as low-risk, while 34% were classified as moderate-risk and 11% as high-risk.
Sample Characteristics for the Weighted Sample.
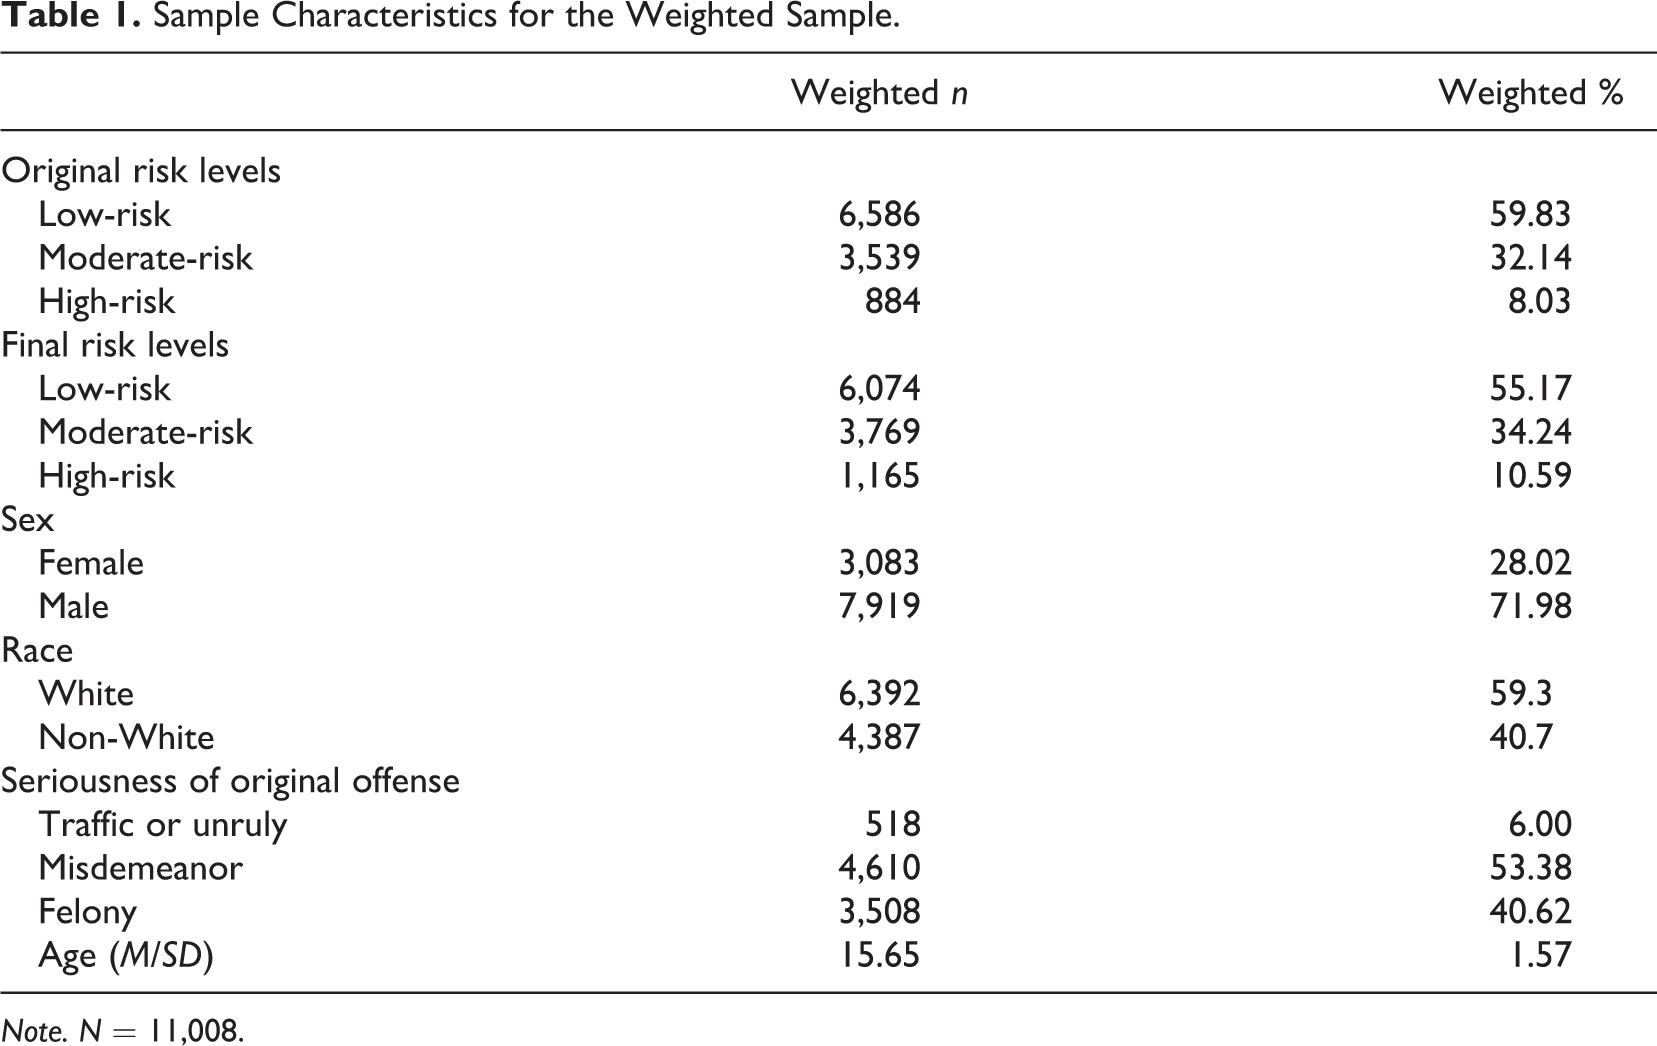
Note. N = 11,008.
There were four control variables included in the multivariate regression analyses: sex, race, age, and seriousness of the offense. Both sex (0 = female; 1 = male) and race 2 (0 = White; 1 = non-White) were dichotomous measures. Age was a continuous measure that ranged from 9 to 20. Seriousness of the offense was a four-category measure that reflected the nature of the juveniles’ initial arrest and was included in the multivariate analyses due to its impact on recidivism. The initial arrest could be coded as (1) traffic or unruly, (2) misdemeanor, (3) felony, and (4) offense missing. 3 For multivariate analyses, a series of dummy variables were created with the traffic and unruly category used as the reference group. Approximately 72% of the sample were male and 41% were non-White. The average age was 15.65 years old. About 6% of the sample were initially arrested for traffic violations or being unruly, while 53% and 41% were arrested for misdemeanors and felonies, respectively.
Results
Univariate and Bivariate Analyses: Overrides and Recidivism Across Ohio Counties and Youth
The override adjustment was used in approximately 7% of cases, and its use appeared to vary greatly across the jurisdictions (χ2 = 205.65; p < .001). In 3 of the 33 counties, there were no reported overrides, yet in another 18 counties, up to 10% of the cases included an override. Ten of the counties had 11–20% of their cases overridden, and finally in the two remaining counties, more than 21% of the cases involved an override. Also of note, 98% of all the overrides were made in a manner that increased the risk level of the offender. In addition to differences in the rate of overrides, counties also differed in their recidivism rates. This was observed for each measure of recidivism, including new arrest (χ2 = 93.92; p < .001), technical violation (χ2 = 348.19; p < .001), and any recidivism (χ2 = 154.79; p < .001).
In order to examine whether any individual characteristics of the sample influenced whether a youth would be given an override, chi-square analyses were conducted between the control variables and a dichotomous measure of overrides (0 = no override; 1 = override). These analyses revealed no significant differences across the demographic characteristics. 4 While a slightly larger percentage of Whites received overrides than non-Whites (8.02% and 5.49%, respectively), this difference was not statistically significant. Further, no significant differences were observed across males (6.27%) and females (7.13%). In addition, the type of offense for which the youth were adjudicated also did not appear to have an influence on whether a youth would be given an override. For instance, across the traffic or unruly (8.01%), misdemeanor (7.50%), and felony (7.78%) categories, approximately 8% of the youth received an override.
Bivariate Analyses: Risk Levels and Recidivism
Table 2 presents the results from the chi-square analyses comparing the predictive validity across the original and adjusted risk levels. Several interesting observations emerge from these analyses. First, the results indicate that, on average, for both the original and the adjusted risk levels, there were significant differences across the risk groups for each of the three measures of recidivism (i.e., likelihood to recidivate varied across low-, moderate-, and high-risk offenders). However, there were some indications that the original risk levels preformed slightly better than the adjusted risk levels. For example, 54.38% of the original high-risk individuals were rearrested compared to 51.96% of the adjusted high-risk individuals. A similar pattern was also observed for the technical violation and any recidivism measures. These findings indicate that the original risk levels may have greater accuracy than the adjusted levels when identifying high-risk individuals.
Chi-Square Analyses: Recidivism Rates by Original and Adjusted Risk Level.
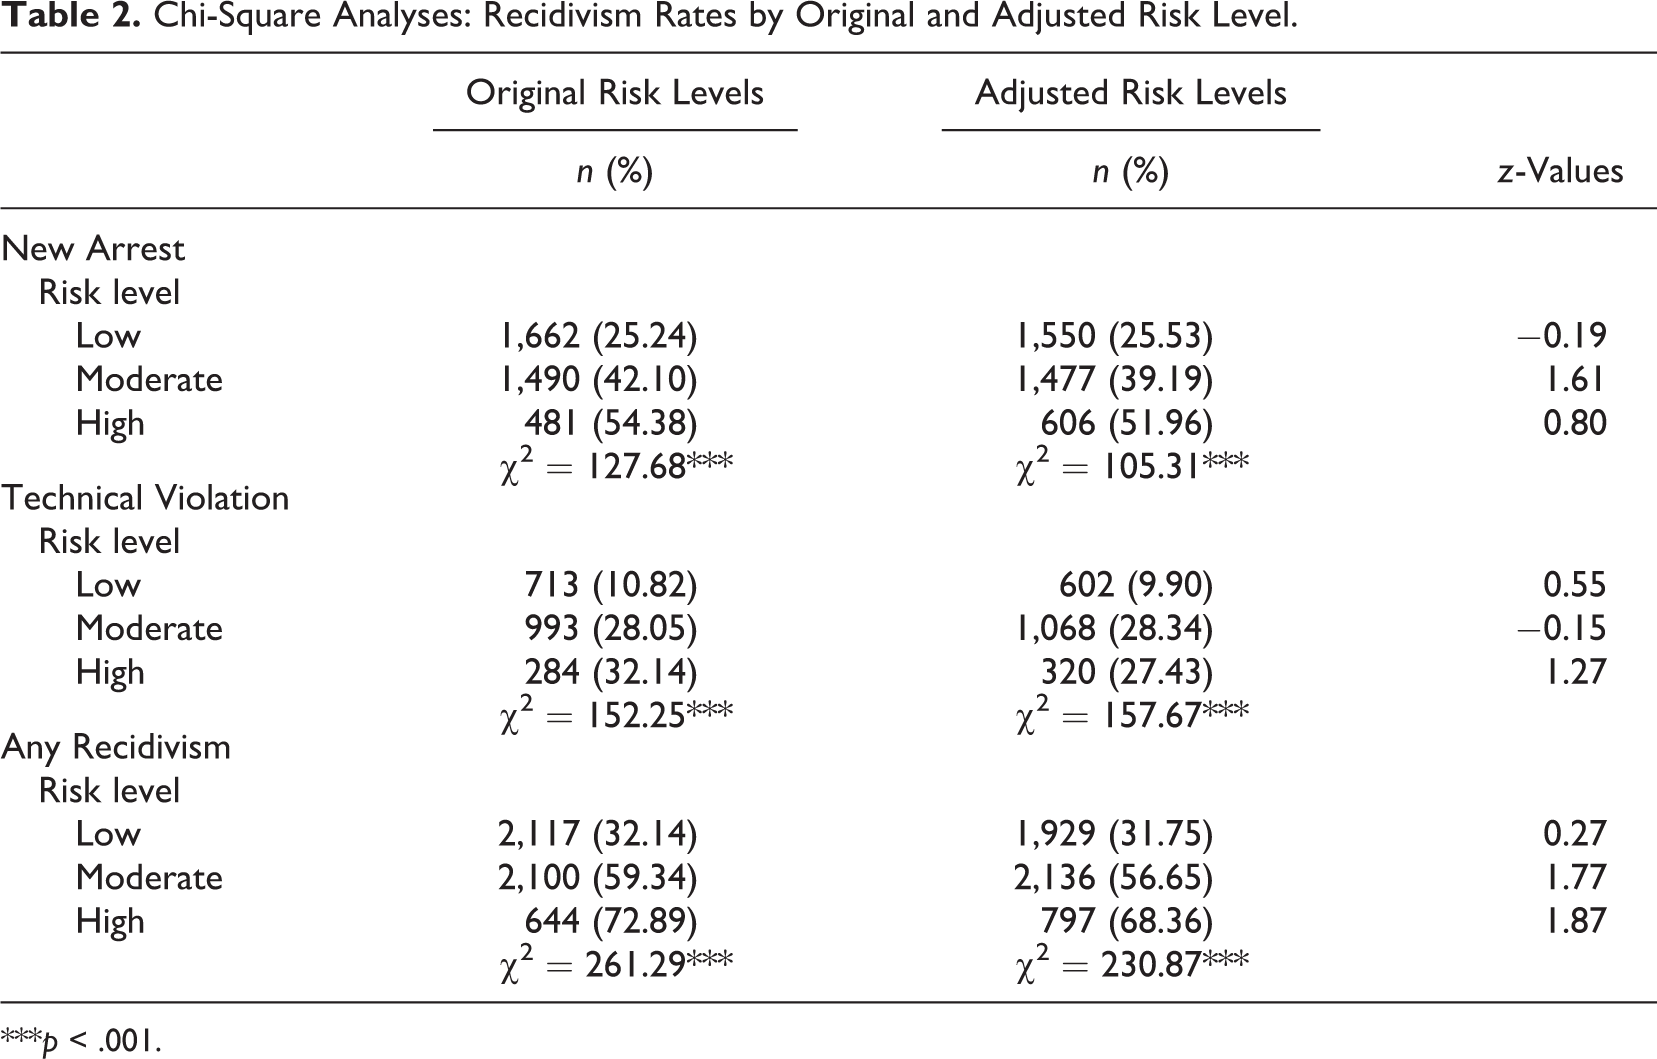
***p < .001.
Another notable finding was observed in the chi-square analyses on the technical violation measure. In contrast to the original risk levels where recidivism increases incrementally across the risk levels, within the adjusted risk levels, moderate-risk offenders recidivated at higher rates than high-risk offenders (28.34% vs. 27.43%, respectively). This finding suggests that the adjusted levels weakened the accuracy of the tool when predicting whether a juvenile would violate the conditions of release. While some differences were observed across the original and adjusted risk levels, it important to note that z-tests of proportions indicated that there were no statistically significant differences across the individual risk levels when comparing rates of failure. This demonstrates that the original and adjusted risk levels produced similar rates of recidivism.
Two bivariate statistics—point-biserial correlation and ROC curve analysis—were conducted to measure the strength of the association between the risk levels and each type of recidivism (see Table 3). On average, the results provide evidence that the original risk levels were more strongly associated with the recidivism measures than the adjusted risk levels. For example, when focused on new arrest, the original risk levels (rpb = .211; AUC = .612) performed slightly better than the adjusted risk levels (rpb = .193; AUC = .603). This pattern was also observed for the composite measure of any recidivism. However, while the point-biserial correlation for technical violation was higher for the original risk levels than that for the adjusted levels, the corresponding ROC analysis indicated that the adjusted risk levels (AUC = .651) were slightly more strongly associated with technical violations than the original risk levels (AUC = .650). Despite the observed differences in the measures of associations across the original and adjusted levels, Fisher’s r-to-z transformations and ROC curve comparisons revealed that there were no significant differences across the paired analyses.
Point-Biserial Correlations and ROC Analyses on Original and Adjusted Risk Levels.
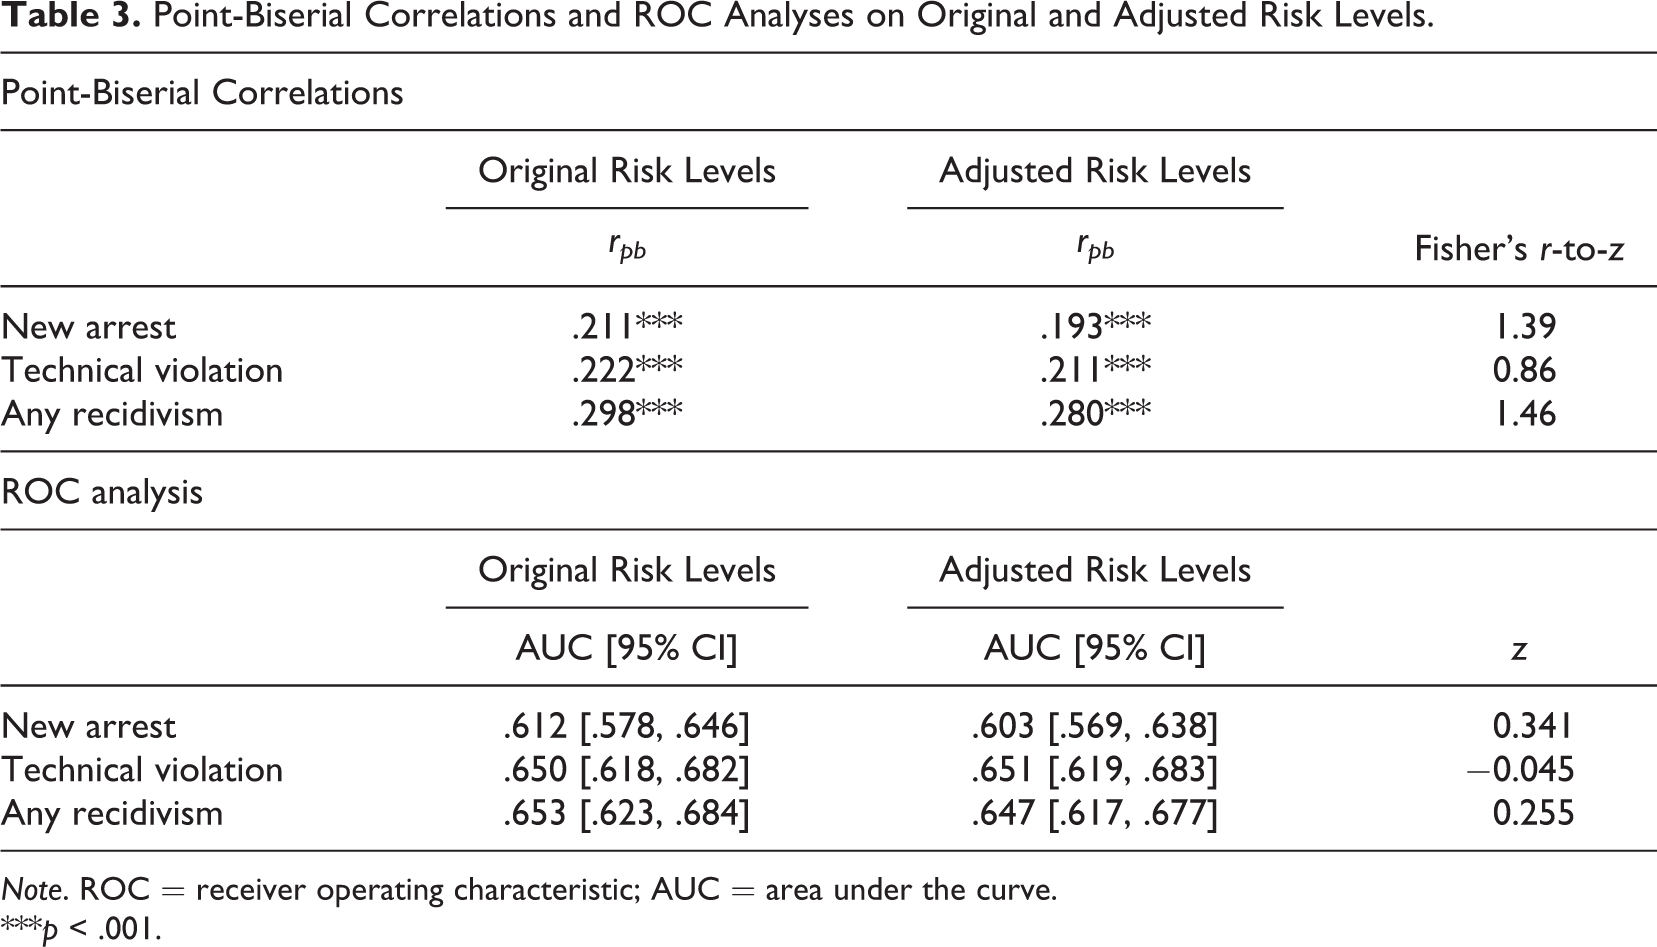
Note. ROC = receiver operating characteristic; AUC = area under the curve.
***p < .001.
Multivariate Analyses: Risk Levels and Recidivism
Table 4 presents results from binary logistic regression models that estimated the relationship between recidivism and risk levels controlling for individual- and offense-related characteristics. The results from these analyses indicated that the risk levels were significant predictors of each of the three dependent variables. The results for the new arrest models showed that the risk levels function in the expected manner. For example, in the original risk level model, moderate-risk juveniles were more than 2 times as likely as low-risk offenders to be rearrested, adjusted odds ratio (AOR) = 2.04, while high-risk juveniles were more than 3 times as likely as low-risk offenders to be rearrested, AOR = 3.33. The probabilities associated with the adjusted risk levels, however, were slightly lower than those observed in the original risk levels model. Specifically, moderate-risk in the adjusted risk level model (AOR = 1.80) was slightly lower than the same measure in the original risk level model (AOR = 2.04). This pattern was also observed for the high-risk category (AOR = 3.01 vs. AOR = 3.33, respectively). The AORs in these models suggest that the original risk levels performed slightly better than the adjusted risk levels. However, equality of coefficients tests conducted across the two new arrest models indicated that there were no significant differences in the estimates produced from the original and adjusted risk levels.
Binary Logistic Regression of Recidivism by Original and Adjusted Risk Levelsa.
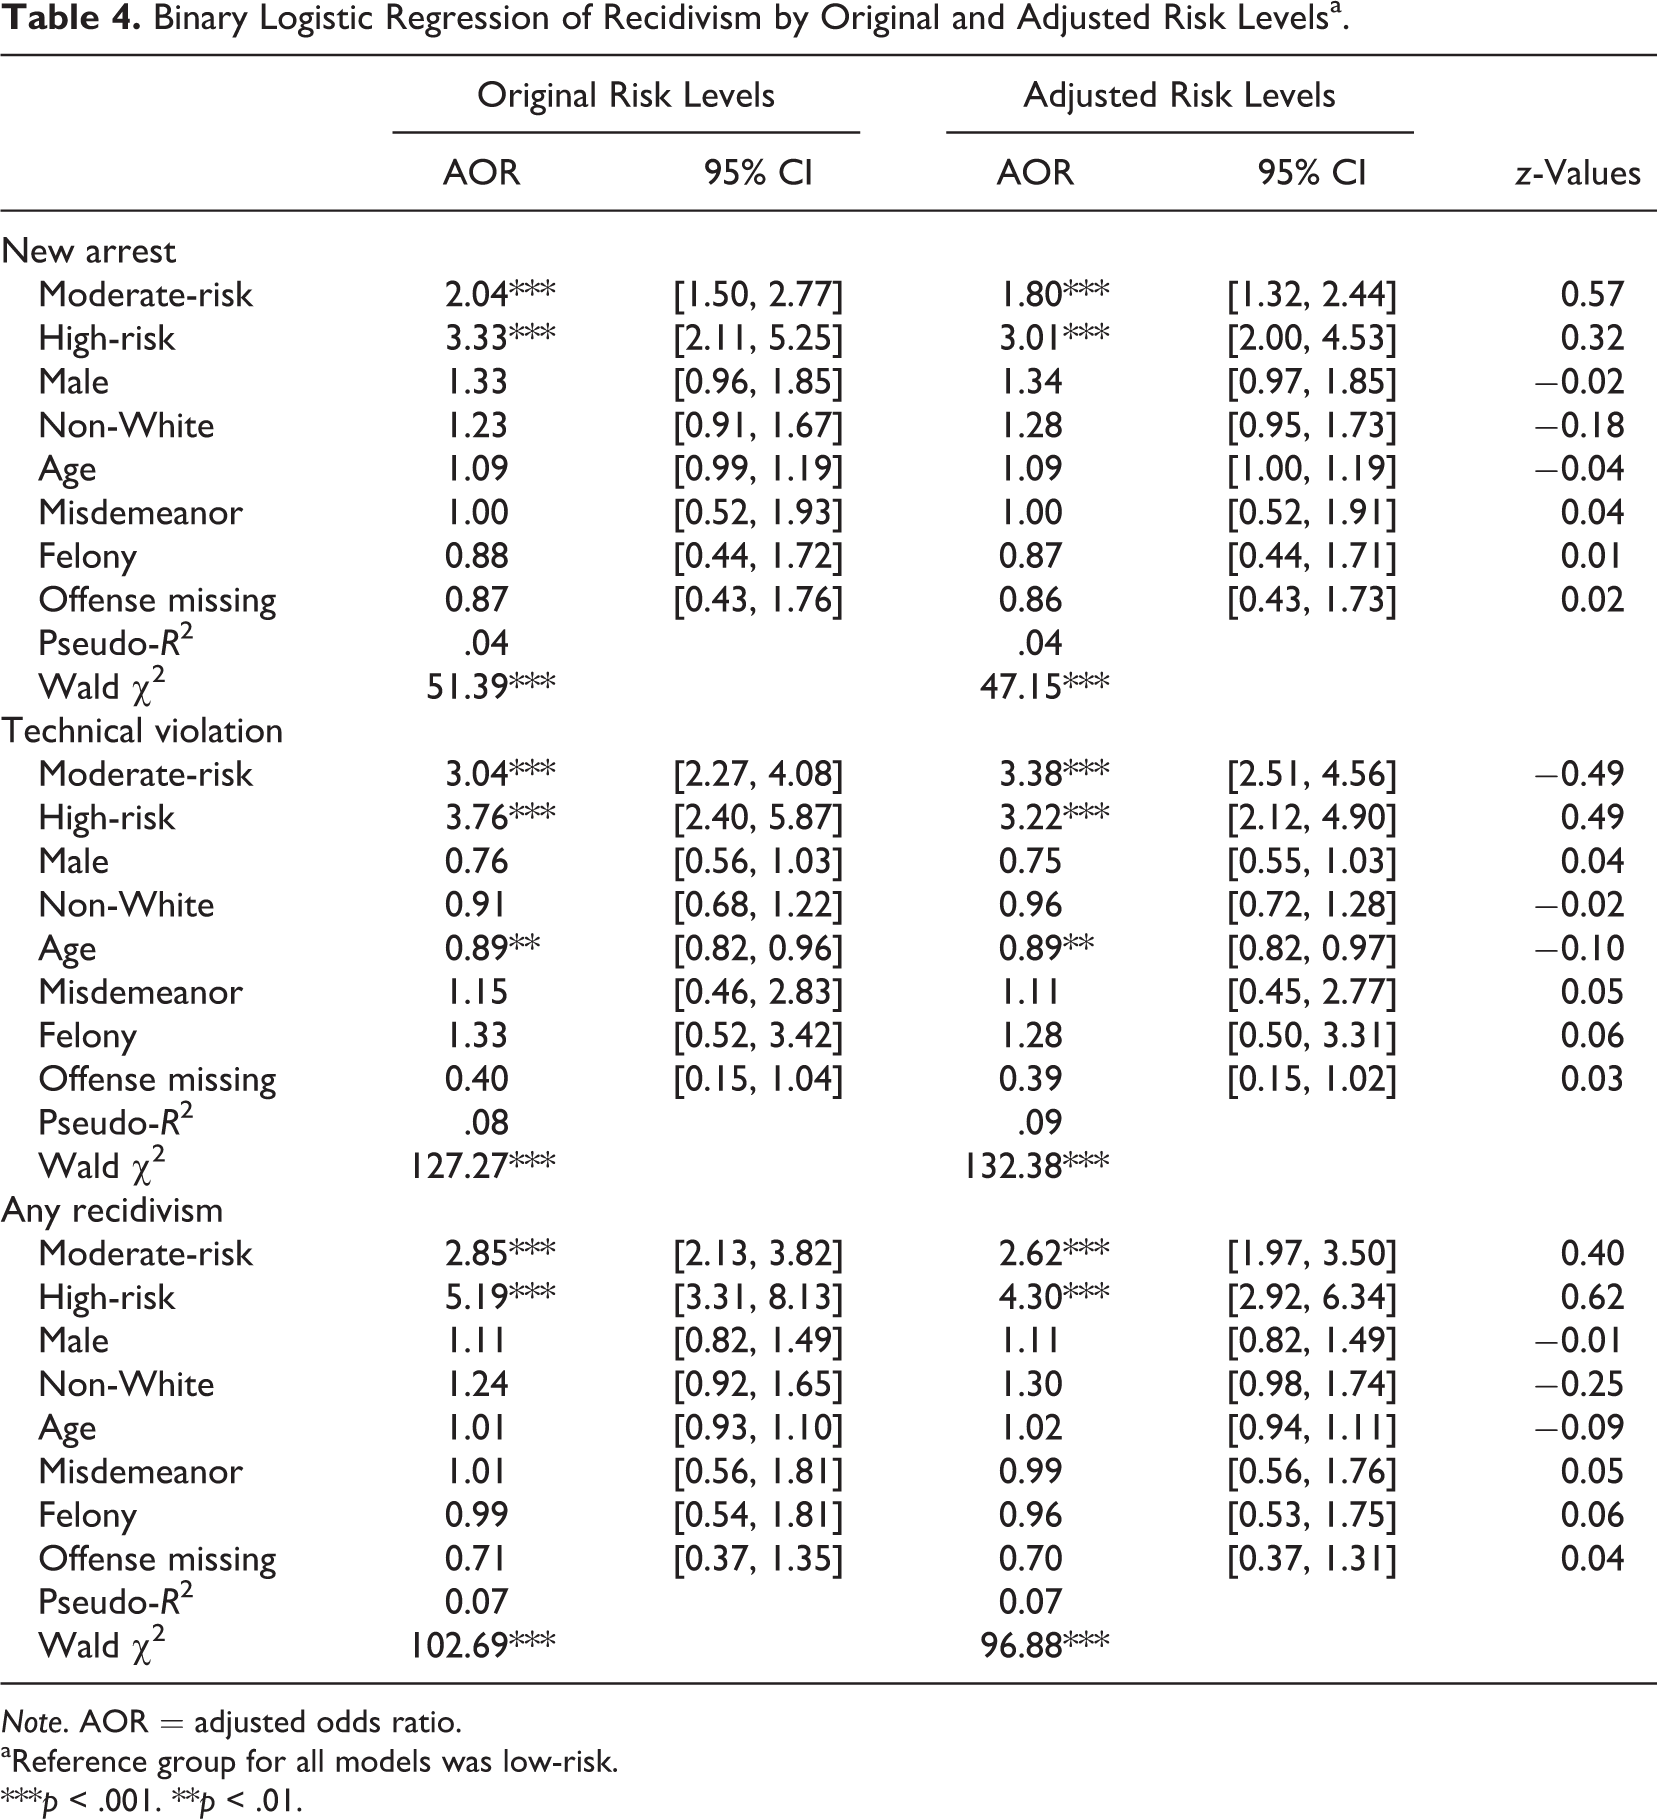
Note. AOR = adjusted odds ratio.
aReference group for all models was low-risk.
***p < .001. **p < .01.
The results for technical violation revealed that the original risk levels performed in a manner consistent with expectations. Moderate-risk offenders were about 3 times more likely than low-risk offenders to have a probation violation (AOR = 3.04), while high-risk offenders were nearly 4 times more likely than low-risk offenders to have violated probation (AOR = 3.76). However, the adjusted risk levels did not perform as expected when predicting technical violation. The AOR for high-risk (AOR = 3.22) was lower than the AOR for moderate-risk (AOR = 3.38), which is contrary to a basic risk assessment expectation that moderate-risk individuals would be less of a risk than high-risk individuals. A review of the results from the two models predicting any recidivism returns to theoretical expectations, but again, the probabilities associated with the measures from the original risk levels were greater than the probabilities associated with the adjusted risk levels. Specifically, moderate-risk was a greater predictor of recidivism in the model utilizing the original risk levels than the model with adjusted risk levels (AOR = 2.85 and AOR = 2.62, respectively), and this was also true for the high-risk measures (AOR = 5.19 and AOR = 4.30, respectively). Similar to the new arrest models, no significant differences emerged in the equality of coefficients tests for either the technical violation or any recidivism measures. It is also worth noting that none of the control measures were significant in either the new arrest or any recidivism models. 5 On the other hand, age was found to be inversely related to technical violation in both models.
Subsample Analyses: Risk Levels and Any Recidivism by County Override Rate
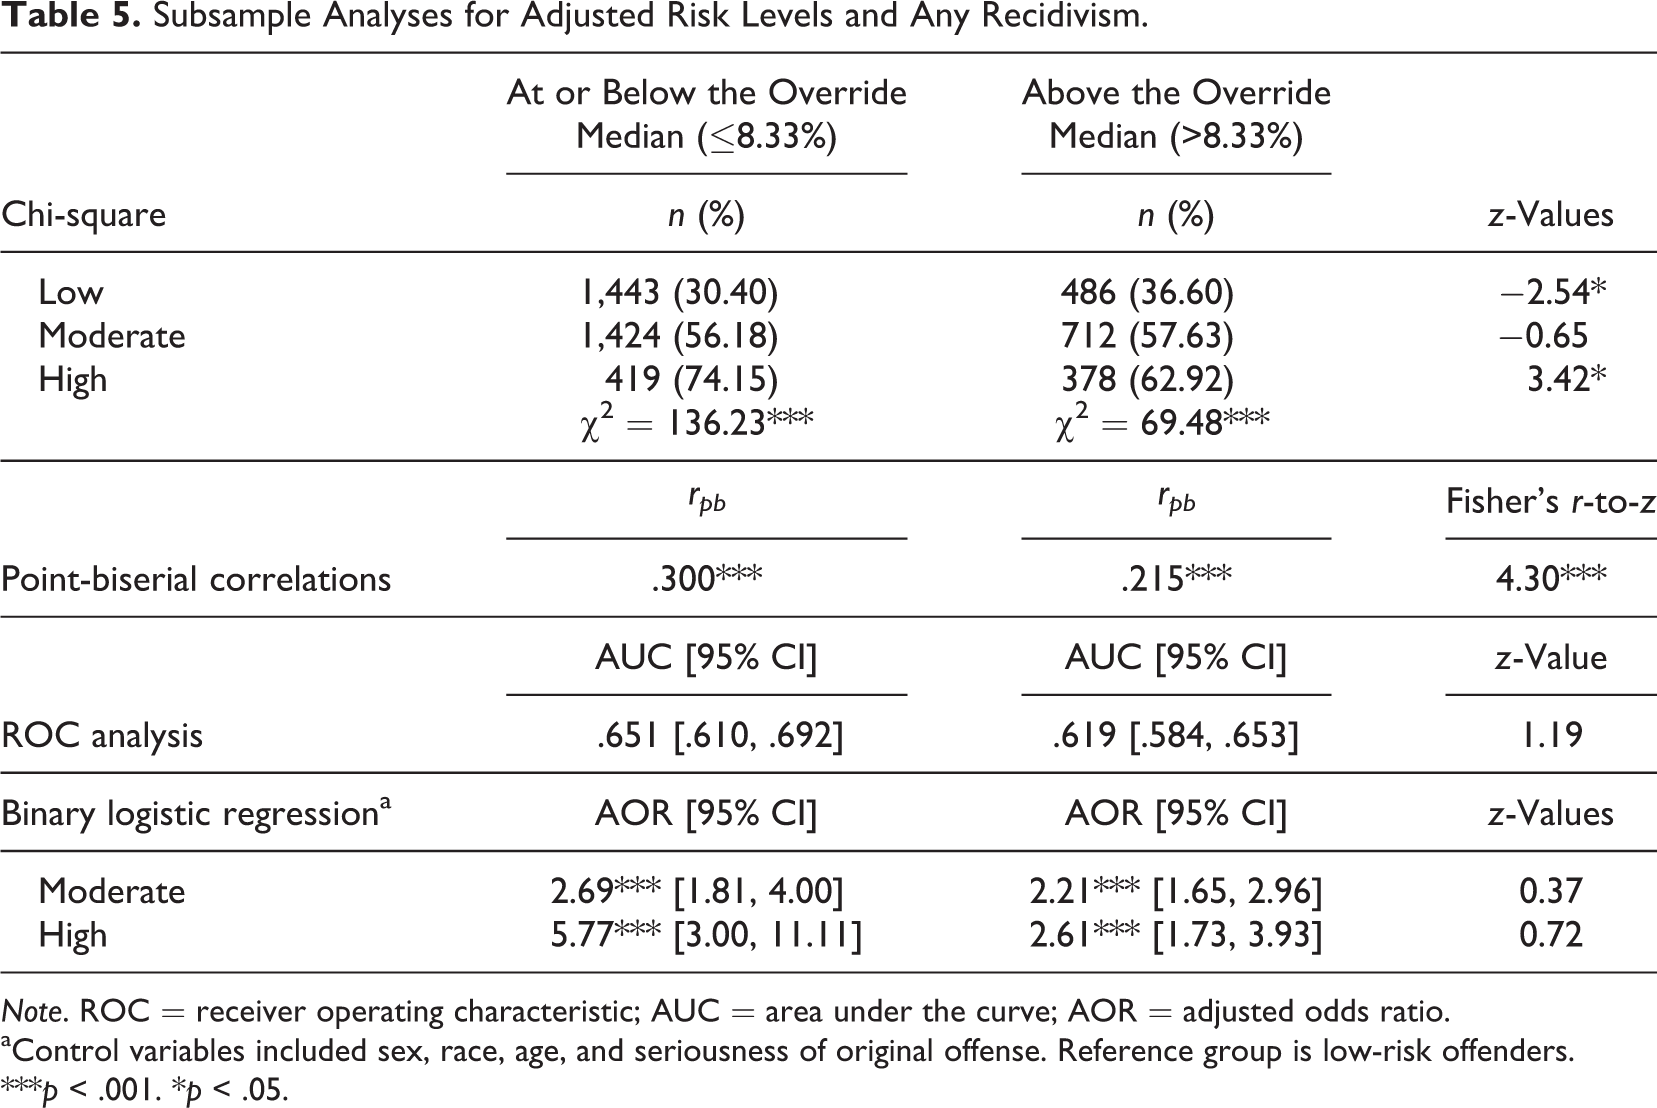
In order to examine whether the strength of the relationship between the adjusted OYAS-DIS risk levels and recidivism differed across youth from counties with low versus high override rates, additional subsample analyses were conducted utilizing the any recidivism outcome measure. In these analyses, the sample was dichotomized into two groups: (1) youths who resided in counties with override rates at or below the median (
Subsample Analyses for Adjusted Risk Levels and Any Recidivism.
Note. ROC = receiver operating characteristic; AUC = area under the curve; AOR = adjusted odds ratio.
aControl variables included sex, race, age, and seriousness of original offense. Reference group is low-risk offenders.
***p < .001. *p < .05.
Discussion and Conclusion
This study was designed to explore the impact of professional discretion on the predictive validity of a juvenile risk assessment tool. To investigate this issue, this study used data from a weighted sample of approximately 11,000 juvenile risk assessments from 33 counties across Ohio. Chi-square analyses revealed that both the original and the adjusted risk levels created tiers of risk that were significantly different based on rates of recidivism. However, when accounting for the overrides, there was evidence that the risk levels’ association with recidivism dropped slightly. Bivariate measures of strength also confirmed this pattern. Results from point-biserial correlations and ROC analyses both illustrated that, on average, the original risk levels were more strongly associated with the outcome measures than the adjusted risk levels. However, while the strength of the association was higher for the original risk levels, significance tests indicated that there were no significant differences in the estimates produced across the two risk level groups. Based on these results, it appears that allowing criminal justice professionals to adjust the results of a risk assessment slightly—but not significantly—decreases the predictive validity of the tool. The lack of significant differences observed in this study could be a reflection that the Ohio justice professionals administering the OYAS-DIS were exercising the override function appropriately.
Additional subsample analyses were completed to investigate whether the rate at which counties use the override function impacted the predictive validity of the tool. After splitting counties into two groups (at or below the median and above the median), small differences in predictive validity emerged. Specifically, chi-square analyses indicated that the high-risk category was more significantly related to recidivism when a smaller amount of overrides were used. Also, the point-biserial correlation analysis indicated that the risk levels were significantly more robust in counties with a low amount of overrides compared to counties with a high amount of overrides.
These results cast doubt on the argument which claims that supplementing actuarial results with professional discretion can increase the predictive validity of a tool designed to predict recidivism. At best, these results could be tentatively interpreted that the inclusion of overrides “does no harm” to the predictive validity of the tool, but the general trend of the results suggests that the inclusion of clinical discretion is not for the better. In light of these results and in the context of previous research on the topic which demonstrated that the inclusion of overrides decreased the predictive accuracy of the tools, some actuarialists may support a strict adherence to the results produced by the tool in order to maximize its performance. This proposition, while perhaps mathematically superior, may not be the most preferred method, given the realities of the situations in which these instruments are implemented. First, staff may be resistant to the implementation of an assessment because they feel as though their professional experience is being supplanted by an assessment to which they have given no input. Indeed, the implementation of these tools should be seen as a negotiated process between researchers and professionals (Hannah-Moffat, Maurutto, & Turnbull, 2009). Therefore, researchers should find a way to balance the recognition of justice professionals’ expertise in the field while promoting best practices of actuarial risk assessment. Instead of removing the ability to override, applied researchers should focus on developing an explicit set of “best practice” rules to govern over the use of overrides.
Second, there may be practical reasons for departing from the results of an assessment. For example, some policies may require officials to override a case up to minimum risk level based on the level of offense committed by the offender. Carns and Martin (2011) detailed a requirement in Alaska which stipulates that sex offenders can be classified no less than moderate-risk, and for some serious felonies, juveniles can be classified no less than high-risk. On the other hand, restricting the discretion to override may have some unintended consequences. Gebo, Stracuzzi, and Hurst (2006) reported qualitative responses from police and probation officers in which the practitioners reported adding additional charges against a juvenile or scoring a risk assessment high in an attempt to get the juvenile to a benchmark where he or she could be placed in detention. In this example, the power to override was given to judges (not to police or probation officers), and they were reluctant to use it. The practitioners subverted the process by finding ways around the restriction of overrides.
The current study has also uncovered several avenues of research that warrant further attention by risk assessment researchers. For instance, the manner in which overrides were used leads to two concerns that should be the focus of further exploration. First, the rate of overrides differed greatly based on jurisdiction. It was found that while some counties in Ohio rarely used the override function, others utilized it in over 20% of cases. This finding has been overlooked across other studies as most only report an aggregate proportion of overrides in a sample. The differing rates in the use of overrides could be influenced by several factors, such as staff drift, poor training, local court policies that (dis-)allow for their use, or general levels of staff compliance with an instrument (e.g., Miller & Maloney, 2013). While the current study can only provide evidence that the use of overrides varied within the state, this is revealing of different practices among counties using the same assessment instrument. More importantly, it should indicate that large aggregate estimates of override rates would give an incomplete or misleading conclusion as to their use in general.
When compared to the amount of research on the effect of overrides on the predictive validity of actuarial tools (which could be justifiably described as scarce), even less is known about what factors influence a professional’s likelihood to use an override. One study suggested that overrides of a juvenile detention risk assessment tool were mostly influenced by legal factors, such as the seriousness of the current offense, prior record of the offender, and whether the juvenile was currently on probation supervision (Chappell, Maggard, & Higgins, 2012). It may very well be that the rate and manner in which overrides are used become important to the overall success of the tool. When gleaning from previous research and the results of the current study, it is not outside logical reasoning to suggest that the jurisdictions that use overrides in a larger proportion of cases will lose the greatest amount predictive validity (e.g., Carns & Martin, 2011). Further examination of the predictors of professional discretion and an understanding of how and why the use of overrides varies across contexts would be valuable for understanding the true impact that professional discretion has on the accuracy of correctional instruments.
Second, this study found that nearly all of the overrides increased the risk level of the juvenile. Based on this finding, the ideal of professional discretion may ring hollow for some if decisions are only being made in one direction and not in a manner that considers the override function to “swing” in both directions. This is especially true, given that there is some indication that lowering a risk level might not only be appropriate in some circumstances but could also improve the predictive validity of the tool (Wormith, Hogg, & Guzzo, 2012). Given that this is not the first study to find that downward overrides were rare, it might be that overrides are primarily a function of professional conflict between a low-risk actuarial assessment and a professional judgment that the risk is higher (Ansbro, 2010). In other words, professionals might see the actuarial assessment as a “bottom-line” or safety net with which they are not willing to disagree with in a manner that would decrease the risk level. Wormith et al. (2012) hypothesize that lowering a risk level takes a certain amount of courage on the part of the assessor knowing that their recommendation could be wrong and might result in placing the general public in greater danger. Again, to better understand this function, more research is necessary. Wormith, Hogg, and Guzzo (2015) have recommended that written justification should be documented and provided when professionals recommend an override. This strategy would give researchers, as well as court or probation department management, a better understanding of how overrides are being used and in what manner officers make these decisions.
This study has limitations worth noting. First, given the nature of these data which included no reliability measures, the impact of the probation officer’s allegiance to the tool remains unknown. If probation officers (or other justice professionals administering the tool) complete the assessment inconsistent with the prescribed instructions, it could impact the results of this study. While the officials responsible for administering the tool were trained by research staff and were encouraged to continue following all policies and procedures detailed within the assessment, there was no way to ensure that the tools were being used appropriately. The second limitation is concerned with the youth’s experience while on probation. Due to the nature of the data, this study was unable to account or control for any rehabilitation program, placement, or restrictions ordered by the court. Because of this, this study cannot establish whether interventions influenced the juveniles’ likelihood to recidivate. Another limitation underscores the concerns addressed earlier regarding the factors that influence an override. Due to data limitations, this study was unable to investigate (or potentially control for) the reasons why a juvenile’s risk level was adjusted.
In conclusion, the use of overrides with the OYAS-DIS appears to have been a detriment to the predictive accuracy of the tool. In context with previous research, this finding should act as a reminder that jurisdictions should allow justice officials to override the results of a risk assessment that they should proceed with caution and do so with care to ensure the override is justifiable. The findings of this study, coupled with the majority of findings preceding it, suggest that while the inclusion of overrides may not have a large impact on the predictive validity of the tool, their use may slightly decrease its predictive power. However, in the most extreme case, where a large proportion of assessments include an override decision, the measures of the tool may no longer be significantly associated with recidivism (e.g., Carns & Martin, 2011). Similarly, these findings should also serve a call for researchers that the override function should not be overlooked in predictive validity studies.
Footnotes
Declaration of Conflicting Interests
The author(s) declared no potential conflicts of interest with respect to the research, authorship, and/or publication of this article.
Funding
The author(s) received no financial support for the research, authorship, and/or publication of this article.