



Abstract
There are racial and ethnic disparities associated with school discipline practices and juvenile justice contact. In addition, research suggests that stricter school discipline practices and disproportionate minority contact for minority youth are relatively more prevalent in urban areas. What remains unknown, however, is the relationship between race and ethnicity, school discipline practices, and juvenile justice referrals across urban, rural, and suburban schools. Therefore, this study draws from the Texas Education Agency’s Public Education Information Management System to investigate the relationship between school discipline practices and juvenile justice contact with a focus on racial and ethnic disparities in urban, rural, and suburban schools. Findings indicate that both stringent and lenient school discipline practices have effects on juvenile justice referrals as well as racial and ethnic disparities across distinct school locations; however, there are important and distinctive nuances that are presented and examined.
The Office of Juvenile Justice and Delinquency Prevention reports that there were more than 1.6 million arrests of juveniles in the United States in 2010, including 366,000 arrests for property crimes, 170,000 for drug abuse, and 156,000 for disorderly conduct (Puzzanchera, 2013). Some have suggested that a growing number of these youth in the juvenile and adult justice systems are being referred by schools (Gregory, Skiba, & Noguera, 2010; Kim, Losen, & Hewitt, 2012; Kupchik, 2010; Rios, 2011; Rocque & Paternoster, 2011; Rocque & Snellings, In Press). The “school-to-prison pipeline” is one of the most debated social and educational processes facing the educational and juvenile justice systems today. In essence, the school-to-prison pipeline process suggests that “zero-tolerance” or stringent punitive school policies, such as detentions, suspensions, and truancy policies, and the like steer or funnel youth out of schools, increase their likelihood of contact with the juvenile or adult justice system (Gregory et al., 2010; Kim et al., 2012; Kupchik, 2010; Rios, 2011; Rocque & Paternoster, 2011; Rocque & Snellings, In Press). Although the school-to-prison pipeline denotes a direct link between school discipline and adult incarceration, there are arguably a number of pathways, including educational failure, social exclusion, and juvenile justice contact, that could facilitate disproportionate criminal justice contact for disciplined youth (Kupchik, 2010; May, 2014; May, Barranco, Stokes, Haynes, & Robertson, 2018; Rios, 2011; Rocque & Paternoster, 2011; Shedd, 2015). There is also an overrepresentation of racial and ethnic minority youth, especially in urban areas, who are being disciplined in schools as well as having contact with the juvenile justice system (Davis & Sorensen, 2013; Kirk, 2009; May, 2014; Nicholson-Crotty, Birchmeier, & Valentine, 2009; Rios, 2011; Shedd, 2015). In turn, some argue that disproportionate racial and ethnic minority juvenile contact, as well as disproportionate school discipline, is reflective of the process of “criminalization” that minority youth endure within U.S. social institutions such as the educational and juvenile justice systems (Hirschfield, 2008; Hirschfield & Celinska, 2011; Portillos, González, & Peguero, 2012; Rios, 2011; Shedd, 2015).
Social, public, and political concerns about violence within schools have fueled the implementation of harsh or severe school discipline practices (Muschert, Henry, Bracy, & Peguero, 2013; Muschert & Peguero, 2010). Schools with high levels of racial and ethnic minorities attend schools that are like “prisons” because these schools sustain increased police presence, security measures, surveillance, and stringent discipline policies (Noguera, 2008; Portillos et al., 2012; Rios, 2011; Shedd, 2015). What remains unclear, however, is whether stringent or lenient school discipline practices, particularly for racial and ethnic minorities across different school locations (i.e., urban, rural, and suburban), contributes to juvenile justice contact.
This study investigates the relationship between stringent and lenient school discipline practices on juvenile justice referrals across distinct school locations (i.e., urban, rural, and suburban) as well as associated racial and ethnic disparities. This study first reviews research that conceptualizes the link between school discipline and juvenile justice contact across distinct school locations. Data for this study are drawn from the Texas Education Agency’s (TEA) Public Education Information Management System (PEIMS) to address two research questions proposed by this study that remain unanswered by the previous literature. First, is the relationship between school discipline practices and juvenile justice referrals similar in urban, rural, and suburban contexts? Second, are there racial and ethnic disparities between school strictness and juvenile justice referrals evident in urban, rural, and suburban contexts?
The “School-to-Prison Pipeline” and Disproportionate Minority Contact
The school-to-prison pipeline is a conceptual term that is used to depict the policies and practices, especially with respect to school discipline, in the school and juvenile justice system that decrease the likelihood of educational opportunities and success for youth while increasing the likelihood detrimental outcomes such as educational failure and juvenile justice system contact (Kim et al., 2012; Pantoja, 2013; Rocque & Paternoster, 2011; Skiba, Arredondo, & Williams, 2014). The school-to-prison pipeline term is also utilized to describe the criminalization of schools as institutions of social control that emphasize security over education (Hirschfield, 2008; Hirschfield & Celinska, 2011; Rios, 2011; Rocque & Snellings, In Press; Skiba et al., 2014). Some also incorporate the conceptualization of the school-to-prison pipeline as a mechanism that reproduces racial and ethnic inequalities by funneling youth out of the educational system and into the juvenile and criminal justice system (Hirschfield, 2008; Hirschfield & Celinska, 2011; Pantoja, 2013; Rios, 2011; Skiba et al., 2014; Sykes, Piquero, Gioviano, & Pittman, 2015). Although the term suggests a direct link between schools and incarceration, research has emerged investigating the direct and indirect paths involved in the school-to-prison pipeline. For example, zero-tolerance or other stringent school discipline practices may open or ease the pathway of students, particularly racial and ethnic minorities, toward increased probability of contact with the juvenile justice system.
There is evidence that schools with high levels of racial and ethnic minorities are “prison like,” as these schools sustain similar features including police presence, security measures, surveillance, and stringent discipline policies (Kim et al., 2012; May, 2014; Noguera, 2008; Portillos et al., 2012; Rios, 2011; Shedd, 2015; Skiba et al., 2011). Welch and Payne (2012) argue that school disciplinary actions tended to be much more punitive in schools with greater levels of racial and ethnic minorities, especially in urban contexts. Moreover, schools with a greater proportion of racial and ethnic minorities are less likely to use restorative practices in discipline but are more likely to focus on punitive punishment (e.g., suspension, detention), are more likely to use zero-tolerance policies, are more likely to use extreme measures of action (e.g., expulsion, police referrals for minor offenses), and are less likely to refer students with behavioral issues to the school counselor (Welch & Payne, 2010, 2012). In turn, there are mounting concerns, particularly in urban and predominately racial and ethnic minority schools, with the expanded use of surveillance and security measures, as well as more stringent school punishment practices. Such practices, including police presence, metal detectors, and zero-tolerance policies, among others, begin to mimic institutional atmospheres, especially for schools located in disadvantaged or urban areas (Noguera, 2008; Portillos et al., 2012; Rios, 2011; Shedd, 2015). Despite wanting to foster a positive school security experience, scholars have found that the utilization of police and security measures may give students the impression that their schools believe or perceive all students as potential sources or targets of violence, even in schools located in affluent and/or suburban areas (Addington, 2009; Kupchik, 2010; May, 2014). This type of school climate or environment can foster fear, resentment, and other negative reactions that can interfere with promoting an effective learning environment (Kupchik, 2010; Peguero & Bracy, 2015; Portillos et al., 2012). Such practices and policies may promote negative outcomes such as increased likelihood of juvenile justice contact, especially for racial and ethnic minority youth (Davis & Sorensen, 2013; May, 2014; Kirk, 2009; Nicholson-Crotty et al., 2009; Rios, 2011; Rocque & Paternoster, 2011; Shedd, 2015).
Increased juvenile justice rates for racial and ethnic minority children is referred to as disproportionate minority contact (DMC), a term which highlights the disproportionate number of racial and ethnic minority youth who come into contact with the juvenile justice system (Davis & Sorensen, 2013; Kempf-Leonard, 2007; Nicholson-Crotty et al., 2009; Piquero, 2008). The Juvenile Justice and Delinquency Prevention Act of 2002 shifted DMC from “disproportionate minority confinement” to “disproportionate minority contact” in order to bring attention to the potential disproportionate representation of racial and ethnic minority youth at all decision points within the juvenile justice continuum (Davis & Sorensen, 2013; Kempf-Leonard, 2007; Nicholson-Crotty et al., 2009; Piquero, 2008). This act sparked a number of investigations into the sources of DMC as well as data-based prevention and system improvement programs to better understand and address DMC (Davis & Sorensen, 2013; Kempf-Leonard, 2007; Nicholson-Crotty et al., 2009; Piquero, 2008). As a result of DMC research, it is evident that the overrepresentation of racial and ethnic minorities exists at many stages of the juvenile justice process, including arrest, referral, conviction, and secure confinement (Davis & Sorensen, 2013; Kempf-Leonard, 2007; Nicholson-Crotty et al., 2009; Piquero, 2008).
In order to better understand DMC, others have also explored the potential sources that are contributing to overrepresentation. For example, researchers disagree on the degree to which DMC can be explained by higher offense rates among racial and ethnic minority youth. While some argue that racial and ethnic minority youth do offend at higher rates than Whites; others argue, however, that differences in offending cannot fully explain the significant and disproportionate pattern of racial and ethnic minority youth contact with the juvenile system (Davis & Sorensen, 2013; Kempf-Leonard, 2007; Nicholson-Crotty et al., 2009; Piquero, 2008). Furthermore, scholars have also explored numerous community characteristics, such as poverty, unemployment, disorder, and urbanicity, and have cited these factors as potential sources or moderators for DMC (Davis & Sorensen, 2013; Kempf-Leonard, 2007; Nicholson-Crotty et al., 2009; Piquero, 2008). These community factors are sometimes treated as potential sources or moderators for DMC (Davis & Sorensen, 2013; Kempf-Leonard, 2007; Nicholson-Crotty et al., 2009; Piquero, 2008).
Research has consistently shown that racial and ethnic minorities are more likely to reside in communities that are characterized by poverty, unemployment, family disruption, crime and violence, social isolation, and discrimination (Durán, 2012; Kubrin & Weitzer, 2003; Morenoff, Sampson, & Raudenbush, 2001; Peterson & Krivo, 2012; Shaw & McKay, 1942). Shaw and McKay (1942) used structural factors such as high residential mobility, ethnic heterogeneity, and low economic status to explain community disruption. Shaw and McKay (1942) highlighted that social disorganization and the amount of delinquency is determined by the neighborhoods’ ability to control the behaviors of its members and youth. The development of social ties to conventional institutions and belief in conventional values become problematic for residents living in such communities (Brunson & Miller, 2009; Durán, 2012; Kubrin & Weitzer, 2003; Morenoff et al., 2001; Peterson & Krivo, 2012; Shaw & McKay, 1942). Thus, the significance of schools is believed to be a central and vital social institution that influences youth engagement in deviance and/or delinquency. In general, urban schools have more problems with adolescent misconduct because these schools are embedded within communities with higher rates of crime, violence, poverty, unemployment, and disorganization (Brunson & Miller, 2009; Gottfredson, 2001; Rios, 2011; Shedd, 2015). It is under this perspective that there has been growing focus on the role of schools as a potential mechanism that contributes to DMC. Given that schools are influenced by community characteristics, it is reasonable that schools may have an impact on the complex relationship between race, ethnicity, urbanicity, schools, and DMC.
Current Study
Urban communities and schools often have high concentration of low-income and racial and ethnic minorities as well as increased DMC rates and stringent school punishment policies (Nicholson-Crotty et al., 2009; Piquero, 2008; Rios, 2011; Skiba et al., 2011, 2014; Sykes et al., 2015). Even though zero-tolerance and stringent school punishment practices have become common across all schools (Addington, 2009; Kupchik, 2010; May, 2014; Muschert et al., 2013; Muschert & Peguero, 2010), it is also evident that zero-tolerance and stringent discipline practices are disproportionately impacting urban and racial and ethnic minority youth in terms of their rates of juvenile justice contact (Piquero, 2008; Rios, 2011; Skiba et al., 2011, 2014). Thus, this study focuses on addressing two primary questions about the relationship between school punishment practices and DMC that remain unanswered by the previous literature. First, is the relationship between school discipline practices and juvenile justice referrals similar in urban, rural, and suburban contexts? Second, are there racial and ethnic disparities between school strictness and juvenile justice referrals evident in urban, rural, and suburban contexts? This study seeks to contribute to criminalization of school discipline, DMC, juvenile justice, and education research by investigating if there is relationship between school discipline practices and juvenile justice referrals as well as establishing if there are racial and ethnic disparities in urban, rural, and suburban contexts.
Method
Data
The data utilized in these analyses are the same as that used in Fabelo, Thompson, Carmichael, Marchbanks III, and Booth’s research (2011). Figure 1 provides a concise overview of the data, including sample sizes and matching procedures. As shown in the figure, data come from three sources. The first, the Texas Academic Excellence Indicator System (AEIS), includes a wealth of information concerning the summary measures of individual schools such as student–teacher ratios, expenditures by category, student demographics, and teacher demographics. These data are freely available at the TEA website and represent TEA’s efforts to make information freely available to the public while still maintaining the confidentiality of individual students.
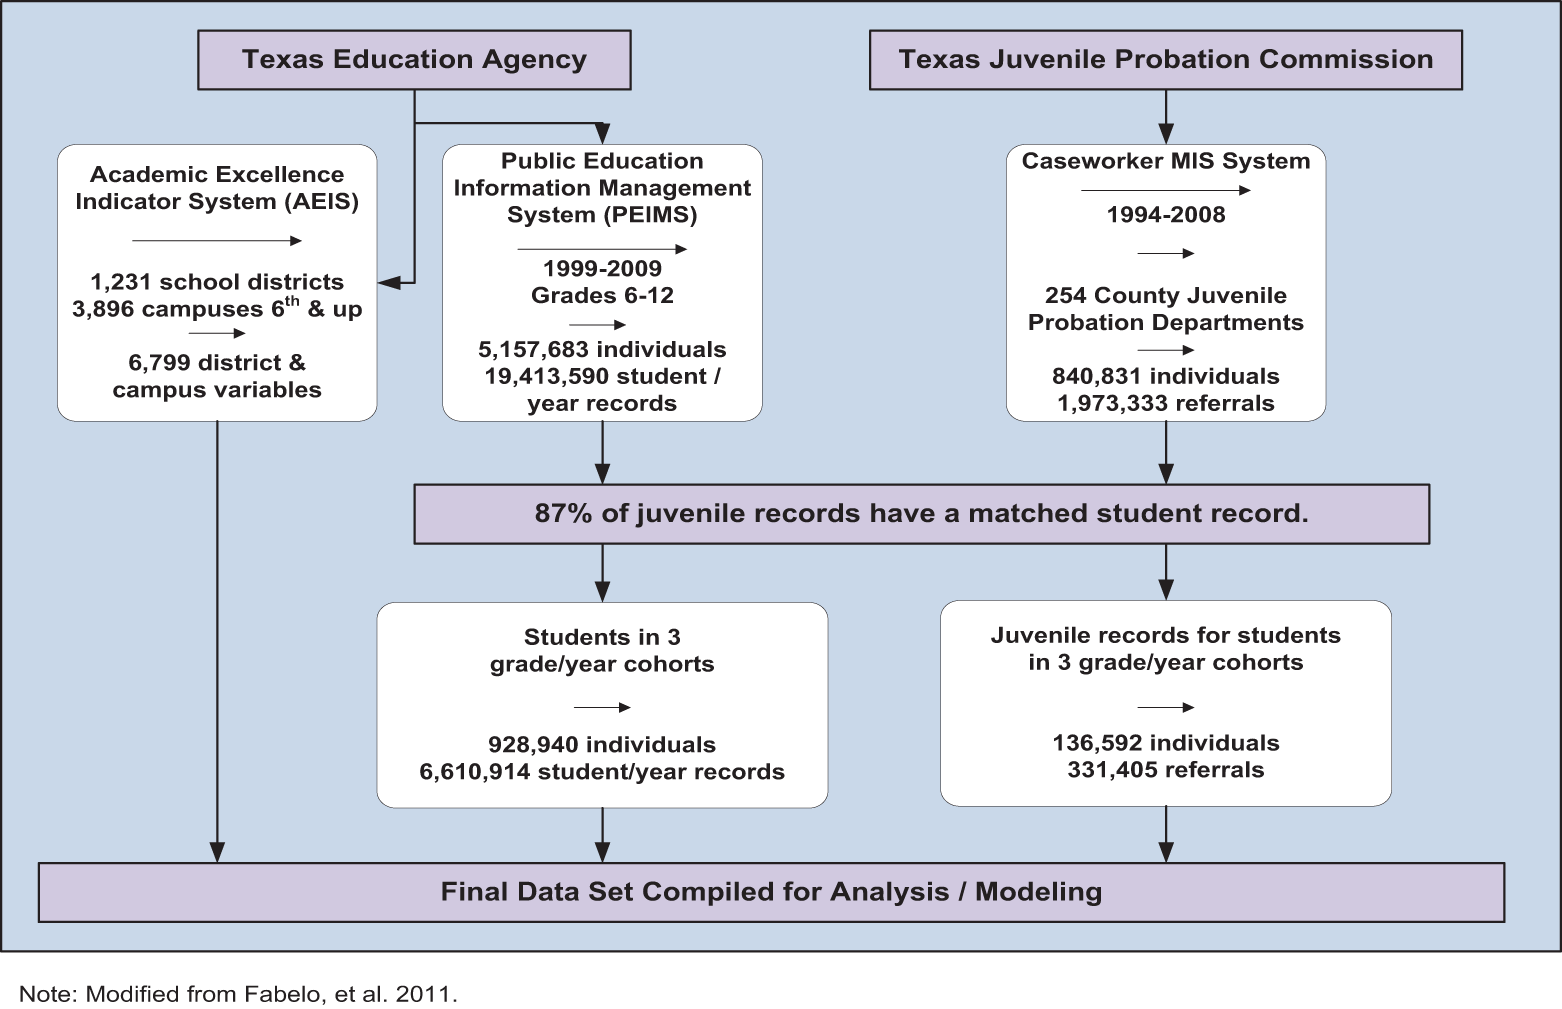
Overview of data sources and data matching protocols.
The second data source, the PEIMS, is also maintained by TEA. This data set maintains individual-level information concerning a wealth of information for students such as demographics, academic achievement, and discipline history. Every public school student in the state of Texas is included in this database. Due to the individual-level nature of these data, access is highly restricted, and individual identifiers are replaced with a random ID. Through PEIMS, one is able to paint a detailed picture of the academic and disciplinary history of children as they progress through the education system. In areas where the AEIS data were unreliable, such as percent of students on free/reduced lunch, the PEIMS data were utilized to provide a more accurate picture.
The last data set includes information from the Texas Juvenile Probation Commission (TJPC; now part of the Texas Juvenile Justice Department). These data were linked to the PEIMS data by TEA who was able to locate 87% of the TJPC individuals in the PEIMS database. When one considers that a portion of youth involved with TJPC were either out of school, in private school or home schooled, this match is remarkably high.
The data focus upon the seventh-grade cohorts from the 1999 to 2000, 2000 to 2001, and 2001 to 2002 school years. These cohorts are followed through to the 2006–2007 school year—tracking each cohort to at least its expected graduation year. Over 900,000 students are included in these cohorts (see Fabelo, Thompson, Carmichael, Marchbanks III, & Booth, 2011).
Dependent Variable
We are interested in explaining what predicts the rate of referral to juvenile justice or TJPC. When a juvenile is referred to the agency, caseworkers will take action if, in their professional judgement, there is just cause to do so. Only those referrals that resulted in administrative action (e.g., the referral is not simply dismissed without any investigative action by TJPC) are included to eliminate areas where schools, neighbors, or others simply refer a large number of cases without basis.
For each year, the percentage of students in this study’s cohort at a school that have an actionable referral to TJPC during the year is calculated by simply taking the number of those with such a referral and dividing by the total number of students. The resulting proportion will serve as the dependent variable in the analyses. As such, the school-year serves as the unit of analysis.
Independent Variables
The key variable of interest, school strictness, is guided by Booth, Marchbanks, Carmichael, and Fabelo’s (2012) research. The basic details of Booth et al.’s (2012) work are: Estimate the probability that each student will be disciplined within the school year. Utilize the individual estimates to form a predicted discipline rate for each campus. Identify the actual discipline rate for each campus. Examine the extent to which each campus discipline rate is greater (less) than predicted by the model (6 and7).
Using this approach, a detailed logistic regression is conducted at the individual level to ascertain the probability that a given student will experience exclusionary discipline (in-school suspension or more severe) in a given school year. These probabilities are then averaged together to produce an expected discipline rate at the campus. The actual discipline rate from the campus is then subtracted from the predicted value leaving a school strictness measure that provides an objective gauge of the level of discipline at a campus relative to what one would expect given the characteristics of the students and campus.
While individual-level data were utilized to create an aggregate measure, this is not an area of concern for a couple of reasons. First, nearly all aggregate measures are simply summations of the individual-level data. For instance, percent students on free/reduced-price lunch is an aggregate measure created from the raw data. Second, as the analyses are at the school level, an appropriate measure of expected discipline rates is needed. As shown in Booth et al.’s (2012) research, averaging the probabilities provides an accurate probability of discipline for a randomly selected child from the school if no further information is available. This approach views those schools that have higher than expected discipline as being more likely to punish youth for actions that other schools would handle more gently and are viewed as overly strict. Conversely, schools that have lower than expected discipline are seen as less likely to take disciplinary measures for actions that other schools would punish students for and are viewed as unusually lenient. In cases of unusual leniency, students may have a difficult time learning while attending school with students who are not being punished for disruptive actions. Conversely, students who attend overly strict schools are more likely to experience the exclusionary discipline associated with juvenile justice contact (Fabelo et al., 2011).
Because there is reason to believe that schools that are overly strict or unusually lenient may both lead to pushing students toward the juvenile justice setting, the absolute value of the strictness is utilized. Because both the expected discipline rate and actual discipline rate are proportions, the difference can never be greater than one. Given that we employ the absolute value, all values fall between zero and one. Further, the analyses include an interaction between this absolute value and a dummy variable for the school having less discipline than expected. Under this approach, whether simple deviations from the expectations of school discipline affect justice referral rates is conducted while further allowing for an evaluation of whether this affect varies in magnitude for this at more lenient campuses relative to more strict campuses. Using this method, schools that are more strict than expected receive a value of zero and those who are less strict than expected receive their absolute value.
Fabelo et al.’s (2011) note that juvenile justice referrals are higher for racial and ethnic minority student than for White students. As such, we include the percentage of students at the campus that are African American, Latina/o American, Asian American, and Native American.
Another key concern of the analyses is the extent to which the urbanicity of the school plays a role in predicting juvenile justice referral rates. To account for the urbanicity, the U.S. Department of Agriculture’s 2003 county classifications were used (http://www.ers.usda.gov/datafiles/RuralUrban_Continuum_Codes/ruralurbancodes2003.xls). For this study’s purposes, the categories were collapsed into urban (metro), rural (nonmetro, not adjacent to metro area), and suburban (nonmetro, adjacent to metro area). A county can fall into only one of the categories (e.g., one cannot be rural and suburban).
Control Variables
Previous studies have established that a number of school characteristics (i.e., proportion of students who receive free or reduced lunch, size, student–teacher ratio, teacher diversity, student–teacher racial and ethnic congruence, and classification) are associated with school climate, punishment practices, and juvenile justice referral rates (Davis & Sorensen, 2013; Gottfredson, 2001; Kim et al., 2012; May, 2014; May et al., 2018; Nicholson-Crotty et al., 2009; Peguero & Bracy, 2015; Piquero, 2008; Rios, 2011; Rocque & Paternoster, 2011; Rocque & Snellings, In Press; Shedd, 2015; Skiba et al., 2011, 2014). Further, while controlling for these same school factors, Fabelo et al. (2011) demonstrated that school discipline encounters increase the probability of a juvenile justice referral.
Proportion of students who receive free or reduced lunch
In order to account for the wealth of the school, the proportion of students who are economically disadvantaged is utilized. This was identified as the percentage of students who qualify for free- or reduced-price lunches.
Size
The size of a school can influence the amount of personal interaction a student has with administrators. As such, we include the size of the school in the model. This variable is simply the number of students enrolled at the campus during the year according to TEA.
Student–teacher ratio
Large classrooms may prevent teachers from forming strong bonds with students. These bonds can help prevent discipline as well as provide an outlet for students to discuss pressing matters with a concerned adult. Classroom size is measured as the number of students enrolled in the campus divided by the number of full-time equivalent teachers, or the student–teacher ratio, as reported by TEA.
Teacher diversity
To account for the diversity of teachers, we utilize the Greenberg measure of diversity calculated as
Student–teacher racial/ethnic incongruence
In order to capture the degree to which the faculty looks like their students in regard to race/ethnicity, a student–teacher racial incongruence measure detailed by Blake, Smith, Marchbanks, Wood, and Seibert’s research (2016) is utilized. This value is computed by the following equation:

Classification
Various school types likely require different approaches from administrators. We classify the schools based upon the grades present. The various types included pure high school (base category), pure junior high, combination junior and senior high school, and an elementary through junior high or high school. Elementary was defined as having fifth-grade or lower grade students reported by TEA. Junior high was defined as having seventh or eighth grade. Pure elementary schools and pure sixth-grade schools are not included as the analyses focus upon secondary schools.
Analysis Plan
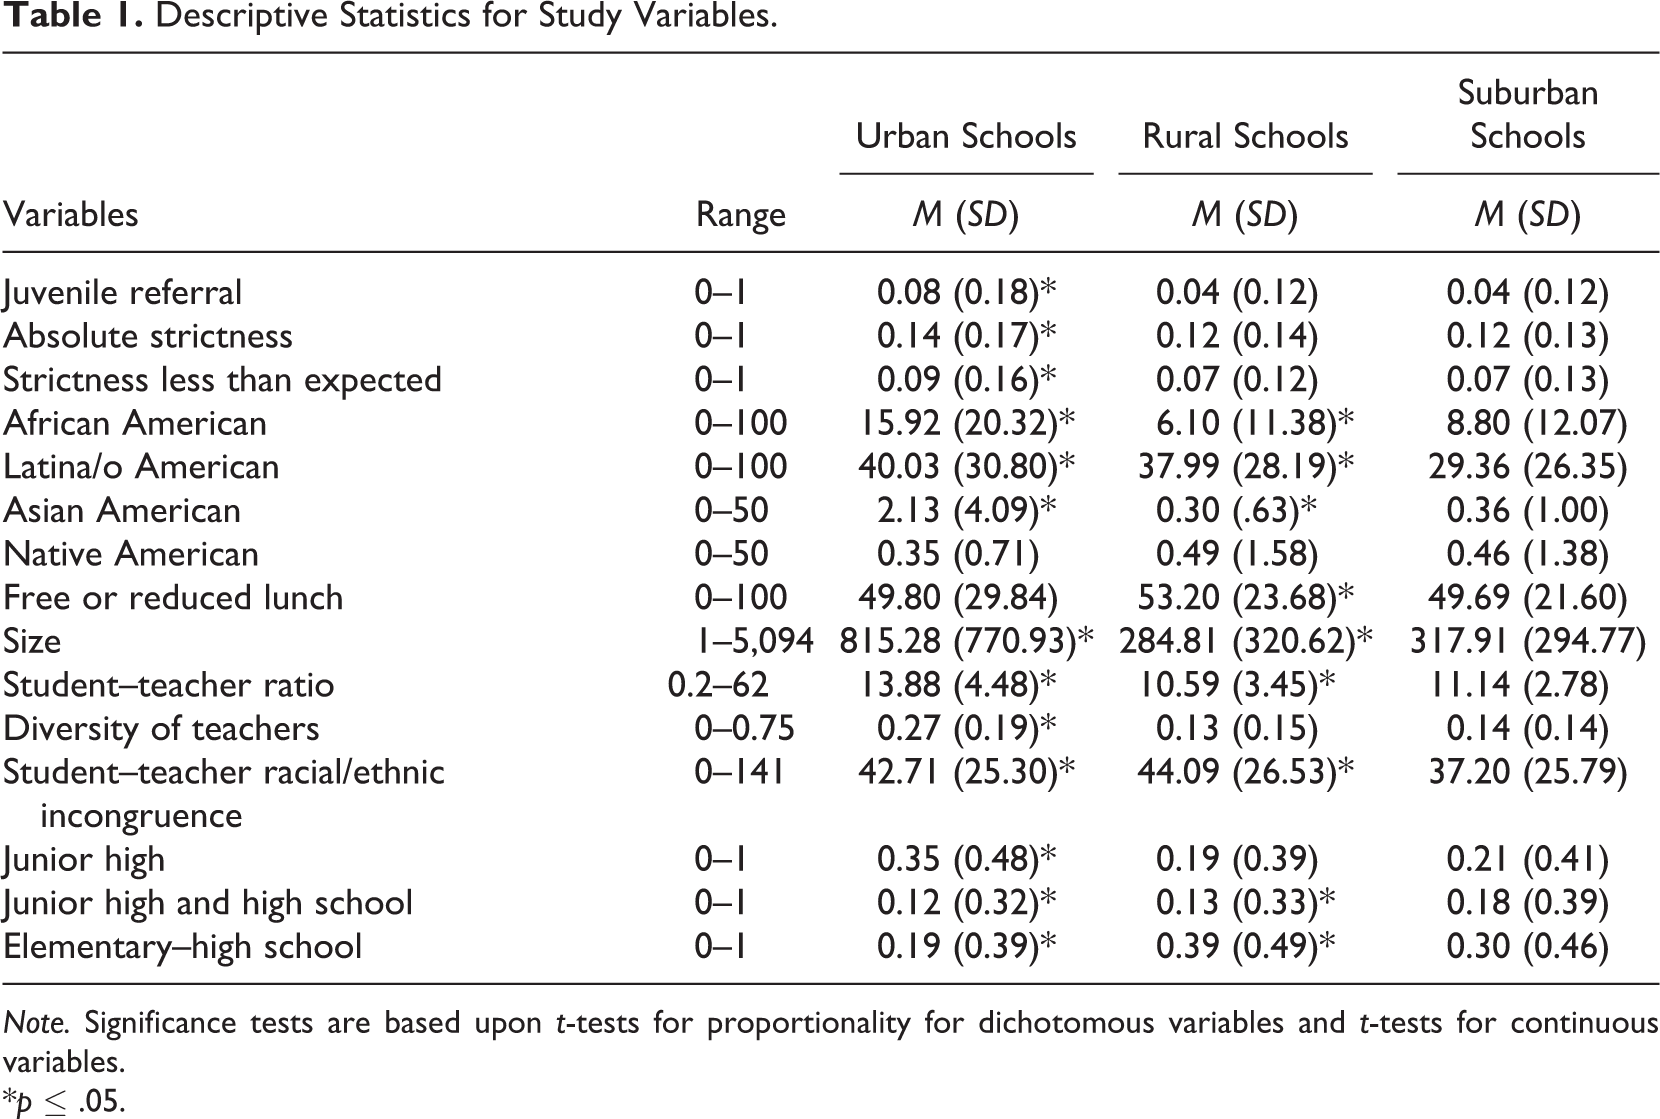
In order to focus upon the differing effect school strictness may have based upon urbanicity, the analyses are separated into three models focusing upon urban, rural, and suburban, respectively. The processes of the analyses included several steps. First, as school context and urbanicity are central to this study, Table 1 presents descriptive statistics for the variables examined in this study across urban, rural, and suburban school contexts. For the analyses, generalized linear models (GLM) using a logistic link function was performed using Stata 13. GLM was used over ordinary least squares (OLS) regression because the dependent variable represented a proportion of individuals who are referred to juvenile justice. As such, this value was constrained to be between zero and one. Further, this approach is not bound by the same assumptions of normality in the error term as OLS. As Hardin and Hilbe (2011) state:
Descriptive Statistics for Study Variables.
Note. Significance tests are based upon t-tests for proportionality for dichotomous variables and t-tests for continuous variables.
*p ≤ .05.
The traditional linear model is not appropriate when assuming that data are normally distributed is unreasonable or if the response variable has a limited outcome set. Furthermore, in many instance in which homoscedasticity is an untenable requirement, the linear model is again inappropriate. The GLM allows these extensions to the linear model. (p. 17)
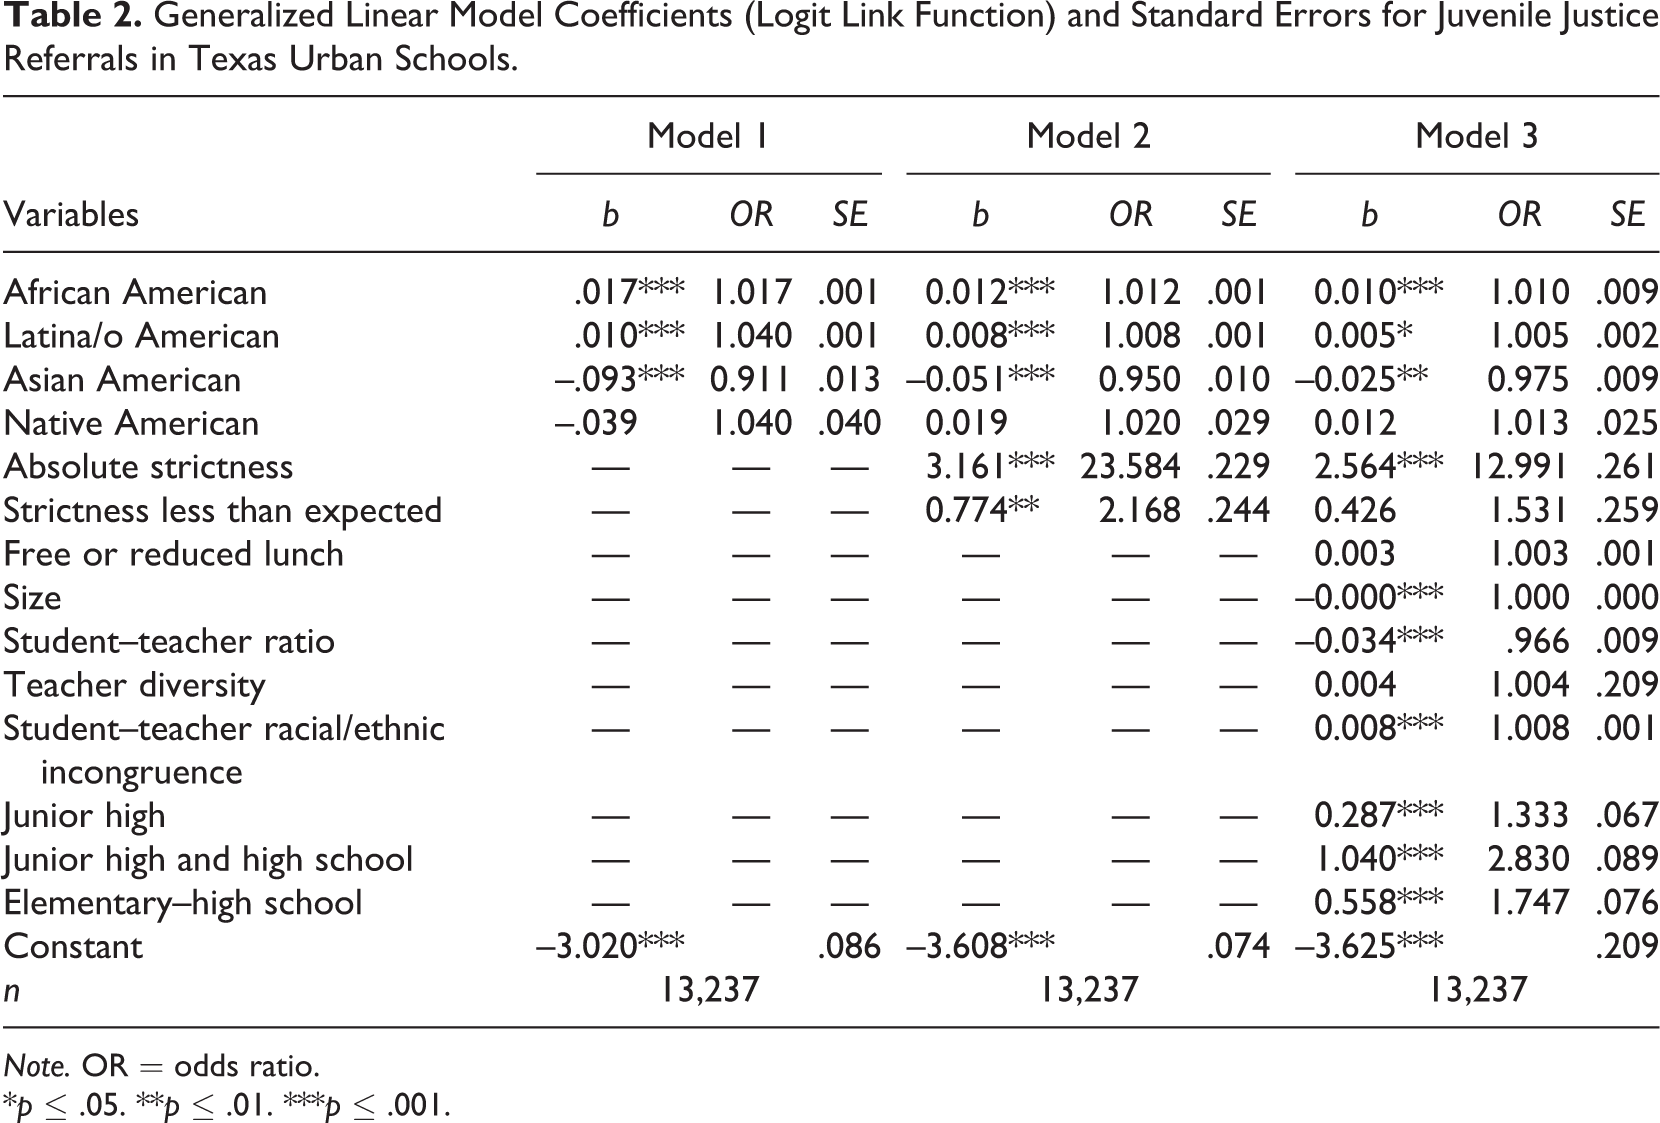
Generalized Linear Model Coefficients (Logit Link Function) and Standard Errors for Juvenile Justice Referrals in Texas Urban Schools.
Note. OR = odds ratio.
*p ≤ .05. **p ≤ .01. ***p ≤ .001.
Generalized Linear Model Coefficients (Logit Link Function) and Standard Errors for Juvenile Justice Referrals in Texas Rural Schools.

Note. OR = odds ratio.
*p ≤.05. **p ≤ .01. ***p ≤ .001.
Generalized Linear Model Coefficients (Logit Link Function) and Standard Errors for Juvenile Justice Referrals in Texas Suburban Schools.

Note. OR = odds ratio.
*p ≤ .05. **p ≤ .01. ***p ≤ .001.
Results
Descriptive Statistics
As presented in Table 1, 8% of urban students receive juvenile justice referrals, while 4% of rural and suburban students receive juvenile justice referrals. In terms of absolute school strictness, urban students attend relatively more extreme schools than their rural and urban counterparts; however, it also appears that there are more lenient schools in urban contexts than in the rural and urban contexts. Urban schools also have the highest proportion of racial and ethnic minorities, while rural and suburban schools are predominately White. As for school characteristics, it appears that urban schools are larger, have higher student–teacher ratios, and have more teacher diversity, and greater student–teacher racial/ethnic incongruence than suburban schools. It also appears that rural schools are poorer, smaller, have lower student–teacher ratios, and greater student–teacher racial/ethnic incongruence than suburban schools.
Urban School Strictness and Juvenile Referrals
Table 2 presents the GLM analysis of school strictness, race and ethnicity, and juvenile justice referrals in urban schools. The baseline Model 1 explores the role of race and ethnicity in association with juvenile justice referrals within urban schools. African American (β = .017, p ≤ .001) and Latina/o American (β = .010, p ≤ .001) students are associated with higher, while Asian American (β = –.093, p ≤ .001) students are linked to lower rates of receiving juvenile justice referrals in urban schools.
In Model 2 of Table 2, school strictness measures are added to the analysis of juvenile justice referrals in urban schools. At this stage of the analysis, as urban school strictness increases in its difference from the mean, juvenile justice referral rates also increase within that school (β = 3.161, p ≤ .001). Results also indicate that urban schools with strictness less than expected is also associated with a further increase in juvenile justice referral rates (β = .774, p ≤ .01). It also appears evident that race and ethnicity still matter in this analysis of juvenile justice referrals in urban schools. African American (β = .012, p ≤ .001) and Latina/o American (β = .008, p ≤ .001) students are still associated with higher, while Asian American (β = –.051, p ≤ .001) students are linked to lower rates of receiving juvenile justice referrals in urban schools.
In Model 3 of Table 2, school characteristics are added to the analysis of juvenile justice referrals in urban schools. While controlling for other school factors, urban school strictness or lenience remains associated with increased juvenile justice referral rates (β = 2.564, p ≤ .001). However, urban schools with strictness less than expected no longer have an additive effect on juvenile justice referral rates. Even while controlling for other urban school characteristics, African American (β = .010, p ≤ .001) students and Latina/o American students (β = .005, p ≤ .05) are associated with higher, while Asian American (β = –.025, p ≤ .01) students are linked to lower rates of receiving juvenile justice referrals in urban schools. Findings also indicate that some urban school characteristics contribute to juvenile justice referral rates in urban schools. As the student–teacher ratio increases, juvenile justice referral rates in urban schools decrease (β = –.034, p ≤ .001). As the student–teacher racial and ethnic incongruence increases, juvenile justice referral rates in urban schools increase (β = .008, p ≤ .001). Urban junior high schools (β = .287, p ≤ .001), urban schools that sustain both junior high and high school (β = 1.040, p ≤ .001), and urban schools that sustain elementary through high school (β = .558, p ≤ .001) have higher juvenile justice referral rates than urban high schools. It is also important to highlight that schools’ strictness measures, stringent and lenient school discipline practices, have the greatest effects on juvenile justice referral rates in urban schools while considering the school characteristics controlled for in this study.
Rural School Strictness and Juvenile Referrals
Table 3 displays the GLM analysis of school strictness, race and ethnicity, and juvenile justice referrals in rural schools. The baseline Model 4 explores the role of race and ethnicity in association with juvenile justice referrals within rural schools. African American (β = .040, p ≤ .001) and Latina/o American (β = .018, p ≤ .001) students are linked to higher rates of juvenile justice referrals in rural schools.
In Model 5 of Table 3, school strictness measures are added to the analysis of juvenile justice referrals in rural schools. At this stage of the analysis, as rural school strictness increases or decreases, juvenile justice referral rates also increase within that school (β = 2.738, p ≤ .01). Race and ethnicity remain associated with juvenile justice referrals in rural schools. African American (β = .027, p ≤ .001) and Latina/o American (β = .015, p ≤ .001) students are linked to higher rates of receiving juvenile justice referrals in rural schools.
In Model 6 of Table 3, school characteristics are added to the analysis of juvenile justice referrals in rural schools. While controlling for other school factors, rural school strictness or lenience remains associated with increased juvenile justice referral rates (β = 2.786, p ≤ .01). Controlling for other school factors in this analysis does not explain away African American and Latina/o American juvenile justice referrals in rural schools (β = .028, p ≤ .001 and β = .015, p ≤ .01, respectively). Findings also indicate that rural schools that sustain both junior high and high school (β = 1.056, p ≤ .001) have higher juvenile justice referral rates than rural high schools. It is also important to highlight that schools strictness measures have the greatest effect on juvenile justice referral rates in rural schools while considering the school characteristics controlled for in this study.
Suburban School Strictness and Juvenile Referrals
Table 4 presents the regression analysis of school strictness, race and ethnicity, and juvenile justice referrals in suburban schools. The baseline Model 7 explores the role of race and ethnicity in association with juvenile justice referrals within suburban schools. African American (β = .034, p ≤ .001) and Latina/o American (β = .018, p ≤ .001) students are associated with higher rates of receiving juvenile justice referrals in suburban schools.
In Model 8 of Table 4, school strictness measures are added to the analysis of juvenile justice referrals in suburban schools. At this stage of the analysis, as suburban school strictness increases or decreases, juvenile justice referral rates also increase within that school (β = 3.677, p ≤ .001). It also appears evident that race and ethnicity still matter in this analysis of juvenile justice referrals in suburban schools. African American (β = .022, p ≤ .001) and Latina/o American (β = .013, p ≤ .001) students are linked to higher rates of receiving juvenile justice referrals in urban schools.
In Model 9 of Table 4, school characteristics are added to the analysis of juvenile justice referrals in suburban schools. While controlling for other school factors, suburban school strictness or lenience remains associated with increased juvenile justice referral rates (β = 3.649, p ≤ .001). It does appear that controlling for other school factors in this analysis does explain away the effect of African American and Latina/o American juvenile presence on justice referrals in suburban schools. Findings also indicate that some suburban school characteristics contribute to juvenile justice referral rates in urban schools. As suburban school size increases, juvenile justice referral rates in suburban schools increase (β = .001, p ≤ .001). Suburban junior high schools (β = .542, p ≤ .001), suburban schools that sustain both junior high and high school (β = .685, p ≤ .001), and suburban schools that sustain elementary through high school (β = .475, p ≤ .001) have higher juvenile justice referral rates than suburban high schools. It is also important to highlight that schools strictness measures, stringent and lenient school discipline practices, have the greatest effects on juvenile justice referral rates in suburban schools while considering the school characteristics controlled for in this study.
Discussion
The current study sets out to address two research questions about the relationship between stringent and lenient school discipline practices on juvenile justice referrals across distinct school locations (i.e., urban, rural, and suburban) as well as the associated racial and ethnic disparities. First, is the relationship between school discipline practices and juvenile justice referrals similar in urban, rural, and suburban contexts? The results do suggest that the relationship between discipline practices and juvenile justice referrals indeed varies in urban, rural, and suburban schools. In general, it appears that urban schools have more strict school discipline practices as well as higher rates of juvenile justice referrals. Second, are there racial and ethnic disparities between school strictness and juvenile justice referrals evident in urban, rural, and suburban contexts? The findings clearly demonstrate, as well as confirm prior studies (Kirk, 2009; Skiba et al., 2014), that African American and Latina/o American students are particularly vulnerable to placement on a “school-to-prison pipeline” in urban and rural schools. Another important finding that warrants highlighting is that both stringent and lenient school practices contribute to increased juvenile justice referrals. However, it is also clear that stringent and punitive school practices are pervasive within rural and suburban schools (Kucphik 2010; Muschert et al., 2013). The following is a deeper analytical discussion about these racial and ethnic educational disparities as well as the implications, limitations, and future research associated with this study’s findings.
Urban Schools, Strictness, and Disproportionate Referrals
Results suggested that, in urban schools, the racial and ethnic composition of the student school population significantly influenced juvenile justice rates, with higher amounts of African American students being associated with higher rates of referrals to juvenile justice, net the effects of other variables in our analyses. This is consistent with previous research that has extensively documented significant disparities in school discipline for African American students (Kirk, 2009; Rios, 2011; Rocque & Paternoster, 2011; Skiba et al., 2014; Sykes et al., 2015). It also appears that a higher proportion of Asian American students is significantly associated with having lower rates of referrals. This is a particularly important as Asian American students’ experiences with school discipline have been scantly documented and warrants further investigation. Moreover, as urban school campuses move away from the expected level of strictness, either by being too strict and punitive in their discipline practices or by being too lenient in their school discipline practices, they experience higher rates of juvenile justice referrals. This is a notable finding as it aligns with the current school climate literature which suggests that overly punitive or permissive school climates, which include school discipline practices, can result in negative outcomes for students (Cornell & Huang, 2016; Pellerin, 2005).
The results for urban schools also generated some interesting findings regarding the control variables that were added in the final model. Specifically, junior high, combined junior high and high school, and combined elementary and secondary schools were significantly associated with higher rates of referrals when compared to the based group of pure high schools. These findings imply that age is not a protective factor for juvenile justice referrals in Texas, with students being referred and disciplined at younger and younger ages. Given that children receive near universal protection in a variety of social contexts, this finding speaks volumes to how discipline practices are being increasingly applied to young children, particularly because this finding does not seem to be limited to this study (see Goff, Jackson, Di Leone, Culotta, & DiTomasso, 2014; U.S. Department of Education, 2014). However, caution is encouraged in the interpretation of this finding since individuals are tried as adults upon turning 17 in Texas. This excludes many of the high school students from potential juvenile justice referral—potentially leading to the observed findings.
A second important but unexpected finding was the association between student–teacher racial incongruence and increased numbers of juvenile justice referrals. This finding represents a unique and important advancement in the school-to-prison pipeline literature as much of the work has focused on the proximal effects of student–teacher racial/ethnic match on student discipline outcomes, with few studies considering how the lack of shared racial/ethnic match between teachers and students can influence juvenile justice contact (Blake et al., 2016). While it is possible that some teachers employ (whether intentional or unintentional) bias when interpreting the behavior of racial and ethnic minority students, the exact causal mechanism at play here is unknown and thus warrants further investigation. Some research, however, has already began to move in this direction.
For example, Blake et al. (2016) introduced the cultural synchrony hypothesis. The cultural synchrony hypothesis holds that the presence of different cultural understandings between pupils and teachers can lead to poorer student outcomes. As such, Blake et al. (2016) find that while increased student–teacher racial congruence is especially positive for females and minority students, all children can benefit from such arrangements. This framework is further supported by several studies that demonstrate that teachers rate children from their own racial and/or gender group higher than other students (Bates & Glick, 2013; Dee, 2005; Saft & Pianta, 2001), as trend that can be seen early on in life as demonstrated by Howes and Shivers (2006) in their study of daycare children. Similarly, using experimental data, Dee (2004) demonstrates that both African American and White students with same-race teachers had higher reading and math achievement.
With that said, research exploring the role of student–teacher racial incongruence with discipline practices is still limited, especially those using nationally representative data sets. Considering that over 80% of U.S. public school teachers (Goldring, Gray, & Bitterman, 2013) are White American and that it is projected that racial and ethnic minorities will represent approximately half of the U.S. public school student population (U.S. Census Bureau, 2013), more research about student–teacher racial incongruence and punishment practices are indeed warranted.
It is significant to note that while this study controlled for multiple factors, the results for urban schools demonstrated racial and ethnic disparities in juvenile justice referrals in all three models even when the level of campus strictness and other measures of school disorganization were considered, similar to what has been found when looking at school discipline rates (see also Gregory et al., 2010; Noltemeyer & Mcloughlin 2010). Consequently, it appears that race and ethnicity remains a contributing factor to the observed DMC for students from urban schools to juvenile justice systems.
Rural Schools, Suburban Schools, Strictness, and Disproportionate Referrals
In rural schools, having higher amounts of African American and Latina/o American students is associated with higher rates of referrals to the juvenile justice system, which remained significant after both school strictness variables and other indicators were added to the model. This finding implies evidence for DMC in rural schools when campus strictness and other school-level variables are controlled. Similar to rural campuses, suburban campuses with higher amounts of African American and Latina/o American students had higher rates of referrals. However, this effect did not remain significant after both school strictness variables were added. When considering the main variable of interest, school strictness, results yielded interesting findings for rural and suburban schools. For both school types, extreme campus strictness was associated with higher rates of referrals and statistically, there is no difference in the effect between strict schools and lenient schools on juvenile justice referral rates.
Similar to the results for urban campuses, the results from both rural and suburban schools also generated significant findings regarding the type of campus. In rural schools, combined junior high and high schools were significantly associated with higher rates of referrals when compared to the based group of pure high schools. Among suburban schools, however, all three types of campuses—junior high, combined junior high and high school schools, and elementary schools combined with secondary schools—were significantly associated with higher rates of referrals when compared to the based group of pure high schools, again suggesting that students are being referred at younger and younger ages. As mentioned above, this finding could be driven by the substantive portion of high school students that are ineligible for juvenile justice referral due to their age; however, the findings warrant replication.
Additionally, results for suburban schools also generated some interesting findings for the control variables that were added in the final model. Specifically, school size was shown to be significantly associated with higher rates of referrals. Existing research suggest that school characteristics (such as school size) impact school discipline practices and student achievement. School size is often associated with quality of learning environments, quality of student–teacher relationships, and lower levels of school punishment (Gottfredson, 2001; May, 2014; Nolan, 2011). However, as Nolan (2011) notes, school size exacerbates inequality in an already stratified system, particularly because larger schools often have limited financial resources and have a higher level of perceived need for police presence or tough disciplinary policies when compared to their small counterparts. In sum, the findings from this study suggest that the relationship between school typology, juvenile justice referrals, school strictness, and racial and ethnic disparities is complex and multidimensional.
Limitations and Future Directions
This study is not without its own limitations. First, there are number of alternatives to address school misbehavior and disorder that were not accounted for in this study. There are a number of researchers who denote that a restorative justice approach would allow students to make amends to those they harmed without criminalizing them in the process (May, 2014; Portillos et al., 2012; Rios, 2011; Shedd, 2015). A restorative justice approach could also utilize a number of formats to meet the needs of students and communities and develop solutions agreeable to all parties involved (May, 2014; Portillos et al., 2012; Rios, 2011; Shedd, 2015). Future research should compare if restorative justice policies are less likely to be associated with disproportionate punishment and referrals for racial and ethnic minority students, especially within urban schools. Second, of course misbehaving and deviant or delinquent acts warrant a disciplinary sanction; however, research also demonstrates that racial and ethnic minority youth are overrepresented in rates of school punishment for even minor forms of misbehavior such as dress-code violations, chewing gum, falling asleep in class, and the like (Crenshaw, Ocen, & Nanda, 2015; Kupchik, 2010; Morris, 2016; Rios, 2011; Shedd, 2015). Future research should certainly build on this study’s limitation by examining the type, level, and seriousness of misbehavior or delinquent acts that are linked to school punishment rates. As suggested by prior research (Trulson, Haerle, Caudill, & DeLisi, 2016; Rocque & Paternoster, 2011; Rocque & Snellings, In Press; Wright, Morgan, Coyne, Beaver, & Barnes, 2014; Zimmerman & Rees, 2014), youth engagement in deviance and delinquency matter in the school-to-prison pipeline which is sometimes not fully considered in analyses. For example, disproportionate school punishment or juvenile justice referral rates may result from disproportionate participation in behavior that would warrant such action. In this study, however, we could not examine whether disproportionate referrals for students from racial and ethnic minorities were supported by involvement in a disproportionate level of acts that warranted juvenile justice referral compared to other racial and ethnic groups examined in this analysis. More specific data allowing an examination of the full range of behavior would provide more specific insight into the potential reasons for disproportionate punishments experienced by racial and ethnic minorities. Despite the limitations associated with this study, this study does provide evidence to set forth an agenda for the continued exploration of the connections between stringent and lenient school discipline practices on juvenile justice referrals across distinct school locations.
Conclusion and Implications
In sum, the results for this study suggest that both campus strictness and leniency influence juvenile justice referral rates. Findings provide evidence against the use of zero-tolerance and overly punitive discipline policies as noted in prior research as well as against overly permissive discipline practices that do not allow for correction (Rios, 2011; Skiba et al., 2014). This study’s findings also suggest that a balanced approach between strictness and leniency with school punishment practices in order to meet the unique needs of their campus (Cornell & Huang, 2016; Pellerin, 2005). It is evident that school climate and broader school discipline practices at the campus level play a central role in the school-to-prison pipeline process.
Footnotes
Authors’ Note
The research presented here utilizes confidential data from the State of Texas supplied by the Texas Education Research Center at The University of Texas at Austin. The authors gratefully acknowledge the use of these data. The opinions, findings, views, and conclusions or recommendations expressed in this publication are those of the authors and should not be attributed to the Texas ERC or any of the funders or supporting organizations mentioned herein, including The University of Texas, the State of Texas, or the OJJDP. Any errors are attributable to the authors.
Acknowledgments
Gratitude is extended for the helpful comments and constructive suggestions from the Youth Violence and Juvenile Justice editor, special issue coeditors, and blind reviewers throughout the development of this research article. Appreciation is conveyed for the support provided by the Racial Democracy, Crime and Justice-Network (RDCJ-N).
Declaration of Conflicting Interests
The author(s) declared no potential conflicts of interest with respect to the research, authorship, and/or publication of this article.
Funding
The author(s) disclosed receipt of the following financial support for the research, authorship, and/or publication of this article: Portions of this project were supported by Grant # (2012-JF-FX-4064) awarded by the Office of Juvenile Justice and Delinquency Prevention, Office of Justice Programs, U.S. Department of Justice.