
Abstract
Research shows that adverse events experienced during childhood (i.e., adverse childhood experiences [ACEs]) are problematic, but few studies have examined race differences in the prevalence and impact of ACEs on delinquency. This study investigated these relationships using prospective data from approximately 600 high-risk families in the Longitudinal Studies of Child Abuse and Neglect. Ten ACEs were measured, five types of child maltreatment and five types of household dysfunction. White youth experienced a significantly greater number of ACEs (4.08) compared to Black youth (2.90) and a greater prevalence of seven individual ACEs. According to logistic regression analyses, the number of ACEs significantly increased the likelihood of self-reported alcohol use, marijuana use, violence (in some models), and arrest at age 16 among Blacks but not Whites; race differences were statistically significant for alcohol use, marijuana use, and arrest. The findings support the need for juvenile justice officials to recognize the trauma histories of youth offenders when determining appropriate treatment and sanctions.
Adverse childhood experiences (ACEs) are potentially stressful and/or traumatic events that can lead to a variety of negative physical, mental, and behavioral health problems, including premature death (Felitti et al., 1998; Sacks, Murphey, & Moore, 2014). Although ACEs have been defined somewhat differently across studies (Felitti et al., 1998; Finkelhor, Shattuck, Turner, & Hamby, 2015; Flaherty et al., 2009), they include multiple types of maltreatment (e.g., physical, sexual, and emotional abuse and neglect) and household dysfunction (e.g., intimate partner violence [IPV], substance use/abuse, and criminality by parents or other household members).
The first study to demonstrate the consequences of ACEs found that the greater the number of seven types of childhood adversities recalled by a general population of adults in San Diego, the greater their likelihood of reporting health problems including obesity, depression, suicide attempts, alcoholism, illicit drug use, and sexually transmitted diseases (Felitti et al., 1998). The fact that childhood events could have such a large and sustained impact on adult behaviors was a novel and important research finding, as was the finding that ACEs were relatively common; more than half of the sample had experienced at least one ACE in their lifetime (Felitti et al., 1998). National surveillance data confirm this finding. According to the 2011/2012 National Survey of Children’s Health, conducted with 95,677 parents from all 50 states, 46% of children had endured at least one ACE and 11% had experienced three or more ACEs by age 18 (Sacks et al., 2014). Other research indicates even greater exposure to ACEs among higher risk populations such as low-income individuals and youth involved in the juvenile justice system (Baglivio, Epps, et al., 2014; Burke, Hellman, Scott, Weems, & Carrion, 2011; Cronholm et al., 2015; Flaherty et al., 2009).
Since the initial study by Felitti et al. (1998), other studies have also shown that an accumulation of ACEs is associated with a greater likelihood of physical, mental, and/or behavioral health problems in adulthood (Cronholm et al., 2015; Edwards, Holden, Felitti, & Anda, 2003; Mersky, Topitzes, & Reynolds, 2013; Rothman, Edwards, Heeren, & Hingson, 2008). However, the mechanisms that link these childhood adversities to long-term health problems are not clear. Felitti and colleagues (1998) hypothesized that ACEs lead to health-compromising behaviors in the short term as a means of coping with adversities and that these behaviors negatively affect health in the long term. Life-course developmental theories in criminology suggest similar processes, whereby adolescent delinquency can lead to negative effects in later stages of the life course (e.g., via “snares,” see Moffitt, 1993, or cumulative continuity, see Sampson & Laub, 1993), including premature death (Teplin et al., 2014).
Although Felitti and colleagues (1998) posited that ACEs would increase risky behaviors like substance use and delinquency during adolescence, few studies have tested this premise. Some criminological research has shown that particular ACEs increase the likelihood of adolescent delinquency (e.g., parent criminality, see Farrington, Coid, & Murray, 2009, and physical abuse, see Widom, 1989), but relatively few studies have investigated whether an accumulation of ACEs increases illegal behaviors by adolescents.
The purpose of the current study is to apply a criminological perspective to the examination of ACEs by investigating the impact of ACEs on adolescent substance use, violence, and arrest. We also examine race differences in the prevalence and effects of ACEs, a topic rarely explored in the ACEs literature, but one that is important given race differences in rates of delinquency, including substance use, violence, and contact with the justice system (Johnston, O’Malley, Miech, Bachman, & Schulenberg, 2014; Puzzanchera, 2014; Sampson, Morenoff, & Raudenbush, 2005). Further exploration of these issues can inform both the substantive literature and current initiatives calling for trauma-informed services for juvenile delinquents (U.S. Attorney General’s National Task Force on Children Exposed to Violence, 2012). Knowing more about the types of trauma experienced by youth, the impact of these traumas on delinquency, and whether or not exposure to and influence of ACEs varies by race can help ensure that appropriate prevention and intervention services are received by those most in need.
Literature Review
Theoretical Explanations of the Relationship Between ACEs and Adolescent Delinquency
Although few criminologists have examined the effects of ACEs, the hypothesis that childhood maltreatment and dysfunctional households can increase the likelihood of health-compromising behaviors like substance use and violence is congruent with general strain theory (Agnew, 1992, 2006) and social learning theory (Akers, 1985). While the current study is not designed to test these theories, we briefly review these perspectives to provide a theoretical foundation for the research.
According to Agnew’s (1992) general strain theory, individuals engage in delinquent behavior as a response to negative feelings generated by exposure to strains/stressors. More specifically, Agnew argues that strains lead to negative emotions (including anger and depression) and that these negative emotions cause individuals to engage in criminal behavior to cope with strains. Agnew (2001) identifies childhood maltreatment, especially physical and psychological abuse, as a stressor especially likely to result in crime. He also states that strains that have a long duration and that are unlikely to be resolved are particularly likely to cause strain and criminal coping. Although he does not discuss household dysfunctions like parental criminality, substance abuse, or mental illness, these stressors are likely to be long-lasting and often go unresolved and therefore could produce criminal behaviors. Finally, Agnew (1992) emphasizes that there is a threshold effect of strain on delinquency. Although one or two strains may not result in crime, multiple stressors will “overwhelm coping resources” and be especially likely to generate criminal behavior (Agnew, 1992, p. 65).
Social learning theory posits that individuals learn to engage in crime during interactions with others and that children are especially likely to learn delinquent behaviors through interactions with family members (Akers, 1985). Learning occurs when one is exposed to criminal role models, imitates them, learns definitions (i.e., attitudes) favorable to lawbreaking from them, and is differentially reinforced for his or her delinquency by them (Akers, 1985, 2009). Since ACEs include acts of abuse and neglect perpetrated by parents, as well as other types of household crime (e.g., IPV or substance use/abuse), by definition, children who experience ACEs have been exposed to criminal role models. Congruent with social learning theory, children who are victimized by their parents or who see household members engaging in substance use or violence may imitate these behaviors. Indeed, much research demonstrates that maltreatment increases subsequent involvement in crime (e.g., Malvaso, Delfabbro, & Day, 2015; Widom, 1989) and that parent substance use influences children’s substance use (e.g., Hawkins, Catalano, & Miller, 1992; Masten, Faden, Zucker, & Spear, 2007). Children exposed to ACEs may also see that crime does not always lead to punishment (e.g., if a parent is not arrested for his or her illegal behavior), generating a lack of reinforcement that can contribute to children’s involvement in crime.
Empirical Research on ACEs and Adolescent Delinquency
The first study to examine ACEs involved a sample of 8,506 adults, most of whom were White, middle class, and over the age of 50 (Felitti et al., 1998). Respondents completed mailed surveys that asked them to recall seven types of ACEs that occurred during their first 18 years of life, including psychological, physical, and sexual abuse; IPV experienced by their mothers; and residence in a household with someone who was a substance abuser, mentally ill, or ever imprisoned. Respondents also reported their current health problems. The results indicated that ACEs were interrelated, with those reporting one ACE also likely to report additional ACEs, and that there was a graded effect of ACEs on health problems, with the greatest likelihood of problems evidenced among those with the greatest number of ACEs (Felitti et al., 1998).
This study generated awareness about the negative effects of ACEs and led to several replications with adult participants (Anda et al., 1999; Dube, Anda, Felitti, Edwards, & Croft, 2002; Dube, Anda, Felitti, Edwards, & Williamson, 2002; Dube et al., 2003; Wade et al., 2016). Like the original study, most of these replications have demonstrated a graded effect of ACEs on behavioral health problems, including alcohol and drug use/abuse. However, all of this research has relied on retrospective reports from adults who are asked to recall traumatic events that occurred many years in the past. Such reports may not be reliable, as individuals may not accurately recall such events due to memory loss, recall bias, embarrassment, and/or emotional distress (Cicchetti & Toth, 2005; Smith, Ireland, Thornberry, & Elwyn, 2008).
The first ACEs study and its replications have focused on adult health outcomes, but some more recent research has investigated the effects of ACEs on adolescent health problems, including poor physical health, obesity, emotional distress, delinquency, and violence (Baglivio, Epps, et al., 2014; Burke et al., 2011; Duke, Pettingell, McMorris, & Borowsky, 2010; Finkelhor, Shattuck, Turner, & Hamby, 2013; Flaherty et al., 2013). Some of the most rigorous studies in this body of research have relied on prospective data to measure ACEs during childhood and examined the effects of these adversities on subsequent health problems in adolescence. Notably, several studies have involved analysis of data from the Longitudinal Studies of Child Abuse and Neglect (LONGSCAN), a project with prospective data collected from 1,354 children and their caregivers on a variety of ACEs, including child maltreatment (i.e., psychological, physical, and sexual abuse and neglect) and household adversities (e.g., household substance use/abuse, mental illness, criminality, and IPV; Runyan et al., 1998). Analysis of these data has indicated that the greater the number of ACEs reported by LONGSCAN participants, the greater their likelihood of experiencing poor physical health at ages 12 (Flaherty et al., 2009), 14 (Flaherty et al., 2013), and 18 (Thompson et al., 2015). To our knowledge, the LONGSCAN data have not yet been analyzed to determine the impact of ACEs on adolescent delinquency, as our study proposes to do.
In fact, only a few studies have examined the relationship between ACEs and adolescent delinquency or substance use/abuse (e.g., Baglivio, Epps, et al., 2014; Duke et al., 2010; Perez, Jennings, & Baglivio, 2016; Zettler, Wolff, Baglivio, Craig, & Epps, 2017). Nonetheless, available research generally supports the larger ACEs literature and finds a graded effect between ACEs and adolescent delinquency. For example, in one of the only ACEs studies involving a universal sample of youth (136,549 Michigan students in Grades 6, 9, and 12), Duke, Pettingell, McMorris, and Borowsky (2010) found that the greater the number of self-reported ACEs, the greater the likelihood of self-reported delinquency and violence. Measuring ACEs with a variety score including six possible ACEs, the authors found that each additional ACE increased the risk of fighting by 60–65% and carrying a weapon by 72–74% (Duke et al., 2010).
A series of studies has analyzed data from 5,000 to over 60,000 youth offenders referred to the Florida juvenile justice system (e.g., Baglivio, Jackowski, Greenwald, & Howell, 2014; Baglivio, Wolff, Piquero, & Epps, 2015; Perez et al., 2016; K. T. Wolff, Baglivio, & Piquero, 2017). This research has measured ACEs using a variety score indicating the presence of 9 or 10 ACEs, including psychological, physical, and sexual abuse, emotional neglect, physical neglect, as well as household violence between caregivers, substance use/abuse, mental illness, and criminality, and (in some studies) parent separation or divorce. Information on ACEs is derived from the Community Positive Achievement Change Tool, a risk/needs assessment administered by juvenile probation officers, along with information from youth, parents, and other administrative data. Based on a sample of 64,329 offenders involved in the Florida juvenile justice system, Baglivio, Epps, et al. (2014) found that 96–97% had experienced at least one ACE in their lifetime and 40% had experienced four or more ACEs. These rates far exceed those of the general population and suggest a relationship between ACEs and offending. Other analyses of the Florida data have shown that juvenile offenders experiencing more ACEs, compared to those with fewer ACEs, have a greater likelihood of receiving residential placement (i.e., incarceration) following arrest (Zettler et al., 2017), being a serious violent offender (i.e., committing three or more felonies, at least one of which is a violent offense; Fox, Perez, Cass, Baglivio, & Epps, 2015; Perez et al., 2016) and having an early onset of offending (Baglivio et al., 2015). Those with more ACEs have also been shown to be more likely to reoffend (Craig, Baglivio, Wolff, Piquero, & Epps, 2017; K. Wolff & Baglivio, 2017) and to reoffend more quickly (K. T. Wolff et al., 2017) after completing a community-based program. One study also found that the number of ACEs reported by youth offenders predicted their likelihood of having substance abuse problems, as rated by juvenile justice officials (Perez et al., 2016).
These studies have provided some insight into the relationship between ACEs and adolescent delinquency. However, the study by Duke et al. (2010) relied on cross-sectional data, which could not ensure temporal ordering between ACEs and outcomes. In addition, Duke et al. (2010) and those drawing on data from offenders in the Florida juvenile justice system have relied on retrospective reports of ACEs; although since the data are collected from adolescents, the problem of retrospective recall is somewhat minimized (Baglivio et al., 2015). Another limitation of this body of research is the inattention to the impact of ACEs on adolescent alcohol or substance use, behaviors that are common during this stage of life (Miech et al., 2017) and which can lead to serious health problems, including subsequent drug/alcohol abuse and involvement in crime (Donovan, 2004; Stoolmiller & Blechman, 2005). The current study seeks to fill these gaps by using prospective data to measure ACEs during childhood (ages 0–12) and investigating the impact of ACEs on substance use, delinquency, and arrest at age 16.
Race Differences in ACEs and Adolescent Delinquency
The current study also seeks to expand upon prior research by examining race differences (for Whites compared to Blacks) in the prevalence and impact of ACEs. This focus is important, given ample data indicating racial disparities in most public health problems (Meyer, Yoon, & Kaufmann, 2013), including crime, although race differences in adolescent delinquency depend on the specific behavior examined. According to data from middle and high school students, Whites report more alcohol use than Blacks, but Blacks report more marijuana use (Johnston et al., 2014; Kann et al., 2015). Some research indicates that Blacks report more violent behaviors (Kann et al., 2015; Sampson et al., 2005), although racial differences in violence are less apparent in studies relying on higher risk samples (Piquero & Brame, 2008). Nonetheless, official data clearly show that Blacks are arrested and incarcerated at higher rates compared to Whites (Puzzanchera, 2014).
Various explanations have been posited to explain these differences, but whether or not they can be attributed to a differential exposure to or influence of childhood adversities is unclear. Among the few studies that have reported racial/ethnic differences in the prevalence of ACEs, most have found that minority youth experience a greater number of ACEs compared to Whites (Cronholm et al., 2015; Duke et al., 2010; Slopen et al., 2016). However, in studies relying on a higher risk sample, youth involved in the Florida juvenile justice system, Whites had higher total ACE scores compared to Black and Hispanic youth (Baglivio & Epps, 2016; DeLisi et al., 2017; Perez et al., 2016). Other studies find that racial differences in the prevalence of ACEs vary according to the specific ACE examined (Hunt, Slack, & Berger, 2017; Schilling, Aseltine, & Gore, 2007; Slopen et al., 2016). For example, among children participating in the Fragile Families study, Black youth were more likely to have experienced child maltreatment and parental incarceration, while Whites were more likely to have experienced parental substance abuse (Hunt et al., 2017).
In one of the few studies to analyze the effects of ACEs by race/ethnicity, Schilling, Aseltine, and Gore (2007) found that where racial differences were evidenced in the impact of ACEs (measured singularly and as a summed score) on depression, illegal drug use, and delinquency at ages 18–20, the effects of ACEs were stronger for Whites compared to Blacks. Hunt, Slack, and Berger (2017), who examined the impact of ACEs experienced from ages 0 to 5 on externalizing behaviors reported by parents at age 9, also found a stronger impact of ACEs for Whites versus Blacks. Both of these studies suggest that Blacks may be better able than Whites to cope with childhood adversities and that this capability may be evidence of what Rutter (2012) refers to as “steeling effects.” Rutter’s (2012) explanation of this concept is that early exposure to stress provides an opportunity for individuals to learn how to positively respond to adversity, such that later exposure to stressors will be less harmful. According to Hunt et al. (2017), relative deprivation provides an alternative explanation for why Whites may be more susceptible to the negative effects of ACEs compared to Blacks. That is, because Blacks in the United States tend to suffer from more adversity in general compared to Whites, including greater economic deprivation, racism/harassment, and residence in high-crime neighborhoods, the addition of more adversities may not have as great an impact on them as for Whites (Hunt et al., 2017).
At the same time, both Rutter (2012) and Agnew (1992) suggest a threshold effect of adversity, whereby the accumulation of stressors over time should be more likely to lead to negative outcomes than exposure to fewer stressors. This process has been used to explain why Blacks and other minority groups may be more negatively impacted by ACEs compared to Whites. According to the threshold effect hypothesis, when Blacks, who experience more economic and social disadvantage compared to Whites, also experience maltreatment and household dysfunction, their coping skills may be overwhelmed and they may be more likely to respond to ACEs with health-compromising behaviors (Cronholm et al., 2015; Lansford et al., 2007). In support of this premise, a study of 4,733 youth offenders involved in the Florida juvenile justice system found that the number of ACEs significantly increased a youth’s odds of residential placement for Blacks but not Whites (Zettler et al., 2017). However, other analyses of data from the Florida juvenile justice system reported that the relationship between ACEs and recidivism was significant for Black and White offenders (Craig et al., 2017; K. Wolff & Baglivio, 2017), although some race differences in the impact of ACEs have emerged depending on the specific type of recidivism assessed (DeLisi et al., 2017).
The Current Study
As evident in this review of the literature, prior research suggests that ACEs are related to adolescent health problems, and though delinquency has rarely been examined, it is likely that exposure to multiple ACEs would increase the likelihood of substance use, violence, and contact with the juvenile justice system. Whether or not exposure to ACEs or the impact of ACEs on delinquency varies by race is less certain. According to the few available studies on this topic, there is some evidence that Blacks experience more ACEs, but Whites are more negatively affected by them, but other research suggests the opposite relationships.
The current study seeks to address gaps in the ACEs literature by examining the relationship between ACEs and adolescent delinquency among high-risk youth participating in the LONGSCAN project. Two research questions are examined: (1) to what extent does the prevalence of ACEs differ according to race? and (2) to what extent does the association between ACEs and adolescent substance use (alcohol and marijuana use), violence, and arrest differ by race? Reliance on the LONGSCAN prospective data improves on past research by measuring ACEs as children age, rather than relying on retrospective reports from adolescents or adults. ACEs are also measured using a combination of official, parental, and child-reported data, which helps improve the reliability and validity of the data. Further, the current study extends prior research by examining the association between ACEs and adolescent problem behaviors according to youth race, in an attempt to explain why youth may be differentially involved in delinquent behaviors.
Method
Study Design and Participants
The LONGSCAN study was designed to investigate the causes and consequences of child maltreatment using prospective data from families in five geographically diverse regions of the United States (Baltimore, Chicago, San Diego, Seattle, and Chapel Hill, NC; Runyan et al., 1998). A high-risk sample of 1,354 children aged 4–6 years old and their caregivers (primarily female) was constituted in 1990. Participants were selected based on having a history of maltreatment according to Child Protective Service (CPS) agencies or considered at risk for maltreatment based on risk factors such as parents’ low socioeconomic status (SES) and maternal substance use. At baseline, 52% of the 1,354 youth participants were female and 48% were male, 26% were White, 53% were Black, 7% were Hispanic, and 14% reported their race/ethnicity as mixed or other.
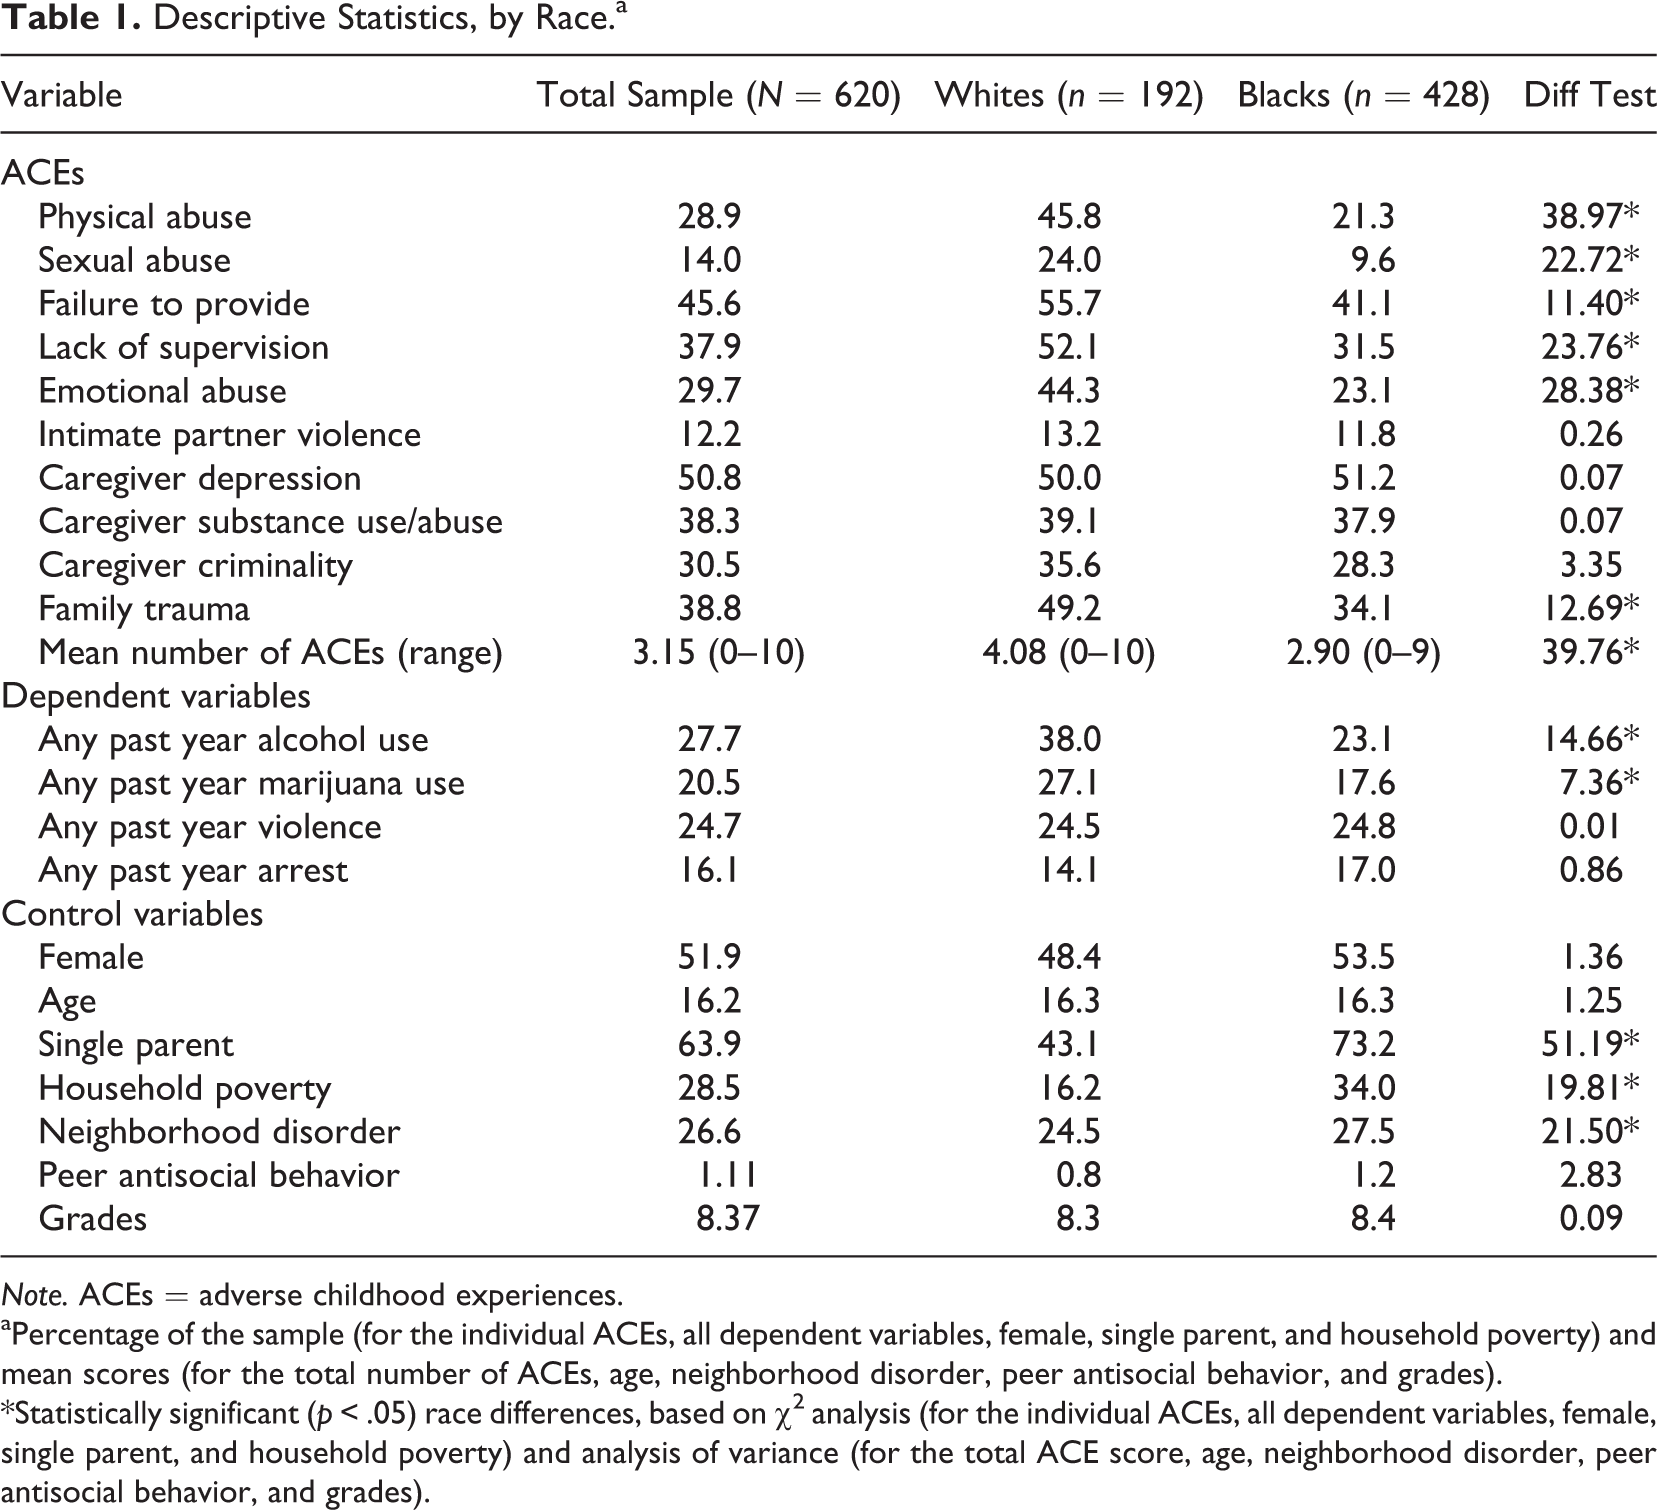
Prospective data were collected from children and caregivers every 2 years from baseline (i.e., ages 4–6) to age 18. The current study relies on information from baseline through age 16, when 831 youth (61%) remained in the study. Only White and Black participants are included in the analysis sample, given the small number of youth in other racial/ethnic groups. At the age 16 interview, 620 participants (192 Whites and 428 Blacks) provided information on the outcomes of interest, representing 58% of the 1,075 White and Black participants recruited at baseline. Although this attrition rate is somewhat high, there are no significant differences in any of the participant demographic characteristics (e.g., age, gender, family income, and single-parent status), the mean number of ACEs, or the prevalence of any of the individual ACEs between those present at baseline and those remaining in the study at age 16. As shown in Table 1, among the 620 Whites and Blacks reporting outcomes at age 16, about 52% were female, and the mean age was 16.27 (range = 14.95–17.60 years). Approximately two thirds (64%) of the sample resided in a household with a single, divorced, separated, or widowed parent, and 29% of the sample was considered to live in poverty, with an annual household income less than US$15,000.
Descriptive Statistics, by Race.a
Note. ACEs = adverse childhood experiences.
aPercentage of the sample (for the individual ACEs, all dependent variables, female, single parent, and household poverty) and mean scores (for the total number of ACEs, age, neighborhood disorder, peer antisocial behavior, and grades).
*Statistically significant (p < .05) race differences, based on χ2 analysis (for the individual ACEs, all dependent variables, female, single parent, and household poverty) and analysis of variance (for the total ACE score, age, neighborhood disorder, peer antisocial behavior, and grades).
Measures
The measures for this study are based on data collected from CPS agencies, primary caregivers, and children and are drawn from multiple waves of the study. Descriptive information regarding the independent, dependent, and control variables is provided in Table 1.
Independent Variables—ACEs
Ten types of ACEs were measured, five representing maltreatment and five representing household dysfunction. These measures are similar to those used in prior research, particularly past studies that have used the LONGSCAN data to examine ACEs (Flaherty et al., 2006, 2013; Thompson et al., 2015). The ACEs measure also includes a type of household trauma, illness or death of a parent or sibling, which was not included in prior LONGSCAN studies, because general strain theory prioritizes this type of stressor as particularly likely to lead to delinquency (Agnew, 2001) and because some researchers (Finkelhor et al., 2013; Mersky, Janczewski, & Topitzes, 2017) have recommended its inclusion in ACEs measures. 1 All ACEs were coded as binary variables and represent the occurrence of adversity experienced at least once during childhood, defined in this study as between ages 0 and 12. Although studies based on adult retrospective reports have used ages 0–18 to assess the lifetime occurrence of ACEs (e.g., Cronholm et al., 2015; Dube et al., 2003; Felitti et al., 1998), we restrict our measure to events occurring during the developmental stage traditionally defined as “childhood,” ages 0–12 (Collins, 1984), and to ensure proper temporal ordering between the independent and dependent variables, which are measured at age 16.
Data on childhood maltreatment are based on CPS agency records from the states participating in LONGSCAN. Although official reports are known to underestimate the number of youth who have experienced maltreatment, they have several advantages compared to self-reported information, especially data collected retrospectively from adults, who may have difficulty in accurately recalling events that occurred many years in the past (Menard & Elliott, 1990). In addition, memories of traumatic events may be distorted, given the embarrassment and/or emotional distress caused by the event(s) (Cicchetti & Toth, 2005; Smith et al., 2008). In contrast, official records provide more accurate reporting and can more precisely indicate when the maltreatment event(s) occurred.
LONGSCAN staff reviewed CPS records for all study participants every 2 years and recorded the timing and type of maltreatment using the Modified Maltreatment Coding System (Barnett, Manly, & Cicchetti, 1993). The current study classified LONGSCAN participants as victims of maltreatment if they had at least one official allegation of maltreatment from ages 0 to 12. Five types of maltreatment were identified: physical abuse, sexual abuse, neglect-failure to provide (i.e., physical neglect), neglect-lack of supervision (e.g., the caregiver’s failure to ensure the child’s safety inside and outside the home), and emotional abuse (e.g., the caregiver’s ridiculing, ignoring, or intimidating the child).
Data on household dysfunctions were based primarily on reports from the primary caregiver. IPV was assessed using items from the Conflict Tactics Scale (CTS; Straus, 1979) at the age 6 and 8 interviews and the Revised Conflict Tactics Scale (CTS2; Straus, Hamby, Boney-McCoy, & Sugarman, 1996) at age 12. Somewhat different items were included on the CTS and CTS2, but both surveys ask respondents to report on the frequency of minor and more serious forms of physical aggression occurring between themselves and their intimate partner. This study relied on 6–7 items (depending on the year data were collected) measuring severe/serious IPV (e.g., getting beat up, choked, or threatened with a weapon) reported by the primary caregiver at the age 6, 8, and 12 surveys. If the caregiver reported any perpetration or victimization of any act at any of the three time points, IPV was coded as having occurred. 2
The primary caregiver’s depression was assessed using self-reports at the age 4, 6, 8, and 12 surveys. At ages 4, 6, and 12, the caregiver reported the frequency of 20 depressive symptoms (e.g., “I feel sad,” “I could not get going,” and “I had crying spells”) using survey items from the Center for Epidemiologic Studies Depression Scale (Radloff, 1977). Symptoms were rated on a 4-point Likert-type scale (0 = never, 1 = sometimes, 2 = occasionally, and 3 = most of the time). Following other LONGSCAN studies (Flaherty et al., 2013; Thompson et al., 2015), the items were summed at each data point, and a binary variable differentiated those with scores of less than 16 (coded as 0) and those with elevated depressive symptoms whose score was 16 or greater (coded as 1). At age 8, caregivers completed the 53-item Brief Symptoms Inventory, which assesses a variety of mental health problems (Derogatis, 1993). Respondents indicate the frequency of positive and negative feelings experienced in the past week using a 5-point Likert-type scale. Consistent with other LONGSCAN studies (Flaherty et al., 2009; Thompson et al., 2015), these items were summed and a binary variable differentiated those with scores of less than 63 (coded as 0) and those with elevated symptoms whose score was 63 or greater (coded as 1). Any child whose caregiver had elevated symptoms at any of the three waves was classified as experiencing this ACE.
The primary caregiver’s alcohol and substance use/abuse was based on self-reports from the age 4 and 8 surveys and children’s reports at age 12. At age 4, caregivers completed the CAGE (Ewing, 1984), which assesses problematic alcohol use with 4 binary (no/yes) items (e.g., “have you ever felt you should cut down on your drinking?”). Those who rated any of the items as “yes” were classified as problem drinkers. At age 8, caregivers reported on the frequency of alcohol use and whether or not they currently smoke marijuana or use cocaine, crack, PCP/acid, heroin, speed/uppers, or tranquilizers/downers. A binary measure was created from these 8 items. Those who reported drinking on a daily basis and/or using any of the illegal drugs were coded as drug users/abusers. At age 12, youth were asked to report if “anyone they lived with” got drunk or high, used marijuana, cocaine/crack, methamphetamines, or injected drugs. These 5 items were summed and a binary variable was created to differentiate youth who reported any family members who used these substances and those who did not. The overall ACE for caregiver substance use/abuse indicates that alcohol or substance use/abuse was reported at any of the three time points.
Caregiver criminality was assessed using primary caregiver reports from ages 6 through 12. At each year, the caregiver reported whether or not the child’s mother or father was arrested or incarcerated in the year prior to the survey. Affirmative answers to any of the questions designated the family as having experienced parent criminality at that time point. The overall ACE differentiates children who had at least one parent arrested or incarcerated from ages 6 through 12 from those who did not.
The last ACE measured in the study is serious family trauma, which was also measured using annual reports from the primary caregiver from ages 6 through 12. Each year, the caregiver reported if the child’s mother, father, or sibling had a serious accident or illness in the prior year or if one of these family members died. Affirmative answers to any of the questions designated the child as having experienced a serious family trauma at that time point. Children whose caregivers reported any of these events at any data collection point were considered to have experienced this ACE.
The 10 individual ACEs were summed to create the primary independent variable used in the analyses, the total number of ACEs recorded from ages 0 to 12. Although this variety score ranged from 0 to 10, very few respondents reported experiencing seven or more ACEs. Given the skewness, an eight-category variety score was created which ranged from 0 to 7+ ACEs.
Dependent Variables
Adolescent delinquency was operationalized using four dependent variables to assess alcohol use, marijuana use, violence, and arrest. All four dependent variables were based on youth self-reports at the age 16 interview and were coded as binary indicators (0 = no, 1 = yes).
Alcohol use was measured using 1 item that asked youth to report whether or not they had used beer, wine, wine coolers, malt liquor, or hard liquor in the past year. Marijuana use was also measured with 1 item, which asked if respondents had ever used or tried marijuana in the past year. As shown in Table 1, 28% of respondents reported past year alcohol use and 21% reported marijuana use.
LONGSCAN participants completed a delinquency survey with items adapted from the Denver Youth Study (Huizinga, Esbensen, & Weiher, 1991). Six items asked about violent behaviors (attacking someone with a weapon, hitting someone, using a weapon to get money or things from others, throwing objects at people, being in a gang fight, and committing a sexual assault). Youth reported the frequency of engaging in each behavior in the past year, using a 4-point Likert-type scale (from 0 = never to 3 = 10 or more times). These items were summed, and a binary variable was created to differentiate youth who reported no violent acts from those who reported at least one violent behavior. As shown in Table 1, 25% of LONGSCAN participants reported any past year violence. One item on the survey asked youth to report the number of times in the past year they had been arrested, using the same response choices as for violence. This item was recoded to differentiate those reporting no arrests (coded as 0) and those reporting one or more arrests in the past year (coded as 1). About 16% of the sample reported any past year arrest (see Table 1).
Control Variables
Children’s demographic characteristics, study site, the caregiver’s perceptions of neighborhood disorder, children’s exposure to antisocial peers, and children’s school performance were included as control variables. Children’s age is a continuous measure based on their date of birth. Children’s sex (female = 1) is based on caregiver reports at baseline. The primary caregiver’s marital status (i.e., single parent) is based on information reported by the primary caregiver at the age 16 interview (or the age 12 interview, if information was missing at age 16). A binary variable was created to differentiate those who report being married (coded as 0) and those who report being single, separated, divorced, or widowed (coded as 1). A measure of household poverty was also based on reports from the primary caregiver at the age 16 interview (or the age 12 interview, if information was missing at age 16). The original item asked about the total income of the household using an 11-category ordinal scale. Because the responses were not evenly distributed across categories and to better reflect households with very low income, a binary variable was created to differentiate households with less than US$15,000 in annual income (coded as 1) and those with greater than US$15,000 (coded as 0). Dummy variables were created to represent the geographical region of the study site in which respondents resided: East, Midwest, Northwest, South, and Southwest. The Southwest site was the reference category in the analyses because it contained the largest percentage of respondents.
The neighborhood disorder variable was included to control for the potential impact of living in a high-crime neighborhood. The measure is based on the primary caregiver’s reports at the age 16 interview (or the age 12 interview, if information was missing at age 16). Using 14 items based on prior literature (Coulton, Korbin, & Su, 1996; Sampson, Raudenbush, & Earls, 1997), caregivers rated their level of agreement on a 4-point Likert-type scale (1 = strongly disagree, 4 = strongly agree) regarding the presence of crime and disorder in their neighborhoods (e.g., “there is vandalism…abandoned cars…open drug activity”). These items were summed to form the neighborhood disorder measure (α = .94). Exposure to antisocial peers and grades were included in the analyses because research indicates that these are among the strongest social risk factors known to influence adolescent substance use and delinquency (Hawkins et al., 1992; Herrenkohl et al., 2000). Both measures are based on youth self-reports from the age 12 interview. At that time, youth reported on the number of their close friends who engaged in 12 antisocial behaviors, including substance use (e.g., smoking, drinking, marijuana use, and hard drug use) and delinquency (property and violent offenses). Responses were based on a 3-point Likert-type scale (0 = none of my friends, 1 = some of my friends, and 2 = most of my friends) and summed to create the antisocial peers variable (α = .82). As shown in Table 1, the mean score on this measure was 1.11 (range = 0–21). Youth also reported on how well they performed in four subjects (English, History, Math, and Science) using a 4-point Likert-type scale (0 = failing, 1 = below average, 2 = average, and 3 = above average). These items were summed, and the mean score on self-reported grades was 8.37 (range = 0–12).
Statistical Analysis
To investigate the first research question, the prevalence of each ACE was calculated for White and Black respondents. The χ2 analysis was used to identify statistically significant (p < .05) race differences in exposure to ACEs. Given the binary dependent variables, logistic regression models were estimated to examine the second research question. These analyses were conducted in a stepwise fashion. In the first step (Model 1), each of the four dependent variables was regressed on the ACEs count variable, with all of the control variables except antisocial peers and grades included in the models. In the second step (Model 2), the antisocial peers and grades variables were added to the models. 3 Separate logistic regression analyses were conducted for White and Black participants, and differences in the regression coefficients estimating the effect of ACEs on outcomes were calculated using the equality of coefficients test recommended by Brame, Paternoster, Mazerolle, and Piquero (1998) and the formula (i.e., equation 4) provided by Paternoster, Brame, Mazerolle, and Piquero (1998). 4 Only those who provided complete information on the independent and dependent variables were included in the analyses. Sample sizes ranged from 594 to 598 participants in the first set of analyses and 466 to 469 in the second set of analyses. All analyses were performed in SPSS Version 14. No problems with outliers or multicollinearity were identified.
Results
Race Differences in the Prevalence of ACEs
Table 1 shows the prevalence of each ACE for the full sample and separately for White and Black respondents. The data indicate that a relatively high proportion of the LONGSCAN sample experienced ACEs during childhood. The most common adversity was elevated symptoms of depression among caregivers, which was experienced by just over half the sample (51%) at some point during childhood. Sexual abuse was the least common of the individual ACEs, affecting 14% of the respondents.
The results show race differences in exposure to ACEs, with Whites in this sample at greater risk for ACEs than Blacks. Seven of the 10 ACEs were experienced at significantly higher rates among White youth, including all five types of child maltreatment (physical abuse, sexual abuse, failure to provide, lack of supervision, and emotional abuse). In addition, higher rates of parent criminality and family trauma were evidenced for Whites compared to Blacks. The prevalence rates of IPV, caregiver depression, and caregiver substance use/abuse were similar for White and Black youth. When all of the ACEs were summed, the total number was significantly higher for Whites than Blacks. White youth experienced a mean of 4.08 ACEs during childhood, compared to 2.90 for Black youth (see Table 1).
The Relationship Between ACEs and Adolescent Delinquency
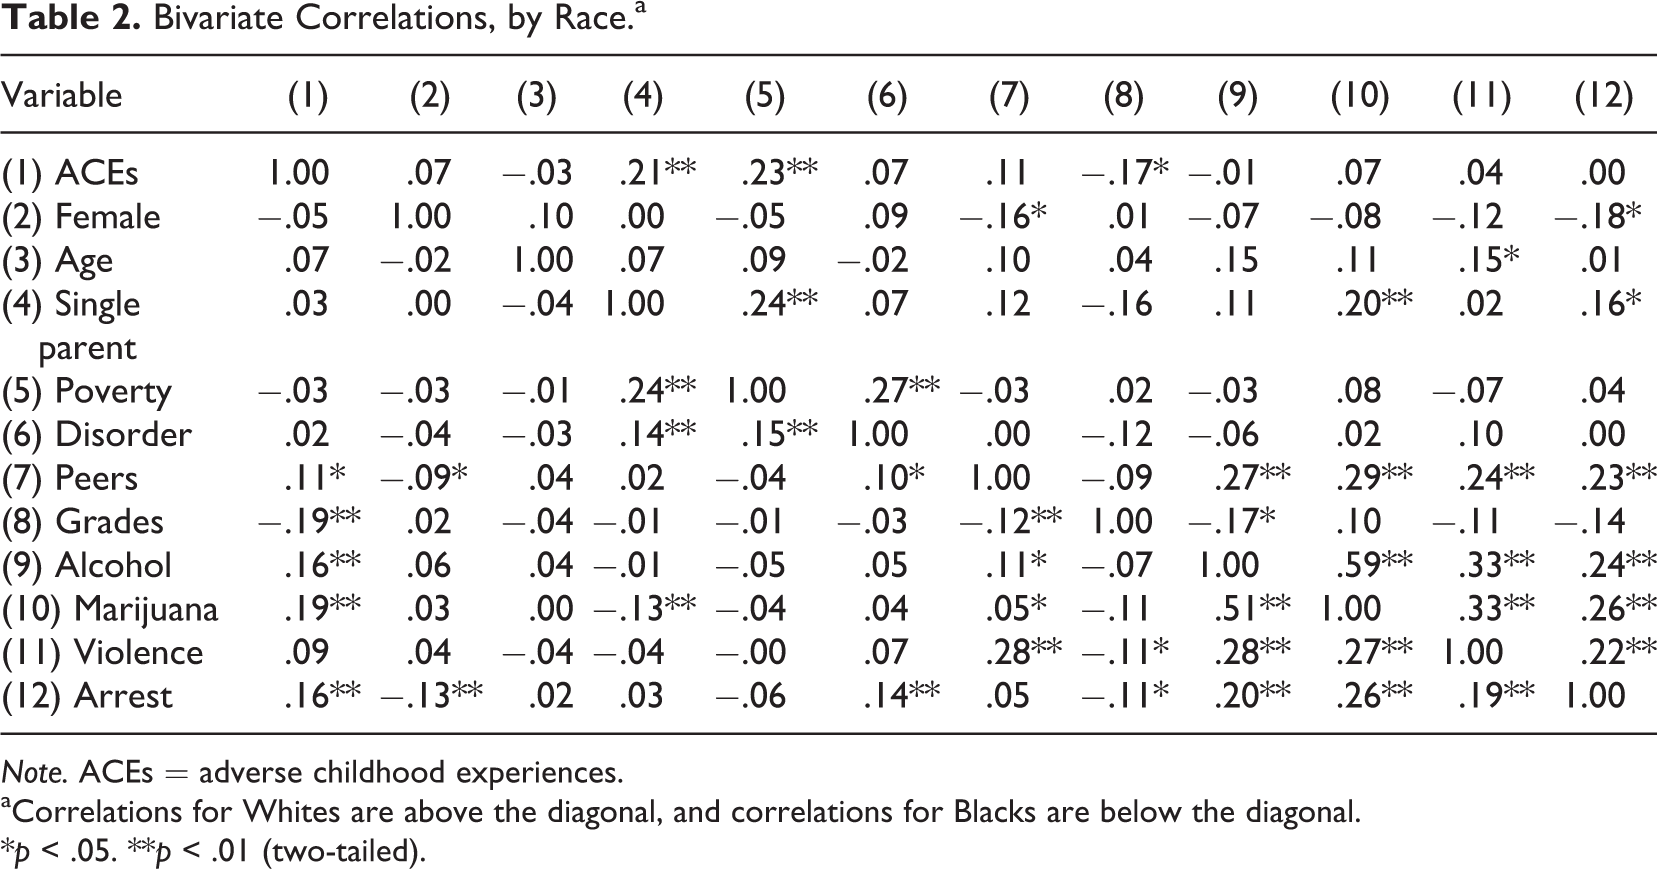
Before presenting the results of the multivariate analyses, we first provide the bivariate correlations between all of the independent and dependent variables, by race. Among White participants, as shown in Table 2 (above the diagonal), the number of ACEs was not significantly related to any of the four dependent variables. In fact, these correlations were small and ranged from −.01 (for alcohol use) to .07 (for marijuana use). Among Blacks, however, ACEs were significantly related to three of the four outcomes. As shown in the results below the diagonal, ACEs were significantly and positively associated with alcohol use (r = .16), marijuana use (r = .19), and arrest (r = .16). The correlation between the number of ACEs and self-reported violence was also positive (r = .09) but not statistically significant (p < .05).
Bivariate Correlations, by Race.a
Note. ACEs = adverse childhood experiences.
aCorrelations for Whites are above the diagonal, and correlations for Blacks are below the diagonal.
*p < .05. **p < .01 (two-tailed).
Table 3 provides the results from the multivariate logistic regression analyses estimating the effects of childhood ACEs on the likelihood of any past year alcohol use and marijuana use. Similar to the bivariate results, the results in Model 1 show that for White youth, the number of ACEs experienced was not significantly related to the likelihood of either outcome. The size of the odds ratios (ORs) suggests no relationship between ACEs and alcohol use (OR = 1.00) or marijuana use (OR = 1.05). In the second set of models, which included controls for antisocial peers and grades, the ORs were again nonsignificant, indicating that the number of ACEs did not predict the likelihood of alcohol use (OR = 0.91) or marijuana use (OR = 1.01) for White participants.
The Relationship Between the Number of ACEs Reported at Ages 0–12 and the Odds of Reporting Any Past Year Alcohol and Marijuana Use at Age 16, by Race.
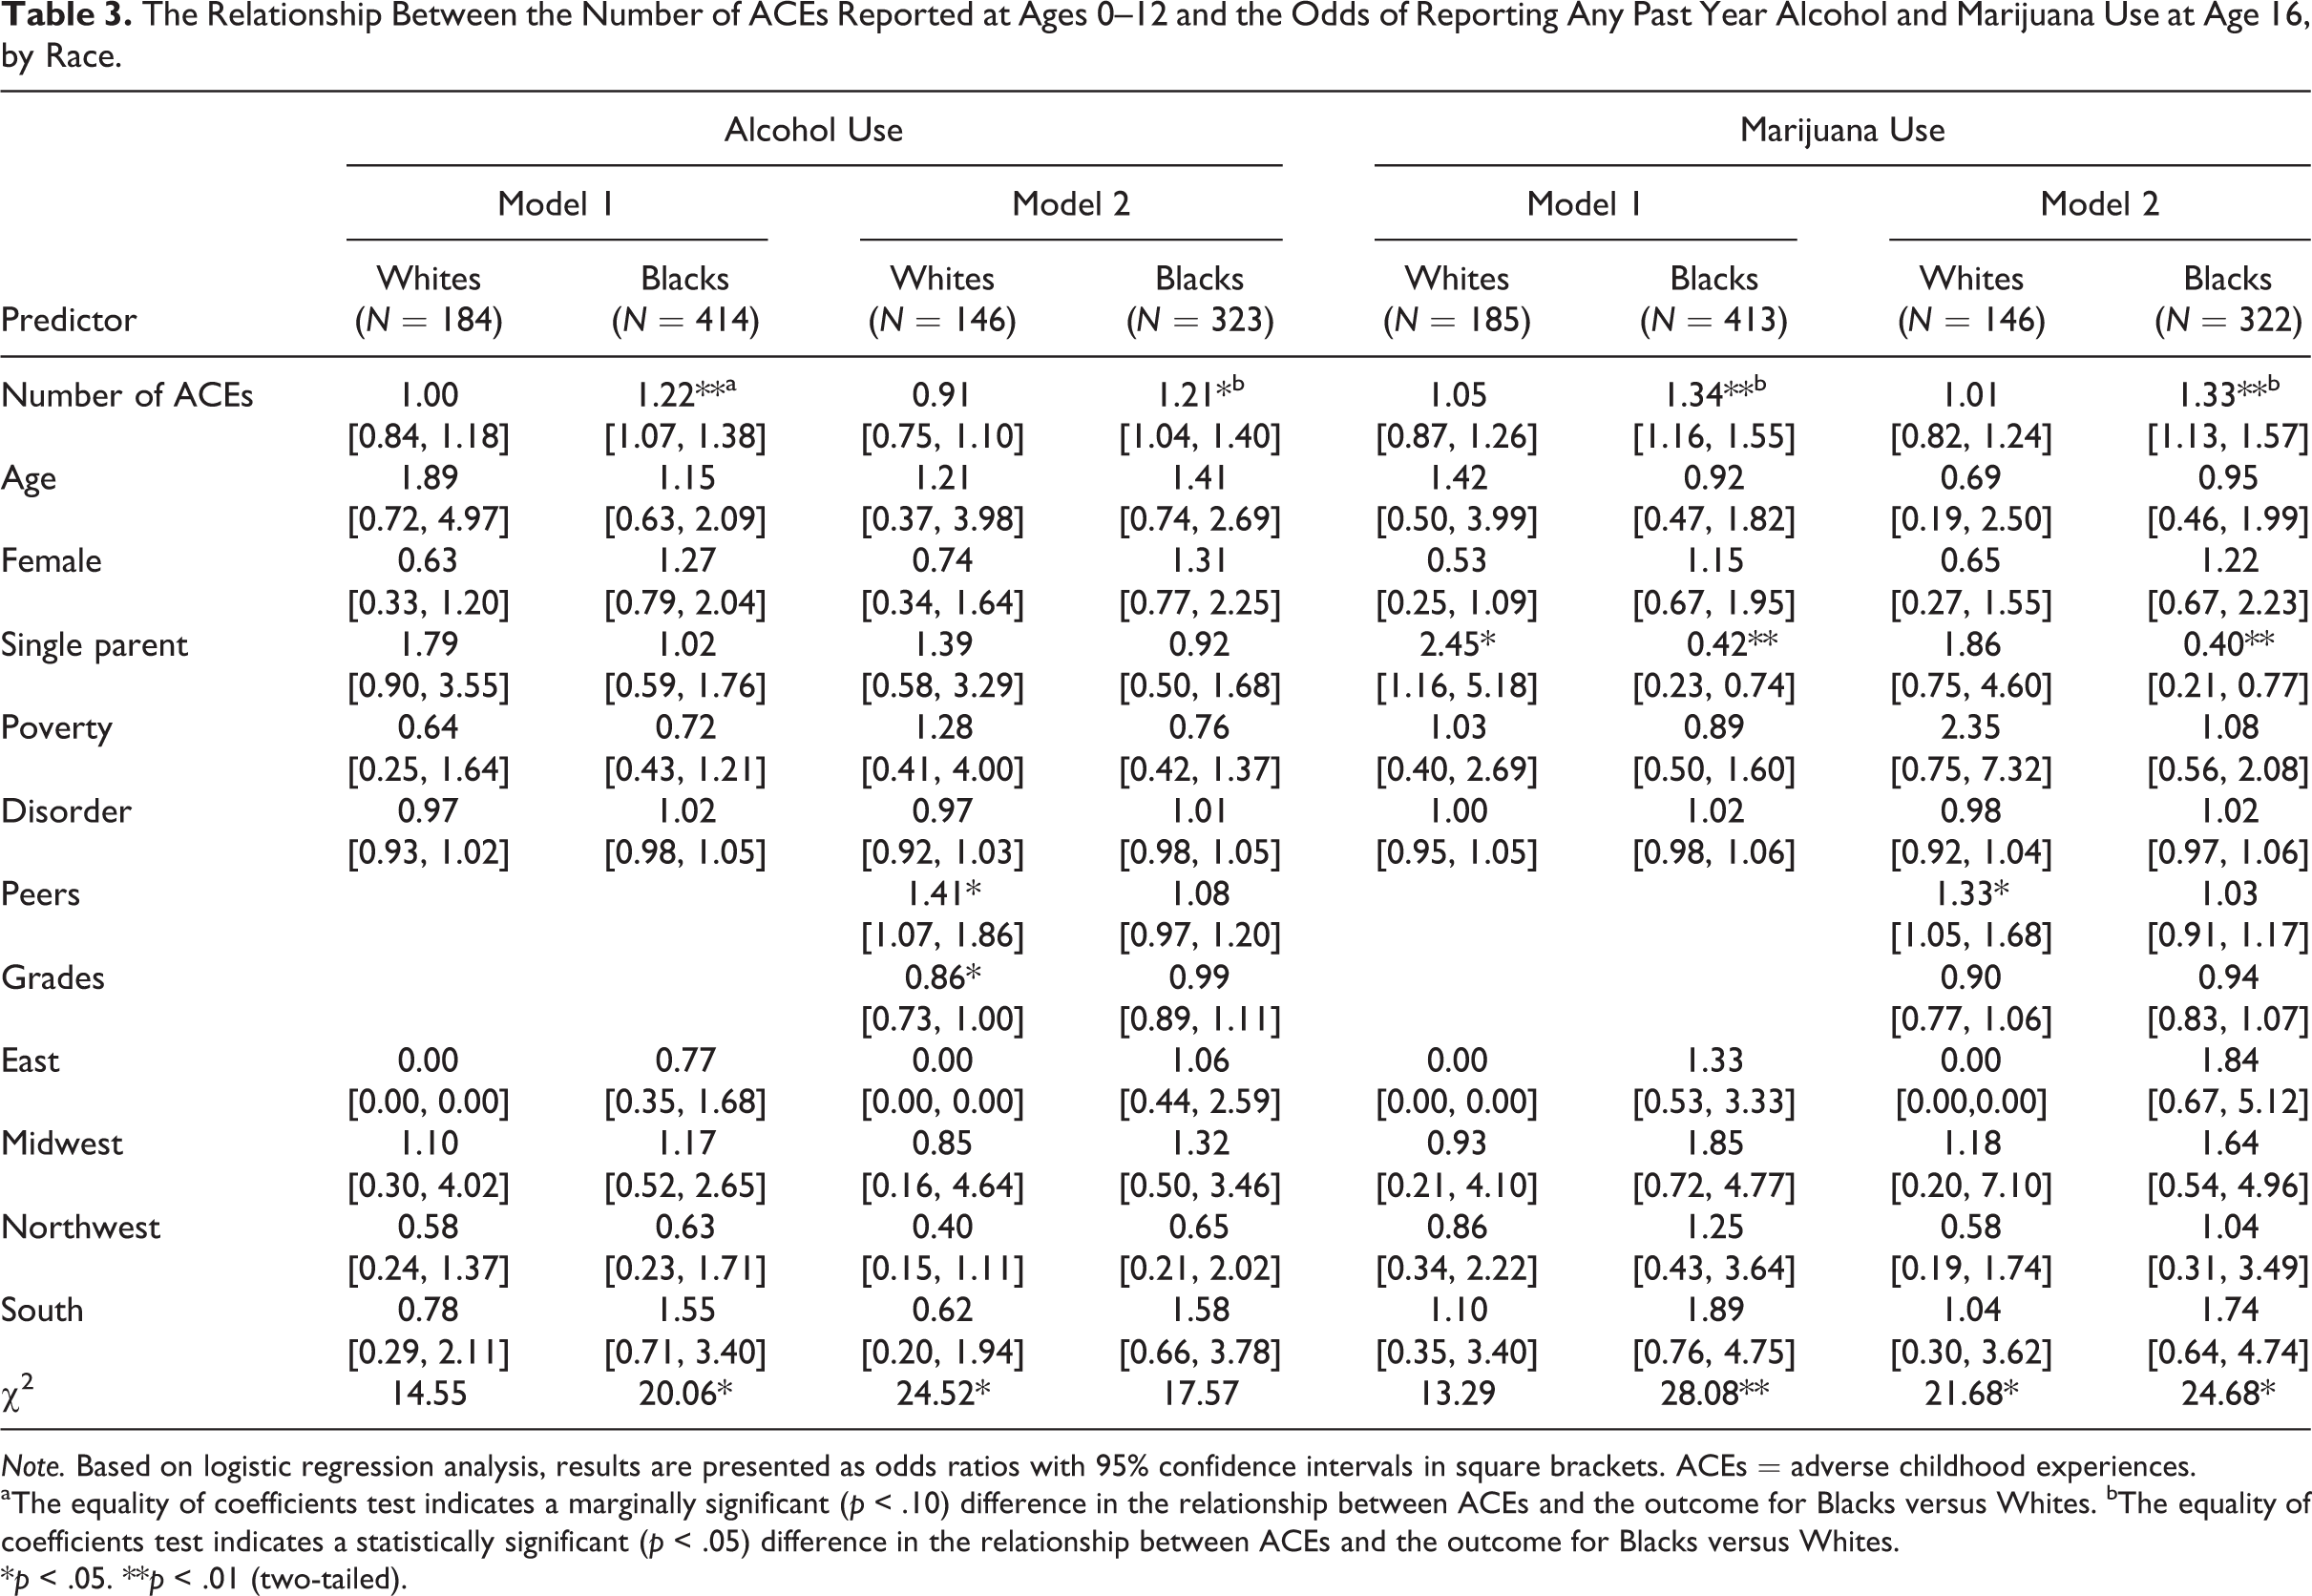
Note. Based on logistic regression analysis, results are presented as odds ratios with 95% confidence intervals in square brackets. ACEs = adverse childhood experiences.
aThe equality of coefficients test indicates a marginally significant (p < .10) difference in the relationship between ACEs and the outcome for Blacks versus Whites. bThe equality of coefficients test indicates a statistically significant (p < .05) difference in the relationship between ACEs and the outcome for Blacks versus Whites.
*p < .05. **p < .01 (two-tailed).
In contrast, the relationship between ACEs and substance use was statistically significant (p < .05) for Blacks for both outcomes. In Model 1, the results indicated a positive relationship between the number of ACEs experienced and substance use, with more ACEs associated with a greater likelihood of alcohol use (OR = 1.22) and marijuana use (OR = 1.34). The ORs were reduced only slightly when antisocial peers and grades were added to the analyses. As shown in Model 2, the number of ACEs remained significantly associated with alcohol use (OR = 1.21) and marijuana use (OR = 1.33) in these models.
The results of the equality of coefficients tests are indicated by the subscripts shown in Models 1 and 2. In Model 1, White/Black differences were marginally significant (p < .10) when examining alcohol use (z = 1.83) and were statistically significant (p < .05) when examining the impact of ACEs on marijuana use (z = 2.06). For both outcomes, the impact of ACEs was stronger for Black youth compared to White youth. In Model 2, the equality of coefficients test was statistically significant (p < .05) for both alcohol (z = 2.31) and marijuana use (z = 2.08). In both cases, the effect of ACEs was stronger for Blacks compared to Whites.
Table 4 provides the results from the multivariate logistic regression analyses estimating the effects of childhood ACEs on the likelihood of any past year violence and arrest. These findings are similar to those found for substance use. As in the bivariate results, the results indicated that the number of ACEs was not significantly related to violence or arrest among White youth. In Model 1, the ORs were close to 1.0 for violence (OR = 1.03) and arrest (OR = 0.91). In Model 2, which included controls for antisocial peers and grades, the ORs were also nonsignificant, indicating that the number of ACEs did not predict the likelihood of violence (OR = 0.98) or arrest (OR = 0.78).
The Relationship Between the Number of ACEs Reported at Ages 0–12 and the Odds of Reporting Any Past Year Violence and Arrests at Age 16, by Race.
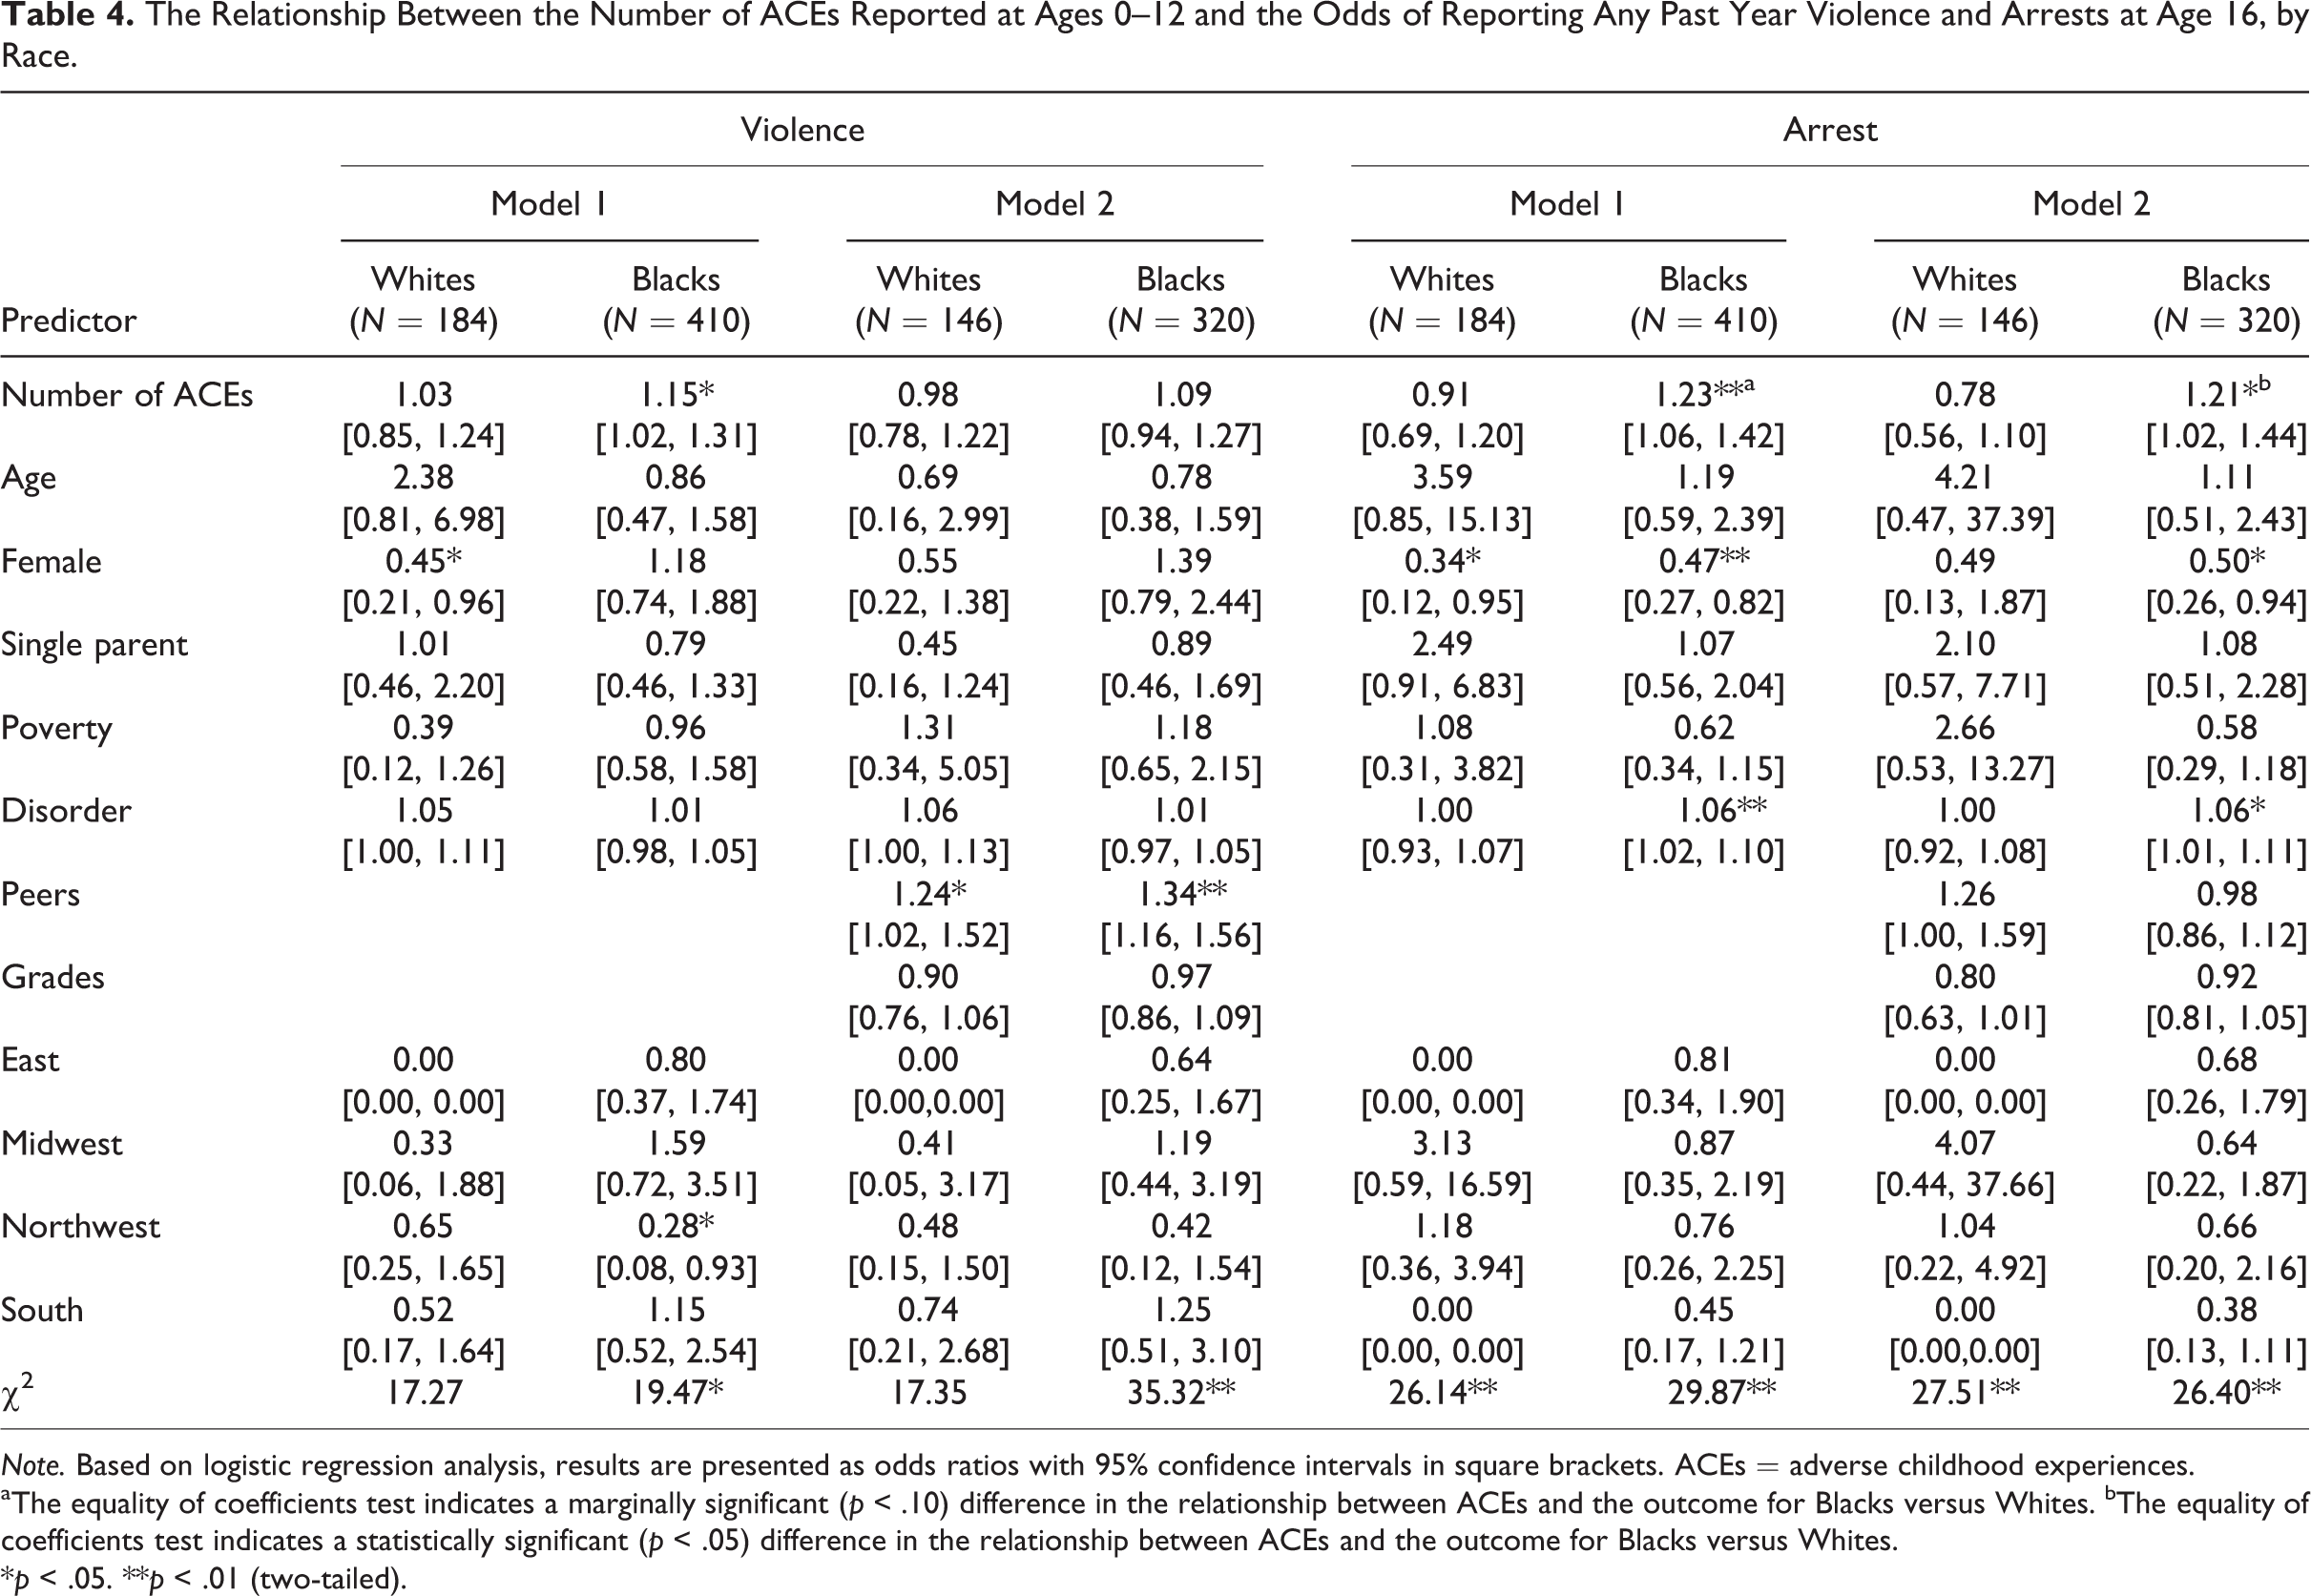
Note. Based on logistic regression analysis, results are presented as odds ratios with 95% confidence intervals in square brackets. ACEs = adverse childhood experiences.
aThe equality of coefficients test indicates a marginally significant (p < .10) difference in the relationship between ACEs and the outcome for Blacks versus Whites. bThe equality of coefficients test indicates a statistically significant (p < .05) difference in the relationship between ACEs and the outcome for Blacks versus Whites.
*p < .05. **p < .01 (two-tailed).
Somewhat different findings were evidenced among Black participants. The number of ACEs was significantly related to the likelihood that Black youth would report any violence (OR = 1.15, see Model 1), but this relationship was reduced (OR = 1.09) and became nonsignificant when controls for peer antisocial behavior and grades were added. However, higher ACE scores were significantly related to arrest in both Model 1 (OR = 1.23) and Model 2 (OR = 1.21).
The results of the equality of coefficients tests suggested race differences in the impact of ACEs on arrest but not violence. In both Model 1 and Model 2, the equality of coefficients test was not significant when predicting the likelihood of self-reported violence (z-scores were 0.99 in Model 1 and 0.82 in Model 2). However, the equality of coefficients test was marginally significant when predicting arrest in Model 1 (z = 1.84, p < .10) and was statistically significant in Model 2 (z = 2.27, p < .05). In both cases, the effect of ACEs in increasing the likelihood of arrest was stronger for Blacks compared to Whites.
Discussion
This study is one of the first to examine race differences in the occurrence of ACEs and in their impact on adolescent delinquency. The study assessed four different types of delinquency (alcohol use, marijuana use, violence, and arrest), focusing on the types of behaviors known to vary by race during adolescence. To our knowledge, it is the first study to examine the impact of ACEs on adolescent alcohol and marijuana use. Strengths of the study include reliance on prospective data to assess ACEs, use of multiple reporting sources to measure multiple ACEs, correct temporal ordering between ACEs and outcomes, and inclusion of control variables to help ensure that effects cannot be attributed to other factors.
The findings both support and differ from prior literature, although it is important to recognize that the research methods used in the current study differ somewhat from prior research, and these differences could lead to differences in results. For example, much of the prior research examining the impact of ACEs has relied on retrospective reports of trauma from adults (Anda et al., 1999; Dube et al., 2002; Dube et al., 2002; Dube et al., 2003; Felitti et al., 1998; Wade et al., 2016) or from youth in middle or late adolescence (e.g., Baglivio & Epps, 2016; DeLisi et al., 2017; Duke et al., 2010; Fox et al., 2015), rather than prospective data collected during childhood. In addition, prior studies have differed in the number and specific types of ACEs assessed, as well as the developmental period during which ACEs were measured. For example, although prior research has typically investigated adversity experienced prior to age 18, the current study measured ACEs only to age 12 to preserve temporal ordering between these events and adolescent behavioral outcomes. As a result, our study may have lower estimates of the total number of ACEs compared to prior studies. At the same time, the current study was based on a high-risk sample, families reported to CPS agencies for possible child maltreatment, and, in three of the five LONGSCAN sites, comparison families that did not have official records of maltreatment but were considered at risk for maltreatment based on demographic characteristics like low SES and maternal substance use (Runyan et al., 1998). Given the nature of the sample, the total number of ACEs reported by this high-risk group may be higher compared to studies based on lower risk samples.
The first research question examined race differences in the number and types of ACEs reported by LONGSCAN participants. In this sample, White children were more likely than Black children to experience most of the ACEs included in the analysis, and they had a higher mean number of ACEs. Other research has found that Blacks experience more ACEs than Whites (Cronholm et al., 2015; Duke et al., 2010; Slopen et al., 2016). However, those studies have relied on data from more universal samples than the current study. Similar to studies based on a different high-risk sample, youth involved in the Florida juvenile justice system (Baglivio & Epps, 2016; Perez et al., 2016), our results demonstrate that White youth can have similar or even greater exposure to ACEs compared to Blacks.
The second research question examined race differences in the effects of ACEs on delinquency. The results indicated that the impact of the total number of ACEs on various forms of delinquency was statistically significant for Black adolescents in all but one model (predicting violence), but no significant relationships were found among Whites. Although the equality of coefficients tests did not indicate statistically significant (p < .05) race differences in the effects of ACEs on violence (see Tables 3 and 4), significant race differences were evidenced in models examining alcohol use, marijuana use, and arrest. All of the differences were in the same direction and indicated a stronger impact of ACEs on delinquency for Blacks compared to Whites. The consistency of findings across outcomes is notable, particularly since models controlled for other factors (e.g., family poverty, residence in a disorganized neighborhood, exposure to antisocial peers, and academic performance) that have been shown to influence adolescent delinquency.
It is difficult to compare these results to prior research, as only a few studies have assessed the influence of ACEs on child or adolescent behavior problems by race, and the results have been mixed. Two prior studies suggested a greater impact of ACEs on externalizing behaviors (Hunt et al., 2017) and antisocial behaviors (Schilling et al., 2007) for Whites compared to Blacks. Analyses of data from offenders in the Florida juvenile justice system have shown disparate relationships regarding race differences in the relationship between ACEs and juvenile offending and recidivism. One study reported a greater effect of ACEs on residential placement for Black offenders versus White offenders (Zettler et al., 2017), while other studies have reported that the relationship between ACEs and recidivism was significant for Black and White offenders (Craig et al., 2017; K. Wolff & Baglivio, 2017), and a last study indicated that race differences were present depending on the specific type of recidivism assessed (DeLisi et al., 2017).
Given the limited and mixed findings regarding the relationship between race, ACEs, and adolescent delinquency, the current findings require replication. Ideally, such research will be conducted with both general and higher risk populations and compare youth from additional racial/ethnic groups, as the impact of ACEs may vary across population types. For example, we found that the effect of ACEs on delinquency was statistically significant, but not particularly strong, among Black respondents (see Tables 3 and 4). However, LONGSCAN is a high-risk sample, and the fact that the comparison group was also more at-risk for behavioral problems makes this a more conservative test of the impact of ACEs on delinquency.
The mechanisms responsible for racial differences also warrant further investigation. Given that Whites and Blacks in this sample reported similar levels of violence and arrest and Whites reported more substance use (see Table 1), the results suggest that although ACEs contribute to delinquency among Blacks, something other than ACEs influenced White teens to engage in delinquency. Consistent with Rutter’s (2012) concept of steeling effects, it is also possible that the White youth in this sample, who are from high-risk families and who experienced a rather large number of ACEs, were able to learn how to cope with these adversities and avoid responding to them with criminal behaviors. Similarly, White families may have been more successful than Black families in accessing social support services to help youth cope with their childhood adversities (for a similar hypothesis regarding race differences in the effects of child maltreatment, see Lansford et al., 2007). It is also possible that the impact of ACEs was heightened for Blacks because they also experienced adversities not captured in this study, such as racial discrimination (Cronholm et al., 2015; Lansford et al., 2007). Unfortunately, our study was not designed to test these hypotheses, and we hope future research will investigate these and other possible mechanisms linking ACEs to adolescent risky behaviors.
To summarize, the goal of this study was to improve understanding of the impact of ACEs on adolescent delinquency, especially whether or not there are race differences in the occurrence and influence of ACEs. Although our study has many strengths, it also has some limitations. The results are based on a high-risk sample and so cannot be generalized to other types of populations. Similarly, our analyses could only compare White and Black youth because LONGSCAN did not include enough individuals from other racial/ethnic groups to allow for additional comparisons. In addition, all of the dependent variables were dichotomous and examined the degree to which ACEs predicted the likelihood of any involvement in substance use, violence, and arrest. As such, this study cannot differentiate those who engaged in onetime or experimental substance use and violence from those who engaged in more frequent and serious behaviors. Different findings could be evidenced when examining more frequent substance use, violence, and contact with the juvenile justice system, and additional research is needed to examine the impact of ACEs on more serious and frequent problem behaviors.
Despite these limitations, the findings indicate that children can be seriously harmed by adverse events such as child maltreatment and residence in dysfunctional households. Not only may such events lead to long-term consequences for physical, emotional, and behavioral health, as found in the original ACEs study (Felitti et al., 1998), but also to health-compromising behaviors during adolescence. Although replication is warranted, our results further suggest that Black youth are particularly likely to respond to ACEs with delinquent behavior. We hope these findings will be incorporated into current juvenile justice initiatives which recognize that youth offenders may have a history of trauma and ask that juvenile justice officials respond accordingly, with treatment services rather than punishment-oriented reactions (National Research Council, 2012; U.S. Attorney General’s National Task Force on Children Exposed to Violence, 2012). For example, family therapy programs delivered to youth offenders in community-based agencies, not correctional facilities, have been demonstrated to reduce youth recidivism by addressing the risk factors that contribute to substance use/abuse and offending (Carr, 2014; Henggeler & Schoenwald, 2011; Henggeler & Sheidow, 2012). These factors include child abuse and neglect, as well as parents’ own involvement in antisocial behaviors.
The findings also underscore the need for early intervention strategies to prevent the occurrence of childhood trauma and to reduce its negative consequences. A number of interventions have been tested in high-quality research trials and shown to reduce child maltreatment, including home visitation programs that help new mothers care for their newborn children (Gomby, Culross, & Berhman, 1999; Olds, 2002), as well as interventions that help parents of older children provide supportive and nurturing caregiving and avoid abusive behaviors (Carr, 2014; Chaffin et al., 2004; Printz & Sanders, 2007). Other programs have been demonstrated to help youth cope with trauma (U.S. Department of Justice, U.S. Department of Health and Human Services, 2011), such as the Cognitive Behavioral Intervention for Trauma in Schools, which teaches youth who have been exposed to family and/or community violence how to reduce stress, combat negative thoughts and emotions, and improve their social skills (Stein et al., 2003). Increasing the use of these programs in families and communities can help reduce both the occurrence of ACEs and the potential that children will respond to adversity with health-compromising behaviors like substance use and violence.
Footnotes
Authors’ Note
The data used in this study were made available by the National Data Archive on Child Abuse and Neglect (NDACAN). NDACAN does not bear any responsibility for the analyses or conclusions presented here.
Declaration of Conflicting Interests
The author(s) declared no potential conflicts of interest with respect to the research, authorship, and/or publication of this article.
Funding
The author(s) received no financial support for the research, authorship, and/or publication of this article.