
Abstract
The present study examines whether racial and ethnic disparities in juvenile justice declined significantly in a state that has made substantial reform efforts in compliance with the Disproportionate Minority Contact (DMC) mandate. Using a sample of all referrals in Connecticut with final disposition in 2000 (N = 18,458) or 2010 (N = 12,265), the study employed multilevel modeling with cross-level interactions to assess whether disparities changed over time for five outcomes: detention, petition, adjudication, commitment, and waiver to criminal court. Findings indicated that Black-White disparities in detention decreased over time, while Black-White disparities increased for petition, adjudication, and waiver. Findings also indicated that Hispanic-White disparities increased for adjudication (while not changing for other outcomes). The limited success of the DMC mandate may be explained by implementation failure or theory failure. Adjudicating between these alternative explanations is needed to guide future reform efforts. Several implications for research and policy are discussed, including whether reform efforts should focus on overall harm reduction rather than proportional representation.
Keywords
In the juvenile justice system, persistent racial and ethnic disparities at various points of contact are referred to as disproportionate minority contact (DMC). The federal “DMC mandate,” introduced in 1988 as an amendment to the 1974 Juvenile Justice and Delinquency Prevention Act (JJDPA), is the largest national response to the issue of DMC to date, attempting to incentivize states to reduce racial and ethnic disparities in juvenile justice processing at the local level. The 1992 reauthorization of the DMC mandate included five ongoing phases of compliance: identification, assessment of causes, interventions, evaluation, and monitoring. It also included a financial incentive: states risked losing 25 percent of their formula grant funding if they did not show a “good faith effort” to comply with the mandate (Leiber, 2002). The DMC mandate was again reauthorized in 2002, expanding the scope of the mandate to all decision points along the juvenile justice continuum (reflected in changing the term “confinement” to “contact”). Most recently, the JJDPA was reauthorized as the Juvenile Justice Reform Act of 2018 (JJRA), which includes, among other things, replacing the language on “disproportionate minority contact” with “racial and ethnic disparities.” 1
In a review of “best practices” of DMC-reduction efforts, Cabaniss and colleagues (2007) enumerated the following major strategies adopted by various states in response to the DMC mandate: decision-point mapping and data review; cultural competency training; adding more community-based prevention and intervention programs (most notably detention alternatives); removing decision-making subjectivity through standardized screenings and protocols; reducing barriers to family involvement; and cultivating state leadership to legislate system-level change. Importantly, however, states have not responded to the DMC mandate in uniform fashion. As of 2011, only 18 states had full-time DMC coordinators, 18 states completed an assessment study between 2005 and 2011, and only four states had conducted a formal evaluation of DMC reduction interventions (Hanes, 2012).
Three decades on, a critical question is whether the DMC mandate has in fact resulted in lower racial and ethnic disparities in juvenile justice outcomes. Few studies have attempted to assess whether racial and ethnic disparities have decreased significantly in jurisdictions that have undergone substantial reforms in compliance with the DMC mandate (see Donnelly, 2017, 2019; Leiber et al., 2011). Notably, this dearth of research is not limited to juvenile justice. In a recent review, King and Light (2019) observe that surprisingly little research has examined trends in racial and ethnic disparities in criminal justice outcomes over time (but see Enders et al., 2019). The present study is motivated by this gap in the literature, and seeks to assess whether racial and ethnic disparities have declined significantly across major juvenile justice decision points. To do so, the present research compares the effects of race and ethnicity on juvenile justice outcomes over time in a state that has, in compliance with the DMC mandate, undergone substantial reforms aimed at making its juvenile justice system less punitive and more equitable.
Changes in DMC Over Time
As a starting point, we can observe descriptive trends in DMC over time. For example, Leiber and Fix (2019) recently assessed national trends in the relative rate index (RRI) from 2005 through 2015. The RRI is the measure of racial disparity used (until recently) by the Office of Juvenile Justice and Delinquency Prevention (OJJDP), a ratio of the proportion of minority youth (relative to their population) at a given stage of processing to the proportion of White youth (relative to their population) at the same stage of processing. At referral, the Black-White RRI increased from 2.7 in 2005 to 2.9 in 2018, while the Hispanic-White RRI declined from 1.1 to .9. At detention, the Black-White RRI increased from 1.3 in 2005 to 1.4 in 2018, while the Hispanic-White RRI moved from 1.4 to 1.5. At waiver, the Black-White RRI increased from 1.1 in 2005 to 1.6 in 2018, while the Hispanic-White RRI increased slightly from .9 to 1.0. And at secure placement, the Black-White RRI increased from 1.3 to 1.4, while the Hispanic-White RRI remained steady at 1.4 (see Leiber & Fix, 2019; OJJDP, 2020). 2 Strikingly, then, there has been no clear pattern of DMC reduction at the national level, despite “a wide range of initiatives [that] have been developed and implemented, as well as [an] enormous amount of dollars…spent via the Federal Title II Formula Grants and other funding by private foundations, states and localities” (Leiber & Fix, 2019, p. 586). 3
Still, descriptive trends alone cannot tell us whether racial disparities have significantly declined as a result of the DMC mandate. First, most states have not undergone substantial reforms in response to the mandate—and some have not even complied with the most basic identification and assessment phases (Peck, 2018). In order to evaluate the potential effectiveness of the DMC mandate, it is necessary to examine a jurisdiction that has clearly taken steps to comply with the mandate, including system-wide reforms. Second, descriptive trends in relative outcomes treat all juvenile defendants as similarly situated (Kempf-Leonard, 2007). But if, for example, minority defendants engage in more serious types of offenses or have more extensive criminal records, then persistent disparities would not change so long as those exogenous factors also persist. Any valid examination of trends in racial and ethnic disparities over time, then, must control for case-level legal factors—at a minimum, prior record and offense type or severity.
Only a handful of prior studies have examined changes in DMC over time in specific jurisdictions after controlling for other case-level factors. First, Leiber and colleagues (2011) assessed the effectiveness of the DMC mandate in a large county in Iowa, one of five “model” states selected to address DMC immediately following the 1988 mandate. The authors examined a random sample of White and Black defendants over a 21-year period from 1980 to 2000—roughly 10 years before and after the mandate. They then conducted logistic regression analyses for two sub-samples reflecting the time periods, and compared race coefficients using a Z-score equality of coefficient test. In support of the mandate’s effectiveness, they found a significant reduction in odds of placement for Black youth relative to White youth following the mandate. An important caveat, however, is that the effect of race on placement before the DMC mandate was negative: White youth were more likely to be placed than Black youth in the pre-DMC mandate model (OR = .78), and this negative disparity became more pronounced after the DMC mandate (OR = .66). At intake, Black youth were more likely to be formally petitioned (OR = 1.61), but this did not change significantly over time. In sum, the authors found limited support for the effectiveness of the DMC mandate.
More recently, Donnelly (2017, 2019) has examined DMC reduction in Pennsylvania, another state that has implemented substantial reforms including community forums, cultural sensitivity training, and alternatives to detention and confinement. Following the 2002 reauthorization of the DMC mandate, five of Pennsylvania’s 67 counties adopted DMC reduction initiatives. Donnelly (2017) took advantage of this natural experiment and compared intervention counties to non-intervention counties, both pre- and post-DMC mandate (1997–2011). The author conducted differences-in-differences models using the number of minority defendants petitioned, adjudicated, placed, and securely confined, controlling for arrest differentials, county punitiveness, and several other county characteristics. Donnelly (2017) found that, post-mandate, there was a significantly greater reduction of minority defendants in intervention counties for most decision points—interpreted as support for the effectiveness of DMC intervention programs.
Using the same Pennsylvania data from 1997 to 2011, Donnelly (2019) used Gelbach decomposition to estimate the unexplained racial differences in processing outcomes at detention and secure placement, before and after DMC-related reforms in Pennsylvania. The author compared regression coefficients from pre-reform (1997–2007) and post-reform (2008–2011) logit models, finding that Black defendants were significantly more likely to be detained before (OR = 2.14) and after (OR = 1.76) DMC reforms, as well as significantly more likely to be placed before (OR = 1.90) and after (OR = 1.76) reforms. To assess whether the influence of race on detention and placement decreased over time—as would be implied by successful reforms—Donnelly (2019) then used Z-score coefficient comparison tests and found that the effect of race on detention and secure placement had reduced. Together, then, these studies suggest successful DMC reduction in Pennsylvania.
As can be seen from the above, only a handful of studies have attempted to measure whether racial and ethnic disparities have declined as a result of the DMC mandate (or intervention programs inspired by the mandate), controlling for other case-level factors. Moreover, as described above, the dominant approach has been to compare regression coefficients across different temporal models using the equality of coefficients Z-score method (see Paternoster et al., 1998). As Long and Mustillo (2018, p. 2) recently point out, “since the regression coefficients in binary logit or probit are only identified to a scale factor, standard tests of the equality of coefficients are invalid” (see also Allison, 1999). Specifically, “the equality of regression coefficients across groups does not imply that the marginal effects of a regressor on the probability are equal” (Long & Mustillo, 2018, p. 2). An alternative approach is to compare marginal effects for temporal groups within the same model (see Mize, 2019).
Current Study
The DMC mandate was amended in 2002 to include all points of contact in the juvenile justice system, not just confinement. The present study assesses whether racial and ethnic disparities declined significantly across major juvenile justice decision points, from 2000 to 2010, in a state that has made concerted efforts to reform its juvenile justice system. As one report states, “[o]ver the decade from 2002 to 2012, Connecticut transformed its juvenile justice system,” including ending the criminalization of status offenders (i.e., “Family with Service Needs” [FWSN] referrals), raising the age of jurisdiction from 15 to 17, reducing the use of confinement, and undertaking efforts to reduce DMC (Mendel, 2013, p. 15). As a result, “Connecticut is widely considered a model for how a state can turn its juvenile justice system around quickly” (Tow Institute, 2016, p. 2). Connecticut is also foremost among state juvenile justice systems in terms of compliance with the DMC mandate, including producing several reports assessing and monitoring DMC in the Connecticut juvenile justice system since the mandate’s inception (Hartstone & Richetelli, 1995, 2001; Richetelli et al., 2009; Spectrum Associates, 2017). These reports “have been lauded by the U.S. Office of Juvenile Justice as some of the most in-depth, decision-point analyses in the country” (Mendel, 2013, p. 26). From 2007 to 2013, Connecticut also trained 1,400 police officers in DMC awareness and conducted two pilot projects to reduce school referrals of minority students.
Since the requirements of the DMC mandate from 2000 to 2010 were vague and non-specific, however, this precludes the possibility of formally evaluating the mandate’s success. Instead, the present study undertakes an assessment of whether racial and ethnic disparities declined significantly within a jurisdiction that responded to the mandate by enacting substantial reforms. This approach is akin to “implication analysis” (Lieberson & Horwich, 2008), where a theory is evaluated according to whether its clear implications are borne out. Here, a successful DMC mandate would necessarily imply a reduction in racial and ethnic disparities across all decision points where they were initially observed. 4 This approach is taken by several prior studies assessing the DMC mandate using equality of coefficients comparison tests. The present study represents the first to estimate whether racial and ethnic disparities have significantly decreased over time using an alternative method: comparing the marginal effects of race and ethnicity on major juvenile court outcomes at two different time periods in the same jurisdiction.
Methods
The present sample consists of all juvenile court referrals in the Connecticut juvenile justice system with a final disposition in 2000 or 2010. 5 Connecticut was selected based on the availability of data on major juvenile justice outcomes along with information on key case-level factors such as offense type and prior record for both 2000 and 2010. The original data consisted of all referred delinquency or status offense cases across Connecticut’s 13 juvenile courts in 2000 (N = 19,582) and 2010 (N = 14,405). Cases were dropped from the final sample based on missing data for included variables (n = 3,264; 9.6 percent). The final sample for 2000 consists of 18,458 juvenile court referrals across 13 courts, while the 2010 sample consists of 12,265 juvenile court referrals across 13 courts. The unit of analysis is referral with a final disposition rather than individual youth, and some youth have multiple dispositions per year (there were 11,819 unique youth processed in 2000 and 8,590 unique youth processed in 2010). For analytic purposes, the 2000 and 2010 datasets were combined after each was coded following the same protocol (including same list of covariates), producing a full sample of 30,723 juvenile court referrals for the multilevel analysis (see below).
Measures
Dependent variables
The present study examines changes in racial and ethnic disparities from 2000 to 2010 across five major juvenile justice processing decisions: preadjudication detention, formal petition of delinquency, adjudication of delinquency, commitment to secure placement, and waiver to adult court. Although it represents a simplification of actual court processing, all outcomes were coded as binary for ease of interpretation in computing marginal effects and second derivatives for assessing interaction effects (see Analytic Strategy below). In effect, each dependent variable can be conceived as a discrete choice made at some point during juvenile justice processing, from intake to final disposition. The first decision point is preadjudication detention, whether to detain or release a youth at intake. In 2000, approximately 22 percent of cases were detained prior to petition, while approximately 13 percent of cases were detained in 2010. The second decision is whether to file a formal petition of delinquency (i.e., judicial handling) or not (i.e., non-judicial handling by probation officer). In 2000, approximately 63 percent of cases were formally petitioned, while approximately 55 percent of cases were petitioned in 2010.
For cases that are formally petitioned, the judge decides whether to declare a formal adjudication of delinquency or not. In 2000, approximately 56 percent of petitioned cases were adjudicated delinquent, while approximately 46 percent of petitioned cases were adjudicated delinquent in 2010. Petitioned cases could also be judicially waived to adult court for felony cases where the defendant was at least 14 years old. In 2000, approximately 2 percent of eligible cases were waived, while approximately 3 percent of eligible cases were transferred to criminal court in 2010. 6 For cases that were adjudicated delinquent, judicial disposition could involve commitment to secure residential placement (in Connecticut, this is administered by the Department of Children and Family) or some form of community supervision (including, in some cases, judicial discharge). A binary indicator of commitment versus other alternatives was employed because secure placement (i.e., commitment) is clearly distinct from non-secure alternatives, while judicial discharge can involve some kind of informal diversion (e.g., suspended commitment) that is more difficult to distinguish from other forms of community supervision. In 2000, approximately 17 percent of delinquent cases were committed, while approximately 12 percent of delinquent cases were committed in 2010. 7
Descriptive statistics for all variables are included in Table 1. Before proceeding to the independent variables included in the analysis, there are several descriptive trends worth noting. First, the use of preadjudication detention decreased markedly from 2000 to 2010 (from 22 to 13 percent). This may be due to a change in Connecticut law in 2007 requiring that only delinquent referrals (not status offenders) may be detained prior to an adjudicatory hearing. Additionally, fewer cases were formally petitioned (from 63 to 55 percent), adjudicated delinquent (from 56 to 46 percent), and committed to secure placement (from 17 to 12 percent). This is consistent with the Connecticut juvenile justice system becoming less punitive from 2000 to 2010 due to a variety of reforms (see Mendel, 2013; Tow Institute, 2016).
Descriptive Statistics.

aN1 = 18,458 (2000); N1 = 12,265 (2010).
bN1 = 11,526 (2000); N1 = 6,601 (2010).
cN1 = 6,418 (2000); N1 = 3,017 (2010).
dN1 = 6,777 (2000); N1 = 5,390 (2010).
Independent variables
The main independent variable of interest at the case-level was the race/ethnicity of the defendant, coded as a factor variable with four categories: Black, Hispanic (non-White), Other (Asian, American Indian, or Other), and White (reference group). In 2000, 47 percent of referrals were White, 31 percent were Black (non-Hispanic), 20 percent were Hispanic, and 2 percent were Other. In 2010, 40 percent of referrals were White, 36 percent were Black (non-Hispanic), 23 percent were Hispanic, and 2 percent were Other. Thus, the proportion of referrals that were non-White grew slightly over this time period.
Defendant age, sex, offense severity, offense type, prior record, and number of charges were included as controls. Age at referral was measured as a continuous variable ranging from 7 to 20, with a mean age (SD) of 13.7 (1.5) in 2000 and 14.6 (1.4) in 2010. This reflects the upper age of jurisdiction rising from 15 to 17 in 2007; in both periods, however, there was “extended age” jurisdiction to age 20. While Connecticut did not establish its lower age of jurisdiction (at age 7) until 2012, the common law limit of 7 was used as a cutoff (with lower values likely representing coding errors). Sex was measured as a binary variable, with “1” indicating male. Approximately two thirds of referrals were male (67 percent in 2000 and 68 percent in 2010).
Offense severity was measured as a series of nine dummy variables based on initial charges. The most serious type of offenses were felony A and B, which made up only 2 percent of referrals in 2000 and 1 percent of referrals in 2010. Slightly more referrals were designated felony C (5 percent in 2000 and 4 percent in 2010), while felony D and E made up 9 and 10 percent of referrals in 2000 and 2010, respectively. Most referrals were charged with misdemeanor offenses. In 2000, 18 percent of referrals were charged with misdemeanor A offenses, 15 percent were misdemeanor B, and 18 percent were misdemeanor C or D. In 2010, 24 percent of referrals were misdemeanor A, 20 percent were misdemeanor B, and 20 percent were misdemeanor C or D. Infractions made up approximately 3 percent of referrals in both 2000 and 2010. Probation technical violations and status offenses are not designated as felonies or misdemeanors. Probation violations made up 9 percent of referrals in 2000 and 5 percent of referrals in 2010. Status offenses made up 22 percent of referrals in 2000 and 14 percent of referrals in 2010. (This reflects Connecticut reforms aimed at reducing status offender referrals.) Misdemeanor A offense served as the reference category since it was the most common non-status offense. In addition to offense severity, two indicators of offense type are included. Violent offenses made up 17 percent of referrals in 2000 and 21 percent of referrals in 2010, while drug offenses made up 5 percent in 2000 and 7 percent in 2010.
The number of charged offenses was also included, which could range from 1 to 5; the mean (SD) number of offenses associated with a referral was 1.6 (.9) in 2000 and 1.7 (1.0) in 2010. Prior record was measured as 0 through 10 prior referrals (top-coded at 10 referrals or more, approximately 3 percent of referrals). The mean (SD) number of prior referrals was 2.0 (2.5) in 2000 and 2.0 (2.6) in 2010. Finally, year was included in the analyses; 60.1 percent of the sample was disposed in 2000 and 39.9 percent was disposed in 2010. Correlations between variables were generally weak (< .3) and tests for multicollinearity (variance inflation factor [VIF]) indicated no serious concerns across all models (VIF < 3). 8
Analytic Strategy
Given that referrals are nested within 13 juvenile courts in Connecticut, a multilevel modeling strategy was adopted to address possible statistical dependencies that may occur within clusters and lead to underestimated standard errors (see Johnson, 2010). For all five dichotomous outcomes, a parallel analytical strategy was adopted using multilevel logistic regression (i.e., random intercept models). All non-binary variables were grand mean centered.
The final sample size varies based on the dependent variable, with fewer observations as the referral travels further into the juvenile justice system from the petition decision (i.e., total referrals) to judicial disposition (i.e., delinquent juveniles). This non-random reduction in sample size raises the possibility of endogenous selection bias (see Elwert & Winship, 2014). Although it has become commonplace to use the Heckman two-step procedure to account for potential selection effects when looking at sequential criminal justice outcomes, doing so is only proper when valid exclusion restrictions are included (Bushway et al., 2007). Here, no exclusion restrictions could be identified. In this context, an alternative strategy is simply to examine the data generating process and inspect variables of interest for glaring selection problems (see generally Stolzenberg & Relles, 1997). Descriptive statistics for race and ethnicity indicated that proportions did not differ appreciably among the full and reduced samples. 9
To begin, year-specific models were estimated for each outcome, providing an initial illustration of the differences in magnitude and significance of race effects in 2000 and 2010. To test whether differences across years were significant, however, it was necessary to combine the datasets, create a binary variable for “year” (2000 versus 2010), and interact race and ethnicity by year. As the editors of the American Sociological Association have recently noted, the product term in regression output does not represent a valid test of an interaction for nonlinear dependent variables (see Mustillo et al., 2018). Instead, predicted probabilities were calculated in post-estimation for each of the multilevel logit models, using the margins command in Stata 15 (Mize, 2019). Marginal effects (i.e., first derivatives) were then estimated to assess differences in probability of each outcome by race/ethnicity (by year). To test interactions, second differences in marginal effects of race were then estimated across years. These second differences calculate the change in the marginal effect of race/ethnicity on an outcome from 2000 to 2010, along with whether this change is statistically significant. All analyses used two-sided hypothesis testing with an α of .05 and were performed using Stata 15.
Results
Table 2 includes the odds ratios for race/ethnicity for each juvenile court outcome, excerpted from year-specific multilevel logistic regression analyses with identical specifications—controlling for age, sex, offense severity, offense type, number of charges, prior record, and detention (full results available upon request).
DMC as Measured by Odd Ratios, 2000 Versus 2010.

aN1 = 18,458 (2000); N1 = 12,265 (2010).
bReference: White.
cN1 = 11,526 (2000); N1 = 6,601 (2010).
dN1 = 6,418 (2000); N1 = 3,017 (2010).
eN1 = 6,777 (2000); N1 = 5,390 (2010).
† < .10 * < .05 ** < .01 *** < .001 (two-tailed).
Comparison of racial and ethnic disparities in 2000 and 2010 appear to indicate as follows: for detention, Black-White disparities were greater in 2000 while Hispanic-White disparities were greater in 2010; for adjudication and waiver, disparities were greater in 2010; and for petition and commitment, there were no clear disparities either year. To test whether these changes are statistically significant, it is necessary to estimate multilevel models that combine the 2000 and 2010 data and interact race/ethnicity by year, followed by marginal effects and tests of second differences. Full results are displayed in Table 3.
Juvenile Court Outcomes with Race/Ethnicity-Year Interactions.

aN1 = 30,723; N2 = 13.
bN1 = 18,127; N2 = 13.
cN1 = 9,435; N2 = 13.
dN1 = 10,241; N2 = 13.
eReference category: White.
fReference category: Misdemeanor A offense (For waiver, the reference is Felony C offense).
† < .10 * < .05 ** < .01 *** < .001 (two-tailed).
Black-White Differences Over Time
Table 4 shows the predicted probabilities, marginal effects, and second differences for Black-White comparisons at each decision point.
Black-White Differences in Probability of Juvenile Court Outcomes: Marginal Effects by Year.
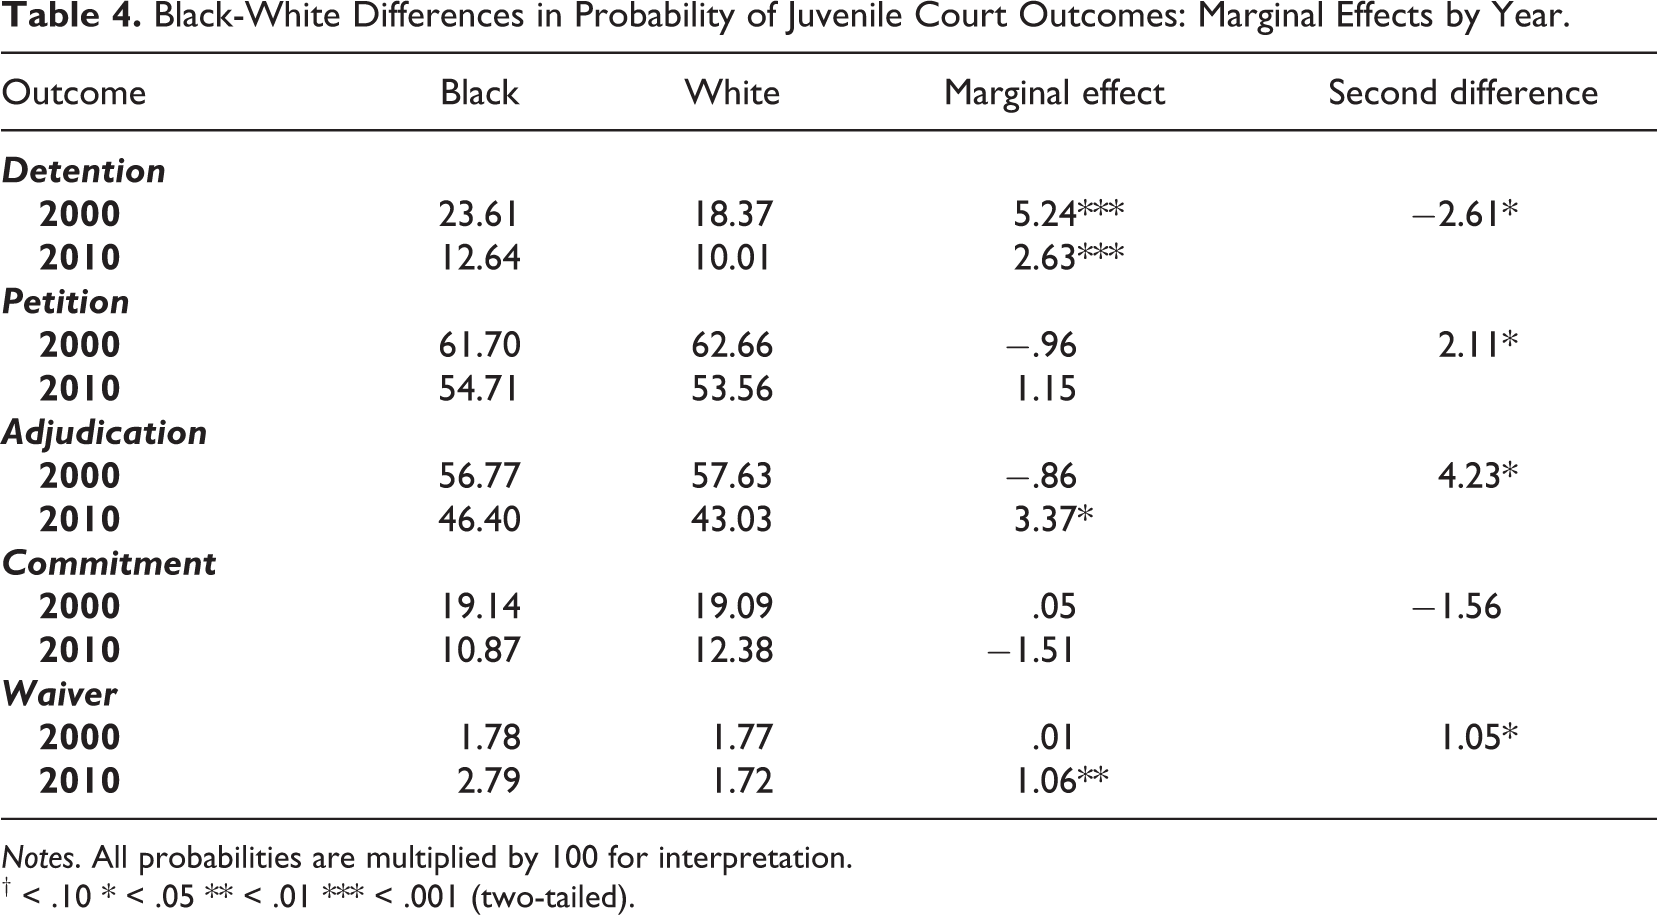
Notes. All probabilities are multiplied by 100 for interpretation.
† < .10 * < .05 ** < .01 *** < .001 (two-tailed).
First, the probability of detention in 2000 was 23.6 percent for Black referrals and 18.4 percent for White referrals, a 5.2 percent higher absolute probability of detention for Black youth (p < .001). In 2010, the probability of detention was 12.6 percent for Black youth and 10 percent for White youth, a 2.6 percent higher probability of detention for Black youth (p < .001). While a significant Black-White disparity persists from 2000 to 2010, the gap narrowed by 2.6 percent (p < .05), indicating that racial disparities in detention declined significantly from 2000 to 2010.
Second, the probability of formal petition of delinquency in 2000 was 61.7 percent for Black referrals and 62.7 percent for White referrals, a 1 percent lower probability of petition for Black youth (not significant). In 2010, the probability of detention was 54.7 percent for Black youth and 53.6 percent for White youth, a 1.2 percent higher probability of petition for Black youth (not significant). While the Black-White differences in probability (i.e., marginal effects) were not significant in either 2000 or 2010, the test of second differences indicates that the 2.1 percent increase in probability of petition for Black youth relative to White youth was significant (p < .05), such that racial disparities in petition increased significantly from 2000 to 2010.
Third, the probability of adjudication of delinquency in 2000 was 56.8 percent for Black petitioned youth and 57.6 percent for White petitioned youth, a .9 percent lower probability of adjudication for Black youth (not significant). In 2010, the probability of adjudication was 46.4 percent for Black youth and 43 percent for White youth, 3.4 percent higher for Black youth (p < .05). From 2000 to 2010, then, there was a 4.2 percent increase in probability of adjudication for Black youth relative to White youth (p < .05), such that racial disparities in adjudication of delinquency increased significantly from 2000 to 2010.
Fourth, the probability of commitment in 2000 was 19.1 percent for Black and White youth following adjudication of delinquency (i.e., no difference). In 2010, the probability of commitment was 10.9 percent for Black youth and 12.4 percent for White youth, a 1.5 percent lower probability of commitment for Black youth (not significant). The second difference was not significant, however, indicating no change in Black-White differences over time.
Fifth, the probability of waiver to adult court in 2000 was 1.8 percent for Black and White waiver-eligible referrals (i.e., no difference). In 2010, the probability of waiver was 2.8 percent for Black youth and 1.7 percent for White youth, 1.1 percent higher for Black youth (p < .01). From 2000 to 2010, then, there was a 1.1 percent increase in probability of waiver to adult court for Black youth relative to White youth (p < .05), indicating that racial disparities in waiver increased significantly from 2000 to 2010.
Hispanic-White Differences Over Time
Table 5 shows the predicted probabilities, marginal effects, and second differences for Hispanic-White comparisons at each decision point.
Hispanic-White differences in Probability of Juvenile Court Outcomes: Marginal Effects by Year.
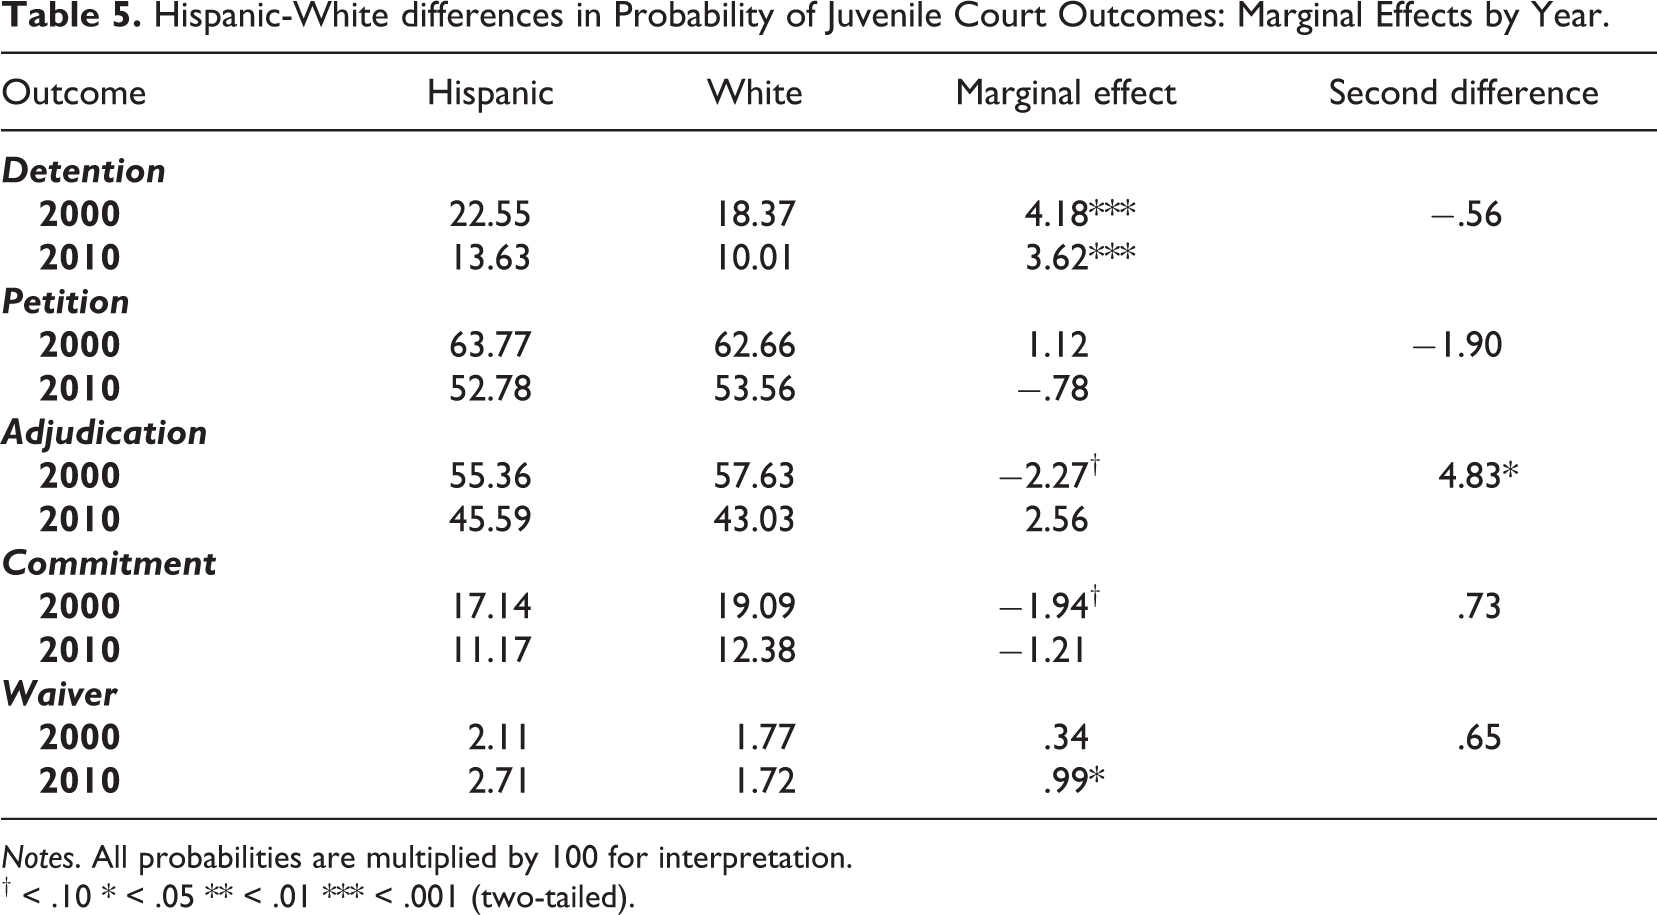
Notes. All probabilities are multiplied by 100 for interpretation.
† < .10 * < .05 ** < .01 *** < .001 (two-tailed).
First, the probability of detention in 2000 was 22.6 percent for Hispanic referrals and 18.4 percent for White referrals, a 4.2 percent higher absolute probability of detention for Hispanic youth (p < .001). In 2010, the probability of detention was 13.6 percent for Hispanic youth and 10 percent for White youth, a 3.6 percent higher probability of detention for Hispanic youth (p < .001). The .6 percent decrease in probability of detention for Hispanic youth relative to White youth from 2000 to 2010 was not significant, however, indicating no change in Hispanic-White differences over time.
Second, the probability of formal petition of delinquency in 2000 was 63.8 percent for Hispanic referrals and 62.7 percent for White referrals, a 1.1 percent higher probability of petition for Hispanic youth (not significant). In 2010, the probability of detention was 52.8 percent for Hispanic referrals and 53.6 percent for White referrals, a .8 percent lower probability of petition for Hispanic youth (not significant). Tests of second differences indicated that the 1.9 percent decrease in probability of petition for Hispanic referrals relative to White referrals was not significant, suggesting no change in Hispanic-White differences over time.
Third, the probability of adjudication of delinquency in 2000 was 55.4 percent for Hispanic petitioned youth and 57.6 percent for White petitioned youth, a 2.3 percent lower probability of adjudication for Hispanic youth (p < .10). In 2010, the probability of adjudication was 45.6 percent for Hispanic youth and 43 percent for White youth, 2.6 percent higher for Hispanic youth (not significant). While the Hispanic-White differences were not significant in 2000 or 2010, the test of second differences indicates that the 4.8 percent increase in probability of adjudication for Hispanic youth relative to White youth was significant (p < .05), such that ethnic disparities in adjudication of delinquency increased significantly from 2000 to 2010.
Fourth, the probability of commitment in 2000 was 17.1 percent for Hispanic delinquent referrals and 19.1 percent for White delinquent referrals, a 1.9 percent lower probability of commitment for Hispanic delinquents (p < .10). In 2010, the probability of commitment was 11.2 percent for Hispanic referrals and 12.4 percent for White referrals, a 1.2 percent lower probability of commitment for Hispanic delinquents (not significant). The .7 percent decrease in probability of commitment for Hispanic youth relative to White youth from 2000 to 2010 was not significant, indicating no change in Hispanic-White differences over time.
Fifth, the probability of waiver to adult court in 2000 was 2.1 percent for Hispanic waiver-eligible referrals and 1.8 percent for White waiver-eligible referrals, a .3 percent higher probability for Hispanic youth (not significant). In 2010, the probability of waiver was 2.7 percent for Hispanic referrals and 1.7 percent for White referrals, 1 percent higher for Hispanic youth (p < .05). From 2000 to 2010, then, there was a .7 percent increase in probability of waiver to adult court for Hispanic youth relative to White youth, but this was not itself significant—indicating that ethnic disparities in waiver did not change from 2000 to 2010.
Discussion
The present study examined whether racial and ethnic disparities in juvenile justice outcomes declined significantly over time as a result of the DMC mandate. While the DMC mandate is too nebulous to be formally evaluated as a success or failure, an important implication of a successful DMC mandate would be a reduction in racial and ethnic disparities over time, especially in states that have made good faith efforts at reducing DMC. As such, the present study assessed changes in Black-White and Hispanic-White disparities in a state that engaged in substantial reforms during that time. The findings reveal that racial and ethnic disparities in juvenile justice outcomes were not, for the most part, significantly reduced from 2000 to 2010. The one exception was preadjudication detention, where there was a significant decline in Black-White differences from 2000 to 2010—although Black youth were still more likely to be detained than White youth. Hispanic defendants also remained more likely to be detained in 2010, but with no significant decline over time. Surprisingly, disparities also increased at several decision points.
Several observations are worth making with respect to the findings. First, the largest disparities in 2000 were at detention, and so may represent “low-hanging fruit” in terms of reducing DMC. Due to state-wide reforms, the use of detention in the Connecticut juvenile justice system declined from 22 percent to 13 percent of total referrals—a 41 percent decrease in one decade. While minority youth remained overrepresented in 2010, this overall reduction benefited all youth and was accompanied by a reduction in racial disparities. This supports the notion that interventions involving alternatives to detention show promise (see Maggard, 2015). This is especially important as some research suggests that detention might mediate the relationship between race and subsequent outcomes (see, e.g. Spohn, 2009, 2013; Wooldredge et al., 2015). For example, if pretrial detention acts as a signal of dangerousness to judges, then reducing disparities at detention will reduce subsequent disparities as well (Rodriguez, 2010). Given that disparities at detention were not eliminated, however, future evaluations should assess whether disparities at detention can be further reduced.
The increased disparities at petition, adjudication, and waiver, however, stand in clear contradiction to the goals of the DMC mandate. One of the complications for assessing whether racial and ethnic disparities declined over time in Connecticut—as a successful DMC mandate would imply—was the lack of racial and ethnic disparities in the year 2000 after controlling for other case-level factors. Namely, only detention had significant disparities for Black and Hispanic youth relative to White youth (see Table 2). One interpretation is that this shows that reforms were indeed successful: for the only decision point with disparities in 2000, those disparities did decline. However, sensitivity analyses revealed that before adding case-level controls, race effects were larger and statistically significant across most outcomes (this was less pronounced for Hispanic-White comparisons). Specifically, before adding any controls, Black youth in 2000 were significantly more likely to be detained (OR = 1.81), formally petitioned (OR = 1.19), adjudicated delinquent (OR = 1.11), and committed to secure placement (OR = 1.49). In 2010, Black youth remained more likely to be detained (OR = 2.03), formally petitioned (OR = 1.63), adjudicated delinquent (OR = 1.25), and committed to secure placement (OR = 1.61)—with waiver also becoming significant (OR = 2.85). This illustrates that Black youth were over-represented at all major decision points. But the results from the full models (see Table 2) would seem to imply that Black-White differences were mostly accounted for by other case-level factors. (For example, the effect of race on commitment remained significant in both years until prior record was added as a control variable.) This is consistent with findings from the criminal justice system that racial disparities are largely—but not completely—explained by differences in legally relevant factors (King & Light, 2019).
Still, while a lack of substantial disparities in 2000 helps to explain the absence of significant reductions in racial and ethnic disparities over time, it is more difficult to explain why disparities increased at several decision points during a decade of reform. One possibility is that petition, adjudication, and waiver represent tightly coupled stages of processing with largely “legalistic” decisions (Bishop et al., 2010). If legal factors took on more substantive meaning due to reforms, this might actually increase disparities that are largely due to legal characteristics such as prior record. In other words, if Black and Hispanic youth were more likely to have prior contact with the system, then reforms aimed at making the system more legalistic could in fact create larger disparities over time.
One possible example of this involves the treatment of status offenders in Connecticut. In 2007, Connecticut took steps to decriminalize FWSN referrals (Mendel, 2013). In the present study, this is reflected in the reduction in referred cases that were status offenders in 2000 (22 percent) versus 2010 (14 percent). It is even more clearly reflected in the reduction in the proportion of status offenders who were detained at intake (11 percent versus 1 percent), formally petitioned (55 percent versus 12 percent), and adjudicated delinquent (46 percent versus 12 percent). This dramatic shift in how the Connecticut juvenile justice system processed status offenders appears related to changes in proportional representation because White youth were overrepresented among status offenders. In 2000, status offenses made up 23.3 percent of White referrals and 27 percent of Hispanic referrals, but only 15 percent of Black referrals. By 2010, status offenses made up 12.8 percent of White referrals, 19 percent of Hispanic referrals, and 9.5 percent of Black referrals. As such, reforms to decriminalize status offenses seem to have disproportionately benefited White youth while actually increasing the overrepresentation of Black youth. Zimring (2014) points out that reforms aimed at reducing overall youth contact with the justice system can have unanticipated effects in terms of proportional representation.
Returning to the main findings, racial and ethnic disparities did not decline over time for most outcomes. This is consistent with descriptive trends which show that DMC has remained largely unchanged over the past three decades (see Leiber & Fix, 2019). It is more surprising, however, in the context of a state that has undertaken substantial reforms. In what follows, a theoretical framework is proposed for thinking about the minimal impact of the DMC mandate in terms borrowed from the program evaluation literature: theory failure versus implementation failure (see Welsh et al., 2018).
Theory Failure or Implementation Failure?
While some have argued that calling the DMC mandate a “failure” is too strong (see, e.g. Leiber & Fix, 2019; Leiber & Rodriguez, 2011), and more evaluation research with rigorous quasi-experimental designs is surely needed, it nonetheless seems appropriate to observe that the DMC mandate has failed to achieve a substantial decline in racial and ethnic disparities since its adoption more than three decades ago. Broadly speaking, two major reasons for program failure can guide the inquiry (see Welsh et al., 2018). First, programs can be poorly implemented, even if the basic logic model behind the program is theoretically sound. This is implementation failure. The tendency for program effects to attenuate from early efficacy trials to wide-scale community settings, for example, is often attributed to implementation issues (Sullivan et al., 2017). Second, a program can be based on an inadequate or wholly erroneous theoretical foundation, such that the intervention will not cause the desired change even if implemented properly. This is theory failure. For example, Scared Straight programs assume that brief exposure to serious, adult criminals will have a specific deterrent effect on at-risk youth. These programs fail to deter crime not because of poor implementation, but likely due to the erroneous underlying theory (Petrosino et al., 2003). It is worth considering both implementation and theory failure explanations in the context of the DMC mandate.
Implementation failure
Perhaps the most obvious explanation for the DMC mandate’s failure is that it only vaguely requires to states to make a “good faith effort” to identify and address racial and ethnic disparities within their jurisdiction. As others have observed, “despite the benefits of interventions known to reduce DMC, the actual implementation of such initiatives, especially those involving system change, has been slow to nonexistent” (Leiber & Rodriguez, 2011, p. 113). In essence, some argue, the DMC mandate has simply not been taken seriously by most states, and not much has been accomplished beyond the identification stage. While a majority of states have implemented some kind of intervention aimed at reducing DMC within its jurisdiction, that latest available information from OJJDP indicates that only four states—including Connecticut—had conducted a formal evaluation of a such an intervention as of 2012 (Hanes, 2012). As others have noted, the implementation of the DMC mandate has been “judicious” to allay concerns about the federal government “overreaching and meddling in state and local affairs” (Leiber & Fix, 2019, p. 602). While this may represent prudent politics, it also limits the effectiveness of the mandate by failing to provide more specific instructions and stronger incentives to comply. Put more bluntly, some have referred to the mandate as nothing more than a “symbolic gesture” (Bell & Ridolfi, 2008, p. 14).
Notably, the 2018 reauthorization of the DMC mandate provides more specific requirements to states, and may be seen as an attempt to improve upon the implementation of the DMC mandate to date. The language of the original mandate requires that, in order to receive formula grant funding, states must submit plans that “address” efforts to reduce DMC in their jurisdictions. The new language requires that these plans must: (1) establish coordinating bodies to “advise efforts…to reduce racial and ethnic disparities”; (2) identify and analyze data on race and ethnicity “to determine which such points create racial and ethnic disparities among youth who come into contact with the juvenile justice system”; and (3) develop and implement plans with “measurable objectives for policy, practice, or other system changes” (34 U.S. Code § 11133(a)(15)). An overriding theme of these reforms is to communicate more specific expectations to states. If the failure of the DMC mandate is due to weak implementation, then the updated requirements may be viewed as promising.
A second possible source of implementation failure involves the focus of the DMC mandate. The most important source of racial and ethnic disparities in juvenile justice is the entry of youth into the system, primarily via arrest (Peck, 2018) as well as school referrals (Rocque & Snellings, 2018). As attested by trends in national RRIs as well as sophisticated analyses that follow youth from referral to final disposition (Shannon & Hauer, 2018), referrals account for the largest disproportionalities for Black youth (OJJDP, 2020). Yet the focus of juvenile justice reform more often involves post-referral processing—such as alternatives to secure detention and initiatives to reduce the number of committed or transferred youths. Dillard (2013) observes that, historically, the back-end of the system has received the most attention, with little mention of police contact in early assessments of DMC. While some jurisdictions (including Connecticut) have begun to adopt more front-end reforms—educating police officers on the stubborn reality of DMC and training them in youth development—it is still not the primary focus of DMC reduction efforts. According to this perspective, proper implementation of the DMC mandate requires a nearly complete shift in attention to police, who “determine, almost singularly, whether youth continue further into the juvenile justice system” (Dillard, 2013, p. 215; see also Donnelly, 2017). The updated requirements of the JJRA may be useful in this regard, as states may identify the extent to which DMC within their systems is due to differential police contact.
Theory failure
A second explanation for persistent racial and ethnic disparities in the juvenile justice system is theory failure. As others have observed, the theory behind the DMC mandate appears to be differential treatment: minority overrepresentation is caused by differential selection or treatment of minority offenders by juvenile justice system actors—whether due to overt discrimination, implicit racial bias, or policies with disparate impact on certain communities (Tracy, 2002, 2005). 10 Most proposed efforts to reduce DMC are thus focused on system solutions, such as strengthening federal requirements for state compliance, improving data collection, implementing training programs (e.g., cultural competence), providing alternatives to detention, and enacting racial impact statements (see Cabaniss et al., 2007; Leiber & Fix, 2019; Peck, 2018). For example, the JJRA’s update to the DMC mandate (effective 2020) requires that states establish coordinating bodies to evaluate racial and ethnic disparities in their juvenile justice systems as well as developing and implementing plans to address those disparities. Such solutions will only reduce DMC to the extent that it is caused by system problems, however. A theory failure explanation captures the insight that before disparities can be reduced or eliminated, their causes must be determined (Mears, 2007). The possible causes of DMC are complex, including “selective enforcement, differential opportunities for treatment, institutional racism, indirect effects of socioeconomic factors, differential offending, biased risk assessment instruments, differential administrative practices, unequal access to effective legal counsel, and legislative policies that disparately affect youth of color” (Nellis & Richardson, 2010, p. 267). As Mears and colleagues (2016) point out, research to date is largely unable to establish which of these factors (or combinations thereof) actually cause disproportionalities and disparities in juvenile and criminal justice processing.
The main alternative explanation for overrepresentation of minority youth in the juvenile justice system is the differential involvement hypothesis (Engen et al., 2002). This posits that Black and Hispanic youth are more likely to engage in delinquent behavior (or more serious delinquent behavior) and to have more prior contact with the system compared to White youth. Since the DMC mandate is based on the theory of differential treatment, it can be expected to fail to the extent differential involvement, instead, is the root cause of racial and ethnic disparities in juvenile justice (see Tracy, 2002, 2005). For example, a common strategy involves providing cultural sensitivity training to juvenile justice officials (see, e.g. Cabaniss et al., 2007). This assumes that the causal mechanism driving DMC is biased decision-making by the recipients of such training—most likely due to implicit rather than explicit bias (Peck, 2018). To the extent that differential treatment in the juvenile justice system is minimal or nonexistent, however, such training will not produce the desired change, and instead represents a waste of scarce resources that might be better allocated elsewhere (see Mears, 2007, 2010).
Others have noted that the causes of differential involvement remain comparatively understudied (see Piquero, 2008), reinforcing an earlier observation by Sampson and Wilson (1995) that “the discussion of race and crime is mired in an unproductive mix of controversy and silence” (p. 37). In recent years, more research has begun to explore the causes of differential offending, including the “racial invariance hypothesis” (see, e.g. Sampson et al., 2018; Sampson et al., 2005; Vélez, 2018) as well as the development of a “theory of African American offending” (see, e.g. Unnever, 2014; Unnever et al., 2016). These are promising developments, and more research attention to the underlying causes of differential group offending is needed (see, e.g. Felson et al., 2008; McNulty & Bellair, 2003; Piquero, 2015). This research may provide crucial insights for future efforts to reduce minority overrepresentation in the juvenile justice system.
Differential Involvement as an Alternative Explanation for System Disparities
The possibility of theory failure is premised on the notion that differential involvement may be more responsible for DMC than differential treatment. While it is well-established that Black and Hispanic youth commit more crime than White youth (see, e.g. Elliot, 1994; Hindelang, 1978; Piquero et al., 2015; Sampson & Lauritsen, 1997; Sampson et al., 2005), it is less clear whether differences in offending can fully (or mostly) account for differences in arrest and subsequent processing disparities (see Leiber & Fix, 2019; Unnever et al., 2019). In the context of criminal justice, Blumstein (1982, 1993, 2009) has argued that differential treatment cannot account for most of the racial disparity in sentencing outcomes, and that differential offending in the population must instead be the root cause (see also Beck & Blumstein, 2018).
One possible objection to shifting focus from differential treatment to differential involvement is that it may lead to a cynical “nothing can be done” mentality, or even “blaming the victim” (Leiber & Fix, 2019, p. 601). These are surely legitimate concerns. For purposes of evaluating the DMC mandate, however, the logic remains: if differential offending represents the main cause of racial and ethnic disparities, then reform efforts guided by the differential treatment assumption will prove ineffective. Instead, a differential involvement explanation for DMC would imply that policy efforts need to move beyond the justice system, such as crime prevention efforts that focus on individual and neighborhood risk factors associated with differential offending (see, e.g. McNulty et al., 2013) as well as reforms that address the macro-social conditions that give rise to minority overrepresentation in offending (see, e.g. Anderson, 1999; Massey & Sampson, 2009; Sampson, 2009; Sampson & Lauritsen, 1997). For example, in their theory of race, crime, and urban inequality, Sampson and Wilson (1995) posit that “macro-social patterns of residential inequality give rise to the social isolation and ecological concentration of the truly disadvantaged, which in turn leads to structural barriers and cultural adaptations that undermine social organization and hence control of crime” (p. 38; see also Sampson et al., 2018). As Feld (2017) puts it, “No justice system can remedy these conditions” (p. 280). The DMC mandate’s approach—identify, assess, intervene, evaluate, and monitor—largely fails to consider that disparities might be caused by “structural factors about which state agencies can do little” (Piquero, 2008, p. 62).
Conclusions
The practical implications of identifying the root causes of DMC are clear. If persistent disparities are largely due to differential treatment, then the failure of the DMC mandate is one of implementation. But if disparities are largely due to differential involvement, then the failure of the mandate is one of theory—and reducing DMC will require an altogether different strategy. While the present findings cannot definitively adjudicate between these interpretations, they suggest that the current focus on differential treatment may be misguided. First, Black-White disparities only declined for detention (and increased for petition, waiver, and adjudication), while Hispanic-White disparities did not decline for any outcomes (and increased for adjudication). Second, sensitivity analyses revealed that, in 2000, there were significant racial and ethnic differences across all outcomes except waiver before controlling for legal factors. After controlling for legal factors, however, only disparities at detention remained.
Several concluding thoughts arise from the discussion above. First, future attempts to reduce minority contact with the juvenile justice system should focus on the point of arrest or referral. As noted above, the main driver of minority overrepresentation in the juvenile justice system involves entrance into the system (Dillard, 2013). National RRIs indicate that referral rates in 2018 (latest available) were 2.9 times greater for Black youth than White youth (OJJDP, 2020). Similarly, in the present study, Black youth made up 31 and 36 percent of referrals in 2000 and 2010, respectively, compared to 12 and 12.3 percent of the youth population (age 10–17) in Connecticut during those same years (Puzzanchera et al., 2020). What causes this initial disparity in referrals is really the crucial question—but it is an under-researched one (see, e.g. Claus et al., 2018). In part, this is due to the unique methodological challenges involved in assessing the causes of arrest disparities (see Neil & Winship, 2019). As one scholar laments, “it is virtually impossible really to know whether youths’ behavior or police officers’ behavior have the greater effect on initial disparities” (Kempf-Leonard, 2007, p. 80). More research is needed on this key decision point, especially in light of theoretical expectations that implicit cognitive biases may be greater among police than other juvenile justice officials (see Mears et al., 2017).
Second, it may be that the juvenile justice system—as well as the criminal justice system more broadly—is limited in its ability to address racial and ethnic disparities if those disparities are largely the product of broader macro-social forces that contribute to higher levels of offending by certain historically disadvantaged groups. The point is not that differential offending accounts for all racial disparities in the juvenile justice system—scholars agree that disparities cannot be completely explained by racial differences in offending (see Franklin, 2018; King & Light, 2019). At a minimum, however, partial theory failure seems quite likely.
11
While the consensus among researchers is that racial and ethnic disparities are not primarily due to differential treatment (see, e.g. Franklin, 2018; Sampson & Lauritsen, 1997), it is not clear that this consensus has reached policymakers and practitioners. That is, efforts to address racial and ethnic disparities in the juvenile justice system do appear to have assumed that disparities are largely caused by differential treatment (Tracy, 2005). In 2015, for example, the Center for Children’s Law and Policy published a comprehensive practice manual for reducing racial and ethnic disparities across major points of contact in the juvenile justice system. In a section concerning reform efforts to date, the report argues: Efforts to reduce racial and ethnic disparities in the juvenile justice system fail for many reasons. Three are most prominent. The first is that, on a system level, stakeholders don’t address the issues. They either cannot or will not deal with the existence of bias in their jurisdiction. The second reason is that race is a particularly difficult thing for people to talk about…. The third reason is stakeholders don’t understand what they need to do, in practical and concrete terms, to reduce disparities. (CCLP, 2015, p. 25, emphasis added)
A final observation is that reducing DMC can be conceived in absolute as well as relative terms. Reform efforts can prioritize reducing the proportion of minorities in the system or reducing overall harm to youth in the system. Zimring (2014) provocatively suggests that by focusing too much on “equalizing disadvantage” (p. 173), we may lose sight of the larger goal to have less system contact with all youth. While reducing relative disparities has proven elusive, juvenile justice reforms to date have reduced overall contact with youth. In the present study, for example, there were substantial reductions in the processing of juvenile offenders. The total number of referrals in Connecticut decreased from 18,458 (in 2000) to 12,265 (in 2010)—a 34 percent reduction. Once in the system, the proportion of youth who were detained decreased from 22 percent to 13 percent. Similarly, the proportion of youth who were formally petitioned decreased from 63 percent to 55 percent, and the proportion of petitioned youth who were adjudicated delinquent decreased from 56 percent to 46 percent. Finally, the proportion of delinquent youth who were committed to secure facilities decreased from 17 percent to 12 percent. Only waiver to criminal court did not see any decline.
When we focus only on relative disparities, it appears that no progress has been made. Minority overrepresentation remains high, similar to minority overrepresentation in the criminal justice system. But in absolute terms, the rates of confinement in the criminal justice system are three times higher. Again, Zimring (2014) observes, The major positive reforms in juvenile justice over the past generation…have not had dramatic impact on the disproportionate involvement of minority youth in the deep end of the juvenile system. But the lower levels of incarceration embraced by juvenile courts mean that the harms suffered within juvenile courts by all sorts of youth are much smaller than the harms imposed on young offenders in America’s criminal courts. It turns out that the entire apparatus of juvenile justice is functioning as a substantial harm-reduction program for minority delinquents. (pp. 184–185, emphasis added)
Footnotes
Declaration of Conflicting Interests
The author(s) declared no potential conflicts of interest with respect to the research, authorship, and/or publication of this article.
Funding
The author(s) received no financial support for the research, authorship, and/or publication of this article.