
Abstract
Organizational researchers widely acknowledge that positive relational behavior is associated with leadership effectiveness. In this exploratory study, we seek to extend previous research examining contextual factors that influence leadership style based on the characteristics of person–vocation fit. Using information derived from a 360° assessment that included one’s top managers, peers, and subordinates (N = 934), we find that leaders working in settings that attract Holland’s Social (S) types demonstrate more positive relational behavior than those who work in Realistic (R) type work settings. Our research also indicates that the relationship between leadership style and perceived effectiveness varies based on the work interests shared by individuals who are attracted to different vocational settings. One style of leadership does not fit all work contexts, and the person–vocation fit framework can help explain what comprises effective leadership style in different contexts.
Introduction
Antonakis, Avolio, and Sivasubramaniam (2003) report that a number of studies have identified different contextual factors that influence the degree to which leadership behavior is seen as effective. These contextual factors include organizational characteristics such as size (Ling, Simsek, Luatkin, & Viega, 2008); structure and formalization (Emery & Trist, 1965); rate of change (Hawkins & Dulewicz, 2009); culture (Porter & McLaughlin, 2006); people (Porter & McLaughlin, 2006); technology; type of department, industry, history, and regulation (Jepson, 2009); and the application of strategy in the public, private, and nonprofit sectors (Vining, 2011). Results of these studies demonstrate that the context influences perceived leader effectiveness and suggests that different situations require different leader behaviors.
The purpose of this study is to shed additional light on the relationship of leadership behavior and overall leadership effectiveness in two contrasting work environments defined by overall person–environment (P-E) fit theory (Rounds, Dawis, & Lofquist, 1987). Specifically, we seek to gain insight into leadership style differences in organizational contexts associated with person–vocation (P-V) fit (Holland, 1977). Although positive relations with others is an essential leadership characteristic (Gardner, Avolio, Luthans, May, & Walumbwa, 2005; George, Sims, McLean, & Mayer, 2007), we propose that leaders in dissimilar occupational settings demonstrate different relational behaviors. We also posit that the strength of the relation between relational leadership behavior and leadership effectiveness differs by organizational setting. Relying on Holland’s vocational interest hexagon framework (Holland, 1997) and the degree of differences by interest type, we compare the ratings of leader behavior in manufacturing that tends to attract Realistic types and a social service setting that tends to attract Social types. We explore these assertions using a 360 degree (360°) multisource assessment method. We expect that leaders in social services will be rated higher in positive relational behavior than leaders in manufacturing and that the relational dimensions employees associate with effective leadership will vary by vocational context.
In the next section, we review literature of relational leader behavior and P-V fit and present the study hypotheses. We follow this with a discussion of our methodology including sample, assessment instrument, and validation and reliability of our leader relationship dimensions by work setting. We then compare the ratings of positive relational practices of the leaders by others in their immediate role sets within the organization. We subsequently test the relationships of positive leadership practices with overall leadership effectiveness in both settings. Last, the findings are summarized along with their implications and study limitations.
Literature Review
More than a half century ago, the Ohio State and Michigan leadership studies (see Katz, Maccoby, & Morse, 1950; Stogdill, 1969) identified two basic areas of leadership focus: Getting tasks accomplished and the individualized consideration (relationship) from the leader to the subordinate. Leadership research has extended the Ohio State dichotomy relating to task and individualized consideration to more explicit models of transactional (extrinsic reward focused) and transformational (intrinsic engagement oriented) styles of leadership (Avolio, Bass, & Jung, 1999; Judge & Piccolo, 2004). The latter models are not dichotomous, as transformational leadership is viewed to be a relational extension of transactional (task/reward) behaviors used by leaders to shape employee behavior.
Studies report transformational leader behaviors that are relational such as creating vision, purpose, intellectual stimulation and empowerment, personal care, trust, and mentoring to be central to motivating employees to exceed performance expectations (Avolio & Bass, 1995). Based on their meta-analytic study, Judge and Piccolo (2004) found high associations between transformational leadership and leader effectiveness from the perspective of subordinates (p ≤ .01).
An extension of the transformational leader construct has been the identification of the authentic leader style, which is characterized as having relational transparency (Gardner et al., 2005; Ilies, Morgeson, & Nahrgang, 2005). Relational transparency on the part of the leader influences trust in others through the leaders’ ethical character and openly sharing information with others (Kernis, 2003). Trust and trustworthiness are the cornerstone of leader relational behavior that accelerates employee performance (Colquitt, Scott, & LePine, 2007). Leaders who foster trust effectively are reported to increase job satisfaction (Gilstrap & Collins, 2012), accountability, collaboration, cooperation and commitment in others (De Cremer & DeWitte, 2002), and organizational performance (Bass, 1985; Dirks & Ferrin, 2002; Gardner et al., 2005; George et al., 2007).
In general, the literature supports the desirable effects of positive relational behavior of leaders on those led (Dirks & Ferrin, 2002; Walumbwa, Avolio, Gardner, Wernsing, & Peterson, 2008), and those with whom the leader works within the organization (Avolio, 2007; Balkundi & Kilduff, 2005; De Cremer & DeWitte, 2002; Johansooz, 2006). Leaders hold legitimate authority from the positions in which they manage, yet they also need to demonstrate positive relations with those on their teams to lead them most effectively (cf. Avolio, Walumbwa, & Weber, 2009; Walumbwa et al., 2008). The current research explores such positive relational behaviors among leaders to determine the importance of the behaviors in different vocational contexts using a P-E fit framework.
P-E fit has been investigated at different levels relating to the organizational environment. Person–job (P-J) fit focuses on the congruence between employees’ needs and preferences and job requirements (Edwards, 1991; Gilbert, Sohi, & McEachern, 2008); person–organization (P-O) fit studies the fit between individual values and the organization (Kristof-Brown, 1996; Super, 1953); person–group (P-G) fit targets the compatibility of employee characteristics with those in a work group (Kristof-Brown, Zimmerman, & Johnson, 2005); person–supervisor (P-S) fit focuses on the match between leader–subordinate interaction (Van Vianen, 2000); and person–vocation (P-V) fit relates to personal interests or preferences and vocational choice (Holland, 1997). In this study, we seek to gain insight into differences in organizational contexts associated with P-V fit based on Holland’s typology of work interests and vocational choice (Holland, 1997).
Holland’s theory posits that working adults search for environments that resemble their personality profiles. Behavior within organizations is determined by the interaction of personality and the work environment (Holland, 1997). He identified six types of work interests and complementary work settings for each type: Realistic (Mechanical), Investigative (Science), Artistic (Arts), Social (Social service), Enterprising (Business Contact), and Conventional (Business Operations). The six types differentiate people attracted to specific and complementary work environments. They also are aligned with unique organizational contexts that become “strategic fits” between people and work settings (Holland, 1997; Kathrins, 2007).
While there is evidence that specific Holland hexagon types are better suited to explicit organizational contexts, there is little information relating to leadership behavior that may complement different vocational settings (cf. Chi & Pan, 2012). Our research focuses specifically on individuals who are attracted to Social-type work settings and those attracted to Realistic-type work settings to examine relational leadership behaviors and perceived leadership effectiveness. Not only are these two types opposite one another in Holland’s hexagon, empirically, but these two vocational interests also display more difference between them than with any other of the six vocational interest types (Holland, 1997; Nye, Su, Rounds, & Drasgow, 2012). These dissimilar and contrasting types are described in greater detail in the following paragraphs.
Contrasting Two Different Types of Work Environments
P-V fit theory posits that people search for work environments and work placements that resemble their personality profiles. As Holland (1997) states, the interaction of personality interests and work environment results in behavior that is unique to the work setting itself. Vocational interest research suggests that the greater the fit between the individual’s work interests and characteristics of the work environment, the better the employee’s work satisfaction (Rounds et al., 1987), morale, job commitment, employee productivity (Barrick, Mount, & Judge, 2001; McCloy, Campbell, & Cudek, 1994), and performance (Nye et al., 2012). P-V fit theory provides a basis from which one can make assumptions about those who are in various vocational fields.
Holland (1997) suggests that those having Realistic vocational interests will be attracted to mechanical-type work, and those having Social interests will be attracted to Social service–type vocational environments. Nye et al. (2012) report that when such congruence between interest type and work placement exists (i.e., Realistic-manufacturing; Social-social service), employees will perform more effectively.
Realistic types tend to be quiet (less extraverted), practical types who place less emphasis on friendship (Spokane, Luchetta, & Richwine, 2002). Jobs in the Realistic category have been found to require less formal education than jobs that attract the other Holland categories (De Fruyt & Mervielde, 2006).
In contrast, those in the Social category tend to be more interested in helping people and solving people problems where they can exercise their interpersonal skills (Armstrong & Rounds, 2010). They tend to have high social skills and this generally has been found to be a strong indicator of work performance effectiveness and interpersonal facilitation (Hochwarter, Kiewitz, Gundlach, & Stoner, 2004). The type of work in social services is primarily about relationships and helping others (Spokane et al., 2002).
Holland’s Social types are characterized as sociable, friendly, and understanding, with less interest in scientific and technical applications (Spokane et al., 2002). Chan, Rounds, and Drasgow (2000) found Social types to be significantly motivated to lead others, while such a correlation was not found for Realistic types. The Realistic types place less emphasis on interpersonal interaction and agreeableness.
Van Iddekinge, Roth, Putka, and Lanivich (2011) suggest that researchers who study work environments may need to identify “best-bets” in terms of the types of settings and interests that may hold the most promise for purposes of analysis. Interest research indicates that those in manufacturing will be more Realistic in their interest orientation, and those in social services will be more Social in theirs. In this research, two different types of organizational work environments based on Holland’s (1997) model were selected to provide a Realistic–Social contrast in employee work interests. These two work environments are highlighted below.
Manufacturing
The nature of the work is reported to be fairly routine, repetitive, and with a high emphasis on efficiency and predictability (Leidner, 1993; Stinchcombe, 1990). These conditions make it possible to create master schedules to determine work priorities, as well as to provide clear guidelines for how the work is to be done along with specific standards that are to be met. Work is reviewed not only by the direct supervisors, but others as well, including quality assurance, leaders and workers from other units in their internal supply chain, plant management, and, at times, representatives from their customers (Pluta, Fields, & Smith, 2010). Studies have revealed employees in manufacturing settings may be less committed to their organizations than are those who work in social services (Goulet & Frank, 2002; Mowday, Porter, & Steers, 1982). The perception of leadership in Realistic work contexts is influenced by employees given clearly defined job tasks and work processes (Tosi, 1991).
Social Services
Those working in social services work with organic-type systems (Fairhurst & Rogers, 1989). By doing so, they experience more uncertainty, complexity, and ambiguity in the work they do than do those in manufacturing (Tham & Meagher, 2009). They are more purpose driven and are reported to have higher levels of commitment to the goals of the organization, and employee satisfaction tends to be higher than those who work in most other environments (Cheverton, 2007; Deckop & Cirka, 2000). They are required to work well within their organizations and with others in their communities to build networks needed for funding, interagency collaboration, political support, and the like. Employees in these work settings rely on open communications and feedback and the quality of such influences perceived leadership effectiveness (Cheverton, 2007; Deckop & Cirka, 2000).
Van Eron and Burke (1992) reported a relationship between leadership style and personality. Those more Social in orientation are more likely to demonstrate transformational leadership behavior, while those less interested in people are more likely to lead transactionally. As a result of the above discussion on vocational interest theory, we hypothesize the following:
Hansen and Villadsen (2010) note that job complexity, role clarity, and job autonomy are important factors influencing leadership effectiveness. They suggest highly complex jobs or jobs with high levels of role ambiguity require different relational leadership behaviors than jobs with lower levels of complexity. Based on the differences in perceived leadership effectiveness in the two Realistic and Social work settings discussed above, we hypothesize the following:
Method
Participants
In the research reported here, we used ratings of supervisors and managers in for-profit manufacturing and not-for-profit local social services organizations. The leaders participated voluntarily as part of their own leadership development education. Each leader was asked to identify a minimum of at least two subordinates, two peers, and two top managers to whom they report to assess their leadership performance. Leaders provided the observers/raters instructions pertaining to how to go online and complete the assessment. The questionnaires for each role were the same with the exception of the introduction (please contact the first author for specific wording).
Nine-hundred thirty-four members of the leaders’ role set provided assessments of their leaders’ relational behaviors. Approximately one half of the respondents were 40 years or younger. Most respondents in the manufacturing setting were male while most respondents in the social services setting were female. The number of assessed leaders in the manufacturing organization was 16, and the number of assessed leaders from the social services work setting was 86. Table 1 shows the characteristics of the sample.
Characteristics of the Sample.
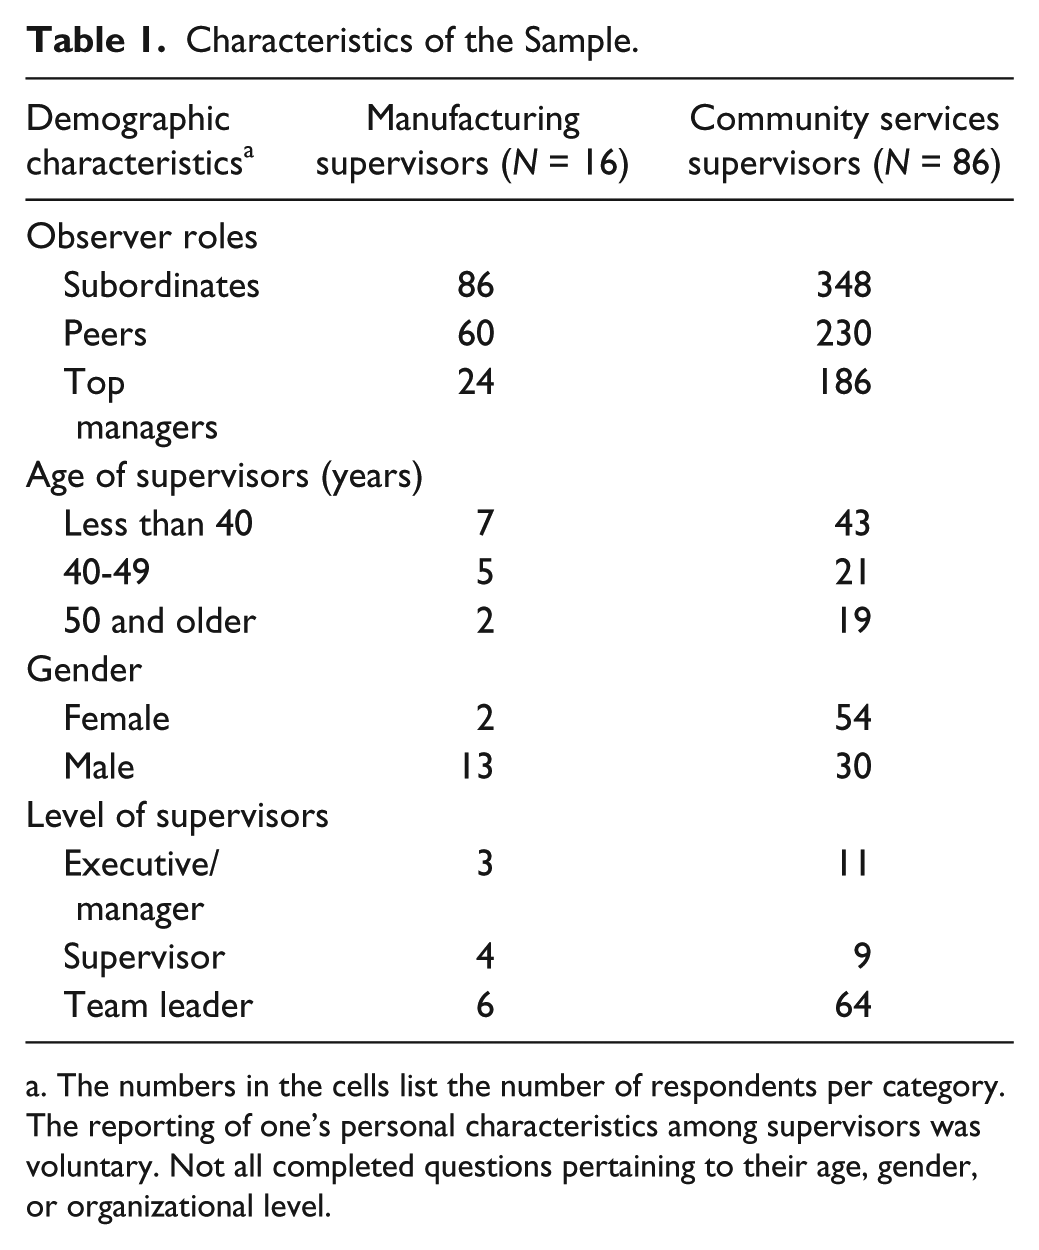
The numbers in the cells list the number of respondents per category. The reporting of one’s personal characteristics among supervisors was voluntary. Not all completed questions pertaining to their age, gender, or organizational level.
Measures
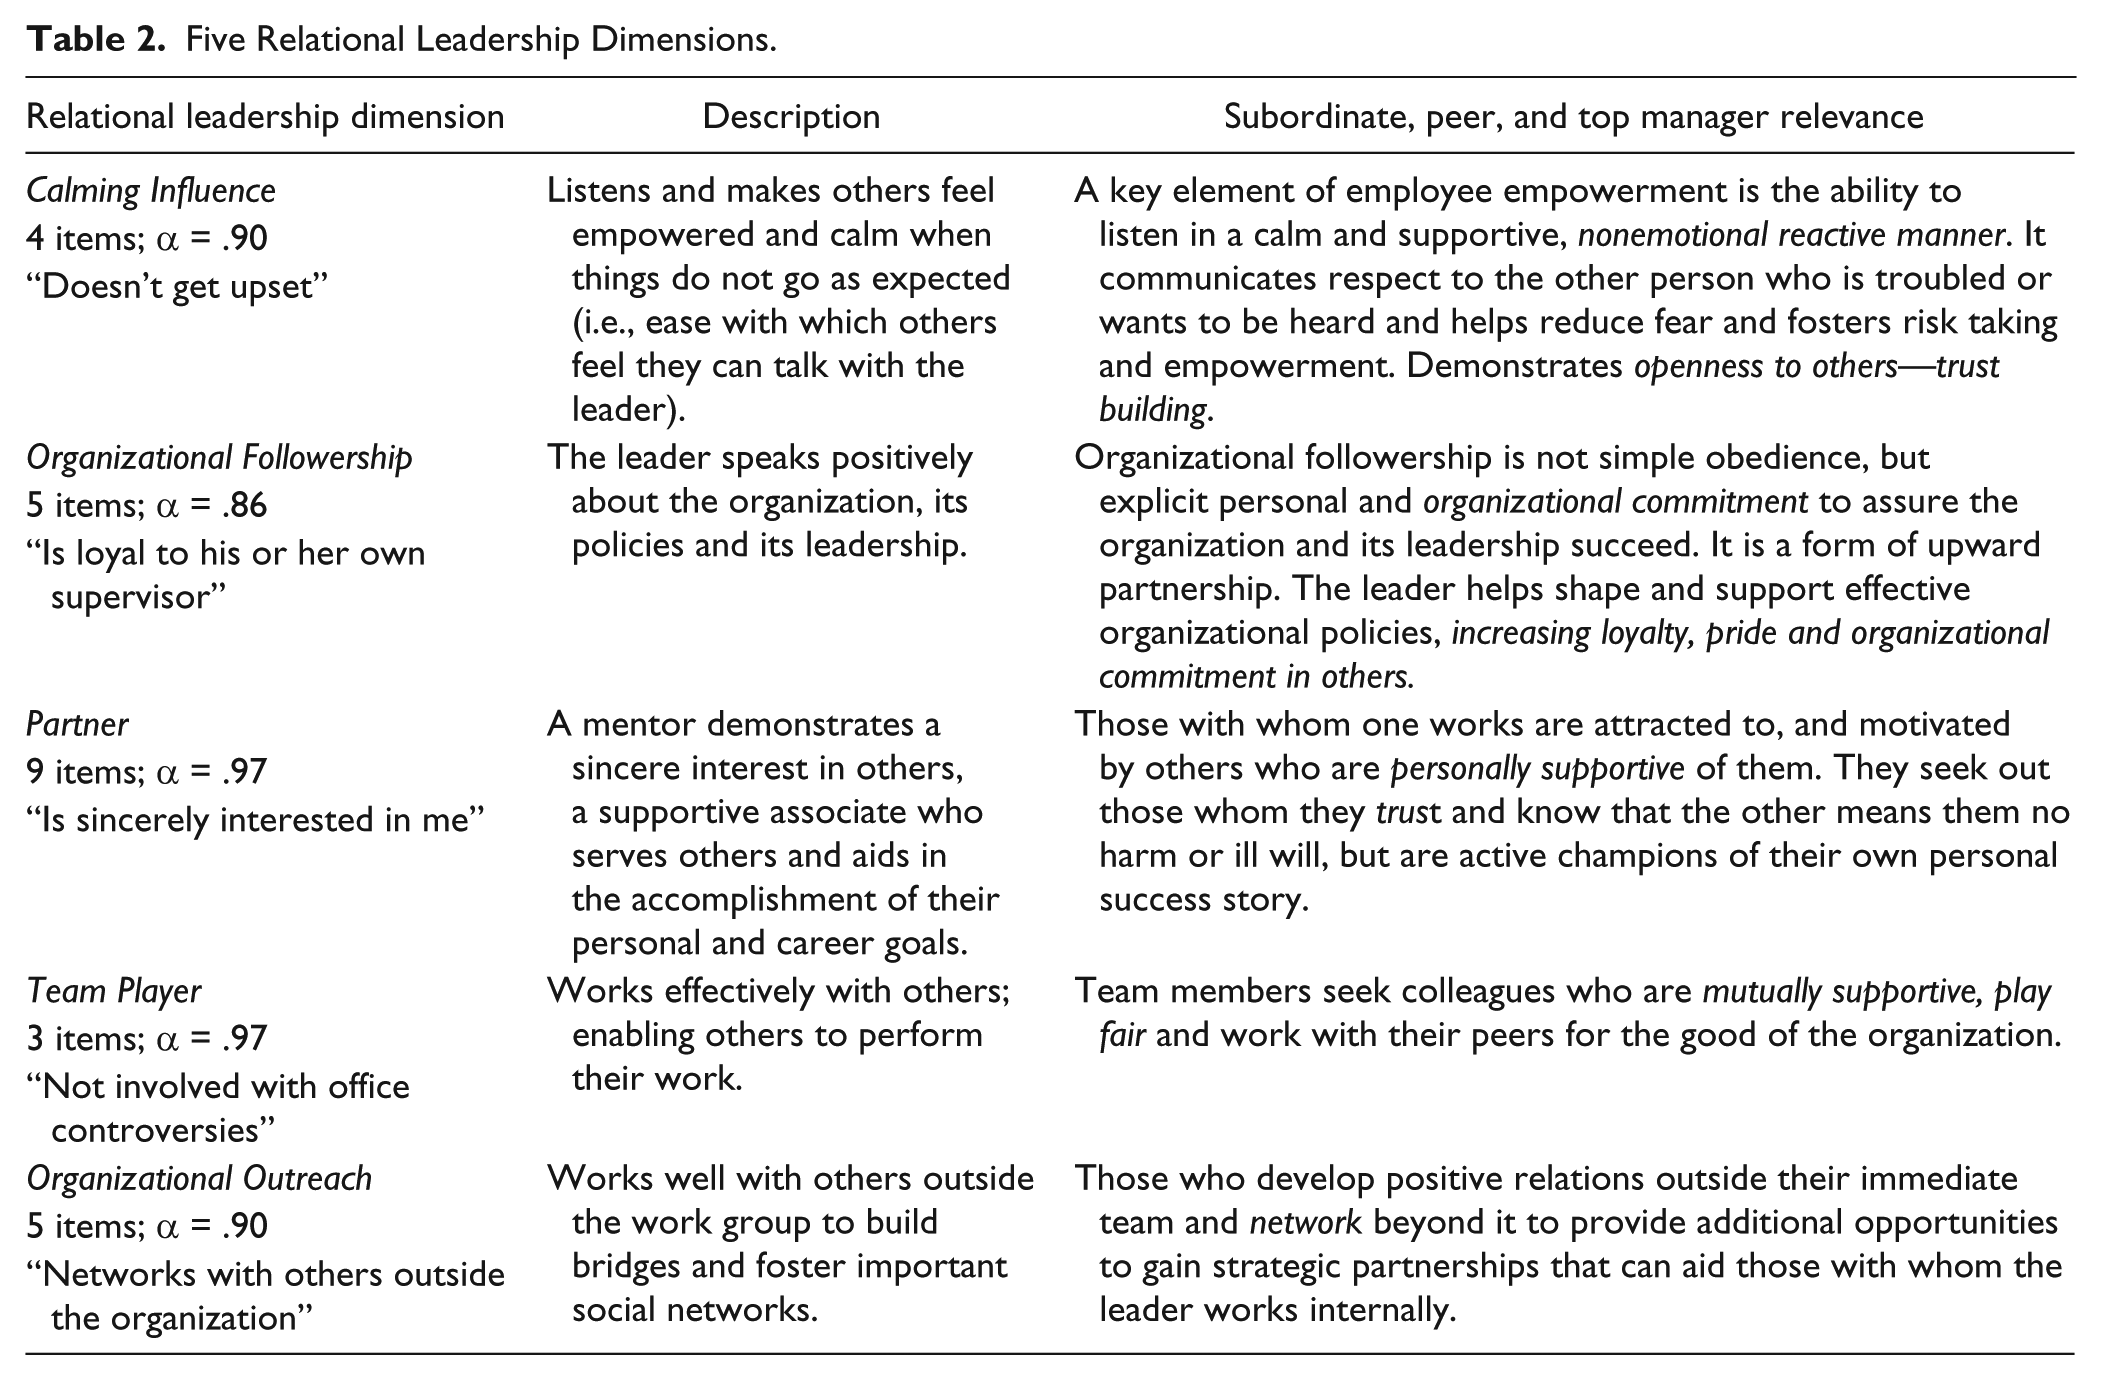
To measure the leadership variables in this study, we used a 360° multisource assessment method called the 360° Leadership Effectiveness Assessment (LEA) questionnaire. It includes self, subordinates, peers, and the leaders’ own higher-level managers’ assessments of their leadership and other work-related behaviors (McCarthy & Garavan, 2001). The LEA includes nine empirically derived (EFA and CFA) dimensions of effective leadership and is fully online (Gilbert, 2009). It has 53 statements pertaining to leader behavior that a respondent is asked to answer based on a 5-point Likert-type scale (1 = strongly disagree, 5 = strongly agree). Five of the nine dimensions included in the leadership assessment are analyzed here as they relate specifically to relational leader behaviors. The other four do not and thus are not part of this analysis. Table 2 provides a brief description of each of the five leadership dimensions used in this study along with examples of statements in the questionnaire related to each dimension and the relevance of each dimension to effective leadership within the organization.
Five Relational Leadership Dimensions.
In addition to the aforementioned five relational leadership dimensions, an all-inclusive measure of Overall Leadership Effectiveness (OLE) is included in the LEA and is comprised of four criterion statements: Overall, I would rate this person to be among the best supervisors one could ever have; In terms of getting productivity from others, I rate this supervisor among the best one could have; This person is among the most authentic (genuine, trustworthy, reliable, and believable) leaders one could have; This person motivates employees to accomplish the goals of the organization more than most other supervisors they could have.
Validity and Reliability
We used the procedures recommended by Gerbing and Anderson (1988) to establish the leader relational behavior and leadership effectiveness scales. First, as recommended by these authors, we conducted an exploratory factor analysis (EFA). The purpose of the EFA is to ascertain if the scale items load cleanly and significantly on the hypothesized factors; items that do not load or cross-loaded on factors were dropped. The EFA solution explained 81.61% of the total variance and each item loaded cleanly on the expected factors. Following the EFA, we ran a confirmatory factor analysis (CFA) model to confirm the dimensions of the scales and establish discriminant validity. The CFA model had a significant χ2 = 1453.08 (df = 866, p ≤ .01), which is expected given the number of parameters being estimated. Additional fit statistics were normed fit index = .976; nonnormed fit index = .989; comparative fit statistics = .990; root mean square error of approximation = .04 (with 90% confidence interval range between .036 and .044), and average off-diagonal standardized residual = .035. These statistics indicate that the model had an acceptable fit to the data (Hu & Bentler, 1999). Additionally, all the items loaded significantly (p ≤ .01) on their hypothesized factors, establishing convergence in measurement and confirming scale dimensionality.
Next, we tested for discriminant validity using a two-step, nested model. Taking one pair of factors at a time, we ran a series of nested models. In the first model the scale items were set to load on their theorized factor and the factors were allowed to covary freely with one another. In the second nested model, the covariance was set to 1.00 indicating that the two factors were the same. Discrimination between the factors was determined by assessing the difference between the χ2 of the free covariance model and the χ2 of the constrained model. A significant Δχ2 indicates discriminant validity. All Δχ2 (df = 1) were found to be significant, thus providing evidence that the factors representing our scales were unique and distinct from each other. We also examined the factor correlations as a further check of discriminant validity. While some were significant at p ≤ .01, all the correlations are less than the suggested level of .80 (Hair, Anderson, Tatham, & Black, 1998), providing evidence of discrimination among the factors.
After establishing validity of the dimensions, reliabilities were assessed by computing coefficient alphas. The coefficient alpha of the OLE scale is .93. The alphas for the five relational leadership dimensions described in Table 2 range between .86 and .97. These tests establish that our scales have adequate reliability and validity levels.
Check for Common Method Bias
We used the Harman’s single-factor test to check for the presence of common method bias (Podsakoff, MacKenzie, Lee, & Podsakoff, 2003). We conducted a factor analysis using items from all the constructs in the study to determine whether the majority of the variance could be accounted for by a general method factor. This analysis revealed that all items loaded cleanly on their hypothesized construct factors. There was no single general methods factor that accounted for majority of the variance. While common method bias cannot be completely ruled out, the absence of a single general method factor suggests that it was not a major issue.
Correlation Matrix and Summary Statistics
Table 3 shows the summary statistics and the correlation matrix. Pertaining to the correlations between the leaders’ relational behaviors and overall leadership effectiveness for the two samples, all correlations were statistically significant at the p ≤ .01 level. The dimension most highly correlated with Overall Leadership Effectiveness (OLE) was Partner (manufacturing, r = .798; social services, r = .772). The weakest association with OLE was Calming Influence (CAL, r = .324 for manufacturing) and Organizational Outreach (OUT, r = .473 for social services). With one exception, Partner, the higher correlations with OLE were associated with the social services sample.

Note. TP = Team Player; CAL = Calming Influence; FOL = Organizational Followership; PAR = Partner; OUT = Organizational Outreach. OLE = Overall Leadership Effectiveness comprised four criterion statements. Reliability alpha for OLE: Manufacturing, .91; Social Services, .91.
Manufacturing (Vertical—Italics); Social Services (Horizontal—Boldface).
N = 170, Manufacturing; N = 764, Social Services.
Results
Differences in Leadership Relational Behaviors Across Work Contexts
Hypothesis 1 stated that respondents in social services settings will report higher levels of leadership relational behaviors compared with those in manufacturing settings. To test this hypothesis, we used multivariate analysis of variance (MANOVA) to determine the significance of differences between the relational behavior dimensions across the two groups. The MANOVA results, shown in Table 4, reveal differences in the leadership relational behaviors across the two different work contexts (Wilks’s Λ = .836, F(5,000) = 36.30, p ≤ .01, Partial η2 = .16). Leaders in the Social Services sample were rated significantly higher than those in the Manufacturing sample on four of the five leadership behavior measures: Team Player (p ≤ .01; d = .34); Calming Influence (p ≤ .01; d = .42); Partner (p ≤ .01; d = .30); and Organizational Outreach (p ≤ .01; d = .82). No difference was found to exist in ratings of leaders in either sector in the Organizational Followership leadership dimension (p = .37; d = .08). The Cohen d ranged from .08 (Organizational Followership) to .82 (Organizational Outreach). With the exception of Organizational Followership, the higher ratings of social services and lower scores in manufacturing tend to be consistent with prior studies where leaders in social services tended to score higher in relational leadership behaviors (Anthoney & Armstrong, 2010), and leaders in manufacturing score lower (Judd, Leschinsky, & Gagnon, 2006). The collective results from the MANOVA analysis offer support for Hypothesis 1.
MANOVA Comparisons of Leader Behavior Ratings by Organizational Setting.

Note. Sample size: Manufacturing, 170; Social Services, 764; Total, 934. Means based on a 5-point Likert-type scale: 1 = Strongly disagree; 5 = Strongly agree. Wilks’s Λ = .836, F(5,000) = 36.30, p ≤ .01, Partial η2 = .16.
Significant differences between the two organizational settings: p ≤ .01, two-tailed.
The Impact of Context on Assessments of Leadership Effectiveness
In Hypothesis 2, we stated that the association between leadership relational behaviors and overall leadership effectiveness will be higher in social services than manufacturing. To test this hypothesis, we used a combination of multigroup regression and chi-square correlation difference analysis. The multigroup regression analysis enabled us to check for the significance of the association between the relational behavior dimensions and (OLE) for each of the two groups. It also allowed us to see how much of the variance in OLE was explained by the relational behavior dimensions across the two groups. We then used chi-square correlation difference analysis to test for the differences in the associations between OLE and the relational behaviors across groups.
Table 5 shows the results of our multigroup regression analysis. The results reveal that in the social services sector, all five measures of relational behaviors predicted OLE. In contrast for manufacturing, only two of the leadership dimensions, TP (Team Player) and PAR (Partner) were statistically significant predictors of OLE. To check for potential problems because of multicollinearity in our regression equations, we examined their Variance Inflation Factors (VIF). The highest VIF level was 2.39 for manufacturing and 2.27 for social services. Since VIF levels of 10 or higher indicate the presence of serious multicollinearity (Cohen, Cohen, West, & Aiken, 2003), the VIF levels of our regression models indicate that multicollinearity was not present.
Regression Results of the Impact of Leader Relational Behaviors on Overall Leadership Effectiveness (OLE) in Manufacturing and Social Services Settings.

To test for the significance of the differences in association between the relational leadership dimensions and OLE by the manufacturing and social services settings, we applied the Fisher’s Z-transformation and chi-square difference test. The calculations are based on the sample size of each work setting and the correlation between the rating of each dimension with OLE (Cohen, 1988). Table 6 shows the association statistics between raters’ scores on each of the dimensions with their ratings on OLE, which are relatively equivalent on three of the five measures—Team Player, Partner, and Organizational Outreach. These results indicate that three of the five leadership measures employed in this study tend to have a similar association with others’ ratings of a leader’s overall effectiveness in the two settings.
Test of Difference Between Manufacturing and Social Services for the Associations Between the Relational Leadership Dimensions and OLE.
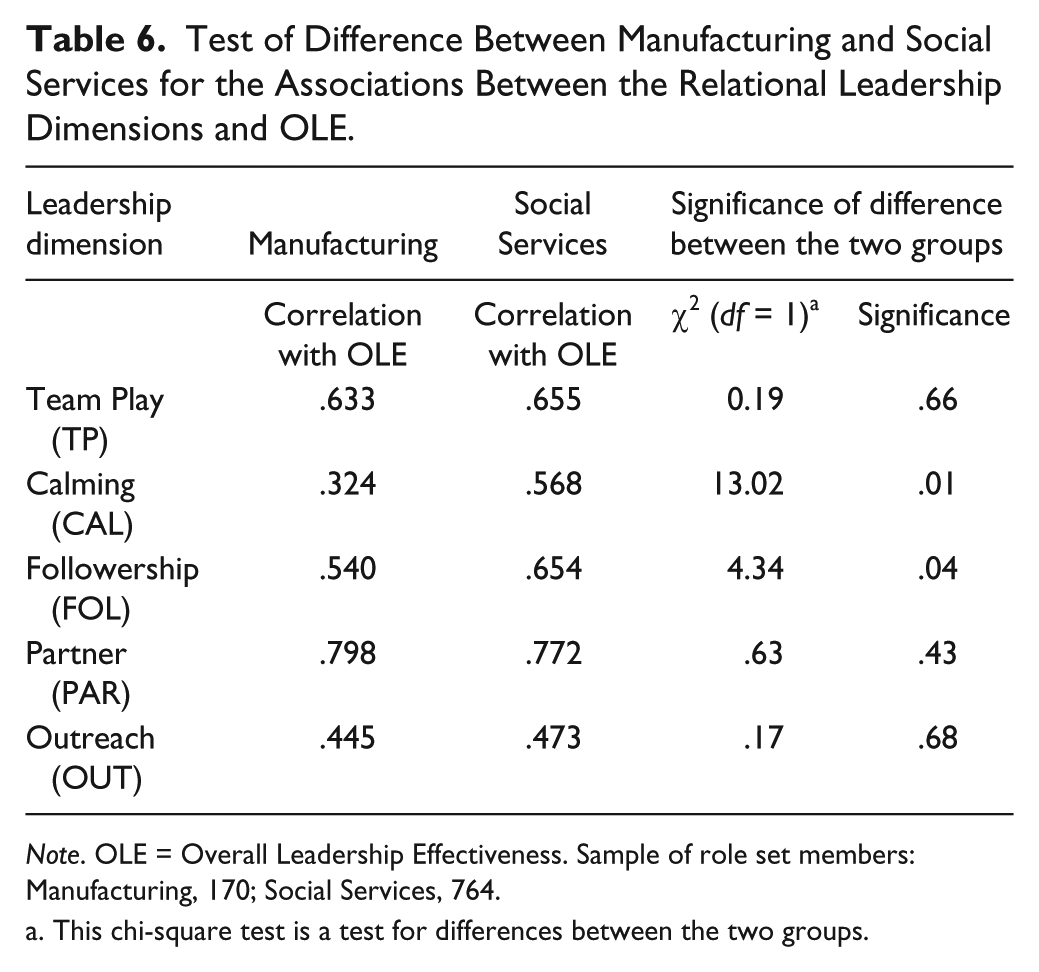
Note. OLE = Overall Leadership Effectiveness. Sample of role set members: Manufacturing, 170; Social Services, 764.
This chi-square test is a test for differences between the two groups.
For two of the measures (Calming Influence, p ≤ .01 and Organizational Followership, p = .04), the differences in association with OLE are statistically significant, with a greater association to OLE in social services than in manufacturing. Calmer individuals who are viewed to be less emotional and more effective listeners, and those who demonstrate Organizational Followership are seen as more effective leaders in social services than in manufacturing. These findings lend partial support for Hypothesis 2.
Discussion
This study examined perceived relational behavior and the overall effectiveness of leaders within the organization through the eyes of three sets of observers in their role sets—top managers, peers, and subordinates. The findings reveal that the five empirically derived independent measures of relational leadership introduced and applied in this study are appropriate for use in both of the settings. Table 3 reveals that in each setting, the measures are associated with the value employees place on their leaders’ overall leadership effectiveness.
When comparing the ratings of leaders in both contexts, we find that leaders in social services are rated higher than those in manufacturing on four of the five relational leader behaviors—Calming Influence, Partner, Team Player, and Organizational Outreach. No difference is found between the two vocational contexts for Organizational Followership.
While Organizational Followership among the manufacturing workers is the highest rated among the five relational behaviors measured, it is the third highest among the same measures in the social services setting. In their study of not-for-profit social services similar to the sample used in this study, Alarista and Arrowsmith (2004, p. 544) state: “Workers’ first loyalties are to their colleagues and service users; senior management tends to be viewed as a somewhat distant and controlling ‘other’ with its own priorities.” For those deeply committed to client advocacy, the demonstration of Organizational Followership by leaders in social services may be conflicted; that is, striving to do more for the client than is organizationally permitted. Such a contradiction in loyalty does not seem to be a factor in manufacturing. While other relational behaviors of leaders are greater in social services than in manufacturing, the lower ratings on Organizational Followership in social services may be unique to the service setting, itself.
Findings also showed all five relational dimensions predict OLE in social services, while two of the five predict OLE in manufacturing. Partner and Team Player are the two dimensions of leadership that predict OLE in both vocational contexts. The other three dimensions (i.e., Organizational Outreach, Organizational Followership and Calming Influence) may only be relevant to leadership effectiveness in social services; more research is needed to unravel these differences.
When testing for differences in association between the five dimensions and OLE in both vocational contexts we find invariance between ratings on Team Player, Partner, and Organizational Outreach and their association with OLE among manufacturing and social services. The association between ratings on Calming Influence and Organizational Followership and OLE is stronger in social services than in manufacturing. This may be because of the personality trait Agreeableness that has been identified to be stronger with Social types than Realistic types (Barrick, Mount, & Gupta, 2003). For Social types, a leader who does not display a Calming Influence (i.e., disquieting, confrontational, or personally agitating) would more likely unnerve Social types with whom they work and would therefore be less likely rated a good leader. Likewise, a leader who is lower in Organizational Followership (i.e., is denigrating, insubordinate, recalcitrant, rebellious or defiant to their leaders and the organization itself) may also unnerve the Social types who seek agreeableness in the work setting more than the Realistic types. In such cases, those in social service settings may rate such a leader lower on OLE than will Realistic types who work in a more impersonal work setting.
Limitations and Future Research
One factor that may have affected the findings is the sample size of leaders in the two settings. The number of leaders studied from the manufacturing setting (N = 16) was fewer than the number of leaders from the social services setting (N = 86). This is a limitation of this study even though the overall number of raters within the manufacturing setting was 170 and 762 in social services. Future research would benefit from larger samples of leaders and the industry settings in which they work.
While there is a preference for Realistic Holland types to enter career fields in manufacturing and Social types to enter career fields of social services, it is rare to find “pure” Realistic types and “pure” Social types in such settings as interests overlap among the six models labeled in the Holland Hexagon. As noted in the literature (Sullivan & Hansen, 2004), an individual may reflect two or more of the subtypes in the hexagon. Future research would benefit by including all types derived from Holland’s Vocational Preference Inventory and by including actual assessments of vocational interests of employees to classify various work contexts more accurately.
This study involves the principle of congruence (Aronoff & Wilson, 1985) that associates the match between the person and the environment with increased performance. Our focus on Holland’s (1997) vocational interests and congruent work settings (Realistic-manufacturing and Social-social services) assumes that where work interests are congruent with vocational setting, performance increases. The work of Nye et al. (2012) provide the foundation for this assumption based on meta-analytic findings that showed a clear connection between Holland interest and congruent work placements such as Realistic-manufacturing and Social-social services examined in this article. In such cases, where congruency exists, Nye et al. (2012) found that employee performance and persistence is stronger—predicting job performance at least as strong as what has been reported from other personality research including the Five Factor Model (Costa & McCrae, 1992). Based on this association between work interest, congruent work placement and job performance improvement, a “next step” in the research would be to analyze the relationships between work interest, congruent vocational placement and leadership characteristics that may form a contextual fit. Thus, it is suggested future research analyze leadership behavior associated with all six interest types in the RIASEC hexagon (Holland, 1997) working in congruent vocational contexts.
This study relied on the measure of OLE based on ratings of the leader at the same time the measures of the relational leadership behaviors were assessed. Although obtaining unobtrusive measures of leadership effectiveness is elusive, having independent, unobtrusive measures of leadership effectiveness from which the five relational leader behaviors could be compared by work context would strengthen this study. Future research should also be continued to further validate the LEA and to examine the relational behavior components embedded within it in multiple work settings.
This exploratory study introduced five empirically derived dimensions that have not been previously reported in leadership literature. Most notable is the measure of Partner, which in both settings was found to be the greatest predictor (β = .535), and most strongly correlated with OLE (.798 and .772). A leader who is viewed as a partner by others is an ally, engaged with others in their role sets in common cause and can be trusted to aid in the accomplishment of the others’ personal and work related goals. A partner is a respected colleague who “has your back.” This same partner characteristic was also reported to be a most critical attribute of a “best” subordinate follower on the leader’s team (Gilbert & Hyde, 1988). As a construct, it merits more investigation in terms of its influence on leadership effectiveness. Last, further research is needed to identify reasons for the differences found in this study related to differences in the associations between the five relational leadership behaviors and OLE. Such is beyond the scope of this research undertaking.
Conclusion
The field of leadership research and the daunting task of finding general models of leadership that can be applied beyond the specific site of the research, itself, remains a formidable task (Avolio & Bass, 1995; Blake & Mouton, 1964; Fiedler, 1984; Shamir & Howell, 1999; Van Wart, 2003). We claim no “epiphany” as a result of our work here. Perhaps the most practical contribution from our work is the development of the 360° LEA instrument that can be used in future research to shed light on relational leadership behavior. It includes five unique measures of leadership; two of which, Partner and Team Player seem especially relevant to the prediction of OLE.
The measurement of leadership in both the academic and practice settings is most often based on self-reports by the individual in the leadership position. Though in practice self-reports are highly expedient, the validity of such an assessment method is questionable. In this study, through the application of the LEA 360° rater assessment, we have attempted to further the call by House (1965; as cited in McShane & Von Glinow, 2007) well over 45 years ago that leadership effectiveness research be expanded to include others with whom the leaders work. Like Hogan and his colleagues, we believe the approach provides a more valid indicator of a leader’s performance within the organization (Hogan, Curphy, & Hogan, 1994).
Different work contexts related to Holland’s vocational choice theory (Holland, 1997) are likely to employ people who have complementary relational needs. Although we find that some leadership behaviors are associated with perceived leadership effectiveness across very different work contexts, yet not all apply equivalently; depending on the situation, not all relate to, or predict overall leadership effectiveness. We view this finding to have important implications for both academics and practitioners. We believe that those who seek to assess leadership performance at work should first identify the specific leadership behaviors within the work context that are most highly associated with overall effectiveness, and interpret the results of such assessments accordingly.
Our findings are consistent with the principles of complementarity (Hetland, Sandal, & Johnsen, 2008) and congruence (Aronoff & Wilson, 1985), that is, those having high social skills, such as agreeableness, friendliness and warmth, may invite the same behavior from their supervisors as well as others with whom they work. The relational leadership dimensions identified in this study were found to predict effective leadership based on the leaders’ assessments by subordinates, peers, and top managers. They are based on a broader multirater approach that can help identify and develop those who have high potential to lead as well as those who are already in positions of leadership. It is our hope that this research undertaking might illuminate another piece of evidence to be used by future researchers and students of leadership behavior. Indeed, “one size of leadership does not fit all” because personal work interests and work context matter.
Footnotes
Acknowledgements
The authors would like to thank our anonymous reviewers whose exceptionally helpful reviews and guidance made this a much stronger piece. We would also like to thank Professor Richard Callahan for his insights and help in data collection in the early stages of this study.
Declaration of Conflicting Interests
The author(s) declared no potential conflicts of interest with respect to the research, authorship, and/or publication of this article.
Funding
The author(s) received no financial support for the research, authorship, and/or publication of this article.
Author Biographies
![]() ) where he is actively engaged in leadership and organizational performance analysis and development. His current research is focused on leadership and organizational performance behavior as measured by research instruments he has developed.
) where he is actively engaged in leadership and organizational performance analysis and development. His current research is focused on leadership and organizational performance behavior as measured by research instruments he has developed.