



Abstract
This article reports the results from two studies (N = 233 and 161) on the role of self-leadership and psychological empowerment in linking empowering leadership to subordinates’ job satisfaction, work effort, and creativity. In addition, the studies investigated self-leadership as a mediator between empowering leadership and psychological empowerment. Results from structural equation modeling indicated that empowering leadership positively affects psychological empowerment both directly and indirectly, through self-leadership. Psychological empowerment influences both job satisfaction and work effort but not creativity, whereas self-leadership influences work effort and creativity but not job satisfaction. The article discusses the implications of these findings.
Keywords
Over the past three decades, empowerment interventions and practices have emerged as important approaches to promoting constructive attitudes and behaviors among employees. Work designs that flow from such approaches are characterized by autonomy, self-leadership, and delegation of responsibility and decision-making authority. This movement represents a fundamental shift of power down the hierarchy to subordinates with high levels of appropriate knowledge and skills, and the terms knowledge work and knowledge workers are expressions that have emerged to characterize this change (e.g., Pyöriä, 2005). Despite attempts to dismiss empowerment as a passing fad (e.g., Abrahamson, 1996), research findings and experiences from practical implementation (e.g., Birdi et al., 2008) have demonstrated promising results that support the relevance of empowerment as it contributes to positive outcomes for both organizations and individuals (Seibert, Silver, & Randolph, 2004). This was recently underscored by Seibert, Wang, and Courtright (2011) in their review of psychological and team empowerment in organizations, in which they concluded that “empowerment is an effective approach for improving employee attitudes and work behaviors in a broad range of contexts (i.e., industries, occupations, and geographic regions)” (p. 995).
In the academic management literature, there has gradually emerged two main approaches to empowerment at work (Spreitzer, 2008). The first of these is a sociostructural perspective that involves interventions and practices by the organization, leaders, and managers that aim to empower employees (e.g., Bennis & Nanus, 1985; Lawler, 1986). The second is a psychological perspective based on employees’ perceptions of their work role, conceptualized as a motivational construct called psychological empowerment manifested in four cognitions: meaning, competence, self-determination, and impact (Spreitzer, 1995; Thomas & Velthouse, 1990). These two approaches are related, since psychological empowerment can be viewed as intrinsic task motivation shaped on an ongoing basis by, among other things, one’s work environment (Thomas & Velthouse, 1990). This relationship was also underscored by Laschinger, Finegan, Shamian, and Wilk (2004), who stated that “psychological empowerment represents a reaction of employees to structural empowerment conditions” (p. 528).
Leaders are proposed to have a central role in the empowerment process of employees (Druskat & Wheeler, 2003; Randolph & Kemery, 2011), but this role is somewhat different compared with those in more traditional work designs based on greater degree of top-down management and control (Ahearne, Mathieu, & Rapp, 2005). To empower is more about giving influence to than having influence over, and a central characteristic that describes empowering leadership (EL) is supporting employees’ autonomy (Amundsen & Martinsen, 2014). In line with this, scholars have generally characterized EL as “behaviors that share power with subordinates” (Vecchio, Justin, & Pearce, 2010, p. 531) as well as “leading others to lead themselves” (Manz & Sims, 2001, p. 4). The latter characteristic is tied to the EL approach of superleadership, which originated in the works of Manz and Sims (1987, 1989, 1991, 2001) and has particularly focused on promoting self-leadership among employees. Self-leadership is defined as “a process through which individuals control their own behavior, influencing and leading themselves through the use of specific sets of behavioral and cognitive strategies” (Neck & Houghton, 2006, p. 270). In their review of self-leadership literature, Stewart, Courtright, and Manz (2011) underscored that self-leadership is not a complete substitute for external leadership, and in line with this they identified EL as a central external force that facilitates the self-leadership of individuals and teams.
The above theory referrals indicate that both subordinates’ psychological empowerment and self-leadership have particular associations with EL. Amundsen and Martinsen (2014, p. 491) discussed this issue in more detail and proposed that, together with EL, psychological empowerment and self-leadership are inseparably tied to the empowering concept itself and represent necessary “be and do” characteristics respectively of empowered employees that mediate the effect of EL on subordinate outcomes. In such a perspective EL may be considered as empowering “actions” taken by the leader that promote empowerment “reaction” in subordinates in form of psychological empowerment and self-leadership. Amundsen and Martinsen (2014) argued that these empowerment reactions of subordinates may be seen as different from ordinary outcome variables (i.e., job satisfaction, commitment, and performance). Psychological empowerment has previously been studied relatively frequently as mediator between EL and subordinate outcome variables (e.g., Randolph & Kemery, 2011; Zhang & Bartol, 2010). However, to the best of our knowledge, self-leadership has previously only once been investigated as a mediating variable in relation to EL (Amundsen & Martinsen, 2014). Therefore, the main aim of the present article is to test a model in which EL is linked to subordinate outcomes (i.e., job satisfaction, work effort, and creativity) through subordinates’ self-leadership and psychological empowerment as intermediate variables. As an included part of our research model, we also examine the mediating role of self-leadership in linking EL to psychological empowerment, which has been proposed theoretically by Houghton and Yoho (2005) but not yet been empirically confirmed.
The identification of mediation processes is of importance in social science and allows us to know how and why relationships exist between predictor and criterion variables (Cheung & Lau, 2008). A mediator is an explanatory variable that may provide substantive interpretations of the underlying mechanisms of this relationship, and Mathieu, DeShon, and Bergh (2008) claimed that developing an understanding of these mechanisms “is what moves organizational research beyond dust-bowl empiricism and toward a true science” (p. 203). To the best of our knowledge, no authors have simultaneously investigated both self-leadership and psychological empowerment as mediators of EL. However, this issue seems important and in line with Bono and McNamara (2011), who stated that “as an area of inquiry becomes more mature, multiple mediators may need to be included” (p. 659).
Additionally, the present article aims to shed empirical light over other relationships that hitherto not have been sufficiently investigated. First, as mentioned above, several scholars have pointed out that the primary aim of EL is to lead others to lead themselves (e.g., Dewettinck & van Ameijde, 2011; Manz & Sims, 2001). However, the relationship between EL and self-leadership has been given sparse empirical attention. We have identified only three studies that have investigated this relationship, that is, Amundsen and Martinsen (2014), Tekleab, Sims, Yun, Tesluk, and Cox (2008), and Yun, Cox, and Sims (2006). Second, the relationship between self-leadership and psychological empowerment, the relationship between self-leadership and creativity, and the relationship between psychological empowerment and work effort has to the best of our knowledge not yet been investigated. Consequently, this article intends to respond to shortcomings in previous research in the empowerment area in general and in the EL area in particular.
Theoretical Background
Empowering Leadership as Antecedent to Job Satisfaction, Work Effort, and Creativity
Previous studies (e.g., Amundsen & Martinsen, 2014; Arnold, Arad, Rhoades, & Drasgow, 2000; Pearce et al., 2003; Tekleab et al., 2008) have demonstrated that EL is a distinct form of leadership compared with other leadership approaches, including aversive, directive, transactional, and transformational leadership, and leader–member exchange, consideration and initiating of structure. Moreover, scholars have identified various behaviors that an empowering leader should practice, at both the team and the dyadic levels (e.g., Arnold et al., 2000; Konczak, Stelly, & Trusty, 2000; Manz & Sims, 1987). This article’s conceptualization of EL was based on Amundsen and Martinsen (2014), who defined EL as “the process of influencing subordinates through power sharing, motivation support, and development support with intent to promote their experience of self-reliance, motivation, and capability to work autonomously within the boundaries of overall organizational goals and strategies” (p. 489). As starting point for their conceptualization, Amundsen and Martinsen (2014) emphasized facilitation and support of autonomy, which in particular has a foundation in research on Hackman and Oldham’s (1980) job characteristic model and in self-determination theory (Deci & Ryan, 1985). Based on their definition, Amundsen and Martinsen (2014) identified eight different behavioral manifestations that underlie the EL construct. These behaviors are delegating, coordinating and information sharing, encouraging initiative, encouraging goal focus, efficacy support, inspiring, modeling, and guidance. As regards modeling, a central assumption with EL is that empowering leaders are assumed to practice self-leadership themselves and serve as observable models for their subordinates (Manz & Sims, 2001).
Given the supportive, motivational, and power sharing aspects in the conceptualization of Amundsen and Martinsen (2014), it is reasonable to expect that EL positively affects job satisfaction, work effort, and creativity. In this respect, Vecchio et al. (2010) noted that leaders who share power with subordinates generally contribute to a higher level of job satisfaction and performance among those subordinates. Likewise, managers who promote subordinates’ autonomous work motivation are likely to contribute to their creativity, productivity, well-being, and personal satisfaction (Stone, Deci, & Ryan, 2009). Previous empirical research has also supported our proposed associations between EL and the three outcome variables. A number of studies have indicated a positive relationship between job satisfaction, defined by Locke (1976, p. 1,300) as “a pleasurable or positive emotional state resulting from the appraisal of one’s job or job experience,” and EL (e.g., Amundsen & Martinsen, 2014; Dewettinck & van Ameijde, 2011; Konczak, Stelly, & Trusty, 2000; Vecchio et al., 2010). Work effort, defined as “the force, energy, or activity by which work is accomplished” (Brown & Peterson, 1994, p. 71), has also been positively associated with EL in one previous study (Amundsen & Martinsen, 2014). In addition, constructs related to work effort, such as behavioral empowerment (Boudrias et al., 2010) and in-role behaviors (Raub & Robert, 2010), have been empirically linked to EL. Zhang and Bartol (2010) found a positive relationship between EL and creativity, defined by DiLiello and Houghton (2006, p. 321) “as the formation of novel, appropriate and useful ideas by individuals or small groups.” Clearly, EL seems associated with important outcome variables in organizations. Still, the mechanisms through which EL works are less clear. With this issue in mind, the next section discusses the perspective of the individual subordinate more thoroughly by considering self-leadership and psychological empowerment in the empowerment process.
Relationships Between Empowering Leadership, Self-Leadership, and Psychological Empowerment
Self-leadership is usually seen as a set of strategies and skills through which individuals influence themselves toward higher levels of performance and effectiveness (Manz, 1986) and has been grouped into three distinct strategies: behavior-focused, natural reward-focused, and constructive thought pattern strategies (Manz & Sims, 2001). Behavior-focused strategies include self-observation, self-goal setting, self-cueing, self-reward, and self-correcting feedback to promote constructive behavior and discourage unconstructive behavior (Manz & Neck, 2004). Natural reward strategies include to discover and focus on the enjoyable and intrinsic motivating aspects of tasks, to seek activities that provide pleasure, and engaging in job- or task-redesign (Houghton & Neck, 2002; Manz, 1986). Finally, constructive thought pattern strategies refer to visualizing successful performance, engaging in positive self-talk, and raising the consciousness about beliefs and assumptions to change dysfunctional thinking (Houghton & Neck, 2002). Martinsen (2009) argued that the current self-leadership concept may be too individualistically oriented when compared with typical demands in contemporary work settings. Accordingly, he added new aspects to the originally defined self-leadership practices that included coordination of efforts, cooperation with others, novelty-seeking thought, and a willingness to acquire the necessary knowledge to master task requirements. This article used this expanded conceptualization of self-leadership.
A primary aim with the superleadership approach of EL is encouragement and development of self-leadership behaviors among subordinates (Manz & Sims, 2001). Despite the fact that this coherence is clearly described in the conceptual literature (e.g., Houghton & Yoho, 2005), there is a lack of empirical evidence. However, exceptions exists in Amundsen and Martinsen (2014) and Tekleab et al. (2008), who found a positive relationship between EL and self-leadership, and in Yun et al. (2006), who found that EL influenced self-leadership for subordinates who had a greater need for autonomy. Given the facilative and supportive emphasis on autonomy regarding Amundsen and Martinsen’s (2014) conceptualization of EL, it is reasonable to expect that EL positively affects employees’ self-leadership. Accordingly, we postulate the following hypothesis:
This article also builds on the work of Conger and Kanungo (1988) and Thomas and Velthouse (1990), where the latter authors defined psychological empowerment as intrinsic task motivation manifested in four cognitions reflecting an individual’s orientation to his or her work role. Spreitzer (1995) took these fundamental works further and created a four-dimensional instrument to measure psychological empowerment, including meaning, competence, self-determination, and impact. These four cognitions have been found to contribute additively to an overall and unitary second-order psychological empowerment construct (Seibert et al., 2011) and fits well relative to the purpose of the present article.
There are several theoretical arguments regarding EL as an important external antecedent of psychological empowerment. First, empowering leaders may enhance the meaningfulness of work by providing subordinates with information about the organization’s overall goals and mission (Conger & Kanungo, 1988). Second, empowering leaders share power and delegate responsibility to give subordinates more autonomy and influence over their work (Amundsen & Martinsen, 2014). Third, empowering leaders may contribute to subordinates’ feelings of competence by providing emotional support, words of encouragement, and positive persuasion, and serving as role models for mastering tasks with success (Bandura, 1986). Finally, empowering leaders promote subordinates’ participation in decision making (Manz & Sims, 1987) and listen to their opinions, ideas, and suggestions (Amundsen & Martinsen, 2014), which may contribute to their experience of having an impact on and making a difference to their work’s results. Recently, a number of empirical findings have emerged that support the positive relationship between EL and psychological empowerment (e.g., Amundsen & Martinsen, 2014; Boudrias, Gaudreau, Savoie, & Morin, 2009; Randolph & Kemery, 2011; Raub & Robert, 2010). Moreover, in their meta-analytic review, Seibert et al. (2011) found that positive leadership, which included EL, was strongly related to psychological empowerment. Therefore, we put forward the following hypothesis:
Existing literature also suggests that self-leadership has the potential to influence psychological empowerment (e.g., Houghton & Yoho, 2005; Lee & Koh, 2001; Manz & Neck, 2004). A primary aim of all self-leadership strategies is the enhancement of self-efficacy beliefs (e.g., Manz, 1986), which corresponds to the perception of competence—one out of the four components of psychological empowerment. This relationship has been empirically supported in previous research, including studies by Konradt, Andreßen, and Ellwart (2009), Neck and Manz (1996), and Prussia, Anderson, and Manz (1998). However, the relationship between self-leadership and the construct of psychological empowerment as operationalized by Spreitzer (1995) has yet to be investigated, and Neck and Houghton (2006) strongly recommended further research on this topic. It is reasonable to argue that, within an autonomy-supportive environment, a self-leading individual would experience meaning, competence, and self-determination, as well as having opportunities to influence strategic, administrative, or operational activities and outcomes in the work unit. Specifically, Manz and Neck (2004) proposed that the behavior-focused strategies of self-observation, self-goal setting, and self-reward can foster feelings of self-determination and competence, while natural reward strategies are specifically intended at increasing feelings of competence, self-control, and purpose. It is also likely that thought self-leadership, through visualizing, positive self-talk, and changing dysfunctional thinking, may positively affect several of the components of psychological empowerment. For example, Neck and Manz (1996) found significantly higher levels of self-efficacy in a group of employees trained in thought self-leadership strategies as compared with a no-training control group. Thus, we postulate the following hypothesis:
Together, the three proposed hypotheses (Hypotheses 1-3) form a mediation model, in which self-leadership operates as an intervening variable between EL and psychological empowerment. A mediating effect of self-leadership in this respect was also proposed by Houghton and Yoho (2005) in their contingency model of leadership and psychological empowerment, but this has not yet been empirically investigated. Given the complexity of social reality, we expect that the mediating effect would be partial rather than full, which implies that EL would manifest direct associations with psychological empowerment but have an indirect effect via self-leadership. This leads to the following hypothesis:
Effects of Psychological Empowerment on Job Satisfaction, Work Effort, and Creativity
Next, we consider the direct relationship between psychological empowerment and our outcome variables. In this regard Seibert et al. (2011) noted that a broad range of attitudinal and behavioral outcomes are associated with psychological empowerment, including job satisfaction, job performance, and innovation at work. Specifically, research have consistently found that psychological empowerment positively affects job satisfaction, as seen in studies by Castro, Perinan, and Bueno (2008), Dewettinck and van Ameijde (2011), Hechanova, Alampay, and Franco (2006), and Seibert et al. (2004). There may be several ways in which empowered employees experience satisfaction, for example, they experience work as meaningful (Hackman & Oldham, 1980), experience themselves as being competent when accomplishing tasks (Hartline & Ferrell, 1996), have a sense of control over their work (Thomas & Tymon, 1994), and are directly involved in outcomes that affect the organization (Ashforth, 1989).
To the best of our knowledge, the relationship between psychological empowerment and work effort has yet to be investigated. However, it is reasonable to expect that effort, initiative, concentration, and persistence will increase when employees feel empowered (Conger & Kanungo, 1988; Thomas & Velthouse, 1990). Moreover, previous studies have shown that constructs associated with work effort have positive associations with psychological empowerment, including task performance (Bartram & Casimir, 2007; Hechanova et al., 2006) and measures of citizenship behaviors (Boudrias et al., 2009; Raub & Robert, 2010).
Zhang and Bartol (2010) found psychological empowerment to be related to creativity through the intervening variables creative process engagement and intrinsic motivation. Moreover, innovation, referred to as the implementation of creative ideas in an organizational context (Amabile, Conti, Coon, Lazenby, & Herron, 1996), has been found to be associated with psychological empowerment (Spreitzer, 1995; Spreitzer, De Janasz, & Quinn, 1999). In addition, psychological empowerment is analogous with intrinsic task motivation (Thomas & Velthouse, 1990), which has been conceptualized as one of the most important antecedents of creativity (Amabile, 1983). Therefore, it is reasonable to expect that creativity may be influenced by psychological empowerment. Taken together, we advance the following hypothesis:
Effects of Self-Leadership on Job Satisfaction, Work Effort, and Creativity
Beyond the fact that we expected the effects of self-leadership on the selected outcome variables to be partially mediated by psychological empowerment, we also expected self-leadership having direct effects. Indeed, two literature reviews have demonstrated positive relationships between self-leadership and various outcome variables (Neck & Houghton, 2006; Stewart et al., 2011). Specifically, Politis (2006) found behavior-focused self-leadership strategies to be positively related to job satisfaction in a manufacturing organization. Furthermore, training in thought strategies has been found to enhance both job satisfaction (Neck & Manz, 1996) and performance (Neck, Neck, Manz, & Godwin, 1999), whereas training in self-management skills significantly improved job performance (Frayne & Geringer, 2000). Likewise, the application of thought strategies was found to be related to performance in studies conducted by Neck and Barnard (1996) and Neck and Manz (1992). We have not encountered empirical studies that include self-leadership and creativity at the individual level. This is also the conclusion of Stewart et al. (2011), who called for future work on this issue. Neither have we been able to find studies that directly examine work efforts as outcome variable of self-leadership. However, self-leadership strategies are conceptually designed to improve an individual’s motivation, behaviors, and thinking (Neck & Manz, 2010), which may have the potential to positively affect both creativity and effort in addition to satisfaction. Accordingly, we put forward the following hypothesis:
Our complete hypothesized model is presented in Figure 1 and was tested in two independent samples. The first sample (Study 1) included all variables in the model except creativity, whereas the second sample (Study 2) included all variables except work effort.

Hypothesized model.
Study 1
Method
Participants and Procedure
The survey was sent by e-mail to 654 employees who worked in four Norwegian Christian mission organizations. The executives of the organizations enclosed a recommendation to employees regarding the importance of responding to the survey. After one reminder, 335 participants (51%) had answered, but only 243 (37%) were complete. Of these, 39% were women. Five percent of the respondents were younger than 25 years, 23% were between 25 and 35 years, 28% between 36 and 45 years, 22% between 46 and 55 years, and 22% older than 55 years. Nineteen percent of the respondents worked in Organization 1, 55% in Organization 2, 21%in Organization 3, and 5% in Organization 4.
Measures
All scales have previously been used in the Norwegian language. Each item was scored on a 7-point Likert-type scale, ranging from 1 = strongly disagree to 7 = strongly agree.
Empowering leadership
EL was measured with an 18-item scale (the Empowering Leadership Scale; ELS) newly developed by Amundsen and Martinsen (2014). The scale reflects the two subdimensions autonomy support (12 items; α = .95; sample item: “My leader gives me authority over issues within my department”) and development support (6 items; α = .94; sample item: “My leader guides me in how I can do my work in the best way”). All scale items are provided in Appendix A. The validity of the ELS was investigated by Amundsen and Martinsen (2014) through three studies representing different work settings. They found the psychometric properties and factor structure to be consistent and stable across all three studies. The ELS demonstrated discriminant validity compared with leader–member exchange and transformational leadership and, additionally, predicted incremental variance in psychological empowerment beyond these two leadership constructs. They also investigated the concurrent validity of the scale and found that it was related to subordinates’ job satisfaction, work effort, job performance, creativity, self-leadership, and psychological empowerment.
Confirmatory factor analysis (CFA) of a one-factor model, in which all items were set to load on one factor (χ2[130] = 936.56, p < .001; RMSEA [root mean square error of approximation] = .16; SRMR [standardized root mean square residual] = .10; CFI [comparative fit index] = .80; see “Data Analysis” for interpretation of fit indexes), gave a significantly poorer model fit than the two-factor model (χ2diff[1] = 532.29, p < .001), which indicated support for the factor validity of the ELS in our sample data. The fit indexes for the two correlated factors model fell within an acceptable range (χ2[129] = 404.27, p < .001; RMSEA = .09; SRMR = .05; CFI = .93). In this analysis five pairs of measurement errors were allowed to correlate and was based on modification indices proposed by AMOS. To prevent the risk of capitalizing on chance (MacCallum, Roznowski, & Necowitz, 1992), both substantive and statistical conditions are recommended to guide inclusion of correlated residuals (Byrne, 1994). Allowing these error terms to correlate appeared to be theoretically meaningful, since the respective pairs of items were originally based on four behavior operationalizations of the ELS (i.e., delegating, encourage initiative, encourage goal focus, and guidance, respectively). Therefore, the error correlations were likely to descend from content overlap, which is not uncommon in social psychological research (Byrne, 1998). Fit indexes for the two-factor model without correlated measurement errors were: χ2(134) = 806.93, p < .001; RMSEA = .14; SRMR = .07; CFI = .84.
To further investigate the factor structure of the ELS we also performed Velicer’s (1976) MAP test, which is especially applicable when there is an average of eight or more variables per component (Zwick & Velicer, 1986). In the MAP test, the relative amounts of systematic and unsystematic variance remaining in a correlation matrix after extractions of components are calculated, and components are retained as long as there is proportionately more systematic variance than unsystematic variance (O’Connor, 2000). The MAP test confirmed that the underlying structure of data consisted of two factors. Examination of the standardized factor loadings revealed that all 18 items had significant loadings (range = .70 to .92, p < .001) on their respective factors. The intercorrelation between the two factors was .67 (p < .001).
Self-leadership
Self-leadership was assessed using a research version of a new measure (Martinsen, 2009). This measure was designed based on the classic definitions of self-leadership and its subconstructs outlined in several articles and books on self-leadership (e.g., Manz, 1986; Neck & Houghton, 2006). A few scales were added by Martinsen (2009) because self-leadership may pertain not only to individual and self-oriented thoughts and behaviors but also to the need to coordinate efforts and cooperate with others. Additionally, Martinsen argued that self-leadership might include a focus on new ideas and a willingness to acquire the necessary knowledge to master task requirements. The full version of the present self-leadership measure includes 13 underlying facets and 52 items. In the original study (Martinsen, 2009), based on a sample of 612 employees from diverse organizations, these facets were well represented by two factors labeled achievement orientation and self-regulation. The self-leadership facets that loaded on achievement orientation were behavioral self-observation, self-goal setting, focus on new ideas, competence development, cooperation, coordination, and positive inner dialogue, whereas the facets that loaded on the self-regulation factor were self-reward, practicing, priority to interesting tasks, priority to facilitative working conditions, cognitive self-observation, and visualization of outcomes. The abbreviated research version, comprising 20 items, was developed to be used in settings where practical limitations would restrict the use of the full version (e.g., Amundsen & Martinsen, 2014). Items for the research version were selected that had maximum loadings on the primary factor and minimum loadings on the secondary factor. This procedure was followed to optimize the representativeness of the two original factors in the research version. The correlation between the corresponding factors in the full version and the abbreviated research version were .96 and .90 for achievement orientation and self-regulation, respectively. Consequently, we based our self-leadership measure on the 20 item research version reflecting achievement orientation (12 items; α = .87; sample item: “I work towards specific goals that I set for myself”) and self-regulation (8 items; α = .83; sample item: “I give priority to tasks that give me a clear experience of self-determination”). All scale items are provided in Appendix B.
CFA of a one-factor model (χ2[168] = 425.26, p < .001; RMSEA = .08; SRMR = .07; CFI = .87) gave significantly poorer model fit than a two-factor model (χ2diff[1] = 40.44, p < .001), indicating support for the factor validity of the self-leadership measure in our sample data. The fit indexes for the two correlated factors model were as a whole considered as acceptable (χ2[162] = 384.82, p < .001; RMSEA = .08; SRMR = .07; CFI = .89), although the CFI fell slightly below .90. In this analysis seven pairs of measurement errors were allowed to correlate and was based on modification indices proposed by AMOS. This issue appeared to be theoretically meaningful because the respective pairs of items were originally based on six behavior operationalizations of the self-leadership measure (i.e., self-reward, priority to interesting tasks, visualization of outcomes, focus on new ideas, competence development, and coordination, respectively), and the error correlations were therefore likely to descend from content overlap (Byrne, 1998). Fit indexes for the two-factor model without correlated measurement errors were (χ2[169] = 708.06, p < .001; RMSEA = .11; SRMR = .08; CFI = .73). To further investigate the factor structure of the self-leadership measure we performed Velicer’s (1976) MAP test, which confirmed that the underlying structure of data consisted of two factors. The standardized factor loadings were all significant on their respective factors (range = .42 to .74, p < .001), and the intercorrelation between the two factors was .77 (p < .001).
Psychological empowerment
Psychological empower-ment was assessed with Spreitzer’s (1995) 12-item scale, which comprises three items each for the four subdimensions: meaning (α = .88; sample item: “The work I do is very important to me”), competence (α = .93; sample item: “I am confident about my ability to do my job”), self-determination (α = .92; sample item: “I have significant autonomy in determining how I do my job”), and impact (α = .94; sample item: “My impact on what happens in my department is large”). All scale items are provided in Appendix C. The fit indexes for the four correlated factors model fell within an acceptable range (χ2[48] = 67.73, p < .05; RMSEA = .04; SRMR = .03; CFI = .99).
Job satisfaction
Job satisfaction was assessed with three items (α = .91) adapted from the Michigan Organizational Assessment Questionnaire (Cammann, Fichman, Jenkins, & Klesh, 1983). The items were the following: (1) “All in all, I am satisfied with my job”; (2) “In general, I don’t like my job” (reverse coded); and (3) “In general, I like working here.”
Work effort
Work effort was assessed with five items (α = .80) based on prior measures (Brockner, Tyler, & Cooper-Schneider, 1992; May, Korczynski, & Frenkel, 2002) and further developed by Kuvaas and Dysvik (2009). The items were the following: (1) “I often expend extra effort in carrying out my job”; (2) “I usually don’t hesitate to put in extra effort when it is needed”; (3) “I intentionally expend a great deal of effort in carrying out my job”; (4) “I try to work as hard as possible”; and (5) “I almost always expend more than an acceptable level of effort.”
Data Analysis
We analyzed our data in several steps. First, the dimensionality of the measures was analyzed, followed by the creation of parcels to increase the ratio of sample size to estimated parameters in the CFAs (Bentler & Chou, 1987). Item parcels also offer some other advantages, including improving the distributional properties of the indicators (West, Finch, & Curran, 1995) and reducing the number of possible covariances among measurement error sources (Rae, 2008). However, item parceling should only be used to investigate relations among the latent constructs (Little, Cunningham, Shahar, & Widaman, 2002), which is clearly the case in our study. To ensure identification, increase the chances of proper solutions and allow the estimation of latent errors (Bollen, 1989), we used three indicators for each latent variable, which is in accordance with Hau and Marsh’s (2004) recommendations for parcel constructions. In accordance with Coffman and MacCallum (2005), we used a homogeneous item parceling approach.
Next, we identified and removed outliers to improve the distribution properties of the variables. Then, following the recommendations of Anderson and Gerbing (1988), a two-step procedure was used to test the hypotheses. The first step concerned testing the appropriateness of the measurement model, whereas the second step was the testing of alternative structural models. The CFAs were performed using maximum likelihood (ML) estimation in AMOS Version 16.0. We used CFA with bootstrapping techniques to cope with the slight multivariate nonnormality of data and assess the stability of sample results (Efron & Tibshirani, 1993). Finally, we assessed the potential impact of common method bias on the path coefficients following a procedure recommended by Widaman (1985) and used by Williams, Cote, and Buckley (1989). Richardson, Simmering, and Sturman (2009) developed the procedure further and called it the unmeasured-latent-method-construct (ULMC) approach.
To gauge model fit, we followed Kline’s (2005) recommendation and reported (1) the chi-square test statistics with corresponding degrees of freedom and level of significance; (2) RMSEA (Steiger & Lind, 1980) with its corresponding 90% confidence interval (CI), for which values <.05 indicates close fit, .05 to .08 fair fit, .08 to .10 mediocre fit, and >.10 poor fit (Browne & Cudeck, 1993); (3) the SRMR (Bentler, 1995), for which values ≤.08 indicate good fit (Hu & Bentler, 1999); and (4) the CFI (Bentler, 1990), for which values >.90 are generally considered to be indicative of acceptable fit (Bentler & Bonett, 1980). In addition, we reported the ratio of chi-square value to degrees of freedom (Marsh, Balla, & McDonald, 1988). Although no clear-cut guideline exists, “ratios in the range of 2 to 1 or 3 to 1 are indicative of an acceptable fit between the hypothetical model and the sample data” (Arbuckle, 2007, p. 589).
Results and Discussion
Preliminary Analysis
Preliminary EFA (exploratory factor analysis) with principal axis extraction and promax rotation, in addition to inspection of scree plot and parallel analysis (O’Connor, 2000), supported the unidimensionality of the set of items that measured each factor—a prerequisite for constructing parcels (Hall, Snell, & Foust, 1999). For EL, we created two parcels for the autonomy support subscale by randomly assigning six items to each, followed by creating one parcel for the development support subscale. For self-leadership, we created two parcels for the achievement orientation subscale by randomly assigning six items to each, followed by the creation of one parcel for the self-regulation subscale. Psychological empowerment was based on its four subdimensions serving as indicators. For work effort, we randomly assigned four of the items to two 2-item parcels, while the remaining item reflected the third parcel. For job satisfaction, we used the three items as indicators. Scores for each indicator were computed as the mean of the scores on the items that constituted each indicator. After the parcel creation process, Mardia’s (1970) normalized kurtosis coefficient was reduced from 38.29 to 22.71. To further improve multivariate normality, the sample was screened for multivariate outliers by calculating Mahalanobis distance scores for all cases in a regression analysis. Using a critical value of χ2 = 39.25, df = 16, p < .001, 10 multivariate outliers were identified and removed, leaving 233 cases for further analysis. The resulting normalized estimate for Mardia’s coefficient was calculated at 13.84.
Test of the Measurement Model
Next, we conducted a series of CFAs to investigate the appropriateness of our measurement model. The model reflected a simple structure in which each indicator had only one path from the latent factor and all the latent factors were permitted to correlate (Millsap, 2002). The fit indexes demonstrated that the five-factor model fitted the data well (χ2[94] = 187.50, p < .001; χ2/df = 2.00; RMSEA = .07, 90% CI [.05, .08]; SRMR = .05; CFI = .96), with all indicators exhibiting significant (p < .001) relationships with their intended latent variable (range = .51 to .98, average .77). Discriminant validity was assessed by constraining the estimated correlation between pairs of latent variables to unity, after which we performed a chi-square difference test (Jöreskog, 1971). The test was carried out for one pair of constructs at a time. “A significantly lower chi square value for the model in which the trait correlation(s) are not constrained to unity would indicate that the traits are not perfectly correlated and that discriminant validity is achieved” (Bagozzi & Phillips, 1982, p. 476). Consistent with this procedure, the chi-square difference test revealed significant values for all comparisons, indicating that the variables under study demonstrated adequate discrimination (results are available by request addressed to the first author). Scores for each variable were then computed as the mean of the scores on the indicators that loaded on the variable. Descriptive statistics, correlations, and reliabilities are presented in Table 1.
Descriptive Statistics, Bivariate Correlations, Latent Variable Correlations, and Reliabilities Among Variables in Study 1.
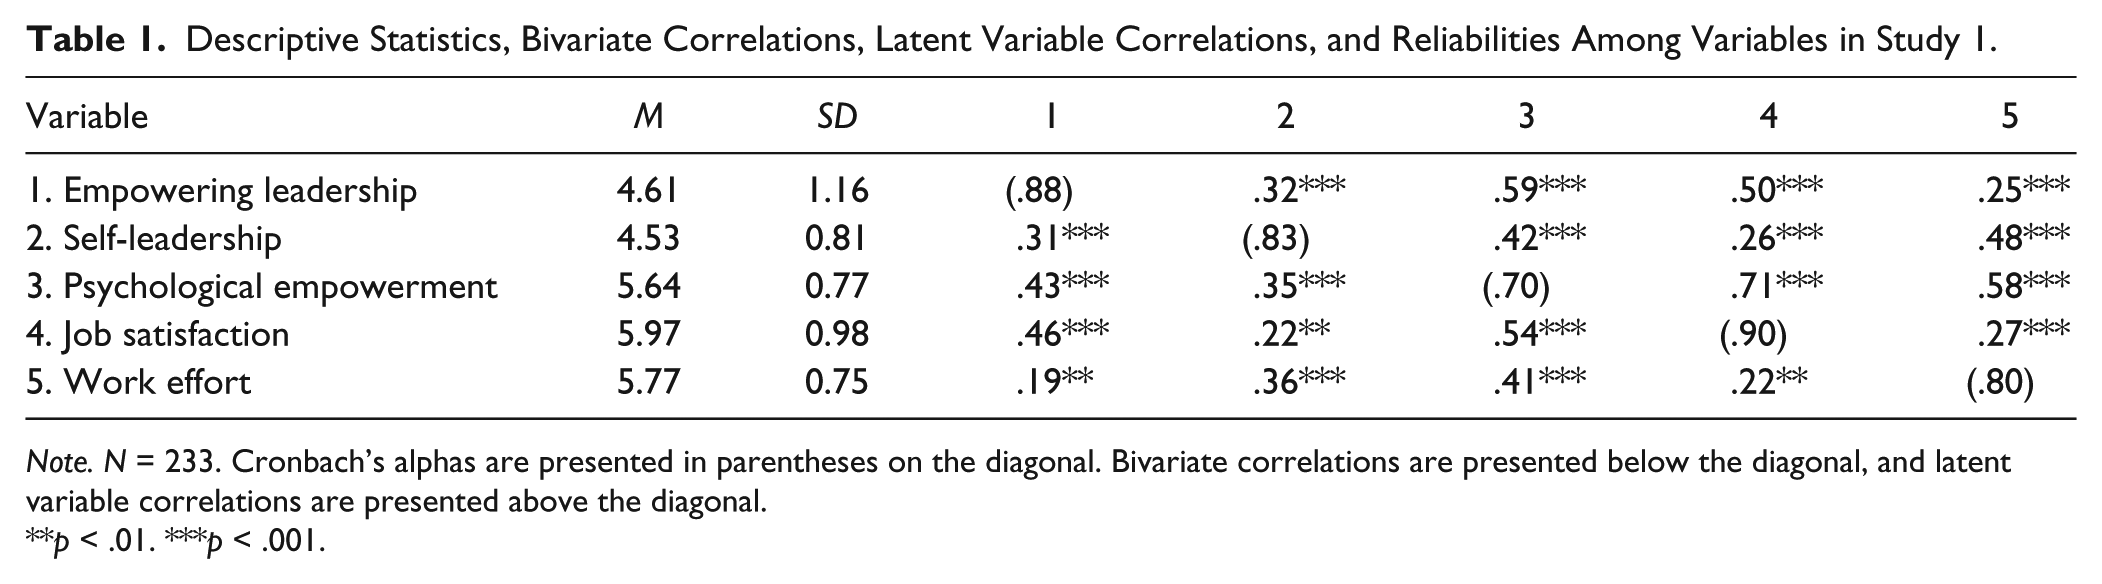
Note. N = 233. Cronbach’s alphas are presented in parentheses on the diagonal. Bivariate correlations are presented below the diagonal, and latent variable correlations are presented above the diagonal.
p < .01. ***p < .001.
Test of the Structural Model
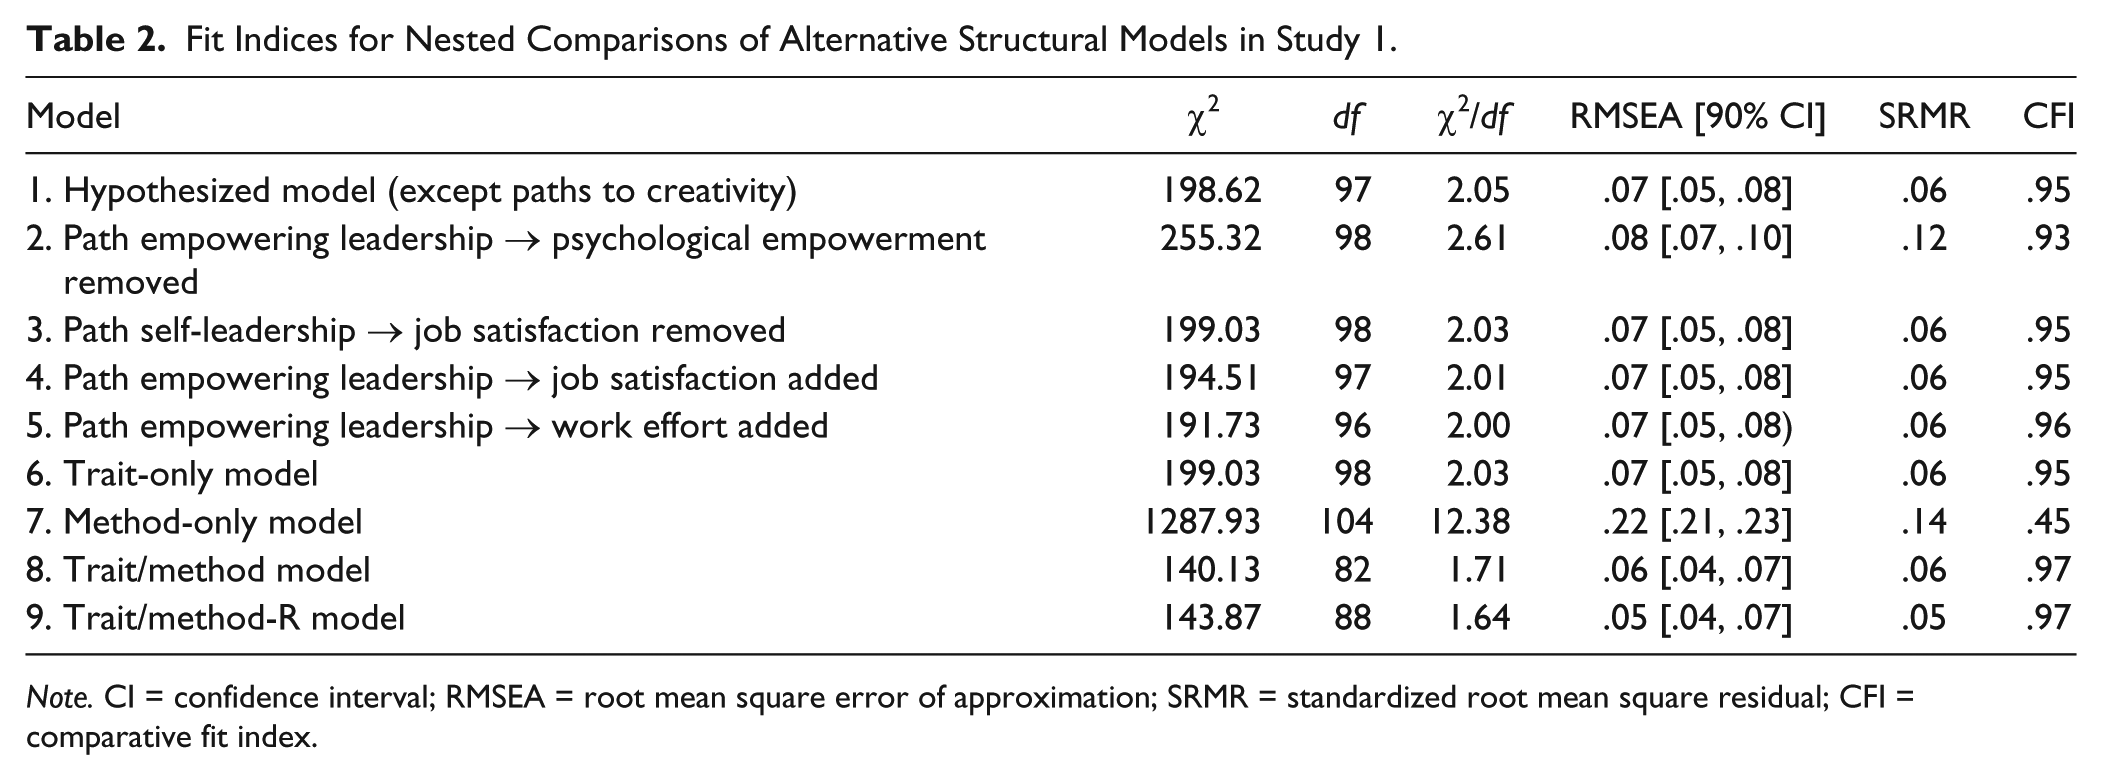
We then tested the fit of the structural model, including all hypothesized paths displayed in Figure 1, except the paths to creativity which be tested in Study 2. Table 2 summarizes all the model fit indexes and indicates that the hypothesized model (Model 1) fitted the data well (χ2[97] = 198.62, p < .001; χ2/df = 2.05; RMSEA = .07, 90% CI [.05, .08]; SRMR = .06; CFI = .95). The path coefficients enable us to draw conclusions regarding the hypothesized relationships. Hypothesis 1 postulated that EL would be positively related to self-leadership, which was supported (γ = .32, p < .001). Hypothesis 2, which stated that EL would be positively related to psychological empowerment, was also supported (γ = .53, p < .001). Likewise, Hypothesis 3, which stated that self-leadership would be positively related to psychological empowerment, was supported (γ = .25, p < .001).
Fit Indices for Nested Comparisons of Alternative Structural Models in Study 1.
Note. CI = confidence interval; RMSEA = root mean square error of approximation; SRMR = standardized root mean square residual; CFI = comparative fit index.
Hypothesis 4 proposed that self-leadership would partially mediate the relationship between EL and psychological empowerment. Because all three paths tested in Hypotheses 1, 2, and 3 were significant, preliminary support for Hypothesis 4 was demonstrated. However, to conclude with more certainty we tested an alternative nested structural model (Model 2) in which the direct path between EL and psychological empowerment was constrained to zero. In accordance with Mathieu and Taylor’s (2006) procedure, this analysis enabled us to assess whether self-leadership was a full or partial mediator. The alternative Model 2 gave a substantially worse fit than the hypothesized Model 1 (χ2diff[1] = 56.70, p < .001) and thus further support for a partially mediated effect was obtained. We subsequently performed a significance test on the indirect effect using the bias-corrected bootstrap procedure extended to structural equating modeling by Cheung and Lau (2008). As recommended by Nevitt and Hancock (2001), the number of bootstrapped samples was set to 2,000. The average indirect linear effect of EL on psychological empowerment (via self-leadership) was estimated to .08, SE = 0.03, p < .01, 95% CI [.02, .16]. The 95% CI did not include zero, suggesting that the indirect effect remained significant in the bootstrapping procedure. The average total linear effect was estimated to .61, SE = 0.06, p < .001, 95% CI [.48, .72], indicating that 13% of the association between EL and psychological empowerment was mediated through self-leadership.
Furthermore, support for Hypotheses 5a and 5b was obtained since psychological empowerment demonstrated significant relationships with (1) job satisfaction (γ = .73, p < .001) and (2) work effort (γ = .37, p < .001). Hypothesis 6b, which postulated that self-leadership would be positively related to work effort, was supported (γ = .32, p < .001). However, the path from self-leadership to job satisfaction was not significant (γ = −.05, ns), and thus, support for Hypothesis 6a was not obtained. Therefore, for the sake of parsimony, we tested a Model 3 where the path between self-leadership and job satisfaction was constrained to zero. Chi-square comparison revealed no significant difference in fit between Models 3 and 1 (χ2diff[1] = .41, ns). Therefore, removing the direct effect of self-leadership on job satisfaction resulted in a more parsimonious model without sacrificing model fit.
Next, we examined two alternative models that could be plausible on the basis of theoretical arguments. It is reasonable to argue that empowering leaders tend to create relationships with their subordinates built on trust, interest, and attention, which may directly affect both job satisfaction and work effort. This type of relationship may not be fully transmitted through the intermediate variables of psychological empowerment and self-leadership. Accordingly, in the first alternative Model 4 we tested a direct effect of EL on job satisfaction by adding a path between these variables. The results indicated that model fit was significantly improved compared with Model 3 (χ2diff[1] = 4.52, p < .05). However, adding a direct path from EL to work effort (Model 5) did not significantly improve model fit compared with Model 4 (χ2diff[1] = 2.78, ns). In other words, the results suggested that EL may directly affect subordinates’ job satisfaction, but not their work effort.
Because our data did not meet the assumption of multivariate normality, we performed bootstrapping to assess the robustness and stability of the original ML estimates (Fan, 2003). The average bootstrap-based estimates were all close to original normal theory-based ML estimates for all path coefficients (deviations in the range = −.009 to .008, average .005 in absolute value). Except for the direct path coefficient from EL to job satisfaction, no estimates of the 95% bias-corrected CIs included zero. Overall, the bootstrap results supported the robustness of the ML estimates and the stability of the estimated parameters across possible alternative subsamples of the present data set. However, the nonsignificant bootstrap finding regarding the direct path from EL to job satisfaction makes this relationship questionable, and we decided to remove the path from the final supported model. In summary, Model 3 was chosen as the most parsimonious and best fit to the data, as is shown in Figure 2.

Supported structural model in Study 1.
Supplementary Analysis
Because all data were self-reported and collected from the same source using a single survey, there was a possibility of common method variance (CMV) that could have biased the path coefficients. Therefore, we used the ULMC approach (Richardson et al., 2009) to compare four structural models, as shown in Table 2. The first model (Model 6) was a trait-only model with no method factor added and was exactly the same as the supported Model 3. In the second, or method-only, model (Model 7), all indicators of the substantive variables were constrained to load on one common method factor. Model 6 fitted the data significantly better than Model 7 (χ2diff[6] = 1088.90, p < .001), indicating that observed variance in the substantive variables were not because of method alone. The third, or trait/method, model (Model 8) was identical to Model 6 except that paths from the method factor to all indicators of the substantive variables were added. Because Model 8 fitted significantly better than Model 6 (χ2diff[16] = 58.90, p < .001), both trait-based and method variance were present in the data. We partitioned the variance accounted for by the substantive variables and the method factor by averaging both the squared trait factor loadings and the squared method factor loadings (Williams et al., 1989). Variation not accounted for by these two sources represented unique variance. The results indicated that the total variation in data could be partitioned into 47% trait variance, 19% method variance, and 34% unique variance. The final, or trait/method-R, model (Model 9) was identical to Model 8 except that structural path coefficients between the substantial variables were constrained to the unstandardized values obtained from the trait-only model. Model 9 did not fit significantly worse than Model 8 (χ2diff[6] = 3.74, ns), suggesting that as a set the path coefficients were not biased although CMV excised in the data. Thus, we concluded that the path coefficients obtained in the trait-only model (similar to the supported Model 3) were representative of the relationships between the substantive variables.
Study 2
The purpose of Study 2 was twofold. It aimed firstly to test Hypotheses 5c and 6c regarding creativity as an outcome variable in the hypothesized model, and second, to test the other hypotheses (apart from Hypotheses 5b and 6b regarding work effort) in a new sample representing another work sector. The latter was considered an important issue, since the sample from Christian mission organizations in Study 1 could present too narrow a focus in terms of the generalizability of the findings.
Method
Participants and Procedure
The data used in Study 2 were collected from 573 employees who worked in the health and care sector in a Norwegian municipality. After two reminders, 173 participants (30%) had answered the survey. Ninety-four percent were females, and 57% were 46 or older. Five percent had elementary schooling, 46% had been to high school, 31% had 3 years or less at college/university and 18% had 4 or more years at college/university. Fifty-three percent had tenure of 11 years or more in the organization. Given the relatively low response rate, we checked the potential for nonresponse bias by comparing the characteristics and responses of early and late respondents. Armstrong and Overton (1977) argued that late respondents are representative of nonrespondents. The results of t tests for gender, age, education, and tenure of the respondents, as well as the composite scores of EL, self-leadership, psychological empowerment, job satisfaction, and creativity revealed no significant differences between late and early respondents.
Measures
The measures used in Study 2 were the same as in the first study except that creativity replaced work effort. We also added a marker variable (i.e., general community interest) to assess the effects of CMV in the data set (Williams, Edwards, & Vandenberg, 2003). We selected the marker variable on the basis that it was theoretically unrelated to the substantive variables and was expected to have a correlation with at least one of those variables close to zero (Lindell & Whitney, 2001). Moreover, we expected that it could capture some of the sources of bias (i.e., transient mood states, social desirability, common scale anchors) described by Podsakoff, MacKenzie, Lee, and Podsakoff (2003). All items were rated on a 7-point Likert-type scale (1 = never to 7 = always).
Empowering leadership
Alpha for the autonomy support subscale was .97 and for the development support subscale .95. We also investigated the factor validity of the ELS and support was obtained since a one-factor model (χ2[130] = 502.67, p < .001; RMSEA = .13; SRMR = .05; CFI = .90) gave a significantly poorer model fit than a two-factor model (χ2diff[1] = 99.29, p < .001). The fit indexes for the two correlated factors model were as a whole considered as acceptable (χ2[129] = 403.38, p < .001; RMSEA = .11; SRMR = .04; CFI = .93), although the RMSEA was slightly more than .10. In these analyses five pairs of measurement errors were allowed to correlate and was based on modification indices proposed by AMOS. This issue appeared to be theoretically meaningful because the respective pairs of items were originally based on five behavior operationalizations of the ELS (i.e., delegating, encourage goal focus, efficacy support, modeling, and guidance, respectively), and the error correlations were therefore likely to descend from content overlap (Byrne, 1998). Fit indexes for the two-factor model without correlated measurement errors were: χ2(134) = 509.72, p < .001; RMSEA = .13; SRMR = .05; CFI = .90. To further investigate the factor structure of the ELS we performed Velicer’s (1976) MAP test, which confirmed that the underlying structure of data consisted of two factors. The inter-correlation between the two factors was .90 (p < .001). Examination of the standardized factor loadings revealed that all items had significant loadings on their respective latent factor (range = .78 to .90, p < .001).
Self-leadership
Alpha for the achievement orientation subscale was .90 and for the self-regulation subscale .88. Factor validity for the self-leadership scale was supported since CFA of a one-factor model (χ2[163] = 461.45, p < .001; RMSEA = .10; SRMR = .08; CFI = .84) gave a significantly poorer model fit than a two-factor model (χ2diff[1] = 27.56, p < .001). The fit indexes for the two correlated factors model were as a whole considered as acceptable (χ2[162] = 433.89, p < .001; RMSEA = .09; SRMR = .07; CFI = .87), although the CFI fell slightly below .90. In these analyses seven pairs of measurement errors were allowed to correlate and was based on modification indices proposed by AMOS. This issue appeared to be theoretically meaningful because the respective pairs of items were originally based on seven behavior operationalizations of the self-leadership measure (i.e., self-reward, priority to interesting tasks, priority to facilitative working conditions, visualization of outcomes, focus on new ideas, competence development, and coordination, respectively), and the error correlations were therefore likely to descend from content overlap (Byrne, 1998). Fit indexes for the two-factor model without correlated measurement errors were: χ2(169) = 604.20, p < .001; RMSEA = .12; SRMR = .09; CFI = .77. To further investigate the factor structure of the self-leadership measure we performed Velicer’s (1976) MAP test, which confirmed that the underlying structure of data consisted of two factors. The intercorrelation between the two factors was .85 (p < .001). Examination of the standardized factor loadings revealed that all items had significant loadings on their respective latent factor (range = .53 to .78, p < .001).
Psychological empowerment
Alpha for the four subscales were as follows: meaning (α = .83), competence (α = .90), self-determination (α = .86), and impact (α = .88). The fit indexes for the four correlated factors model fell within an acceptable range (χ2[48] = 108.72, p < .001; RMSEA = .08; SRMR = .05; CFI = .96).
Job satisfaction
Alpha for the three-item scale was .83.
Creativity
Creativity was assessed by 13 items (α = .95) obtained from George and Zhou (2001). Example items are “I am a good source of creative ideas” and “I come up with creative solutions to problems.” All scale items are provided in Appendix D.
General community interest
The marker variable was assessed by three items (α = .94) developed by Amundsen and Martinsen (2014). The items were (1) “I am a community-interested person”; (2) “I follow up on what is happening in the community”; and (3) “I keep updated on what is happening in the community.”
Data Analysis
Data was analyzed in the same steps, and model fit was evaluated with the same fit indices as in Study 1. However, the potential impact of CMV on path coefficients was assessed using the marker variable approach proposed by Williams et al. (2003), which was later investigated further by Richardson et al. (2009). The marker approach is believed to have advantages relative to the ULMC approach used in Study 1. Both approaches assume that all variance shared between the method and substantive variables is CMV, and the method factor may therefore potentially remove both CMV and true variance between two variables (Meier & O’Toole, 2013). However, with the ULMC approach, there is no mechanism that verifies whether the shared variance represents true variance or CMV between the substantive variables (Richardson et al., 2009). In contrast, with the marker approach the shared variance is a function of a measured variable, which means that it may represent CMV if the assumption that the marker variable is theoretically unrelated to the substantive variables and simultaneously tap into sources of CMV holds (Williams, Hartman, & Cavazotte, 2010).
Results and Discussion
Preliminary EFA with principal axis extraction and promax rotation, in addition to inspection of scree plot and parallel analysis (O’Connor, 2000), supported the unidimensionality of the set of items that measured each factor. Parcel creation for EL, self-leadership, psychological empowerment, and job satisfaction were performed in the same way as in Study 1. In addition, we created three parcels for creativity by randomly assigning four items to two parcels and five items to one. For general community interest, we used the three items as indicators. Scores for each indicator were computed as the mean of the scores on the items that constituted each indicator. After the parcel creation, Mardia’s normalized kurtosis coefficient was reduced from 33.74 to 19.63. To improve the multivariate normality further, the sample was screened for multivariate outliers by calculating Mahalanobis distance scores for all cases. Using a critical value of χ2 = 43.82, df = 19, p < .001, 12 multivariate outliers were identified and removed, leaving 161 cases for further analysis. The resulting normalized estimate for Mardia’s coefficient was calculated to 14.86.
Test of the Measurement Model
The appropriateness of our measurement model, including the marker variable, was assessed using CFA. The six-factor measurement model fitted the data well (χ2[137] = 261.95, p < .001; χ2/df = 1.91; RMSEA = .08, 90% CI [06, .09]; SRMR = .06; CFI = .96), with all indicators exhibiting significant relationships (p < .001) with their intended latent variable (range = .59 to .99, average .85). Discriminant validity was assessed by constraining the estimated correlations between pairs of latent variables to unity and then performing a chi-square difference test (Jöreskog, 1971). The test was carried out for one pair of constructs at a time. The chi-square difference test revealed significant values for all comparisons, indicating that the variables of interest demonstrated adequate discrimination (results are available by request addressed to the first author). Scores for each variable were then computed as the mean of the scores on the indicators which loaded on the variable. Descriptive statistics, correlations, and reliabilities are shown in Table 3.
Descriptive Statistics, Bivariate Correlations, Latent Variable Correlations and Reliabilities Among Variables in Study 2.
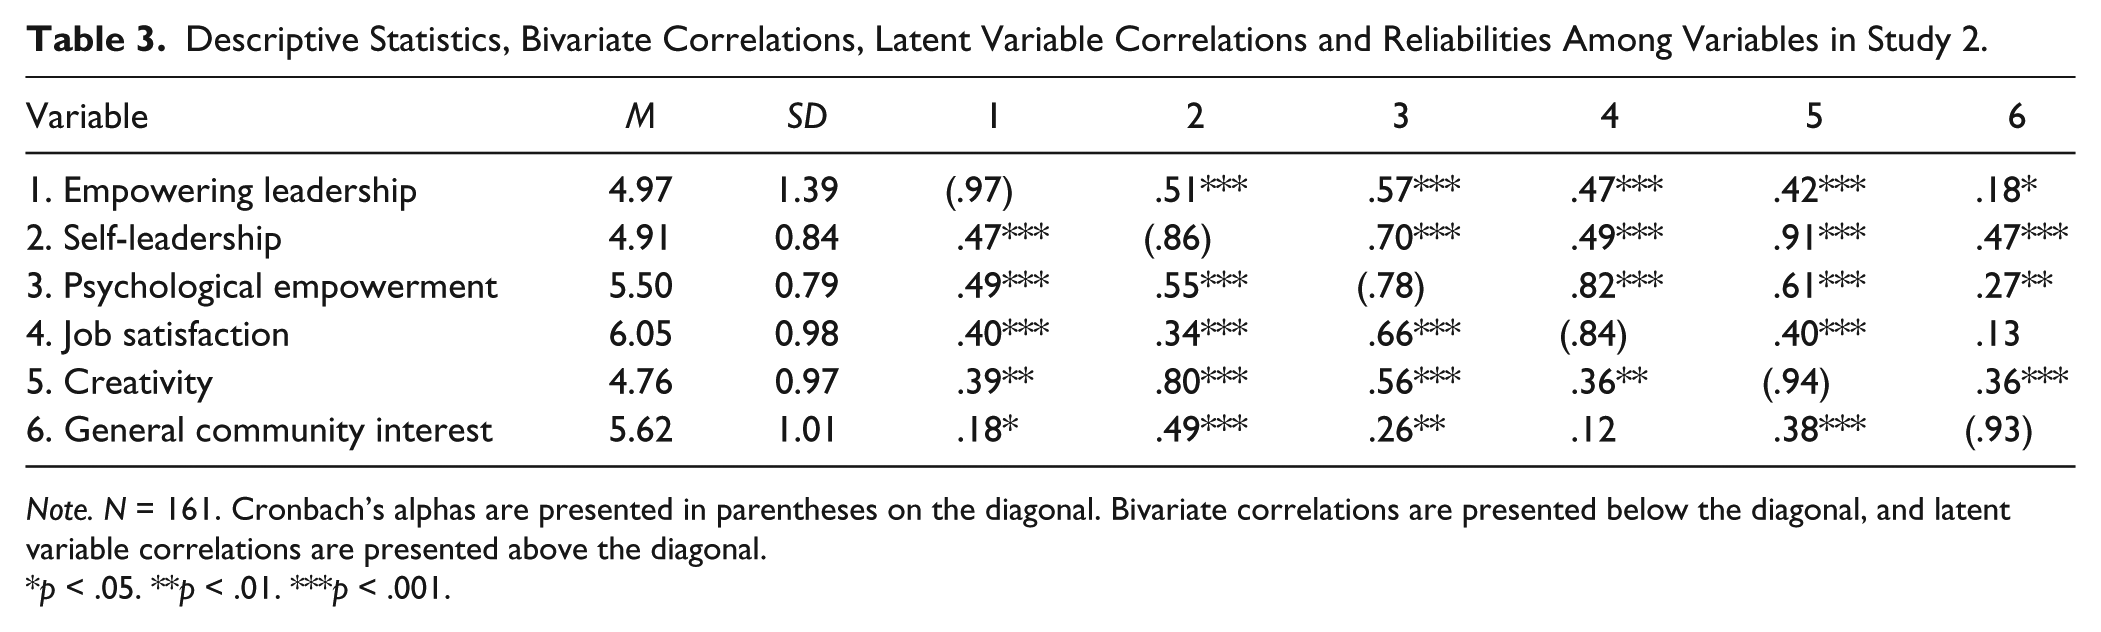
Note. N = 161. Cronbach’s alphas are presented in parentheses on the diagonal. Bivariate correlations are presented below the diagonal, and latent variable correlations are presented above the diagonal.
p < .05. **p < .01. ***p < .001.
Test of the Structural Model
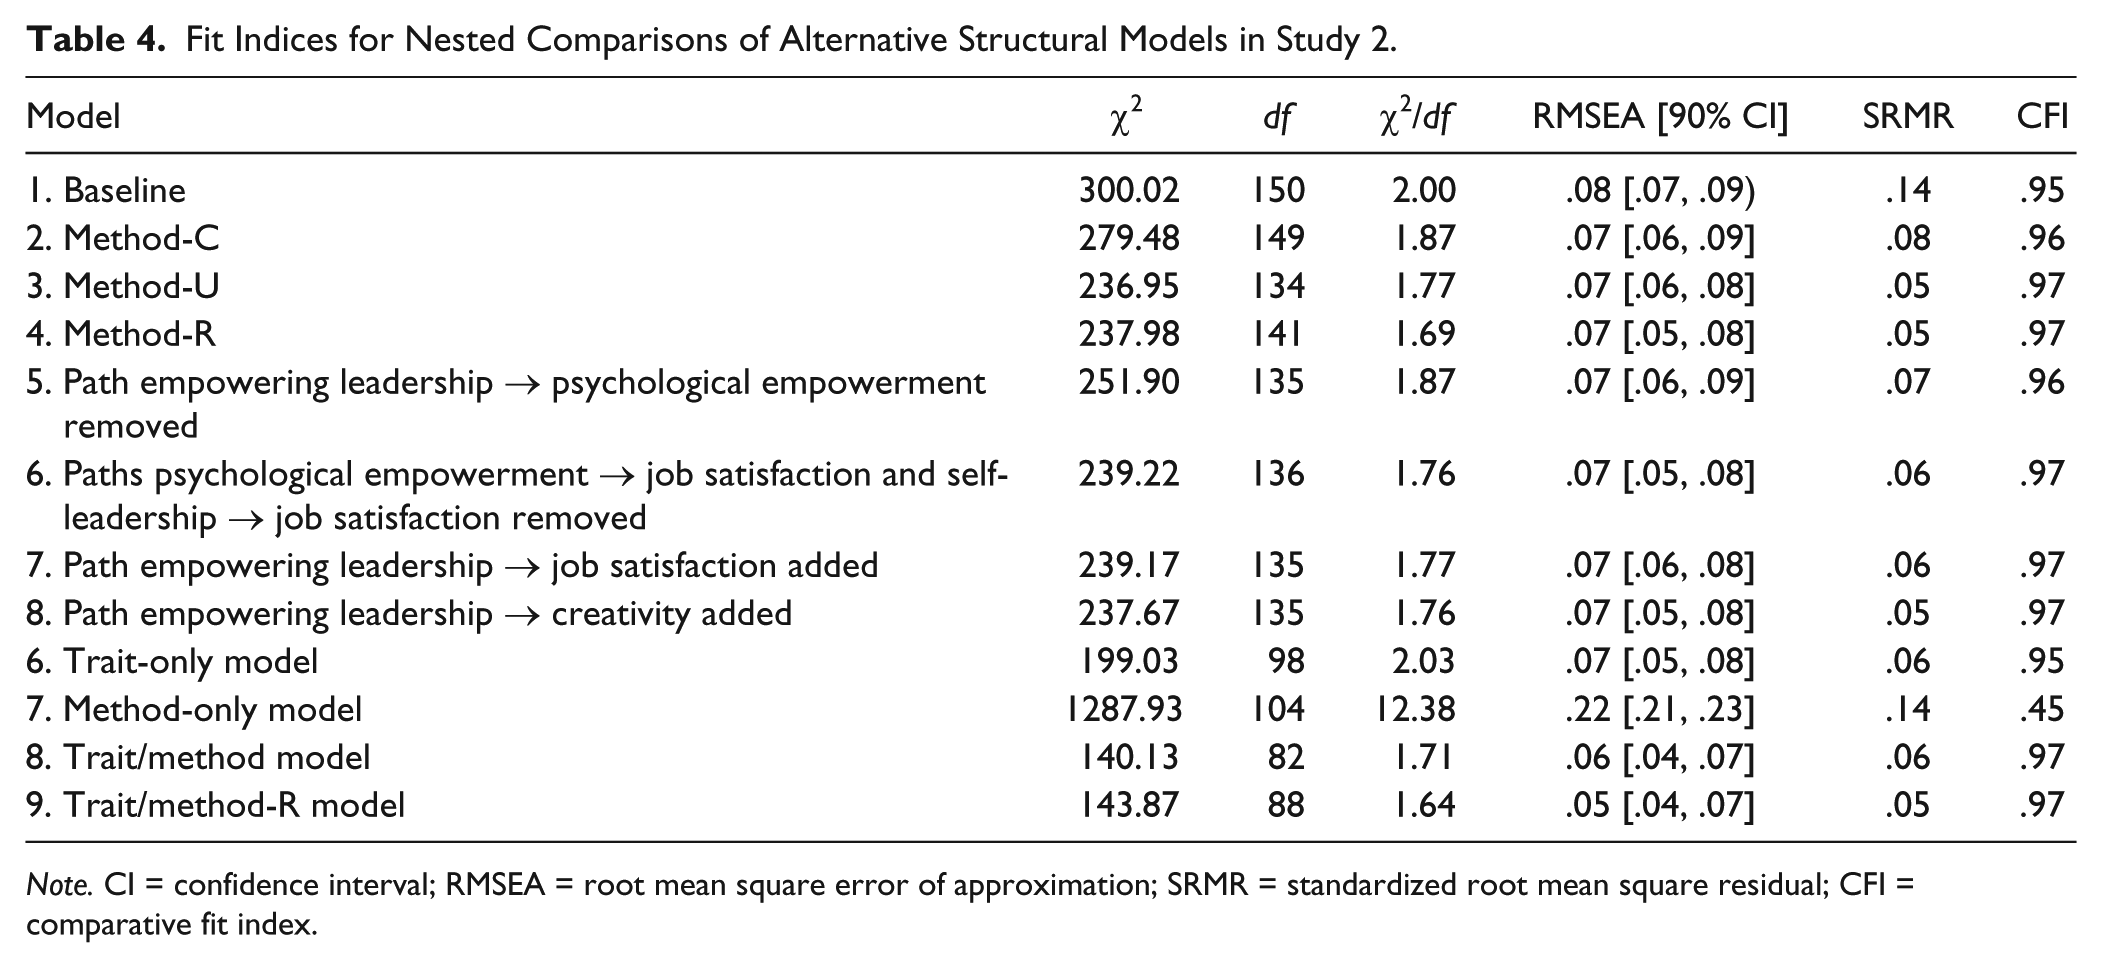
We next performed a series of structural models to examine the hypothesized paths displayed in Figure 1, except the paths to work effort. Method effects were represented by loadings from the marker variable to the indicators of the substantive variables. We followed the marker procedure outlined by Richardson et al. (2009) and conducted four models to assess the potential impact of CMV on the structural paths, as shown in Table 4. To establish a clear meaning of the marker variable in our analysis of the models, we fixed factor loadings and error variances for the marker variable indicators in accordance with the unstandardized values obtained from the six-factor measurement model (Williams et al., 2010). For the first, or baseline, model, the loadings between the substantive variables and the marker variable were constrained to zero. The second, or method-C, model was identical to the baseline model apart from the addition of factor loadings from the marker variable to all indicators of the substantive variables. These loadings were constrained to be equal. Since the method-C fitted significantly better than the baseline model (χ2diff[1] = 20.54, p < .001), CMV was shown to be present in data. The third, or method-U, model was similar to the method-C model except that the loadings from the marker variable to the indicators of the substantive variables were freely estimated. The method-U model fitted significantly better than the method-C model (χ2diff[15] = 42.53, p < .001), suggesting that the method effect did not affect the substantive variables in equivalent ways. The variance in the substantive indicators was decomposed into trait and method variance by averaging the squared trait factor loadings and marker factor loadings, respectively (Williams et al., 1989). Variation not accounted for by these two sources was unique variance. The results indicated that 65% was trait variance, 7% method variance, and 28% unique variance. The final, or method-R, model was identical to the method-U model except that structural path coefficients between the substantial variables were constrained to have unstandardized values obtained from the baseline model. The method-R model did not fit significantly worse than the method-U model (χ2diff[7] = 1.03, ns), which indicated that as a set the path coefficients were not biased although CMV was present. The method-U model (Model 4), which controlled for CMV, provided best fit to data (χ2[134] = 236.95, p < .001; χ2/df = 1.77; RMSEA = .07, 90% CI [.06, .08]; SRMR = .05; CFI = .97) and was therefore used to test the hypotheses.
Fit Indices for Nested Comparisons of Alternative Structural Models in Study 2.
Note. CI = confidence interval; RMSEA = root mean square error of approximation; SRMR = standardized root mean square residual; CFI = comparative fit index.
Hypothesis 1, which says that EL is positively related to self-leadership, was supported (γ = .48, p < .001). Hypothesis 2 stated that EL is positively related to psychological empowerment and was also supported (γ = .30, p < .001). Likewise, Hypothesis 3 was supported in that self-leadership was positively related to psychological empowerment (γ = .53, p < .001). Because all three paths represented by Hypotheses 1, 2, and 3 were significant, preliminary support for Hypothesis 4 that self-leadership would partially mediate the relationship between EL and psychological empowerment was demonstrated. To conclude with more certainty, we tested an alternative model (Model 5) in which the direct path between EL and psychological empowerment was constrained to zero. The alternative model gave a substantially worse fit than the hypothesized Model 4 (χ2diff[1] = 14.95, p < .001), and thus further support of Hypothesis 4 was obtained (Table 4). Next, a significance test of the indirect effect was performed (Cheung & Lau, 2008). The average indirect linear effect of EL on psychological empowerment was estimated to .26, SE = 0.06, p < .01, 95% CI [.16, .37]. The 95% CI did not include zero, indicating a significant indirect effect. The average total linear effect was estimated to .56, SE = 0.08, p < .001, 95% CI [.41, .67], indicating that 46% of the association between EL and psychological empowerment was mediated through self-leadership.
Furthermore, support for Hypothesis 5a was obtained since psychological empowerment demonstrated a significant relationship to job satisfaction (γ = .90, p < .001). However, the path from psychological empowerment to creativity was not significant (γ = −.08, ns), and Hypothesis 5c was rejected. Hypothesis 6a, which stated that self-leadership was positively related to job satisfaction, was also rejected (γ = −.12, ns). Hypothesis 6c was supported in that self-leadership was significantly related to creativity (γ = .95, p < .001). For the sake of parsimony we tested Model 6, in which the paths from psychological empowerment to creativity and from self-leadership to job satisfaction were constrained to zero. Chi-square comparison revealed no significant difference in fit between Models 6 and 4 (χ2diff[2] = 2.27, ns), and therefore Model 6 was supported (Table 4).
Next, as in Study 1, we examined two alternative models that could be theoretically relevant in that empowering leaders are supposed to create trustworthy and supportive relationships among subordinates, which may directly affect job satisfaction and creativity. Accordingly, we tested an alternative Model 7 by adding a path between EL and job satisfaction. The results indicated that this modification did not improve model fit significantly compared with Model 6 (χ2diff[1] = .05, ns). Likewise, adding a direct path from EL to creativity (Model 8) also did not improve model fit significantly compared with Model 6 (χ2diff[1] = 1.55, ns). In summary, we concluded that Model 6 was the most parsimonious and best fitted model to data, as is shown in Figure 3. Finally, we performed bootstrapping to assess the robustness and stability of the original ML estimates (Fan, 2003). The average bootstrap-based estimates were all close to original normal theory-based ML estimates for all path coefficients (deviations in the range = −.004 to .006, average .004 in absolute value), and no estimates of the 95% bias-corrected CIs included zero.
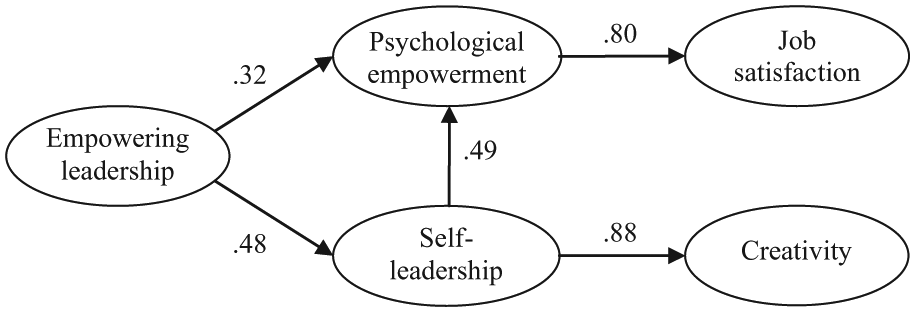
Supported structural model in Study 2.
General Discussion
This article’s primary aim was to investigate the role of subordinates’ self-leadership and psychological empowerment as intermediate mechanisms in linking EL to subordinates’ job satisfaction, work effort, and creativity. As an included part of this model, the article also aimed to investigate the mediating role of self-leadership in linking EL to psychological empowerment. Several of these relationships have previously been theoretically suggested but have not been given sufficient empirical attention, while others have not been investigated at all. Our results provided support for seven out of nine of our hypotheses based on the theoretical discussion. In the following, we discuss in more detail the most central findings and their theoretical and practical implications.
We found that self-leadership operated as a partial mediating variable between EL and psychological empowerment. This relationships was proposed by Houghton and Yoho (2005) in their contingency model of leadership and psychological empowerment, but have not, until now, been given empirical research attention. This mediation model also implied that empowering leader behavior was positively related to employee self-leadership. This relationship has been emphasized in the theory (e.g., Manz & Sims, 2001) but has only been investigated in a limited number of studies (e.g., Tekleab et al., 2008; Yun et al., 2006). Thus, our finding gave additional empirical support to one of the main purpose of EL, namely to lead others to lead themselves (Manz & Sims, 2001). The obtained support of a mediation model also implied a positive and significant relationship between self-leadership and psychological empowerment, which has been suggested by scholars (e.g., Neck & Houghton, 2006). We consider this finding to be of particular importance, since previous studies have only tested the association between self-leadership and self-efficacy (e.g., Prussia et al., 1998), while self-efficacy is only one out of four components in the construct of psychological empowerment. Thus, the finding that self-leadership positively affects the latent construct of psychological empowerment may add value to the idea of self-leadership as an empowerment-oriented concept in contemporary work settings characterized by autonomy and delegation of responsibility and decision-making authority. Clearly, self-leadership may include central self-empowering aspects that seem to have positive influence on employees’ perceptions of psychological empowerment in their work roles. We recommend further research on this issue. Summarized, our findings indicated that EL affects psychological empowerment directly and also indirectly through self-leadership.
We also found that self-leadership operated as an intervening variable between EL and creativity. Our results indicated that self-leadership fully mediated this relationship and, moreover, eliminated the effects of psychological empowerment on creativity. This latter issue is interesting, since intrinsic task motivation, a central aspect of psychological empowerment (Thomas & Velthouse, 1990), has consistently been conceptualized as a predictor of creativity at the individual level (Amabile, 1983). However, Neck and Houghton (2006) noted that “self-leadership strategies have also been significantly informed by the concept of intrinsic motivation” (p. 281). Moreover, previous work has theorized self-leadership as an antecedent of creativity (DiLiello & Houghton, 2006; Neck & Houghton, 2006). To the best of our knowledge, this article is the first to find empirical support for such a relationship, and moreover, support that self-leadership may be a mechanism through which EL transmits its effect on creativity. Beyond this, it is also worth mentioning the finding of a direct positive relationship between self-leadership and work effort, which implies that the influence of self-leadership on work effort is just partly mediated by psychological empowerment. A possible explanation for this is that self-leadership includes behavioral strategies that directly affect effort, such as self-observation and self-goal setting.
We could not find any direct effect of EL on work effort. This is different from Raub and Robert (2010) who found that the effect of EL on in-role and affiliative extra-role behaviors in a sample of front-line hotel employees was direct and fully mediated through psychological empowerment on challenging extra-role behaviors. The conceptualization of work effort in our Study 1 can be considered to include the full spectrum from in-role behaviors to challenging extra-role behaviors. Therefore, based on Raub and Robert’s findings, it is reasonable to assume that psychological empowerment could have played a partial mediating role. However, the difference between Raub and Robert’s findings and our own may have been caused by unequal organizational contexts. Employees in mission organizations, which was the organizational affiliation of the participants in Study 1, may have based their efforts in most tasks on perceptions of being psychologically empowered. For example, it is reasonable to argue that meaning plays a notable role in encouraging various kinds of effort in Christian mission work. Another possible explanation is that, in our study, self-leadership had a parallel mediating role and also transmitted effects from EL to work effort. However, omitting self-leadership in the model and adding a direct path from EL to work effort did not change the status of psychological empowerment as a fully mediating variable. Therefore, the nature of the work sector may play a moderator role and should be taken into account when investigating the role of psychological empowerment in the empowerment processes of employees. We did not have the opportunity to test this possibility because work effort was only included as an outcome variable in Study 1. Therefore, we recommend that researchers investigate this issue further.
Finally, it is worth mentioning that psychological empowerment seemed to play a major role in influencing employees’ job satisfaction. This gave further support to a finding that has been consistent across a number of previous studies (e.g., Seibert et al., 2004). Furthermore, results from both our studies suggest that EL and self-leadership transfer all of their effect on job satisfaction through psychological empowerment.
Practical Implications
Some implications for practice emerge from the findings in this article. First, the nature of work has changed substantially in the last decades by becoming more complex and cognitively demanding (Humphrey, Nahrgang, & Morgeson, 2007), and highly skilled and educated knowledge workers have become the core of a rapidly growing segment of the workforce (Parker, Wall, & Cordery, 2001). From a strategic human management perspective, it is important to match leadership style with employment modes to attain an efficient use of human capital. The logic of EL, with its emphasis on employees’ autonomy, motivation, and development, appears to be well suited a knowledge-based employment approach to human capital (Liu, Lepak, Takeuchi, & Sims, 2003). This issue is indicated by this article’s findings in samples represented by the voluntary and the municipality sector, respectively.
Second, knowledge workers are to a greater extent driven by intrinsic than by external motivation factors (Frost, Osterloh, & Weibel, 2010). In this regard, psychological empowerment is a central construct since it involves the feeling of intrinsic task motivation stemming from the perception of meaning, competence, self-determination, and impact in the work role (Spreitzer, 1995). The present article has demonstrated that EL and self-leadership have the potential to influence psychological empowerment and, additionally, that self-leadership and psychological empowerment mediate the effect of EL on favorable employee outcomes such as job satisfaction, work effort, and creativity. Accordingly, knowledge-based organizations should emphasize empowerment by including EL and self-leadership as prioritized management practices in their human resource strategy.
Third, although EL has the potential to promote self-leadership among subordinates, it is also relevant to develop their self-leadership skills through training activities (Frayne & Geringer, 2000; Latham & Frayne, 1989; Neck & Manz, 1996). This is just as important for the leaders themselves, because a central characteristic of empowering leaders is to serve as observable models for their subordinates by systematically displaying effective self-leadership skills (Manz & Sims, 1991, 2001). As Manz and Sims (2001) stated, “If leaders want to lead somebody, they must first lead themselves” (p. 7). Thus, organizations that focus on employee autonomy should ensure that both leaders and subordinates receive the necessary training as required to master self-leadership. Summarized, the findings in this article add further evidence to the idea that EL may be a suitable leadership approach for knowledge organizations that emphasize empowerment and self-leadership to achieve a creative and satisfied workforce with beneficial effort.
Limitations and Suggestions for Future Research
This study has certain limitations. First, all data were collected from a single source using a single survey, which may have inflated estimates of correlations between the variables due to CMV. However, using the ULMC approach in Study 1 and the marker variable approach in Study 2 (Richardson et al., 2009), we did not find any biasing effects of CMV on the paths between the study variables. Moreover, CMV accounted for a minor part of the total variance in the data, estimated at 19% in Study 1 and 17% in Study 2. This was lower than in the study by Williams et al. (1989), which found CMV to be 27% on average across 11 data sets. Despite the fact that we did not find any biasing effects of CMV on path coefficients, the incompleteness of the applied statistical techniques means that we could not conclude with certainty on this issue (Richardson et al., 2009). Therefore, future research should consider collecting measures of independent and dependent variables as well as mediating variables from different sources and/or different points in time.
Second, because data were gathered at one point in time, the correlations between the variables did not represent causal relationships. To assess causal directions, the findings should be replicated in future experimental and/or longitudinal research. Third, work effort and creativity were not investigated in both studies, and the replicability of the findings regarding these variables should be tested in future studies. Fourth and finally, due to the relatively low response rate of the two studies (i.e., 37% and 31%, respectively) the generalizability of the findings may have been reduced. However, as regards Study 1, nonresponse bias was ruled out by comparing characteristics and responses of early and late respondents (Armstrong & Overton, 1977). For Study 2, we were not able to do this analysis because we lacked data for response time. Another issue that may have affected the generalizability of the findings is the predominance of female respondents (i.e., 94%) in Study 2.
Conclusion
This article has given attention to several underinvestigated issues in the empowerment area. Our findings across two studies indicate that EL transmits its effect on subordinates’ job satisfaction, work effort, and creativity through subordinates’ self-leadership and/or psychological empowerment. In other words, these two intermediate variables seem to play a substantial role in empowering leaders’ efforts to create favorable outcomes among their subordinates. This fact may have implications for many organizations in the design of empowerment programs which are intended to enhance employees’ motivation, autonomy, and creativity in their work roles.
Footnotes
Appendix A
Appendix B
Appendix C
Appendix D
Declaration of Conflicting Interests
The author(s) declared no potential conflicts of interest with respect to the research, authorship, and/or publication of this article.
Funding
The author(s) received no financial support for the research, authorship, and/or publication of this article.